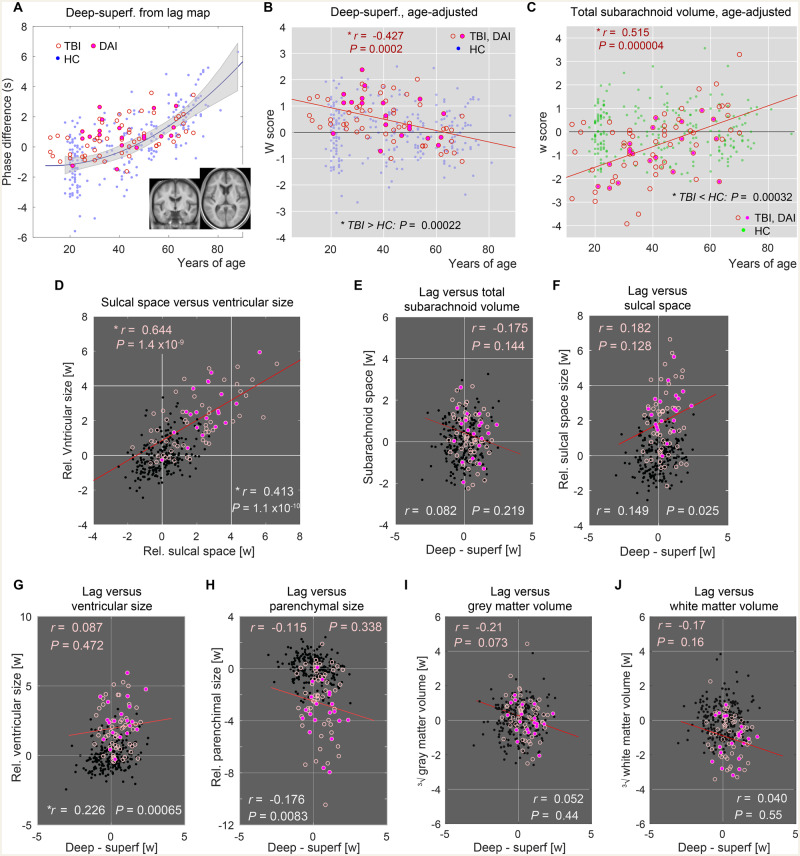
Figure 3.
Age-adjusted values of the venous timing shift and volumetry. Healthy controls (HC) = dots; TBI = open circles; DAI = filled circles. (A) Perfusion timing difference between the deep and superficial clusters from the patients with TBI (n = 71). The healthy control values presented in Fig. 2C are underlaid for comparison (n = 225). Inset: Average anatomical image of the TBI group after spatial normalization presented in the same slice locations used in Fig. 1A, indicating sufficient alignment for the region of interest analysis. Note that the volumetric measurements were made in the native subject space. (B) Values after age adjustment revealed a significant effect of injury relative to the healthy controls at baseline (P = 0.00022, n = 71, one-sample t-test). In addition, there was an effect of age at injury indicated by the regression line (red, n = 71). Pearson’s correlation coefficient is shown at the top with the corresponding P-value. (C) Interaction between disease effect and age was also found in the absolute total subarachnoid volume, suggesting another overlapping mechanism between disease and normal ageing. (D) Relationship between sulcal space and ventricular size. Correlation coefficients for the TBI and healthy controls groups are displayed (top and bottom, respectively) with a corresponding regression line for the TBI group. (E–J) Relationship with venous timing shift is shown for absolute total subarachnoid volume (E), sulcal space size (F), ventricular size (G), parenchymal size (H), absolute grey matter (I) and white matter (J) volumes after age adjustment. Correlation coefficients for the TBI (top, pink) and healthy controls (bottom, white) groups are displayed. *Statistically significant at P < 0.001, uncorrected for multiple comparisons.

