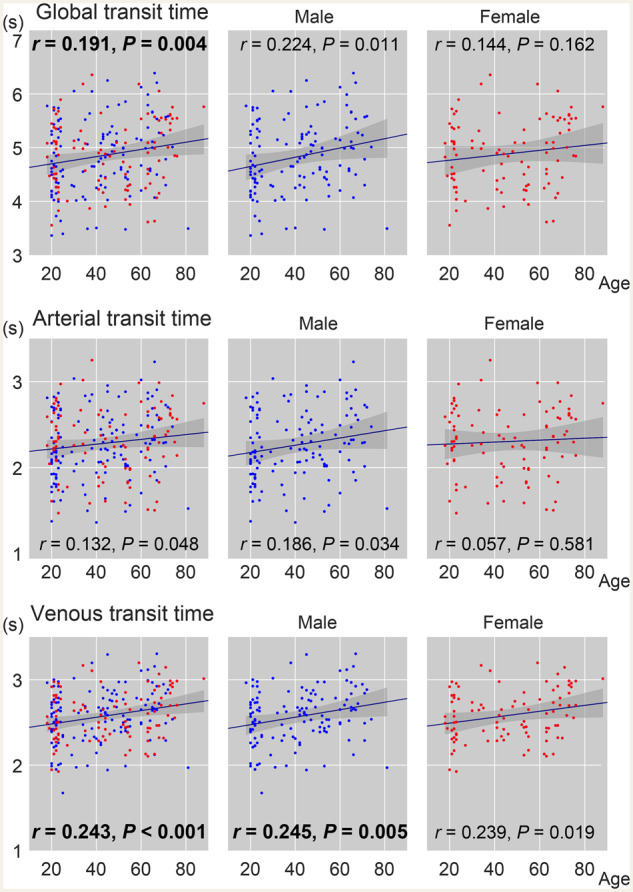
Figure 4.

Age-related changes in transit time measures from the lag map. The global transit time is the sum of its arterial and venous components. Red dots indicate females (n = 88/225 in total). Pearson’s correlation coefficient with age is inserted with the corresponding P-value (P < 0.01 in bold).
