

Yu et al. show that microvesicles derived from oligodendrocytes – and carrying α-synuclein – are less abundant in the peripheral blood of multiple system atrophy patients and a mouse model compared to controls. Alpha-synuclein interferes with exosome release from oligodendrocytes by disrupting SNARE complex assembly.
Keywords: multiple system atrophy, exosome, oligodendrocyte-derived enriched microvesicle, SNARE complex, α-synuclein
Abstract
Transportation of key proteins via extracellular vesicles has been recently implicated in various neurodegenerative disorders, including Parkinson’s disease, as a new mechanism of disease spreading and a new source of biomarkers. Extracellular vesicles likely to be derived from the brain can be isolated from peripheral blood and have been reported to contain higher levels of α-synuclein (α-syn) in Parkinson’s disease patients. However, very little is known about extracellular vesicles in multiple system atrophy, a disease that, like Parkinson’s disease, involves pathological α-syn aggregation, though the process is centred around oligodendrocytes in multiple system atrophy. In this study, a novel immunocapture technology was developed to isolate blood CNPase-positive, oligodendrocyte-derived enriched microvesicles (OEMVs), followed by fluorescent nanoparticle tracking analysis and assessment of α-syn levels contained within the OEMVs. The results demonstrated that the concentrations of OEMVs were significantly lower in multiple system atrophy patients, compared to Parkinson’s disease patients and healthy control subjects. It is also noted that the population of OEMVs involved was mainly in the size range closer to that of exosomes, and that the average α-syn concentrations (per vesicle) contained in these OEMVs were not significantly different among the three groups. The phenomenon of reduced OEMVs was again observed in a transgenic mouse model of multiple system atrophy and in primary oligodendrocyte cultures, and the mechanism involved was likely related, at least in part, to an α-syn-mediated interference in the interaction between syntaxin 4 and VAMP2, leading to the dysfunction of the SNARE complex. These results suggest that reduced OEMVs could be an important mechanism related to pathological α-syn aggregation in oligodendrocytes, and the OEMVs found in peripheral blood could be further explored for their potential as multiple system atrophy biomarkers.
Introduction
Multiple system atrophy (MSA), a rare neurodegenerative disorder, is characterized by a variable combination of autonomic dysfunction, parkinsonism, cerebellar impairment, and pyramidal tract signs (Gilman et al., 2008; Fanciulli and Wenning, 2015). According to the predominance of parkinsonism or cerebellar impairment, patients are further divided into MSA-P and MSA-C subtypes. The pathological hallmark of both MSA subtypes is the presence of misfolded α-synuclein (α-syn)-bearing proteinaceous inclusions in oligodendrocytes (glial cytoplasmic inclusions, or GCIs) (Jellinger and Lantos, 2010; Jellinger, 2012; Fanciulli and Wenning, 2015). This is in contrast to Parkinson’s disease or dementia with Lewy bodies, where α-syn-positive inclusions, known as Lewy bodies, are mainly found in neurons (Spillantini et al., 1997). As clinical symptoms among various parkinsonian disorders overlap, diagnosis and differential diagnosis of MSA can be challenging, especially at early disease stages, and can only be confirmed upon autopsy. No reliable biomarker currently exists to aid in clinical assessments, and current biofluid markers (e.g. α-syn in CSF) do not distinguish between MSA (MSA-P in particular) and other synucleinopathies such as Parkinson’s disease (Laurens et al., 2015).
While a complete understanding of the underlying pathogenesis of MSA remains elusive, α-syn aggregation appears to be at least a contributing factor (Fanciulli and Wenning, 2015). More recently, studies have highlighted extracellular vesicles, including exosomes and ectosomes (also called microvesicles), as potential participants in the pathology of neurodegenerative diseases, including Parkinson’s disease (Budnik et al., 2016; Soria et al., 2017). Exosomes are 30–150 nm membranous vesicles of endocytic origin, created from intraluminal vesicles (ILVs) that form within multivesicular bodies (MVBs), and that are released from the cell through fusion of the MVB at the plasma membrane (Yanez-Mo et al., 2015). In contrast, ectosomes bud from the plasma membrane directly and are heterogeneous in size (∼100 to ∼1000 nm), the range of which may overlap with that of exosomes. Both types of extracellular vesicles are capable of transporting cargo (e.g. proteins and RNAs) between cells as a form of intercellular communication, and are believed to be involved in the clearance and cell-to-cell spreading of toxic molecules such as α-syn species (Yanez-Mo et al., 2015; Budnik et al., 2016; Soria et al., 2017).
Mounting evidence suggests that α-syn-containing extracellular vesicles arising from multiple cell types can be found in blood and CSF of patients (Howitt and Hill, 2016), can induce α-syn aggregation in vitro and in vivo including the propagation of α-syn pathology in normal mice (Grey et al., 2015; Stuendl et al., 2016; Ngolab et al., 2017), and are toxic to neuronal cells in vitro (Emmanouilidou et al., 2010). Furthermore, extracellular vesicle-contained α-syn can be transferred from the brain to peripheral blood, as a possible mechanism for clearance of toxic forms of the protein out of the brain (Shi et al., 2014). To investigate extracellular vesicle-contained α-syn in Parkinson’s disease, a strategy for identifying extracellular vesicles arising from the brain was adopted, specifically, extracellular vesicles more likely to be brain-derived were captured by targeting L1CAM, a relatively CNS-enriched neuronal extracellular vesicle surface marker, revealing higher levels of α-syn in these extracellular vesicles enriched for neuronal origin in patients with Parkinson’s disease compared to healthy control subjects (Shi et al., 2014).
These findings suggest the possibility of similar alterations in extracellular vesicles and their α-syn cargo in MSA. However, because the primary cell type implicated in MSA is not neurons, as in Parkinson’s disease, but oligodendrocytes, it could be expected that examining oligodendrocyte-derived enriched extracellular vesicles or microvesicles (OEMVs) might be more effective in identifying MSA-related changes. Therefore, in the current study, we developed an assay to focus on OEMVs in blood and tested whether OEMVs and their α-syn cargo are altered in MSA patients using nanoparticle tracking analysis (NTA) and immunoassays. We also used a transgenic mouse MSA model and performed in vitro experiments with cultured oligodendrocyte cells to probe the mechanisms involved in the altered OEMV-mediated transportation and its implications in MSA pathogenesis.
Materials and methods
Human subjects and sample collection
Plasma samples from a total of 97 subjects (34 patients with Parkinson’s disease, 32 patients with MSA, and 31 age- and sex-matched healthy controls) were contributed from the University of Pisa (Italy) and the Seoul National University Hospital (Korea) for blood (plasma) OEMV assessments in this study. The diagnosis of ‘possible’ and ‘probable’ MSA was based on current consensus criteria (Gilman et al., 2008). The contributing centres received ethics approval before study enrolment and all participants gave written informed consent before blood sampling. Similar sample collection protocols and quality control procedures were followed at both centres, in particular, use of polypropylene collection and storage tubes, rapid separation into single use aliquots, and freezing of blood (plasma) samples, to minimize potential site variability. A summary of demographics and clinical data of the participants is provided in Table 1.
Table 1.
Summary of the demographics and clinical data of participants
| Group | Healthy controls | MSA | Parkinson’s disease |
|---|---|---|---|
| n | 31 | 32 | 34 |
| Age, mean ± SD | 64.3 ± 7.5 | 63.0 ± 6.9 | 63.6 ± 8.0 |
| Sex, male: female | 15:16 | 19:13 | 20:14 |
| Race, Caucasian: Asian | 11:20 | 12:20 | 14:20 |
| MSA diagnosis, possible: probable | – | 5:27 | – |
| MSA subtype, MSA-P: MSA-C | – | 18:14 | – |
| UPDRS motor score, mean ± SD | – | – | 21.4 ± 10.6 |
| UMSARS motor examination score, mean ± SD | – | 24.13 ± 10.58a | – |
| Disease duration, years, mean ± SD | – | 4.0 ± 2.8 | 4.0 ± 2.2 |
Thirty MSA patients had UMSARS motor scores; two missing values were excluded from the association analysis.
MSA = multiple system atrophy; SD = standard deviation; UMSARS = Unified Multiple System Atrophy Rating Scale; UPDRS = Unified Parkinson’s Disease Rating Scale.
Post-mortem fresh frozen brain tissue of three MSA patients (mean age at death = 70 ± 3 years; frozen post-mortem interval: 24 ± 7.7 h) was used for the purification of GCIs (see below). Samples were obtained from the French brain bank (GIE-Neuro CEB, BB-0033-00011). All patients or their legal representatives gave informed consent for collection, storage and use of post-mortem brain tissue for research purposes.
Animals
Homozygous PLP-SYN transgenic mice, which overexpress human wild-type α-syn in oligodendrocytes under the control of the proteolipid protein (PLP) promoter, were described previously (Kahle et al., 2002). Age-dependent loss of neurons and motor dysfunction (e.g. progressive nigral and striatal degeneration) has been observed in these mice (Fernagut et al., 2014; Refolo et al., 2018). Prnp-SNCA*A53T transgenic mice, which overexpress human A53T mutant α-syn under the control of the prion protein (PRNP) promoter (Giasson et al., 2002), were purchased from Nanjing BioMedical Research Institute at Nanjing University (Nanjing, China) and used as a Parkinson’s disease model in this study. For fluorescent NTA in this study: PLP-SYN (n = 11), Prnp-SNCA*A53T (n = 4), and wild-type littermates (n = 7) aged 6 weeks; PLP-SYN (n = 6), Prnp-SNCA*A53T (n = 6), and wild-type littermates (n = 10) aged 32 weeks; and PLP-SYN (n = 15), Prnp-SNCA*A53T (n = 4), and wild-type littermates (n = 9) aged 12 months were included (see a summary in Supplementary Table 1). All experiments involving mice were performed in accordance with French guidelines (87-848, Ministère de l’Agriculture et de la Forêt) and the European Community Council Directive (2010/63/EU) or Chinese Laboratory animal Guideline for ethical review of animal welfare (2018/09) for the care of laboratory animals. The PLP-SYN and wild-type mice were raised at the University of Bordeaux and the Prnp-SNCA*A53T and control mice were raised at Beijing University Health Science Center in a specific pathogen-free standard environment with a 12-h light-dark cycle with free access to food and water until sacrificing for plasma collection. Mouse blood was collected after sedation with pentobarbital (100 mg/kg i.p.) through intracardiac puncture in syringes primed with 15% EDTA. The collected blood was transferred into polypropylene tubes and centrifuged at 1500g for 15 min at 4°C. The plasma fraction was then transferred to new polypropylene tubes and stored at −80°C until further use.
Purification of glial cytoplasmic inclusions
Human putamen was dissected from fresh frozen post-mortem striatal samples. Tissue was homogenized and separated using a sucrose step gradient. Fractions were analysed for the presence of α-syn aggregates to determine the GCI-containing fractions. The amount of α-syn in the GCI fractions was quantified using a human α-syn ELISA kit (#KHB0061; Invitrogen/Life Technologies). More details can be found in the Supplementary material.
Primary oligodendrocyte cultures
Timed pregnant C57/BL6J and PLP-SYN female mice were sacrificed by cervical dissociation. Brain cortices were harvested from E18 mouse embryos and dissociated enzymatically and mechanically using the Neural Tissue Dissociation Kit, C Tubes, and Octo Dissociator with heaters (all from Miltenyi Biotech) to yield a homogenous cell suspension. Oligodendrocyte primary cultures were then isolated from this suspension based on the expression of CD140a using a magnetic CD140a (PDGFRα) MicroBead separation kit, MACS columns and MACS separators (all from Miltenyi Biotech) following the manufacturer’s protocol.
The cells were then plated at 5000 per well in 96-well BioCoatTM plates (poly-l-lysine, Corning) in a neuronal medium (Neuronal Macs medium, Miltenyi Biotech) containing 0.5% penicillin-streptomycin, 0.5 mM alanyl-glutamine and 2% NeuroBrew® supplement (Miltenyi Biotech), FGF 20 ng/ml, and PDGF-A 20 ng/ml (Miltenyi Biotech). Medium was changed every 3 days by one-third. From day in vitro (DIV) 7, medium was progressively replaced by Brainphys (Stemcell Technologies) supplemented with Neurobrew 2%, FGF 20 ng/ml, PDGF-A 20 ng/ml. At DIV 26, PDGF-A was omitted and replaced with CTNF 10 ng/ml (Miltenyi Biotech) for differentiation. At DIV 29, medium was collected from the wells, and every eight replicate wells were combined to generate a pooled sample and frozen at −80°C until analysis. The oligodendrocytes were fixed with 4% PFA, washed in phosphate-buffered saline (PBS), and imaged by enhanced phase contrast using an IncuCyte® S3 HCS platform (Essen-Sartorius). The confluence of each well was determined by automated segmentation suing the IncuCyte® S3 image segmentation and quantification routine after acquisition of nine 20× fields per single well. There was no significant difference in average cell confluence between cultures from PLP-SYN and wild-type mice.
In vitro cell cultures
Human oligodendrocytic MO3.13 cells were purchased from Cedarlane Labs, and cultured in high glucose formulation of Dulbecco’s modified Eagle medium (DMEM) supplemented with 10% foetal bovine serum (FBS). The human α-syn overexpressing plasmid pCMV-tag-2b-SNCA was constructed by inserting the α-syn sequence (SNCA) into the pCMV-tag-2b vector (Addgene) using a Hieff Clone® Plus One Step Cloning Kit (10911ES25, Yeasen) according to the manufacturer’s protocol. MO3.13 cells were transfected with pCMV-tag-2b-SNCA using the jetPRIMETM reagent (Polyplus-transfection SA) (empty vector was used as a negative control), or treated with 50–200 nM synthetic oligomeric α-syn (prepared based on a previously published protocol; Zhang et al., 2005) or 15–50 nM purified, α-syn aggregate-enriched human GCIs (PBS was used as a negative control) for 24 h before changing to FBS-free media. After 6 h incubation, medium was collected and centrifuged at 2000g for 15 min to remove cell debris. Supernatant (1 ml) of the medium was collected and labelled with 1 μl antibody-Qdot conjugates for 1 h for OEMV measurements using NTA (described below).
Immunofluorescence staining
For immunofluorescence staining, MO3.13 cells were seeded on glass bottom dishes (MatTek) in a high glucose DMEM medium. Cells were washed three times with PBS and fixed with methanol for 30 min, followed by 30 min of blocking with 3% bovine serum albumin (BSA) in PBS. Cells were then incubated with primary antibodies [rabbit anti-α-syn, Cat# ab138501, Abcam, 1:250; mouse anti-α-syn, Cat# 610787, BD Biosciences, 1:500; rabbit anti-Alix, Cat# ABC40, Millipore, 1:1000; rabbit anti-syntaxin 4, Cat# ab184545, Abcam, 1:1000; and mouse anti-lysosome-associated membrane protein 1 (LAMP1), Cat# sc-17768, Santa Cruz Biotechnology, 1:100] at 4°C overnight and then corresponding secondary antibodies conjugated with Alexa Fluor® 488 or 594 (Invitrogen/Life Technologies; 1:1000) at room temperature for 1 h. DAPI (0.5 μg/ml) was used for nuclear staining. Images were captured using an LSM 710 confocal microscope (Carl Zeiss).
To assess the localization of VAMP2 and syntaxin 4 in GCIs, sequential double immunofluorescence labelling was performed on 4-µm thick paraffin-embedded putamen sections from a patient with MSA-P (Supplementary material).
Oligodendrocyte-derived enriched microvesicle isolation
Extracellular vesicles carrying 2,3-cyclic nucleotide-3-phosphodiesterase (CNPase), a common mature oligodendrocyte marker, were isolated as OEMVs from human plasma using an immunocapture protocol similar to the previously established L1CAM-positive, neuron-derived extracellular vesicle isolation procedure (Shi et al., 2014). Briefly, 10 μg of anti-CNPase antibodies (clone mABcam 44289, Abcam) or normal mouse IgGs (Santa Cruz Biotechnology) as negative controls were coated onto one set (1 mg) of M-270 epoxy beads using a Dynabeads® Antibody Coupling Kit (Invitrogen/Life Technologies) according to the manufacturer’s instructions. After thawing quickly (within 2 min) at 37°C, plasma samples (>300 μl) were centrifuged at 2000g for 15 min (4°C) and then 12 000g for 30 min (4°C). The supernatant was collected and diluted 1:3 with PBS (pH 7.4). One milligram of antibody-coated beads and 900 μl of diluted plasma were incubated together for ∼24 h with gentle rotation at 4°C. The beads were then washed four times with 1 ml of 0.1% BSA/PBS and transferred into a new tube. Extracellular vesicles were eluted from the beads and lysed with 50 μl 1× Laemmli sample buffer for western blots, or in 110 μl of 1% TritonTM X-100 plus 10% of a protease inhibitor cocktail (P2714, Sigma-Aldrich; prepared in 10 ml of H2O) in 0.1% BSA/PBS (pH 7.4) for 1 h at room temperature with gentle shaking for Luminex measurements.
OEMVs in clinical plasma samples were extracted in batches, and MSA, Parkinson’s disease and control samples were equally distributed into each batch. Two reference plasma samples, pooled from ∼30 healthy controls, were added into each batch to help assess batch variations (Shi et al., 2011, 2014).
Extracellular vesicle-depleted plasma samples were prepared by removing extracellular vesicles after a two-step ultracentrifugation (180 000g for 3 h at 4°C twice).
Luminex assays
OEMV preparations of 100 μl (extracted from ∼300 μl of plasma) were used to quantify α-syn with an established Luminex protocol (Hong et al., 2010; Shi et al., 2014). Total α-syn concentrations in plasma were also measured as previously described (Shi et al., 2010). Haemoglobin concentrations, as an index of the haemolysis in plasma, were measured using an ELISA kit (Hong et al., 2010).
Fluorescent and scatter nanoparticle tracking analysis
Mouse anti-CNPase (ab44289, Abcam) antibodies and normal mouse IgG controls (cs-2025, Santa Cruz) were coupled to Qdot 605 following the manufacturer’s protocol (SiteClick™ Qdot® 605 Antibody Labeling Kit; Thermo Fisher Scientific). PBS (pH 7.4) filtered with 20 nm filters (WHA68093002, Whatman/GE Life Sciences) was also used as a negative control. Human or mouse plasma (∼120 μl) was centrifuged at 2000g for 15 min and then at 12 000g for 30 min at 4°C. Supernatant was recovered without disturbing the pellet, and then diluted 1:1000 with 20 nm-filtered PBS (pH 7.4) for direct scatter (total particle) measurements. For fluorescent NTA measurements, the cleared plasma (supernatant) was incubated with antibody-Qdot conjugates (19 μl plasma and 1 μl Qdot-labelled antibodies) on ice for 1 h, before it was diluted in filtered PBS (5 μl plasma to 1 ml PBS) for fluorescent NTA. All NTA measurements were carried out using a NanoSight 300 (NanoSight), equipped with a 405 nm violet laser and a 430 nm filter (for Qdot fluorescence).
Transmission electron microscopy
MO3.13 cells transfected with the α-syn overexpressing plasmid (pCMV-tag-2b-SNCA) or the empty vector and cells treated with 100 nM oligomeric α-syn or PBS were pelleted by centrifuging at 2000g for 10 min and fixed using 2.5% (v/v) glutaraldehyde overnight at 4°C. The cells were carefully washed three times with PBS (pH 7.4) and then post-fixed for 2 h in 1% (w/v) OsO4 at 4°C. The cell samples were dehydrated with an acetone gradient from 30–100%, followed by 50%, 67%, 75% (v/v) araldite in acetone, and then embedded in araldite. The samples were sectioned at a thickness of 50 nm, stained with saturated uranyl citrate and 0.2% (w/v, pH 11) lead acetate for 30 min at room temperature, and then washed three times with ddH2O. Sections were mounted onto transmission electron microscopy (TEM) copper grids and examined under a JEM-1400 PLUS microscope (JEOL). Eight to 10 TEM images were taken for each sample for quantification.
Western blot analysis and immunoprecipitation
Western blotting was performed following a standard protocol (Lin et al., 2012). Extracellular vesicle samples (∼10 μg of total protein) were solubilized with Laemmli sample buffer and separated on an SDS-PAGE gel before transferring to a PVDF membrane. The membrane was then probed with the primary antibodies (Supplementary material). For immunoprecipitation, 500 μg (total protein) of cell lysates were incubated with anti-α-syn (Cat# ab138501, Abcam, 1:250), anti-syntaxin 4 (Cat# 14988-1-AP, Proteintech, 1:40), or anti-VAMP2 (Cat# ab181869, Abcam, 1:200) overnight at 4°C. Protein A/G agarose (20 μl, sc-2003, Santa Cruz Biotechnology) were added and the samples were then rotated at 4°C for 2 h. The beads were washed four times, and the proteins were eluted by using 1× Laemmli sample buffer for western blot analysis.
Cathepsin D activity assay
Cathepsin D was measured by using a Cathepsin D Activity Assay Kit (Fluorometric) (Cat# ab65302, Abcam) following the manufacturer’s instructions (Supplementary material).
Statistical analysis
All analyses were performed in SPSS 18.0 (IBM, Chicago, IL, USA) or Prism 6.0 (GraphPad Software, La Jolla, CA, USA). Normality of fluorescent NTA and immunoassay data were assessed by Kolmogorov-Smirnov test. Log10 transformation was used to generate more normally distributed datasets for all analyses except for extracellular vesicle α-syn and the extracellular vesicle/total α-syn ratio, which did not require transformation to achieve normality. Most group means were compared by using two-tailed unpaired Student’s t-test or Mann-Whitney U-test (for two groups) or one-way ANOVA followed by Tukey post hoc test (for three or more groups, e.g. MSA, Parkinson’s disease and healthy controls). Two-way ANOVA followed by Sidak correction was used to compare group means of transgenic and wild-type mice at three time/age points. Receiver operating characteristic (ROC) curves for analytes were generated to evaluate their sensitivities and specificities in distinguishing MSA from Parkinson’s disease or healthy controls. The ‘optimum’ cut-off value for a ROC curve was defined as the value associated with the maximal sum of sensitivity and specificity. Additionally, relationships between the analytes and age, sex, disease duration, and the Unified Multiple System Atrophy Rating Scale (UMSARS) motor scores were analysed with bivariate correlation using Pearson’s correlation coefficients. Partial correlations between analyte levels and UMSARS scores were also conducted while controlling for potential confounding factors such as age and sex of subjects. Values with P < 0.05 were regarded as significant.
Data availability
The authors are willing to provide the raw data related to this manuscript upon request.
Results
Immunocapture and characterization of OEMVs from plasma and identification of α-syn in plasma OEMVs
To enrich OEMVs from peripheral blood plasma, we first adopted a previously established immunocapture technology for plasma L1CAM-positive, neuron-derived extracellular vesicle isolation (Shi et al., 2014), by using CNPase, a relatively oligodendrocyte-specific extracellular vesicle surface marker. The quality of anti-CNPase captured extracellular vesicles was examined by western blot and NTA. We found that in the CNPase-containing extracellular vesicle preparations, Alix and CD9, two general exosome markers (http://exocarta.org/exosome_markers) were also enriched, but not in the IgG isotype control-captured samples (Fig. 1A). NTA showed the sizes of anti-CNPase enriched extracellular vesicles were mostly between 30 and 150 nm, the commonly recognized exosome range (Fig. 1B). We also developed a fluorescent NTA assay with anti-CNPase-Qdot labelling to analyse CNPase-positive extracellular vesicles in plasma directly, which allows direct and individual visualization and quantification of specific exosomes and microvesicles in liquid suspension in real-time (Fig. 1C and D). To test the cell/tissue specificity of CNPase-positive extracellular vesicles, we examined CNPase expression from several other possible sources using western blots (Supplementary Fig. 1). CNPase is primarily expressed in oligodendrocytes and Schwann cells, with much higher expression in the brain (Kurihara and Tsukada, 1967), which was confirmed in our test; however, it was also reported to be produced in kidney (Jackson et al., 2014), which was not seen in our blots, most likely due to a much lower abundance compared to brain tissue. Additionally, CNPase was not detected in red blood cells and platelets, two major sources of α-syn in blood (Shi et al., 2010).
Figure 1.

Characterization and quantification of CNPase-positive extracellular vesicles in human plasma. (A) CNPase-positive extracellular vesicles were isolated by using the anti-CNPase immunoaffinity capture from reference (pooled healthy control) human plasma; normal mouse IgG capture was used as a negative control, and anti-L1CAM capture for L1CAM-positive extracellular vesicles was also used as a control. CNPase and two common extracellular vesicle makers, Alix and CD9, were analysed using western blot. Equal amounts (total protein) of human brain homogenates (‘Brain’) were also loaded as a reference. (B) The isolated CNPase-positive extracellular vesicles were analysed using NTA (scatter) to demonstrate their general sizes and distribution. (C and D) CNPase-positive extracellular vesicles in reference plasma were labelled with anti-CNPase-Qdot605 or mouse IgG control-Qdot605 conjugates, and analysed in plasma directly by using fluorescent NTA (C). The quantitative data are shown in D. Error bars represent the standard deviation from the mean; **P < 0.01. EV = extracellular vesicle.
Using the α-syn Luminex immunoassay we established previously (Shi et al., 2014), we observed an α-syn signal in anti-CNPase captured extracellular vesicles from reference human plasma (pooled healthy controls). The signal was unlikely from free α-syn in plasma because the normal IgG-captured samples gave only minimal signal (Supplementary Fig. 2A). We also generated extracellular vesicle-depleted plasma by two-step ultracentrifugation to further confirm the signal specificity, and the extracellular vesicle α-syn signal was reduced significantly compared with regular plasma (Supplementary Fig. 2B).
Evaluation of CNPase-positive extracellular vesicles and their α-syn cargo in human plasma from MSA patients and controls
To investigate whether OEMVs and/or their α-syn cargo change in patients with MSA, we evaluated plasma samples from 32 MSA patients, 34 Parkinson’s disease patients and 31 age- and sex-matched healthy controls (Table 1). We first measured the concentrations and size distributions of CNPase-positive extracellular vesicles using the fluorescent NTA assay. In this cohort, CNPase-positive extracellular vesicles of exosomal size (40–170 nm, size of exosomes plus Qdots) concentrations were significantly lower in patients with MSA compared to those with Parkinson’s disease (P < 0.001) or healthy controls (P < 0.001) (Fig. 2B) and not different between possible and probable MSA or between Caucasian and Asian groups (P > 0.05). No significant difference was observed in larger plasma extracellular vesicle (170–400 nm and 400–1000 nm) concentrations among MSA, Parkinson’s disease and healthy controls (Fig. 2D and F). There was also no apparent difference in CNPase-positive extracellular vesicle distribution among the three groups (Fig. 2A, C and E). These results suggest that it is specifically exosomes, rather than other extracellular vesicle types, that are altered in CNPase-positive extracellular vesicles in MSA. However, no associations were found between the plasma OEMV concentrations and disease duration or the UMSARS motor scores in MSA patients, likely due to the small sample size.
Figure 2.

Fluorescent NTA analysis of plasma CNPase-positive extracellular vesicles in a cohort of patients with MSA, Parkinson’s disease, and healthy controls. CNPase-positive extracellular vesicles in plasma were labelled with anti-CNPase-Qdot605 and analysed directly by using fluorescent NTA for: (A and B) exosome size (40–170 nm, size of exosome plus Qdot) extracellular vesicles, (C and D) 170–400 nm extracellular vesicles, and (E and F) 400–1000 nm extracellular vesicles. The boxes extend from the 25th to 75th percentiles. The middle dark lines indicate the medians. The whiskers extend to the minimum or the maximum values. ***P < 0.001. CON = healthy control; EV = extracellular vesicle; PD = Parkinson disease.
Next, we measured CNPase-containing extracellular vesicle (i.e. OEMV) α-syn as well as total α-syn in plasma using our established Luminex assays (Shi et al., 2010, 2014). The OEMV α-syn in patients with MSA was significantly lower than in those with Parkinson’s disease (P < 0.05); it also trended lower in MSA compared to healthy controls but did not reach statistical significance (P = 0.086) (Fig. 3A). In contrast, no significant difference was found in total plasma α-syn among MSA, Parkinson’s disease and healthy controls (Fig. 3B). The plasma OEMV α-syn/total α-syn ratio was also significantly lower in patients with MSA than in Parkinson’s disease (P < 0.05) and controls (P < 0.05) (Fig. 3C), apparently driven by the OEMV α-syn. However, the ratio of OEMV α-syn concentration to plasma CNPase-positive extracellular vesicle concentration (i.e. the average extracellular vesicle α-syn concentration per extracellular vesicle) was not significantly different among the three groups (Fig. 3D). This suggests that the difference in extracellular vesicle α-syn concentrations was mainly driven by the reduced plasma concentrations of CNPase-positive extracellular vesicles and that the extracellular vesicle releasing mechanism in oligodendrocytes, but not how much α-syn is packaged into each extracellular vesicle, is likely affected in MSA patients.
Figure 3.

Evaluation of α-syn concentrations in plasma CNPase-positive extracellular vesicles isolated from patients with MSA, Parkinson’s disease, and healthy controls. CNPase-positive extracellular vesicles were isolated from human plasma using immunocapture; the α-syn concentrations in these extracellular vesicles (EV α-syn) and in the whole plasma (total α-syn) were measured using Luminex. (A) Extracellular vesicle α-syn; (B) total α-syn; (C) the extracellular vesicle/total α-syn ratio; and (D) the extracellular vesicle α-syn concentrations per vesicle (the extracellular vesicle α-syn concentrations/CNPase-positive extracellular vesicle concentrations). The boxes extend from the 25th to 75th percentiles. The middle dark lines indicate the medians. The whiskers extend to the minimum or the maximum values. *P < 0.05. CON = healthy control; EV = extracellular vesicle; PD = Parkinson disease.
To explore the biomarker potential of the analytes that displayed significant group differences, we performed ROC analyses to evaluate their performance in discriminating MSA from healthy and disease (Parkinson’s disease) controls in this cohort. The plasma OEMV concentrations showed an area under curve (AUC) of 0.848 (sensitivity = 83.9%, specificity = 71.9%) for MSA versus healthy controls and an AUC of 0.770 (sensitivity = 61.8%, specificity = 81.3%) for MSA versus Parkinson’s disease (Supplementary Fig. 3). Similar results were obtained for the plasma OEMV/total α-syn ratio (MSA versus healthy controls: AUC = 0.657, sensitivity = 55.9%, specificity = 82.4%; MSA versus Parkinson’s disease: AUC = 0.709, sensitivity = 52.9%, specificity = 85.3%; Supplementary Fig. 3). Notably, no significant association between race and diseases was detected by binary logistic regression analysis (P = 0.760 for MSA versus Parkinson’s disease, P = 0.868 for MSA versus healthy controls) and adding race as a confounder in the ROC analyses did not significantly affect the results (data not shown).
Validation of plasma CNPase-positive extracellular vesicle changes in an MSA mouse model
To understand the possible change in the exosome-releasing mechanism in oligodendrocytes in MSA patients, we investigated the plasma CNPase-positive extracellular vesicles in the PLP-SYN transgenic mouse model, which is based on the overexpression of human wild-type α-syn in oligodendrocytes (Kahle et al., 2002). Overall, the CNPase-positive exosome-sized extracellular vesicle (40–170 nm) concentrations in plasma were lower in the transgenic MSA model mice compared to the wild-type or the A53T Parkinson’s disease model mice [F(2,63) = 8.043, P = 0.0005 for MSA model versus wild-type mice, and P = 0.0018 for MSA model versus Parkinson’s disease model mice, two-way ANOVA with Sidak correction] (Fig. 4), similar to the human disease condition. There was a trend for lower plasma CNPase-positive exosome concentrations in plasma from the transgenic MSA mice even in 6- and 32-week-old animals, though the difference did not reach statistical significance; at 12 months of age (modelling a more advanced disease stage) (Fernagut et al., 2014; Refolo et al., 2018), the difference between the PLP-SYN mice and the wild-type or the Parkinson’s disease model mice became more apparent (Fig. 4). Furthermore, the exosome concentrations were also reduced in 12-month-old mice compared to the 32-week-old mice (P < 0.05, two-way ANOVA; Fig. 4). In line with the human plasma results, the concentrations of larger CNPase-positive extracellular vesicles (170–400 nm and 400–1000 nm) in mouse plasma were not different in the PLP-SYN mice compared to the wild-type mice at any tested time points (Supplementary Fig. 4).
Figure 4.
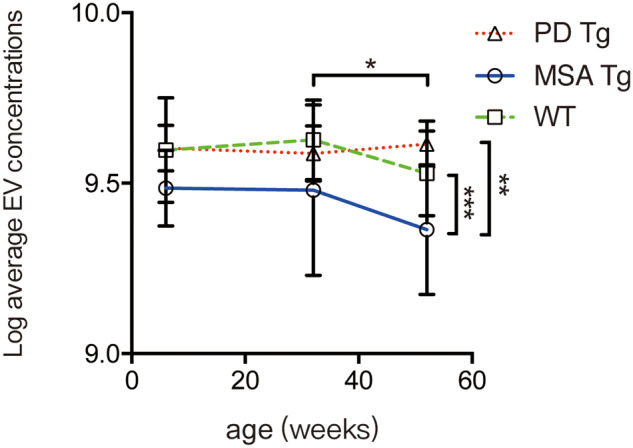
Fluorescent NTA analysis of plasma CNPase-positive extracellular vesicles in a transgenic MSA model, a transgenic Parkinson’s disease model, and wild-type mice. Blood plasma samples were collected from PLP-SYN transgenic (MSA Tg), Prnp-SNCA*A53T transgenic (PD Tg), and wild-type (WT) mice at the ages of 6 weeks, 32 weeks, and 12 months, and the concentrations of CNPase-positive extracellular vesicles were measured using fluorescent NTA. Data shown are mean ± standard deviation (SD). *P < 0.05 (mice at 12 months versus mice at 32 weeks, two-way ANOVA followed by Sidak correction); **P < 0.01 (MSA Tg versus PD Tg, two-way ANOVA); ***P < 0.001 (MSA Tg versus wild-type, two-way ANOVA). EV = extracellular vesicle.
Influence of multivesicular body and extracellular vesicle release upon α-syn levels in cultured oligodendrocytes
To study the molecular mechanism underlying the exosomal changes, we evaluated the release of CNPase-positive extracellular vesicles from cultured oligodendrocytes. In mouse primary oligodendrocyte cultures, the exosome-sized extracellular vesicle (40–170 nm) concentrations from the PLP-SYN transgenic MSA mouse model were significantly lower than those from the wild-type cultures, confirming the human and animal results (P < 0.01, Fig. 5A and Supplementary Fig. 5). In human MO3.13 oligodendrocytic cells, to mimic the pathogenesis of MSA in this cellular model, we either overexpressed α-syn in these cells, or exposed the cells to synthetic α-syn oligomers or α-syn aggregates purified from GCIs of MSA patients, given that the mechanism by which α-syn accumulates in oligodendrocytes could be overexpression of α-syn in the disease condition and/or neuron-to-oligodendrocyte transfer (Ubhi et al., 2011; Asi et al., 2014; Kaji et al., 2018). MO3.13 conditioned medium was then collected and labelled with anti-CNPase-Qdots, followed by fluorescent NTA analysis. CNPase-positive extracellular vesicle concentrations were significantly reduced when the MO3.13 cells were over-expressing α-syn (P < 0.001, Fig. 5B), or treated with α-syn oligomers (P < 0.01, Fig. 5C) or GCI-derived α-syn aggregates from MSA patients (P < 0.001, Fig. 5D).
Figure 5.

NTA analysis of oligodendrocyte-enriched extracellular vesicles released from cultured oligodendrocyte cells. (A) Conditioned media were collected from primary oligodendrocyte cultures derived from the MSA transgenic model (PLP-SYN) and wild-type (WT) mice, and extracellular vesicles in the media were analysed using NTA. (B–D) CNPase-positive extracellular vesicles in human oligodendrocytic MO3.13 cell conditioned media were analysed and quantified directly using fluorescent NTA. MO3.13 cells were transfected with the pCMV-tag2b-SNCA plasmid (α-syn) to overexpress α-syn (the empty vector-transfected cells were used as a control) (B), treated with 100 nM synthetic oligomeric α-syn in PBS (oligo α-syn) (PBS-treated cells were used as a control) (C), or treated with 50 nM purified, aggregate α-syn-enriched human GCI fractions isolated from MSA brains (GCI) (PBS-treated cells were used as a control) (D) before analysis. Error bars represent the standard deviation from the mean; **P < 0.01, ***P < 0.001. EV = extracellular vesicle.
As the human MO3.13 cells and the mouse primary cultures displayed similar trends in oligodendroglial extracellular vesicle reduction under disease settings, the following mechanistic studies were conducted in MO3.13 cells. We next investigated whether excess α-syn affected the MVB morphology. MO3.13 cells with or without α-syn overexpression or exposure to exogenous oligomeric α-syn were analysed with TEM. As shown in Fig. 6, MVBs contained quantitatively more ILVs when overexpressing α-syn in MO3.13 cells (Fig. 6A and B) or exposed to oligomeric α-syn (Fig. 6C and D), which indicates an exosome release dysfunction likely induced by excess α-syn, causing more ILVs to be retained in MVBs. Furthermore, Alix, a common exosome marker, was significantly higher in α-syn overexpressing (Fig. 6E and F) or oligomeric α-syn-treated cells (Fig. 6G and H). These results suggest that excess α-syn is likely involved in the impairment of the MVB releasing process.
Figure 6.

Excess α-syn induces MVB morphology changes in oligodendrocytic cells. Cultured MO3.13 cells were exposed to excess α-syn by using two models: (i) α-syn was overexpressed in MO3.13 cells via transfection of the pCMV-tag2b-SNCA plasmid into the cells (α-syn); the empty vector-transfected cells were used as a control (vector); and (ii) MO3.13 cells were exposed to 100 nM synthetic oligomeric α-syn for 24 h (Oligo α-syn); PBS was used as the negative control. (A–D) TEM quantification of ILVs in MVBs. The MVBs/ILVs in the cells overexpressing α-syn (A) or exposed to oligomeric α-syn (C) were imaged by TEM at magnifications of 5000× and 40 000×. Scale bars = 1 μm for the 5000× images; 100 nm for the 40 000× images. Average ILV number per MVB was counted in randomly selected cells [n = 12 MVBs in 10 images/cells for the α-syn overexpressing model (B) and n = 12 MVBs in eight images/cells for the oligo α-syn exposure model (D)] by an operator blinded to the experimental conditions. (E–H) Immunofluorescence quantification of Alix in cells overexpressing α-syn (E and F) or exposed to oligomeric α-syn (G–H). MO3.13 cells transfected with the α-syn overexpressing plasmid or the empty vector (E) or exposed to oligomeric α-syn or PBS (F) were stained with antibodies against α-syn (red) and Alix (green) as well as with DAPI (blue), and images were captured using a confocal microscope. Scale bar = 10 μm. Relative Alix fluorescence intensity per cell [n = 6 randomly selected cells for both the α-syn overexpressing model (F) and the oligo α-syn exposure model (H)] was quantified by ImageJ. Error bars represent the standard deviation from the mean; **P < 0.01.
α-Syn-syntaxin 4 interaction regulates SNARE complex function and exosome secretion
To investigate how α-syn is involved in the exosome releasing process, we evaluated the interactions between α-syn and some critical components in the process. The soluble N-ethylmaleimide-sensitive fusion factor attachment protein receptor (SNARE) complex, composed of v-SNAREs and t-SNAREs, is implicated in the exocytotic release of exosomes in many cell types (Fader et al., 2009; Wei et al., 2017). As a critical component of v-SNARE, syntaxin 4 has been reported to be involved in the process of exocytosis (Thery et al., 2002); and the interaction of syntaxin with VAMP2, another key SNARE protein, is essential for the MVB docking to the plasma membrane (Burre et al., 2010). To assess the interaction of α-syn with syntaxin 4, we overexpressed α-syn in the MO3.13 oligodendrocyte cell line. Syntaxin 4 was co-immunoprecipitated with α-syn from MO3.13 cell lysate (Fig. 7A and B). By using immunofluorescence confocal microscopy, syntaxin 4 was also shown to be co-localized with α-syn in these α-syn-overexpressing cells (Fig. 7C). Additionally, α-syn overexpression resulted in a decrease in the amount of VAMP2 co-immunoprecipitated with syntaxin 4 (Fig. 7D). The change associated with α-syn occurred without any significant effect to the total amount of syntaxin 4, or VAMP2 protein in MO3.13 cells (Fig. 7D). To test whether α-syn binds to syntaxin 4 in competition with VAMP2 and blocks the function of the SNARE complex, we treated MO3.13 cells with a gradient concentration of recombinant α-syn from 0 to 500 pg/ml. Co-immunoprecipitation experiments showed that the amounts of VAMP2 bound to syntaxin 4 were negatively associated with α-syn concentrations (Fig. 7E and F). Notably, some other SNARE components and Rab proteins were also tested in the α-syn overexpressing cellular model but were not altered (Supplementary Fig. 6). Taken together, these results strongly argue that α-syn regulates the MVB docking to the plasma membrane by interfering with SNARE complex function, especially the interaction between syntaxin 4 and VAMP2.
Figure 7.

α-Syn-syntaxin 4 interaction regulates SNARE complex function and exosome secretion. (A) The binding of syntaxin 4 with α-syn. Lysates of human oligodendrocytic MO3.13 cells were immunoprecipitated with an anti-α-syn antibody and subjected to western blots with antibodies against syntaxin 4 or α-syn. The interaction between syntaxin 4 and α-syn was demonstrated by the co-immunoprecipitation of syntaxin 4. (B) Reciprocal co-immunoprecipitation using an anti-syntaxin 4 antibody for immunoprecipitation confirmed the interaction. (C) The co-localization of α-syn and syntaxin 4 was also observed in MO3.13 cells using confocal microscopy. Cells were stained with antibodies against α-syn (green) and syntaxin 4 (red) as well as with DAPI (blue). Scale bar = 10 μm. Arrows indicate the co-localization of α-syn and syntaxin 4. (D) MO3.13 cells were transfected with the α-syn overexpressing (pCMV-tag2b-SNCA) plasmid or the empty vector, and the interaction between syntaxin 4 and VAMP2 was reduced when overexpressing α-syn, as shown by the decrease of VAMP2 co-immunoprecipitated with syntaxin 4, while the total amounts of syntaxin 4 and VAMP2 were not changed. Inputs (cell lysates) are shown with images acquired with shorter exposures from the same gel. (E and F) MO3.13 cells were treated with increased concentrations of recombinant α-syn proteins (0, 100, 200, and 500 pg/ml), and the amount of VAMP2 interacted (co-immunoprecipitated) with syntaxin 4 was quantified using western blots. The syntaxin 4-VAMP2 binding was negatively associated with recombinant α-syn concentrations. Error bars represent the standard deviation from the mean; *P < 0.05. IP = immunoprecipitation.
To confirm this interaction in human brain, we next examined the co-localization of these SNARE proteins with α-syn in GCIs in the putamen of a patient with MSA. We found that VAMP2 was not co-localized with α-syn in GCIs in oligodendrocytes (Supplementary Fig. 7A–D). In contrast, the co-localization of syntaxin 4 with α-syn was apparent in GCIs (Supplementary Fig. 7E–H), suggesting a potential sequestration of syntaxin 4 into GCIs by α-syn through their interaction.
Because exosome secretion and lysosome-related protein degradation are often linked and lysosome dysfunction has been reported in Parkinson’s disease and MSA (see ‘Discussion’ section), we also tested some lysosome functions in the cellular model. α-Syn overexpression increased the levels of LAMP1, a routinely used lysosome marker, in MO3.13 cells (Supplementary Fig. 8A and B). Additionally, cathepsin D, a major lysosomal enzyme involved in the degradation of proteins such as α-syn (Sevlever et al., 2008), was also induced in these cells (Supplementary Fig. 8C). Similar results were obtained when oligodendrocytic cells were exposed to increasing concentrations of synthetic oligomeric α-syn (Supplementary Fig. 8D) or aggregate α-syn-enriched human GCI fractions isolated from MSA brains (Supplementary Fig. 8E). These results suggest that excess α-syn in cells, while interfering with exosome secretion, may stimulate the linked compensative lysosome pathway to remove the trapped protein aggregates, at least for the short term in this simplified cellular model.
Discussion
Several major advances regarding oligodendrocyte-enriched extracellular vesicles in MSA were demonstrated in this study. We first developed technologies to isolate and characterize CNPase-positive oligodendrocyte-enriched extracellular vesicles from peripheral plasma and other sources, and found that the concentrations of these extracellular vesicles of a size consistent with exosomes in plasma were significantly lower in patients with MSA compared to healthy and disease (Parkinson’s disease) controls. We also demonstrated that exosome secretion from oligodendrocytes, the most affected cells in MSA patients, was similarly reduced in a well-characterized transgenic MSA mouse model and in cellular models. Additionally, our results suggest that α-syn may play a critical role in oligodendrocyte MVB docking and thus exosome secretion. Specifically, α-syn can disturb the SNARE complex function by competitively binding to syntaxin 4 with VAMP2, and interfere with cytoplasmic vesicle transportation.
We previously demonstrated that α-syn-bearing, likely neuron-derived exosomes or extracellular vesicles could be transported from the brain to peripheral blood and the levels of α-syn contained in these extracellular vesicles in plasma were significantly higher in patients with Parkinson’s disease compared to healthy controls (Shi et al., 2014). This prompted us to investigate whether oligodendrocyte-derived extracellular vesicles can also be identified and isolated from plasma. Considering that α-syn inclusions are mainly found in oligodendrocytes in MSA patients, while neurons are the major damaged cell type in Parkinson’s disease, a specific plasma exosome surface marker to oligodendrocyte is greatly needed. We tested several candidate oligodendrocyte markers (e.g. myelin basic protein, myelin oligodendrocyte glycoprotein, and PLP; data not shown) in this study, identified CNPase as most suitable, and successfully established a method for isolating OEMVs in plasma using anti-CNPase antibodies for immunoaffinity capture.
CNPase, mainly expressed in the CNS (proteinatlas.org), is a common, well-characterized mature oligodendrocyte marker (Sprinkle, 1989; Verrier et al., 2013). However, it is also expressed in peripheral Schwann cells due to the similarity of cell origin (Sprinkle, 1989), though the expression is believed to be much higher in the brain (Kurihara and Tsukada, 1967). We thus favour defining these CNPase-positive extracellular vesicles as OEMVs. Nonetheless, currently there is no evidence to demonstrate that Schwann cells can secrete CNPase-positive extracellular vesicles. Furthermore, given the major MSA pathological changes that occur in oligodendrocytes, it is more likely that the reduced OEMVs in MSA observed in our study reflect the CNS pathology of MSA. A recent study (Ohmichi et al., 2019) used myelin oligodendrocyte glycoprotein for oligodendrocyte-derived extracellular vesicle enrichment from blood; however, the cell and tissue specificity were not evaluated, which could be important, given that the protein is also expressed in Schwann cells (Pagany et al., 2003).
Next, we measured plasma OEMVs of different extracellular vesicle fractions including exosomal (40–170 nm), and larger extracellular vesicles (170–400 nm and 400–1000 nm) from patients with MSA, Parkinson’s disease and healthy controls with fluorescent NTA technology. The major difference was found in the exosomal fraction, and the plasma CNPase-positive exosome concentrations in the MSA group were significantly lower. The sensitivities and specificities of plasma OEMVs for differentiating MSA from Parkinson’s disease or healthy control subjects (60–85%) were relatively moderate in this small cohort, which could be, at least in part, because the affected oligodendrocytes in MSA only account for a proportion of all oligodendrocytes in the brain. However, larger cohorts and independent validations are needed to fully evaluate the biomarker potential of plasma OEMVs and their protein cargo in future studies (more discussion below).
Our further in vivo and in vitro studies suggest that such OEMV reduction might be, at least partially, due to α-syn accumulation or misregulation in oligodendrocytes (see below). For further validation, we collected plasma from the PLP-SYN transgenic mice at different age points from 6 weeks to 12 months. These mice recapitulate some of the main neuropathological features of MSA, i.e. the accumulation of α-syn aggregates in oligodendrocytes together with progressive nigral and striatal degeneration. Behavioural deficits appear around 6 months of age (Refolo et al., 2018). Consistent with the human plasma results, the plasma OEMV concentrations were lower in PLP-SYN mice compared to the wild-type mice and reached significance at 12 months of age. However, even at the earliest stages examined, we observed a consistent, though not statistically significant, trend towards lower blood extracellular vesicles in transgenic mice. This suggests the deficits in exosome release might occur quite early in the pathogenic process, but it needs to be further tested with more time points in future studies. To this end, increasing evidence has suggested that the defects in neuronal autophagy and lysosome functions, which are usually secondary to α-syn accumulation/aggregation in Parkinson’s disease and other synucleinopathies, could in turn affect the degradation of aggregated cellular proteins and/or the clearance of such toxic proteins from cells via exosomes (Winslow and Rubinsztein, 2011; Karabiyik et al., 2017). Of note, ILVs can either be degraded when MVBs fuse with lysosomes or released as exosomes when MVBs fuse with the plasma membrane (Piper and Katzmann, 2007; Yanez-Mo et al., 2015), and thus the degradation and secretion can be linked. Here, we found that the deficits of exosome secretion and possible protein clearance impairment could also occur in oligodendrocytes in MSA, and they appeared to be independent to and even earlier than deficits of lysosome functions in cellular models tested in this study (Supplementary Fig. 8). It is interesting that such deficits were not observed in oligodendrocyte-derived enriched plasma extracellular vesicles from Parkinson’s disease patients and transgenic Parkinson’s disease mice in this study, likely due to the different most affected cell types in these two diseases. Accordingly, oligodendrocytes in Parkinson’s disease brains might not be exposed to the same insults (e.g. α-syn accumulation/aggregation) as in MSA.
To explore the mechanisms underlying the reduced OEMVs in MSA patients and transgenic animals, we demonstrated that α-syn may inhibit oligodendrocyte exosome secretion by interfering with the SNARE complex function and the MVB transportation in cytoplasm. Even though the function of α-syn is not fully understood, it has been suggested that it is involved in vesicle transportation and SNARE structure maintenance (Burre et al., 2010; Darios et al., 2010; Choi et al., 2013). In this study, we found that α-syn overexpression, treatment with synthetic α-syn oligomers, or treatment with α-syn aggregate-enriched GCIs from MSA patients could reduce the exosome secretion in an oligodendrocyte cell line MO3.13. We also demonstrated that this reduction was likely due to the interference with the docking of the ILV-containing late endosomes (i.e. MVBs) to the plasma membrane, an essential step for the releasing of ILVs extracellularly as exosomes (Colombo et al., 2014). Using TEM, we found that MVBs became larger and contained more ILVs when overexpressing α-syn in oligodendrocytes. Our results further indicated that α-syn could bind to syntaxin 4 directly and prevent its interaction with VAMP2, which is essential for MVB docking to the plasma membrane. Given that the SNARE complex is essential to synaptosome release as well as MVB docking to the plasma membrane (Burre et al., 2010; Shifrin et al., 2013) and the function of the SNARE complex relies on the conjunction of v-SNARE (VAMP) and t-SNARE (syntaxin and SNAP), our results strongly suggest an α-syn-regulated exosome release mechanism in MSA. Interestingly, α-syn has also been reported to interfere with the endosomal sorting complex required for transport (ESCRT) pathway, which plays important roles in MVB and extracellular vesicle biogenesis, in neurons, resulting in increased exocytosis of α-syn (Spencer et al., 2016). Whether this is also true in oligodendrocytes and the interactions between the ESCRT and SNARE (membrane fusion) pathways need to be further investigated.
Although the current study is focused on the secretion of the OEMVs, we cannot rule out the possibility that the observed OEMV reduction in plasma could also be due to an impaired transportation of OEMVs from the brain to peripheral blood. Indeed, recent studies by our group and others suggest that the brain-to-blood transport of neurodegenerative disease-related proteins (e.g. α-syn and tau) via exosomes or other types of extracellular vesicles could be a potential pathway to clear these potentially toxic proteins from the brain (Shi et al., 2014, 2016; Mustapic et al., 2017; Guix et al., 2018). The results from this study, nonetheless, further suggest that the clearance via oligodendrocyte-derived extracellular vesicles might be impaired in MSA. Again, it is unclear whether this is a consequence of the disease progression or a contributor to the disease development, though our transgenic mouse data seem to argue that this OEMV reduction could be an early event in MSA development. Furthermore, in our previous studies, brain-to-blood clearance might be enhanced in Parkinson’s disease (Shi et al., 2014, 2016), likely via a compensatory mechanism. If this is confirmed, we might speculate that the impaired clearance in MSA could be related to the generally fast progression in this disease. However, this phenomenon must be examined longitudinally in human patients, preferably including those at earlier stages, to fully understand these changes.
The origin of the α-syn, particularly its modified forms like oligomeric α-syn, which accumulates in oligodendrocytes in MSA, remains controversial. Although some earlier studies identified α-syn expression only in neurons but not in oligodendrocytes (Miller et al., 2005; Jin et al., 2008), recent studies have reported low levels of α-syn mRNA expression in oligodendrocytes (10–20% of those in neurons), especially during maturation (Asi et al., 2014; Djelloul et al., 2015; Kaji et al., 2018). In addition to a possible overexpression of α-syn or somatic α-syn gene (SNCA) copy number gains (Mokretar et al., 2018; Perez-Rodriguez et al., 2019) in the disease condition, neuron-to-oligodendrocyte transfer has also been hypothesized as a mechanism by which α-syn may accumulate in oligodendrocytes (Ubhi et al., 2011; Reyes et al., 2014; Kaji et al., 2018). This means that the origin of α-syn in OEMVs could be either endogenous to oligodendrocytes and/or from neurons. Regardless of the sources of α-syn in oligodendrocytes/OEMVs and the mechanisms related to the OEMV reduction in MSA, α-syn accumulation/misregulation in oligodendrocytes likely inhibits the exosome secretion pathway as a method for protein clearance, reinforcing the autophagy/lysosome dysfunction in neurodegenerative disorders (Winslow and Rubinsztein, 2011; Karabiyik et al., 2017), and could thereby exacerbate α-syn aggregation and GCI formation in MSA. In the simple cellular model used in this study, lysosome activation, rather than impairment, was observed. This could be explained by differing effects depending on disease stage, or the imperfect recapitulation of all aspects of the human disease by the in vitro model. Additionally, our human data suggest that lysosome dysfunction (or activation) and possibly altered intracellular α-syn levels resulting from it in MSA/Parkinson’s disease may not necessarily lead to altered amounts of α-syn packaged into each extracellular vesicle from oligodendrocytes. Nonetheless, with distinctively different most-affected cell types and pathology in MSA as compared to Parkinson’s disease, such processes are likely differentially regulated in different cell types and/or different disease conditions and should be further investigated.
Given the importance of brain-to-blood clearance of toxic species via extracellular vesicles in neurodegenerative disorders including Parkinson’s disease and Alzheimer’s disease (Shi et al., 2014, 2016; Mustapic et al., 2017; Guix et al., 2018), in the current study, we also used the extracellular vesicle isolation method for α-syn level measurements in CNPase-positive plasma extracellular vesicles from MSA, Parkinson’s disease and healthy controls. A significant decrease of extracellular vesicle α-syn in patients with MSA compared to Parkinson’s disease and heathy controls was found, though there was no difference between Parkinson’s disease and controls. Interestingly, the ratio of extracellular vesicle α-syn to CNPase-positive extracellular vesicle concentrations did not differ among MSA, Parkinson’s disease and healthy controls. This result indicates that the packing of α-syn into extracellular vesicles was likely unaffected in both MSA and Parkinson’s disease. Instead, exosome secretion from oligodendrocytes and/or brain-to-blood transportation was probably damaged in MSA patients. Although it appears that measuring plasma extracellular vesicle total α-syn does not add any additional value as a biomarker for MSA compared to direct measurement of plasma CNPase-positive extracellular vesicle (OEMV) concentrations, which displayed AUCs of 0.75–0.85 in this small cohort, the biomarker potential of plasma OEMVs and their cargos should be further investigated. In addition to α-syn, emphasis on the candidates showing promise in CSF and blood (e.g. phosphorylated or oligomeric α-syn, neurofilament light chain) for α-synucleinopathy diagnosis and differential diagnosis (Abdo et al., 2007; Foulds et al., 2011; Wang et al., 2012; Laurens et al., 2015; Majbour et al., 2016a, b; Hansson et al., 2017) may further improve the biomarker performance. Although these biomarker candidates do not detect GCIs in MSA brains directly, they may be related to potential oligodendrocyte pathological mechanisms as suggested by the present study and could have clinical significance.
In summary, we isolated relatively oligodendrocyte-specific or enriched extracellular vesicles in plasma, and found the concentrations of such extracellular vesicles of exosomal size in plasma and the levels of α-syn within these extracellular vesicles were significantly lower in patients with MSA than those in patients with Parkinson’s disease and healthy controls. We also demonstrated that the reduced CNPase-positive extracellular vesicles and extracellular vesicle α-syn in MSA plasma most likely resulted from the impaired oligodendrocyte exosome secretion. Furthermore, we found that α-syn could interfere with exosome release by disturbing the SNARE complex function and thus the exosome release from cells, implying that the dysfunction of oligodendrocyte exosome release and the α-syn accumulation/aggregation or misregulation could be linked during the MSA development and progression. To yield more insight into the underlying mechanisms, further investigations are needed. Also, more efforts, such as larger cohort verification, could help to understand the utility of plasma CNPase-positive exosomes and their cargos (e.g. toxic α-syn species) for the differential diagnosis of parkinsonian disorders and for monitoring disease progression.
Supplementary Material
Acknowledgements
The authors deeply appreciate the participants for their generous donation of samples. This work is also a result of the collaboration with the investigators of the MODIMSA Biomarker Working Group: Roy Acalay, Angelo Antonini, Roberto Ceravolo, Miguel Coelho, Pietro Cortelli, Alexander Gerhard, Tanya Gurevich, Milica Jecmenica, Han-Joon Kim, Britt Mollenhauer, Maria Teresa Pellecchia, Gregor Wenning, and Marcel Verbeek.
Funding
This study was supported by grants from the National Institutes of Health (NIH) (U01 NS082137 and U01 NS091272 to J.Z., for plasma EV NTA and α-syn studies), grants from China (NSFC81671187 and 2016YFC1306502 to J.Z., for in vitro and PD mouse studies). W.G.M. received AOI 2011 (BIOAMS) and API 2012 (BIOPARK) grants, as well as infrastructural support from the Université de Bordeaux and the Centre National de la Recherche Scientifique (for purification of GCIs, MSA mouse model, primary culture, and human brain studies). M.S. was also partially supported by the NIH R01 AG061383 grant. The content is solely the responsibility of the authors and does not necessarily represent the official views of the sponsors. The putamen samples from MSA patients were obtained from the Brain Bank GIE NeuroCEB (BRIF number 0033-00011), funded by the patients’ associations France Alzheimer, France Parkinson, ARSEP, and ‘Connaître les Syndromes Cérébelleux’ to which we express our gratitude.
The sponsors of this study had no role in the study design, data collection, analysis and interpretation, or the writing of the report. The authors had full access to all the data in the study and had final responsibility for the decision to submit for publication.
Competing interests
The authors report no competing interests for this work. Outside the presented work, W.G.M. has received fees for editorial activities with Springer, for consultancy activities from Affiris, Biohaven, Lundbeck and Sanofi, as well as teaching honoraria from UCB and Boehringer Ingelheim.
Glossary
- α-syn =
α-synuclein
- GCI =
glial cytoplasmic inclusion
- ILV =
intraluminal vesicle
- MSA =
multiple system atrophy
- MVB =
multivesicular body
- NTA =
nanoparticle tracking analysis
- OEMV =
oligodendrocyte-derived enriched microvesicle
- PLP =
proteolipid protein
- SNARE =
soluble N-ethylmaleimide-sensitive fusion factor attachment protein receptor
References
- Abdo WF, Bloem BR, Van Geel WJ, Esselink RA, Verbeek MM.. CSF neurofilament light chain and tau differentiate multiple system atrophy from Parkinson’s disease. Neurobiol Aging 2007; 28: 742–7. [DOI] [PubMed] [Google Scholar]
- Asi YT, Simpson JE, Heath PR, Wharton SB, Lees AJ, Revesz T, et al. Alpha-synuclein mRNA expression in oligodendrocytes in MSA. Glia 2014; 62: 964–70. [DOI] [PMC free article] [PubMed] [Google Scholar]
- Budnik V, Ruiz-Canada C, Wendler F.. Extracellular vesicles round off communication in the nervous system. Nat Rev Neurosci 2016; 17: 160–72. [DOI] [PMC free article] [PubMed] [Google Scholar]
- Burre J, Sharma M, Tsetsenis T, Buchman V, Etherton MR, Sudhof TC.. Alpha-synuclein promotes SNARE-complex assembly in vivo and in vitro. Science 2010; 329: 1663–7. [DOI] [PMC free article] [PubMed] [Google Scholar]
- Choi BK, Choi MG, Kim JY, Yang Y, Lai Y, Kweon DH, et al. Large alpha-synuclein oligomers inhibit neuronal SNARE-mediated vesicle docking. Proc Natl Acad Sci U S A 2013; 110: 4087–92. [DOI] [PMC free article] [PubMed] [Google Scholar]
- Colombo M, Raposo G, Thery C.. Biogenesis, secretion, and intercellular interactions of exosomes and other extracellular vesicles. Annu Rev Cell Dev Biol 2014; 30: 255–89. [DOI] [PubMed] [Google Scholar]
- Darios F, Ruiperez V, Lopez I, Villanueva J, Gutierrez LM, Davletov B.. Alpha-synuclein sequesters arachidonic acid to modulate SNARE-mediated exocytosis. EMBO Rep 2010; 11: 528–33. [DOI] [PMC free article] [PubMed] [Google Scholar]
- Djelloul M, Holmqvist S, Boza-Serrano A, Azevedo C, Yeung MS, Goldwurm S, et al. Alpha-synuclein expression in the oligodendrocyte lineage: an in vitro and in vivo study using rodent and human models. Stem Cell Rep 2015; 5: 174–84. [DOI] [PMC free article] [PubMed] [Google Scholar]
- Emmanouilidou E, Melachroinou K, Roumeliotis T, Garbis SD, Ntzouni M, Margaritis LH, et al. Cell-produced alpha-synuclein is secreted in a calcium-dependent manner by exosomes and impacts neuronal survival. J Neurosci 2010; 30: 6838–51. [DOI] [PMC free article] [PubMed] [Google Scholar]
- Fader CM, Sanchez DG, Mestre MB, Colombo MI.. TI-VAMP/VAMP7 and VAMP3/cellubrevin: two v-SNARE proteins involved in specific steps of the autophagy/multivesicular body pathways. Biochim Biophys Acta 2009; 1793: 1901–16. [DOI] [PubMed] [Google Scholar]
- Fanciulli A, Wenning GK.. Multiple-system atrophy. N Engl J Med 2015; 372: 249–63. [DOI] [PubMed] [Google Scholar]
- Fernagut PO, Meissner WG, Biran M, Fantin M, Bassil F, Franconi JM, et al. Age-related motor dysfunction and neuropathology in a transgenic mouse model of multiple system atrophy. Synapse 2014; 68: 98–106. [DOI] [PubMed] [Google Scholar]
- Foulds PG, Mitchell JD, Parker A, Turner R, Green G, Diggle P, et al. Phosphorylated alpha-synuclein can be detected in blood plasma and is potentially a useful biomarker for Parkinson’s disease. FASEB J 2011; 25: 4127–37. [DOI] [PubMed] [Google Scholar]
- Giasson BI, Duda JE, Quinn SM, Zhang B, Trojanowski JQ, Lee VM.. Neuronal alpha-synucleinopathy with severe movement disorder in mice expressing A53T human alpha-synuclein. Neuron 2002; 34: 521–33. [DOI] [PubMed] [Google Scholar]
- Gilman S, Wenning GK, Low PA, Brooks DJ, Mathias CJ, Trojanowski JQ, et al. Second consensus statement on the diagnosis of multiple system atrophy. Neurology 2008; 71: 670–6. [DOI] [PMC free article] [PubMed] [Google Scholar]
- Grey M, Dunning CJ, Gaspar R, Grey C, Brundin P, Sparr E, et al. Acceleration of alpha-synuclein aggregation by exosomes. J Biol Chem 2015; 290: 2969–82. [DOI] [PMC free article] [PubMed] [Google Scholar]
- Guix FX, Corbett GT, Cha DJ, Mustapic M, Liu W, Mengel D, et al. Detection of aggregation-competent tau in neuron-derived extracellular vesicles. Int J Mol Sci 2018; 19: 663. [DOI] [PMC free article] [PubMed] [Google Scholar]
- Hansson O, Janelidze S, Hall S, Magdalinou N, Lees AJ, Andreasson U, et al. Blood-based NfL: a biomarker for differential diagnosis of Parkinsonian disorder. Neurology 2017; 88: 930–7. [DOI] [PMC free article] [PubMed] [Google Scholar]
- Hong Z, Shi M, Chung KA, Quinn JF, Peskind ER, Galasko D, et al. DJ-1 and alpha-synuclein in human cerebrospinal fluid as biomarkers of Parkinson’s disease. Brain 2010; 133: 713–26. [DOI] [PMC free article] [PubMed] [Google Scholar]
- Howitt J, Hill AF.. Exosomes in the pathology of neurodegenerative diseases. J Biol Chem 2016; 291: 26589–97. [DOI] [PMC free article] [PubMed] [Google Scholar]
- Jackson EK, Gillespie DG, Mi Z, Cheng D, Bansal R, Janesko-Feldman K, et al. Role of 2’,3’-cyclic nucleotide 3’-phosphodiesterase in the renal 2’,3’-cAMP-adenosine pathway. Am J Physiol Renal Physiol 2014; 307: F14–24. [DOI] [PMC free article] [PubMed] [Google Scholar]
- Jellinger KA. Neuropathology and pathophysiology of multiple system atrophy. Neuropathol Appl Neurobiol 2012; 38: 379–80; author reply 81. [DOI] [PubMed] [Google Scholar]
- Jellinger KA, Lantos PL.. Papp-Lantos inclusions and the pathogenesis of multiple system atrophy: an update. Acta Neuropathol 2010; 119: 657–67. [DOI] [PubMed] [Google Scholar]
- Jin H, Ishikawa K, Tsunemi T, Ishiguro T, Amino T, Mizusawa H.. Analyses of copy number and mRNA expression level of the alpha-synuclein gene in multiple system atrophy. J Med Dent Sci 2008; 55: 145–53. [PubMed] [Google Scholar]
- Kahle PJ, Neumann M, Ozmen L, Muller V, Jacobsen H, Spooren W, et al. Hyperphosphorylation and insolubility of alpha-synuclein in transgenic mouse oligodendrocytes. EMBO Rep 2002; 3: 583–8. [DOI] [PMC free article] [PubMed] [Google Scholar]
- Kaji S, Maki T, Kinoshita H, Uemura N, Ayaki T, Kawamoto Y, et al. Pathological endogenous alpha-synuclein accumulation in oligodendrocyte precursor cells potentially induces inclusions in multiple system atrophy. Stem Cell Rep 2018; 10: 356–65. [DOI] [PMC free article] [PubMed] [Google Scholar]
- Karabiyik C, Lee MJ, Rubinsztein DC.. Autophagy impairment in Parkinson’s disease. Essays Biochem 2017; 61: 711–20. [DOI] [PubMed] [Google Scholar]
- Kurihara T, Tsukada Y.. The regional and subcellular distribution of 2’,3’-cyclic nucleotide 3’-phosphohydrolase in the central nervous system. J Neurochem 1967; 14: 1167–74. [DOI] [PubMed] [Google Scholar]
- Laurens B, Constantinescu R, Freeman R, Gerhard A, Jellinger K, Jeromin A, et al. Fluid biomarkers in multiple system atrophy: a review of the MSA biomarker initiative. Neurobiol Dis 2015; 80: 29–41. [DOI] [PubMed] [Google Scholar]
- Lin X, Cook TJ, Zabetian CP, Leverenz JB, Peskind ER, Hu SC, et al. DJ-1 isoforms in whole blood as potential biomarkers of Parkinson disease. Sci Rep 2012; 2: 954. [DOI] [PMC free article] [PubMed] [Google Scholar]
- Majbour NK, Vaikath NN, Eusebi P, Chiasserini D, Ardah M, Varghese S, et al. Longitudinal changes in CSF alpha-synuclein species reflect Parkinson’s disease progression. Mov Disord 2016; 31: 1535–42. [DOI] [PubMed] [Google Scholar]
- Majbour NK, Vaikath NN, van Dijk KD, Ardah MT, Varghese S, Vesterager LB, et al. Oligomeric and phosphorylated alpha-synuclein as potential CSF biomarkers for Parkinson’s disease. Mol Neurodegener 2016; 11: [DOI] [PMC free article] [PubMed] [Google Scholar]
- Miller DW, Johnson JM, Solano SM, Hollingsworth ZR, Standaert DG, Young AB.. Absence of alpha-synuclein mRNA expression in normal and multiple system atrophy oligodendroglia. J Neural Transm 2005; 112: 1613–24. [DOI] [PubMed] [Google Scholar]
- Mokretar K, Pease D, Taanman JW, Soenmez A, Ejaz A, Lashley T, et al. Somatic copy number gains of alpha-synuclein (SNCA) in Parkinson’s disease and multiple system atrophy brains. Brain 2018; 141: 2419–31. [DOI] [PubMed] [Google Scholar]
- Mustapic M, Eitan E, Werner JK Jr., Berkowitz ST, Lazaropoulos MP, Tran J, et al. Plasma extracellular vesicles enriched for neuronal origin: a potential window into brain pathologic processes. Front Neurosci 2017; 11: 278. [DOI] [PMC free article] [PubMed] [Google Scholar]
- Ngolab J, Trinh I, Rockenstein E, Mante M, Florio J, Trejo M, et al. Brain-derived exosomes from dementia with Lewy bodies propagate alpha-synuclein pathology. Acta Neuropathol Commun 2017; 5: 46. [DOI] [PMC free article] [PubMed] [Google Scholar]
- Ohmichi T, Mitsuhashi M, Tatebe H, Kasai T, Ali El-Agnaf OM, Tokuda T. Quantification of brain-derived extracellular vesicles in plasma as a biomarker to diagnose Parkinson’s and related diseases. Parkinsonism Relat Disord 2019; 61: 82–7. [DOI] [PubMed] [Google Scholar]
- Pagany M, Jagodic M, Schubart A, Pham-Dinh D, Bachelin C, Baron van Evercooren A, et al. Myelin oligodendrocyte glycoprotein is expressed in the peripheral nervous system of rodents and primates. Neurosci Lett 2003; 350: 165–8. [DOI] [PubMed] [Google Scholar]
- Perez-Rodriguez D, Kalyva M, Leija-Salazar M, Lashley T, Tarabichi M, Chelban V, et al. Investigation of somatic CNVs in brains of synucleinopathy cases using targeted SNCA analysis and single cell sequencing. Acta Neuropathol Commun 2019; 7: 219. [DOI] [PMC free article] [PubMed] [Google Scholar]
- Piper RC, Katzmann DJ.. Biogenesis and function of multivesicular bodies. Annu Rev Cell Dev Biol 2007; 23: 519–47. [DOI] [PMC free article] [PubMed] [Google Scholar]
- Refolo V, Bez F, Polissidis A, Kuzdas-Wood D, Sturm E, Kamaratou M, et al. Progressive striatonigral degeneration in a transgenic mouse model of multiple system atrophy: translational implications for interventional therapies. Acta Neuropathol Commun 2018; 6: 2. [DOI] [PMC free article] [PubMed] [Google Scholar]
- Reyes JF, Rey NL, Bousset L, Melki R, Brundin P, Angot E.. Alpha-synuclein transfers from neurons to oligodendrocytes. Glia 2014; 62: 387–98. [DOI] [PubMed] [Google Scholar]
- Sevlever D, Jiang P, Yen SH.. Cathepsin D is the main lysosomal enzyme involved in the degradation of alpha-synuclein and generation of its carboxy-terminally truncated species. Biochemistry 2008; 47: 9678–87. [DOI] [PMC free article] [PubMed] [Google Scholar]
- Shi M, Bradner J, Hancock AM, Chung KA, Quinn JF, Peskind ER, et al. Cerebrospinal fluid biomarkers for Parkinson disease diagnosis and progression. Ann Neurol 2011; 69: 570–80. [DOI] [PMC free article] [PubMed] [Google Scholar]
- Shi M, Kovac A, Korff A, Cook TJ, Ginghina C, Bullock KM, et al. CNS tau efflux via exosomes is likely increased in Parkinson’s disease but not in Alzheimer’s disease. Alzheimers Dement 2016; 12: 1125–31. [DOI] [PMC free article] [PubMed] [Google Scholar]
- Shi M, Liu C, Cook TJ, Bullock KM, Zhao Y, Ginghina C, et al. Plasma exosomal alpha-synuclein is likely CNS-derived and increased in Parkinson’s disease. Acta Neuropathol 2014; 128: 639–50. [DOI] [PMC free article] [PubMed] [Google Scholar]
- Shi M, Zabetian CP, Hancock AM, Ginghina C, Hong Z, Yearout D, et al. Significance and confounders of peripheral DJ-1 and alpha-synuclein in Parkinson’s disease. Neurosci Lett 2010; 480: 78–82. [DOI] [PMC free article] [PubMed] [Google Scholar]
- Shifrin DA Jr, Demory Beckler M, Coffey RJ, Tyska MJ.. Extracellular vesicles: communication, coercion, and conditioning. Mol Biol Cell 2013; 24: 1253–9. [DOI] [PMC free article] [PubMed] [Google Scholar]
- Soria FN, Pampliega O, Bourdenx M, Meissner WG, Bezard E, Dehay B.. Exosomes, an unmasked culprit in neurodegenerative diseases. Front Neurosci 2017; 11: 26. [DOI] [PMC free article] [PubMed] [Google Scholar]
- Spencer B, Kim C, Gonzalez T, Bisquertt A, Patrick C, Rockenstein E, et al. Alpha-synuclein interferes with the ESCRT-III complex contributing to the pathogenesis of Lewy body disease. Hum Mol Genet 2016; 25: 1100–15. [DOI] [PMC free article] [PubMed] [Google Scholar]
- Spillantini MG, Schmidt ML, Lee VM, Trojanowski JQ, Jakes R, Goedert M.. Alpha-synuclein in Lewy bodies. Nature 1997; 388: 839–40. [DOI] [PubMed] [Google Scholar]
- Sprinkle TJ. 2’,3’-cyclic nucleotide 3’-phosphodiesterase, an oligodendrocyte-Schwann cell and myelin-associated enzyme of the nervous system. Crit Rev Neurobiol 1989; 4: 235–301. [PubMed] [Google Scholar]
- Stuendl A, Kunadt M, Kruse N, Bartels C, Moebius W, Danzer KM, et al. Induction of alpha-synuclein aggregate formation by CSF exosomes from patients with Parkinson’s disease and dementia with Lewy bodies. Brain 2016; 139: 481–94. [DOI] [PMC free article] [PubMed] [Google Scholar]
- Thery C, Zitvogel L, Amigorena S.. Exosomes: composition, biogenesis and function. Nat Rev Immunol 2002; 2: 569–79. [DOI] [PubMed] [Google Scholar]
- Ubhi K, Low P, Masliah E.. Multiple system atrophy: a clinical and neuropathological perspective. Trends Neurosci 2011; 34: 581–90. [DOI] [PMC free article] [PubMed] [Google Scholar]
- Verrier JD, Jackson TC, Gillespie DG, Janesko-Feldman K, Bansal R, Goebbels S, et al. Role of CNPase in the oligodendrocytic extracellular 2’,3’-cAMP-adenosine pathway. Glia 2013; 61: 1595–606. [DOI] [PMC free article] [PubMed] [Google Scholar]
- Wang Y, Shi M, Chung KA, Zabetian CP, Leverenz JB, Berg D, et al. Phosphorylated alpha-synuclein in Parkinson’s disease. Sci Transl Med 2012; 4: 121ra20. [DOI] [PMC free article] [PubMed] [Google Scholar]
- Wei Y, Wang D, Jin F, Bian Z, Li L, Liang H, et al. Pyruvate kinase type M2 promotes tumour cell exosome release via phosphorylating synaptosome-associated protein 23. Nat Commun 2017; 8: 14041. [DOI] [PMC free article] [PubMed] [Google Scholar]
- Winslow AR, Rubinsztein DC.. The Parkinson disease protein alpha-synuclein inhibits autophagy. Autophagy 2011; 7: 429–31. [DOI] [PMC free article] [PubMed] [Google Scholar]
- Yanez-Mo M, Siljander PR, Andreu Z, Zavec AB, Borras FE, Buzas EI, et al. Biological properties of extracellular vesicles and their physiological functions. J Extracell Vesicles 2015; 4: 27066. [DOI] [PMC free article] [PubMed] [Google Scholar]
- Zhang W, Wang T, Pei Z, Miller DS, Wu X, Block ML, et al. Aggregated alpha-synuclein activates microglia: a process leading to disease progression in Parkinson’s disease. FASEB J 2005; 19: 533–42. [DOI] [PubMed] [Google Scholar]
Associated Data
This section collects any data citations, data availability statements, or supplementary materials included in this article.
Supplementary Materials
Data Availability Statement
The authors are willing to provide the raw data related to this manuscript upon request.