

Abstract
Background:
Clinical stretching is frequently recommended for iliotibial band syndrome management. Current literature lacks conclusive findings regarding isolated human iliotibial band tissue elongation and stiffness behaviors. Applying clinical-grade stretching force results to iliotibial band tissue behavior is thus challenging.
Purpose:
This study's objectives were to determine isolated iliotibial band tissue tensile behaviors during tension-to-failure testing and to relate the results to previously reported iliotibial band stretch findings.
Study Design:
Descriptive in vitro laboratory study.
Methods:
Ten isolated un-embalmed iliotibial band specimens were exposed to tension-to-failure testing using a 10kN material testing system. Peak load, load at yield point, and ultimate failure load were measured in Newtons. Corresponding absolute (mm) and relative (%) tissue deformation was recorded. Load-deformation curves were established to calculate iliotibial band stiffness (N/mm).
Results:
A mean peak load of 872.8 ± 285.9N and resulting 9.0 ± 3.9% tissue deformation from initial length was recorded. An 805.5 ± 249.7N mean load at yield point and resulting 7.0 ± 1.9% tissue deformation was observed. A 727.6 ± 258.4N mean load was recorded directly prior to ultimate tissue failure. Mean tissue deformation at ultimate failure was 11.3 ± 4.2%. Mean iliotibial band system stiffness was 27.2 ± 4.5N/mm.
Conclusion:
The iliotibial band can withstand substantial tensile forces. Clinical stretching forces likely fall within the load-deformation curve elastic region and may not result in permanent iliotibial band tissue deformation. Sustained elongation resulting from stretching the ITB may require substantial patient compliance. Future studies should investigate potential underlying factors related to positive symptom relief from iliotibial band stretching that include immunological responses, fluid accumulation, altered proprioception, and pain perception.
Level of Evidence:
3
Keywords: Iliotibial band, load-to-failure testing, stiffness, tensile behaviors
INTRODUCTION
The iliotibial band (ITB) is a complex structure located in the lateral thigh and composed of longitudinally aligned fascial connective tissue presenting with major interconnections with the ilium, femur, patella, and tibia.1,2 It arises proximally through fiber consolidation with the tensor fascia latae (TFL) muscle anteriorly, gluteal aponeurotic fascia centrally, and gluteus maximus muscle fibers posteriorly.1-4 The proximal ITB can be divided in three layers.5 The superficial layer originates from the cranial iliac crest anterior to the gluteal aponeurotic fascia origin, while the intermediate layer arises from the ilium just below the TFL origin.6 The deep layer arises from the supraacetabular fossa.3 These ITB layers combine with the TFL´s distal tendinous end and continue distally, passing over the greater trochanter without attaching to it.3,6 Along this course the ITB is firmly attached to the femur´s linea aspera via the lateral intermuscular septum.1,3 The ITB finally terminates across five insertions at the lateral knee:1-3,6 (1) The distal femur´s linea aspera; (2) The superior aspect of the lateral femoral epicondyle; (3) Gerdy´s tubercle and its surrounding bone; (4) The patella, confluent with the lateral retinaculum and lateral patellofemoral ligament; and (5) A capsular-osseous tibial insertion adjacent to Gerdy´s tubercle.1,3,6
Iliotibial band syndrome (ITBS) is one of the most common atraumatic overuse injuries at the lateral knee,3,7-9 occurring in 12-25% of runners and 12.5% of cyclists,9,10 based on cyclic loading during both sports.10,11 The exact underlying causes of ITBS have been debated.3,7,12-18 Investigators concluded that the syndrome's etiology may be multifactorial in nature. Selected authors have suggested an anterior-posterior ITB friction over the lateral femoral epicondyle producing inflammation of either the ITB tissue itself or highly-innervated tissues located deep to the ITB.19,20 Other authors agree on the inflammation model but accredit such inflammation and the resulting tissue damage and pain to ITB medial-lateral compression against the lateral femoral epicondyle occurring during knee movements.16,17,21
Iliotibial band syndrome is almost always managed non-surgically.3,21 While various different physical therapy and manual therapy treatment methods have been postulated, clinical stretching appears most frequently as a prevalent ITBS treatment demonstrating clinical benefit.18,22-25 Stretching seems to be a logical treatment approach at first glance given that several authors have advocated the idea that ITBS symptoms may be associated with ITB shortening or tightness.24,26-29 However, the effect of clinical stretching has been challenged by various authors who suggest that any ITB lengthening confirmed in previous studies22,23 may have more likely been an apparent elongation versus a true ITB tissue lengthening due to flawed measurement protocols.21 Gratz30 investigated the tensile properties of human TFL muscle and found similarities with those of “soft steel”, based on its tendon-like histologic structure comprised of an inconspicuous number of elastic fibers.16 Wilhelm et al31 recently examined the ITB-TFL complex deformation response to clinical-grade stretching. They concluded that perceived clinical benefits from short-term ITB-TFL complex stretching focus on elastic tissue response occurring in the proximity of the TFL.31 However, including the TFL in the tested tissue limits the ability to translate Wilhelm et al31 findings to understanding ITB tissue tensile properties. Currently, there are no conclusive findings in the literature regarding the ITB´s isolated elongation and stiffness properties. Therefore, the objective of this study was to determine the isolated tensile behaviors of human ITB tissue during a tension-to-failure test in order to answer the following questions: (1) What is the peak load (N) that the ITB can withstand and at what deformation does this occur? (2) At what load and deformation does the tissue behavior change from elastic to plastic deformation? (3) At what load does ITB tissue fail and what deformation value is recorded at this ultimate failure point? and (4) How do the recorded deformation values compare to deformation values previously documented during a simulated clinical ITB stretch?
MATERIALS AND METHODS
Research Design
This study was a descriptive laboratory study with an in vitro observational design.
Specimen
Ten un-embalmed human cadaveric ITB specimens (3 male and 6 female, one unidentified) with a mean age of 83 (SD ± 8 years, range 73 to 95) years at time of death comprised the study sample. All cadaveric specimens used for this study were provided by the Texas Tech University Health Sciences Center Willed-Body Program and the study was conducted in the Clinical Anatomy Research Laboratory within the Texas Tech University Health Sciences Center. All specimens were handled in accordance with Texas Tech University policy and regulations as determined by the Texas State Anatomical Board. Data collection was completed using one left-sided and nine right-sided ITB specimens. In order to be included for in vitro testing, the ITB had to be free of observable abnormalities or damage at the time of testing.
Pre-Measurement Preparation
Cadavers were stored at 3.9 °C prior to ITB specimen collection. To harvest the ITB in its entirety, the ITB-TFL complex was exposed from the iliac crest to Gerdy´s tubercle. An incision was made beginning 5cm cranial to the iliac crest and continued to approximately 5cm below Gerdy´s tubercle. The skin and subcutaneous tissues were reflected laterally, being careful not to disrupt ITB-TFL complex fibers. Next, the ITB-TFL complex was separated from the underlying structures by cutting the lateral intermuscular septum. Gerdy's tubercle, with the distal ITB, was removed from the tibia using a bone saw. A small portion of the iliac crest (from the ASIS to the posterior edge of the proximal ITB) was removed using a bone saw, completing the ITB-TFL complex removal.
Tissue preparation
Once harvested, cadaveric ITB-TFL complexes were enveloped with plastic wrap and stored at -18 °C. Twelve hours prior to tissue behavior testing, each ITB-TFL complex specimen was transferred to another storage device, and allowed to warm to 3.9 °C. Four hours prior to data collection, specimens were allowed to warm to room temperature (i.e. 20 °C). Once warmed to 20 °C, TFL muscle, left-over gluteus maximus fibers, and other excess soft tissue that could have altered the ITB tissue´s mechanical behaviors were carefully dissected from the specimens. The ITB was then gently cleaned using a soft cloth and 70% isopropyl alcohol solution. After cleansing, each specimen was again visually inspected for any observable tissue damage or abnormality. Next, the distal and proximal ends of each specimen were secured in the Material Testing System (MTS; MTS Systems Corporation, Eden Prairie, MN, USA) using custom-built clamping devices to prevent the isolated ITB tissue from slipping during testing (Figure 1). This approach has been shown to work well in a previous study.31 All ITB specimens were kept moist throughout the process using normal saline solution.
Figure 1.
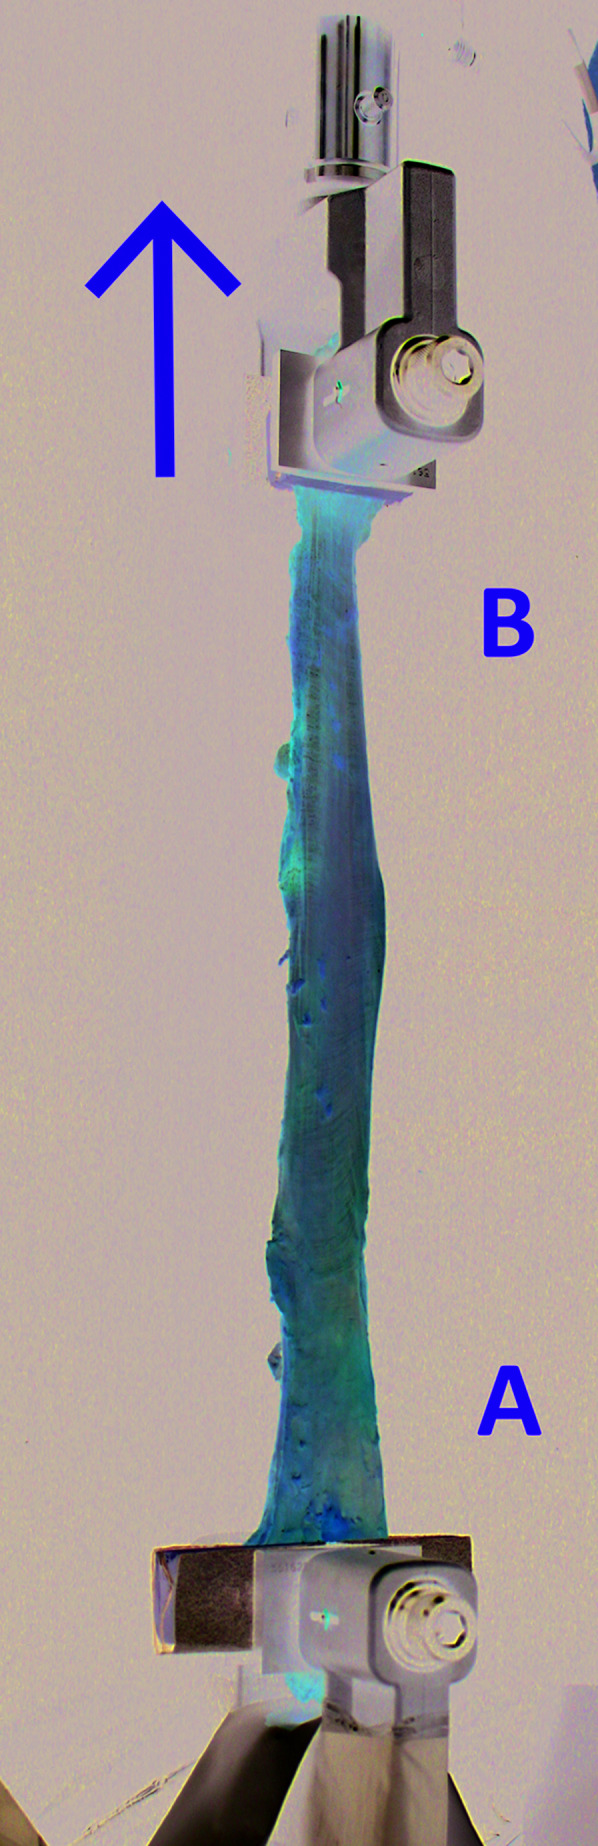
Mounting of the iliotibial band in the Materials Testing System (MTS). A= Proximal ITB; B= Distal ITB; Arrow represents direction of MTS tension force from above.
Anatomical measurements
Prior to mechanical testing, length measurements (mm) were taken using a commercially available tape measure overlaid on the tissue after mounting the specimens in the MTS but without any measurable force (0 N) exerted on the specimens. Length of the specimen was defined as the distance between the two clamping devices. Each specimen was measured three times by the same investigator and the results were averaged.
Mechanical testing
After preparation, each ITB specimen was mounted in the 10 kN MTS using the aforementioned custom-build clamping devices. Specimens were fixed in the MTS with sufficient tension to eliminate slack while at the same time avoiding any measurable longitudinal stretch. Specimens were aligned so that uniaxial tensile forces generated from the MTS were applied along the specimens´ longitudinal axis (Figure 1). Specimens were tension loaded to failure at a strain rate of 5 mm/s with the sampling rate set at 10 Hz. A manual stop was used once the investigator saw obvious tissue damage and the resistance force dropped rapidly. Load and elongation values were recorded throughout ITB tension loading by the MTS. Additionally, the investigators recorded each specimen's individual tissue failure location. Specimens were excluded if either the distal or proximal ends of the tissue slipped within the custom-made clamping devices, thus disrupting data collection.
Data analysis
Data analyses were conducted using SPSS version 25 (IBM Corp., Armonk, NY, USA). Sample demographic characteristics were summarized using descriptive statistics.
Descriptive analysis was used to calculate the peak load (N), load at the yield point (N) and load at ultimate failure (N). Peak load was defined as the maximum load that the tissue could withstand. The yield point marks the fibers’ elasticity limit. Prior to reaching the yield point tensioned tissue will return to its original length upon load release. Any further tissue tensioning beyond the yield point will lead to plastic tissue deformation. Such plastic tissue deformation is irreversible and may be accompanied by incipient fiber damage in terms of tissue micro-fractures.32 Consequently, the yield point load in the current study was defined as the load that was reached at the point of transition from elastic to plastic tissue behavior, thus representing the point of first ITB fiber micro-failure.32 Finally, ultimate failure load in the current study was defined as the load acting on the ITB specimen directly before its actual failure, i.e. complete tissue rupture. In addition, the corresponding absolute (mm) and relative (%) tissue deformation for each aforementioned value was calculated. Furthermore, load deformation curves were established for each specimen. Load values (N) were plotted on the y-axis while deformation values (mm) were depicted on the x-axis. These plots were used to calculate the slope of each curve representing system stiffness (i.e. ITB tissue stiffness from clamp to clamp). The following formula was used to calculate the load deformation curves´ slope (m):
where delta y equals the ratio of change in applied load (N; vertical change) and delta x equals the ratio of change in ITB tissue elongation (mm; horizontal change).
RESULTS
No cadaveric host showed evidence of previous injury or surgery in the hip-thigh-knee area. Moreover, no signs of ITB abnormality or damage were witnessed during careful visual gross inspection. The ITB showed three failure modes: (1) one ITB failed at the specimen´s distal third, (2) one failed at the specimen´s middle third, and (3) seven specimens failed at the proximal third. Failure location was not recorded for one specimen. No specimen had to be excluded due to slipping within the custom-made clamping devices.
The mean initial ITB length was 420.9 ± 55.2 mm. Biomechanical data for each tested specimen are summarized in Tables 1 and 2. The mean peak load that the ITB could withstand during tension-to-failure testing was 872.8 ± 285.9 N (range 375.7 - 1262.8 N; 95% CI 668.2; 1077.3 N). Mean ITB elongation at peak load was 35.9 ± 11.7 mm (range 19.1 – 62.7 mm; 95% CI 27.5; 44.3mm). Such an elongation value reflects a 9.0 ± 3.9 % tissue deformation (range 4.5 - 18.9%; 95% CI 6.2; 11.7%) from initial length at peak load. Mean load at the tissues´ yield point was 805.5 ± 249.7 N (range 375.7 - 1262.8 N; 95% CI 594.6; 1016.3N). Mean ITB elongation at the yield point was 28.5 ± 7.8 mm (range 19.1 - 42.8 mm; 95% CI 22.9; 34.1 mm) reflecting a 7.0 ± 1.9% deformation (range 4.5 – 18.9 %; 95% CI 5.6; 8.3%) at the point of transition from elastic to plastic tissue deformation. The mean load at ultimate ITB failure was 727.6 ± 258.4 N (range 331.6 – 1253.1 N; 95% CI 542.8; 912.5 N). Before ultimately failing, the ITB reached a mean absolute elongation of 45 ± 12.1 mm (range 28.2 – 70.8 mm; 95% CI 36.6; 53.8 mm), reflecting an 11.3 ± 4.2 % tissue deformation (range 6.0 – 21.3%; 95% CI 8.3; 14.3 %) from initial ITB length at failure.
Table 1.
Individual specimens´ values for load and absolute deformation.
| Specimen # | Load (N) | Deformation (mm) | ||||
|---|---|---|---|---|---|---|
| Peak load | Load at yield point | Load at ultimate failure point | At peak load | At yield point | At ultimate failure | |
| 1 | 863.2 | 703.1 | 725.5 | 33.1 | 24.5 | 36.0 |
| 3 | 1262.8 | 1262.8 | 1253.1 | 42.8 | 42.8 | 43.8 |
| 4 | 556.9 | 546.1 | 516.6 | 32.6 | 24.6 | 42.6 |
| 5 | 1152.6 | 1109.7 | 916.2 | 38.0 | 35.5 | 41.5 |
| 6 | 870.4 | 870.9 | 748.6 | 38.7 | 38.7 | 42.7 |
| 9 | 1178.0 | 1162.5 | 590.6 | 29.1 | 28.6 | 52.1 |
| 10 | 634.4 | 624.5 | 521.1 | 25.7 | 25.2 | 28.2 |
| 11 | 375.7 | 375.7 | 331.6 | 19.1 | 19.1 | 57.1 |
| 12 | 869.3 | 575.7 | 869.3 | 37.2 | 21.2 | 37.2 |
| 13 | 964.7 | 823.9 | 803.8 | 62.7 | 25.3 | 70.8 |
| MEAN | 872.8 | 805.5 | 727.6 | 35.9 | 28.5 | 45.0 |
Table 2.
Individual specimens´ values for ITB stiffness.
| Specimen # | Stiffness (N/mm) |
|---|---|
| 1 | 33.1 |
| 3 | 30.7 |
| 4 | 27.2 |
| 5 | 31.5 |
| 6 | 23.3 |
| 9 | 26.3 |
| 10 | 22.9 |
| 11 | 19.9 |
| 12 | 25.1 |
| 13 | 32.3 |
| MEAN | 27.2 |
Mean ITB system stiffness was 27.2 ± 4.5 N/mm (range 19.9 – 33.1 N/mm; 95% CI 24.0; 30.5 N/mm). Figure 2 shows the percent deformation in relation to the applied load during load-to-failure testing for each specimen.
Figure 2.

Individual specimens´ load-deformation-curve; N= Newton, %= percent elongation.
DISCUSSION
Individual failure characteristics of isolated full-length human ITB tissue have not been well defined within the literature despite the ITB´s biomechanical importance as an antagonist for bending forces acting on the femur during loading,6 lateral knee stabilizer, and hip centralizer.1,3,4,6 While several recent studies attempted to address the tensile properties of selected ITB fibers,33,34 the present study aimed to investigate the biomechanical behaviors of isolated human ITB tissue in its entirety. The resulting mean peak load of 872.8 ± 285.9 N found during a tension-to-failure testing suggest that the human ITB can withstand substantial tensile forces. These findings agree with Birnbaum et al6 who reported a maximum load of 860 N sustained from full-length ITB specimen during uniaxial tension-to-failure testing. The current data, however, differ from Rahnemai-Azar et al33 who tension-loaded a 15 cm long and 1 cm wide strip of isolated ITB tissue that was left attached to its insertion at Gerdy´s tubercle. These authors found ultimate loads of only 487.9 ± 156.9 N. Smaller maximum sustained loads, compared to the current study, were also found by Godin et al34 who tensioned the proximal and distal Kaplan fibers of the ITB and found values of only 71.3 N and 170 N, respectively. However, the observed differences of ITB biomechanical behavior during testing of only small parts or selected fibers instead of the entire structure are not surprising. There is a known correlation between load bearing capacities of tendons, ligaments, and muscles and their cross-sectional area, where the ability to withstand loads increases with increase in the tendon´s, ligament´s or muscle´s cross-sectional area.32
The current investigation revealed a mean ITB system stiffness of 27.2 ± 4.5 N/mm. Tissue stiffness is defined as the force-to-displacement ratio in a given system, thus the tissue´s resistance to deformation.35 The current data are in accordance with Birnbaum et al6 who found mean ITB stiffness values of 17 N/mm extension. Moreover, similar stiffness could be found for the proximal and distal Kaplan fibers.34 Mean stiffness reported for the proximal and distal Kaplan fibers was 22.6 N/mm and 36.3 N/mm, respectively.34 In contrast, mean ITB tissue stiffness documented by Rahnemai-Azar et al33 was considerably greater. With 73.2 ± 24.1 N/mm these authors found a nearly three times higher stiffness compared to the current data. The differences could possibly be explained by the different testing procedures and specimen age range. Rahnemai-Azar et al33 tested a graft-mimicking ITB strip of only 15 cm length and 1 cm width including the distal bony attachment. Conversely, Birnbaum et al6 and the current study clamped isolated ITB tissue without bony attachments into the biomechanical testing apparatus. In addition, the higher stiffness values reported by Rahnemai-Azar and colleagues33 were found in markedly younger specimens compared to the current study's sample. Although reported results regarding age-related changes in tendon biomechanical behavior are conflicting,36 different authors have found lower tendon stiffness with increasing age.37 It could be speculated that younger donors may have been physically more active prior to death. Tissue biomechanical properties that include tensile stiffness and modulus adapt to increased loading.37 Such loading may help explain findings from Rahnemai-Azar et al.33
Current study specimen preparation was not standardized according to other investigators. While standardization may have allowed easier direct comparison to other load-to-failure studies, the authors decided against such procedure to further examine the utility of ITB stretching on structural tissue behaviors as a follow up to Wilhelm et al,31 who examined the ITB-TFL complex deformation response to a clinical-grade stretching. From their results, the authors concluded that short-term ITB stretching focuses on an elastic response in the TFL region.31 However, including the TFL when mechanically testing potentially limits the understanding of stretching's direct impact on ITB tissue tensile behaviors.
The current study reports 9.0% average ITB deformation from its initial length at peak loading and a 7.0% average deformation at the tissues´ yield point. These data are considerably higher than reported ITB deformation that could be achieved in response to clinical loading. Falvey et al21 observed a 0.2% ITB elongation through ultrasound during a maximum voluntary hip abduction contraction. Conversely, Wilhelm et al31 reported a clinically applied ITB stretching maneuver to produce a 2.3% average ITB-TFL complex elongation. These authors found that the majority of the observed elongation occurred in the proximal region containing TFL muscular fibers, accompanied by only 1.4% and 1.7% elongation observed in the ITB´s middle and distal regions, respectively. The current study´s results confirm the conjecture of Wilhelm et al31 that a clinical stretching load application would fall within the elastic region of the ITB load-deformation curve. The elastic region indicates the tensile range in which human ITB tissue will lengthen, yet maintain the ability to return to its original length upon removal of the load.38 These outcomes necessitate consistent patient compliance in order to allow for new collagen deposition in a stretched range over time.
Other investigators have reported much larger in vivo elongation values (9.8 - 11%) in response to clinical ITB stretching, measured through superficially located reflective skin marker measurements.23 The disparity between those findings and those of Wilhelm et al31 and Falvey et al21 may reflect measurement strategy differences. Moreover, a tissue's yield point represents the point of transition from elastic to plastic tissue behavior and first fiber failure due to microdamage.32,35 The current study's 7.0% ITB elongation findings at yield point support Wilhelm et al31 and Falvey et al21 clinical findings over Fredericson et al,23 suggesting that their reported 9.8-11% clinical elongation values without tissue damage are unrealistic.
One must ask why the peak load during tensile testing is higher than the load measured at the ultimate failure point, i.e. directly before a full rupture. This can be explained by the concept of tissue “necking.” Somewhere in this region the highest possible load that the tissue can resist (i.e. peak load) is recorded. At one point of further loading within the plastic region, the area of least tissue stiffness starts to decrease in width, where the tissue initiates such “necking.” Tissue plastic deformation concentrates on that particular weak point and tissue micro failure begins.32 However, in tendons and ligaments the tissue's continuity is further preserved despite these partial fiber ruptures, thus the tissue can still resist a certain degree of tension before it completely ruptures (i.e. reaches its ultimate failure point). At this point, the resisted loads are not as great as the maximum load that the tissue could resist with all fibers intact.
Current study findings and conclusions caution the clinician from expecting permanent ITB tissue extensibility changes when using clinical ITB stretching. However, this study did not examine the effects of prolonged ITB stretching loads (static or repetitive) on the same parameters. Future research should examine the effects of longer stretch holding times, increased repetitions, and patients’ compliance with stretching protocols before conclusions are drawn regarding the utility of ITB stretching for clinical outcomes in vivo. Additionally, other factors should be considered with respect to ITB stretching in ITBS patients that include the influence of stretching on: (1) biomechanical response of neighboring muscles or fascia, along with the hip joint capsule itself;39 (2) local immunologic responses;40 (3) tissue metabolic reactions;41 and (4) subsequent neuro-motor-control modifications in the hip complex. Any combination of a number of these factors could produce changes in the clinical status of ITBS patients.
LIMITATIONS
The current study presents with limitations. First, cadaveric tissue ITB biomechanical behavior may not represent in vivo tissue responses. However, similar tension-to-failure investigations would not be possible in living subjects. Thus, in order for the current study to approximate in vivo tissue properties, un-embalmed specimens were used. Furthermore, uniaxial tissue tensioning as used in the current study may not fully represent the tissue's response to the multi-axial loading found in vivo. However, even during three-dimensional loading in vivo the prevailing tissue extension will occur in the direction of main fiber alignment,32,42 that is - with regard to the ITB - the longitudinal direction.16 In addition, this study used an older specimen population without knowledge of donor activity prior to death. Age and physical activity may have an impact on different tissues´ biomechanical properties.36,37,43-45 However, little consensus has yet been established regarding the relationship between aging and tissue biomechanical changes.36 Selected authors state that tendon tissue's ability to withstand mechanical force declines with the aging process.37 Perhaps the inextensibility of the tendon-like ITB would presumably be even higher in a younger population, suggesting the need for studies in younger tissue to improve current study applicability to a broader population. Finally, the current ITB specimens were from individuals who were most likely not suffering from any ITB pathology prior to death. Thus, any transfer of the current data to pathologically altered ITB tissue would be premature.
CONCLUSION
The results from this tension-to-failure testing study suggest that the human ITB can withstand substantial tensile forces. Clinical stretches to the ITB most likely fall within the elastic region of the tissue's load-deformation curve and do not likely result in permanent tissue deformation. Consequently, the mechanisms related to positive symptom relief from ITB stretching may be influenced by additional underlying factors that should be investigated in future studies in order to establish sound evidence for ITBS management.
REFERENCES
- 1.Vieira ELC Vieira EÁ Teixeira da Silva R, et al. An anatomic study of the iliotibial tract. Arthroscopy. 2007;23(3):269-274. [DOI] [PubMed] [Google Scholar]
- 2.Kaplan EB. The iliotibial tract. Clinical and morphological significance. J Bone Joint Surg Am. 1958;40-A(4):817-832. [PubMed] [Google Scholar]
- 3.Flato R Passanante GJ Skalski MR, et al. The iliotibial tract: imaging, anatomy, injuries, and other pathology. Skeletal Radiol. 2017;46(5):1-18. [DOI] [PubMed] [Google Scholar]
- 4.Terry GC Hughston JC Norwood LA. The anatomy of the iliopatellar band and iliotibial tract. Am J Sports Med. 1986;14(1):39-45. [DOI] [PubMed] [Google Scholar]
- 5.Huang BK Campos JC Ghobrial P, et al. Injury of the gluteal aponeurotic fascia and proximal iliotibial band: anatomy, pathologic conditions, and MR Imaging. Radiographics. 2013;33:1437-1452. [DOI] [PubMed] [Google Scholar]
- 6.Birnbaum K Siebert CH Pandorf T, et al. Anatomical and biomechanical investigations of the iliotibial tract. Surg Radiol Anat. 2004;26(6):433-446. [DOI] [PubMed] [Google Scholar]
- 7.Aderem J Louw QA. Biomechanical risk factors associated with iliotibial band syndrome in runners: a systematic review. BMC Musculoskelet Disord. 2015;16(1):1-16. [DOI] [PMC free article] [PubMed] [Google Scholar]
- 8.van der Worp MP van der Horst N de Wijer A, et al. Iliotibial band syndrome in runners: a systematic review. Sports Med. 2012;42(11):969-992. [DOI] [PubMed] [Google Scholar]
- 9.Ellis R Hing W Reid D. Iliotibial band friction syndrome - a systematic review. Man Ther. 2007;12(3):200-208. [DOI] [PubMed] [Google Scholar]
- 10.Holmes JC Pruitt AL Whalen NJ. Iliotibial band syndrome in cyclists. Am J Sports Med. 1993;21(3):419-424. [DOI] [PubMed] [Google Scholar]
- 11.Fredericson M Wolf C. Iliotibial Band Syndrome in Runners. Sports Med. 2005;35(5):451-459. [DOI] [PubMed] [Google Scholar]
- 12.Louw M Deary C. The biomechanical variables involved in the aetiology of iliotibial band syndrome in distance runners - A systematic review of the literature. Phys Ther Sport. 2013;15(1):1-12. [DOI] [PubMed] [Google Scholar]
- 13.Ekman EF Pope T Martin DF, et al. Magnetic resonance imaging of iliotibial band syndrome. Am J Sports Med. 1994;22(6):851-854. [DOI] [PubMed] [Google Scholar]
- 14.Costa ML Shepstone L Darrah C, et al. Immediate full-weight-bearing mobilisation for repaired Achilles tendon ruptures: a pilot study. Injury. 2003;34(11):874-876. [DOI] [PubMed] [Google Scholar]
- 15.Hariri S Savidge ET Reinold MM, et al. Treatment of recalcitrant iliotibial band friction syndrome with open iliotibial band bursectomy: indications, technique, and clinical outcomes. Am J Sports Med. 2009;37(7):1417-1424. [DOI] [PubMed] [Google Scholar]
- 16.Fairclough J Hayashi K Toumi H, et al. The functional anatomy of the iliotibial band during flexion and extension of the knee: implications for understanding iliotibial band syndrome. J Anat. 2006;208:309-316. [DOI] [PMC free article] [PubMed] [Google Scholar]
- 17.Fairclough J Hayashi K Toumi H, et al. Is iliotibial band syndrome really a friction syndrome? J Science Med Sport. 2007;10(2):74-76. [DOI] [PubMed] [Google Scholar]
- 18.Baker RL Souza RB Fredericson M. Iliotibial band syndrome: soft tissue and biomechanical factors in evaluation and treatment. Phys Med Rehabil. 2011;3(6):550-561. [DOI] [PubMed] [Google Scholar]
- 19.Jelsing EJ Finnoff JT Cheville AL, et al. Sonographic evaluation of the iliotibial band at the lateral femoral epicondyle: does the iliotibial band move? J Ultrasound Med. 2013;32(7):1199-1206. [DOI] [PubMed] [Google Scholar]
- 20.Orchard JW Fricker PA Abud AT, et al. Biomechanics of iliotibial band friction syndrome in runners. Am J Sports Med. 1996;24(3):375-379. [DOI] [PubMed] [Google Scholar]
- 21.Falvey EC Clark RA Franklyn-Miller A, et al. Iliotibial band syndrome: an examination of the evidence behind a number of treatment options. Scand J Med Sci Sports. 2010;20(4):580-587. [DOI] [PubMed] [Google Scholar]
- 22.Fredericson M Weir A. Practical management of iliotibial band friction syndrome in runners. Clin J Sport Med. 2006;16(261):261–268. [DOI] [PubMed] [Google Scholar]
- 23.Fredericson M White JJ MacMahon JM, et al. Quantitative analysis of the relative effectiveness of 3 iliotibial band stretches. Arch Phys Med Rehabil. 2002;83(5):589-592. [DOI] [PubMed] [Google Scholar]
- 24.Lavine R. Iliotibial band friction syndrome. Curr Rev Musculoskelet Med. 2010;3(1-4):18-22. [DOI] [PMC free article] [PubMed] [Google Scholar]
- 25.Grau S Krauss I Maiwald C, et al. Kinematic classification of iliotibial band syndrome in runners. Scand J Med Sci Sports. 2011;21(2):184-189. [DOI] [PubMed] [Google Scholar]
- 26.Noble CA. Iliotibial band friction syndrome in runners. Am J Sports Med. 1980;8(4):232-234. [DOI] [PubMed] [Google Scholar]
- 27.Gose JC Schweizer P. Iliotibial band tightness. J Orthop Sports Phys Ther. 1989;10(10):399-407. [DOI] [PubMed] [Google Scholar]
- 28.Muragod A Patil VR Nitsure P. Immediate effect of static stretching versus myofascial release in iliotibial band tightness in long distance runners - a randomised clinical trial. Eur J Sport Sci. 2014;2(1):31-38. [Google Scholar]
- 29.Fredericson M Guillet M DeBenedictis L. Quick Solutions for Iliotibial Band Syndrome. Phys Sportsmed. 2000;28(2):52-68. [DOI] [PubMed] [Google Scholar]
- 30.Gratz M. Tensile strength and elasticity tests on human fascia lata. J Bone Joint Surg Am. 1931;13:334-340. [Google Scholar]
- 31.Wilhelm M Matthijs O Browne K, et al. Deformation response of the iliotibial band-tensor fascia lata complex to clinical-grade longitudinal tension loading in-vitro. Int J Sports Phys Ther. 2017;12(1):16-24. [PMC free article] [PubMed] [Google Scholar]
- 32.Lis A de Castro C Nordin M. Biomechanics of tendons and ligaments. In: Nordin M Frankel VH, eds. Basic Biomechanics of the Musculoskeletal System. Baltimore, MD: Lippincott Williams & Wilkins; 2012:102-127. [Google Scholar]
- 33.Rahnemai-Azar AA Miller RM Guenther D, et al. Structural properties of the anterolateral capsule and iliotibial band of the knee. Am J Sports Med. 2016;44(4):892-897. [DOI] [PubMed] [Google Scholar]
- 34.Godin JA Chahla J Moatshe G, et al. A comprehensive reanalysis of the distal iliotibial band: quantitative anatomy, radiographic markers, and biomechanical properties. Am J Sports Med. 2017;45(11):2595-2603. [DOI] [PubMed] [Google Scholar]
- 35.Olson SA Marsh JL Anderson DD, et al. Designing a biomechanics investigation. J Orthop Trauma. 2012;26(12):672-677. [DOI] [PubMed] [Google Scholar]
- 36.Birch HL Peffers MJ Clegg PD. Influence of ageing on tendon homeostasis. In: Ackermann PW Hart DA, eds. Metabolic Influences on Risk for Tendon Disorders. Vol 920. Advances in Experimental Medicine and Biology. Cham: Springer International Publishing; 2016:247-260. [DOI] [PubMed] [Google Scholar]
- 37.Reeves ND. Adaptation of the tendon to mechanical usage. J Musculoskelet Neuronal Interact. 2006;6(2):174-180. [PubMed] [Google Scholar]
- 38.Topoleski LDT. Mechanical properties of materials. In: Oatis CA, ed. Kinesiology the Mechanics and Pathomechanics of Human Movement. 3rd ed. Philadelphia, PA; 2017: 23-40. [Google Scholar]
- 39.Willett GM Keim SA Shostrom VK, et al. An anatomic investigation of the ober test. Am J Sports Med. 2016;44(3):696-701. [DOI] [PubMed] [Google Scholar]
- 40.Berrueta L Muskaj I Olenich S, et al. Stretching impacts inflammation resolution in connective tissue. J Cell Physiol. 2016;231(7):1621-1627. [DOI] [PMC free article] [PubMed] [Google Scholar]
- 41.Hotfield T Swoboda B Krinner S, et al. Acute effects of lateral thigh foam rolling exercises on arterial tissue perfusion determined by spectral Doppler and power Doppler ultrasound. J Strength Cond. 2017;31(4):893-900. [DOI] [PubMed] [Google Scholar]
- 42.Gordon K Brett A Weber JF. Uniaxial Biomechanical Testing of Ligaments and Tendons. In: Zdero R, ed. Experimental Methods in Orthopaedic Biomechanics. Cambridge, MA: Elsevier (Academic Press); 2017:349-362. [Google Scholar]
- 43.Bowman KF Sekiya JK. Anatomy and biomechanics of the posterior cruciate ligament, medial and lateral sides of the knee. Sports Med Arthrosc Rev. 2010;18(4):222-229. [DOI] [PubMed] [Google Scholar]
- 44.Sargon MF Doral MN Atay OA. Age-related changes in human PCLs: a light and electron microscopic study. Knee Surg Sports Traumatol Arthrosc. 2004;12(4):280-284. [DOI] [PubMed] [Google Scholar]
- 45.Levy YD Hasegawa A Patil S Koziol JA Lotz MK, D’Lima DD. Histopathological changes in the human posterior cruciate ligament during aging and osteoarthritis: correlations with anterior cruciate ligament and cartilage changes. Ann Rheum Dis. 2013;72(2):271-277. [DOI] [PMC free article] [PubMed] [Google Scholar]