

See Ware et al. (doi:10.1093/brain/awaa166) for a scientific commentary on this article.
Using a modified MRI-based method that can detect subtle, region-specific blood-brain barrier dysfunction, Veksler et al. reveal slow blood-to-brain transport in a subset of amateur American football players. MRI may allow early detection of microvascular pathology in patients at risk for chronic traumatic encephalopathy.
Keywords: blood–brain barrier, repetitive mild traumatic brain injury, dynamic contrast-enhanced magnetic resonance imaging, American football, transcellular transport
Abstract
Repetitive mild traumatic brain injury in American football players has garnered increasing public attention following reports of chronic traumatic encephalopathy, a progressive tauopathy. While the mechanisms underlying repetitive mild traumatic brain injury-induced neurodegeneration are unknown and antemortem diagnostic tests are not available, neuropathology studies suggest a pathogenic role for microvascular injury, specifically blood–brain barrier dysfunction. Thus, our main objective was to demonstrate the effectiveness of a modified dynamic contrast-enhanced MRI approach we have developed to detect impairments in brain microvascular function. To this end, we scanned 42 adult male amateur American football players and a control group comprising 27 athletes practicing a non-contact sport and 26 non-athletes. MRI scans were also performed in 51 patients with brain pathologies involving the blood–brain barrier, namely malignant brain tumours, ischaemic stroke and haemorrhagic traumatic contusion. Based on data from prolonged scans, we generated maps that visualized the permeability value for each brain voxel. Our permeability maps revealed an increase in slow blood-to-brain transport in a subset of amateur American football players, but not in sex- and age-matched controls. The increase in permeability was region specific (white matter, midbrain peduncles, red nucleus, temporal cortex) and correlated with changes in white matter, which were confirmed by diffusion tensor imaging. Additionally, increased permeability persisted for months, as seen in players who were scanned both on- and off-season. Examination of patients with brain pathologies revealed that slow tracer accumulation characterizes areas surrounding the core of injury, which frequently shows fast blood-to-brain transport. Next, we verified our method in two rodent models: rats and mice subjected to repeated mild closed-head impact injury, and rats with vascular injury inflicted by photothrombosis. In both models, slow blood-to-brain transport was observed, which correlated with neuropathological changes. Lastly, computational simulations and direct imaging of the transport of Evans blue-albumin complex in brains of rats subjected to recurrent seizures or focal cerebrovascular injury suggest that increased cellular transport underlies the observed slow blood-to-brain transport. Taken together, our findings suggest dynamic contrast-enhanced-MRI can be used to diagnose specific microvascular pathology after traumatic brain injury and other brain pathologies.
See Ware et al. (doi:10.1093/brain/awaa166) for a scientific commentary on this article.
Introduction
Traumatic brain injury (TBI) is a leading cause of death and disability, and is associated with significant secondary morbidity, including late-life increased risk of neurodegenerative diseases such as chronic traumatic encephalopathy (CTE) (Critchley, 1957; Omalu et al., 2006; Gavett et al., 2011; Ling et al., 2017; Mez et al., 2017; Tagge et al., 2018). Human neuropathological studies have demonstrated that traumatic microvascular injury is common after brain injury and may persist for years after the insult (Hay et al., 2015; Salehi et al., 2017). Specifically, blood–brain barrier dysfunction (BBBD), and extravasation of serum proteins into the brain neuropil have been shown to facilitate delayed complications following TBI (Doherty et al., 2016). BBBD is also a hallmark of other brain disorders, including ischaemic injuries [e.g. stroke (Kassner and Merali, 2015; Villringer et al., 2016; Serlin et al., 2019), subarachnoid haemorrhage (Lublinsky et al., 2019), and epilepsy (Rüber et al., 2018)], and has been recently suggested as a potential biomarker predicting outcome (Bar-Klein et al., 2017; Lublinsky et al., 2019; Kamintsky et al., 2019; Serlin et al., 2019). While the detailed mechanisms underlying BBBD are poorly understood, both paracellular leakage, resulting from dysfunction or downregulation of tight-junction proteins, and enhanced transcellular transport across the endothelial barrier have been proposed as pathogenic contributors (Knowland et al., 2014; De Bock et al., 2016; Haley and Lawrence, 2016; Nahirney et al., 2016; Andreone et al., 2017; Zhang et al., 2017). At present, there is neither a clinically standardized method for objective assessment of microvascular permeability changes in vivo, nor data revealing the nature and course of BBB permeability changes in individuals affected by repetitive mild TBI (rmTBI).
Dynamic contrast-enhanced (DCE) MRI is being used to evaluate brain vascular permeability in a growing number of neurological diseases (Sweeney et al., 2019). Widely used DCE-MRI methods are based on extended Tofts or Patlak models (Patlak and Blasberg, 1985; Tofts and Kermode, 1991; Sourbron and Buckley, 2013). To date, DCE-MRI studies were either primarily used to evaluate conditions defined by robust and rapid (≤5 min) leakage of contrast agent, or only rarely distinguished between different blood-to-brain transport mechanisms (Zlokovic, 2008; Heye et al., 2014; Montagne et al., 2015; Artzi et al., 2016; Nation et al., 2019). We have recently implemented a modified DCE-MRI approach to detect, localize, and track subtle BBBD in a cohort of American football players (Weissberg et al., 2014), patients with transient ischaemic attack (Serlin et al., 2019) and bipolar depression (Kamintsky et al., 2019). In the present study, by combining human data, animal studies and computational modelling, we show that an increase in slow blood-to-brain transport is the hallmark of microvascular pathology following injury. We propose a mechanism-based diagnostic approach to detect and track traumatic microvascular pathology and BBBD after these common brain injuries.
Materials and methods
Human subjects
The study was approved by the Soroka University Medical Center institutional review board; written informed consent was given by all participants. The study population included 42 Israeli amateur American football players playing in the Israeli Football League (IFL), and a control group comprising 27 athletes practicing a non-contact sport and 26 non-athletes. Magnetic resonance scans were also performed in 51 patients with malignant brain tumours, ischaemic stroke or traumatic brain injury. The NFL sideline concussion assessment tool was used to document history of previous head injuries, including concussions, as well as symptoms assessment and Standardized Assessment of Concussion (SAC) tests.
MRI
All subjects were scanned on a 3 T Philips Ingenia MRI scanner. Image acquisition protocol was performed as described previously (Weissberg et al., 2014; Serlin et al., 2019). Briefly, T1- and T2-weighted imaging, FLAIR, diffusion, and susceptibility-weighted imaging (SWI) data were acquired, followed by a DCE sequence. After five dynamic scans, the contrast agent gadoterate meglumine (Gd-DOTA, Dotarem®, 0.1 mmol/kg, 0.5 M, 1.5 ml/s) was administered intravenously.
Blood sampling and analysis
Immediately prior to MRI, 5 ml of whole blood was withdrawn in SST II advance Vacutainer tubes. Samples were centrifuged at 2000g for 15 min. Serum fraction was stored at −80°C until use. Serum levels of inflammation, neuronal or glial injury markers were measured using the Xmap (Luminex) method (R&D Systems) and ELISA (R&D Systems) as per manufacturer’s instructions. In brief, diluted samples (50 µl) were incubated in a 96-well plate containing antibody-coated magnetic beads for 2 h at room temperature under gentle orbital agitation. Then, beads were washed with the provided wash buffer and signal was developed using the provided biotin antibody cocktail and streptavidin-peroxidase. Signal was determined using a Luminex 200 plate reader. Levels were calculated by a standard curve for each analyte.
Animals
Animal housing and experiments were conducted in accordance with guidelines of the Association for Assessment and Accreditation of Laboratory Animal Care and National Research Council Guide for the Care and Use of Laboratory Animals. All experiments involving animals adhered to provisions in the Animal Welfare Act and were approved by Institutional Animal Care and Use Committees (IACUC) at Ben-Gurion University of the Negev and Boston University School of Medicine. Animals were provided with food and water ad libitum. Ambient temperature was controlled at 20–22°C with 12 h light-dark cycles.
Traumatic brain injury models
We used two models for rmTBI: (i) a modified weight-drop model, in which substantial rotation of the head and neck occurs following impact (Marmarou et al., 1994; Kane et al., 2012; Mychasiuk et al., 2014). Briefly, young adult (8–10 weeks) male Sprague Dawley rats were sedated using an induction chamber (3% isoflurane, 2 l/min O2), until the toe-pinch reflex was absent. Rats were then placed in the prone position on a sheet of aluminium foil taped to the top of a plastic box (30 × 30 × 20 cm in depth). A metal bolt (1 cm diameter × 10 cm length) was placed on the scalp (midline, frontal bone). TBI was induced using a weight (600 g) travelling vertically (1.2 m) along a metal guide rail. Following the impact, animals fell onto a foam pad placed at the bottom of the box. Sham controls underwent the same procedures but without injury. (ii) Unilateral (left-lateral) closed-head impact injury was conducted in adult (10–12 weeks of age) male C57BL/6 mice (Charles River Laboratories), as established at the Laboratory Animal Science Center, Boston University School of Medicine (Tagge et al., 2018). Briefly, mice were injected intraperitoneally with buprenorphine (0.2 mg/kg) and secured in the prone position via modified DecapiCones (Braintree Scientific Inc.). The restrained mice were then positioned on the impactor such that the inner pad of the sled contacted the left temporal-zygomatic region of the head. The head and neck were free to allow flexion, extension, and rotation of the cervical spine in the horizontal and sagittal planes to model conditions relevant to human head impact exposure. Linear translation of the sled resulted in left-lateral impact and traumatic head acceleration. Mice were exposed to two impacts 15 min apart at a target sled speed of 5.0 m/s. Age-matched naïve C57BL/6 mice were used as controls. MRI was performed 3 h, 1 day, 3 days and 1 week after injury using 11.7 T MRI (Bruker) at the Boston University School of Medicine High-Field NMR Core Facility as described (Tagge et al., 2018). For additional details see the Supplementary material.
Vascular injury model
Experiments were performed in male Sprague-Dawley rats (200–380 g, Harlan) as reported (Vazana et al., 2016). For additional details see the Supplementary material.
Recurrent seizure model
Experiments were performed in male Sprague-Dawley rats using the open window method as reported (Vazana et al., 2016). For additional details see the Supplementary material.
BBB permeability quantification in humans
Analysis was performed as reported (Chassidim et al., 2013; Veksler et al., 2014; Weissberg et al., 2014; Serlin et al., 2019). Briefly, preprocessing included image registration and normalization to MNI coordinates using SPM12 (http://www.fil.ion.ucl.ac.uk/spm). BBB permeability was calculated using in-house MATLAB script, implementing previously described method (Veksler et al., 2014). For rapid contrast accumulation, the modified Tofts method was implemented, where middle cerebral artery (MCA) was used as the arterial input function (AIF) (Tofts, 1997). For slow accumulation, a linear fit is applied to the later part [6–17 min, s(t)] of the concentration curve of each voxel [Ct(t)]:
| (1) |
| (2) |
Where A and B are the slope and intercept of the linear regression, respectively.
To compensate for physiological (e.g. heart rate, blood flow) and technical (e.g. injection rate) variability between scans, a normalized permeability index (NPI) is introduced:
| (3) |
where AVIF is the slope at the superior sagittal sinus, which is characterized by a larger diameter and a higher signal-to-noise ratio, compared to the MCA.
For regional analysis of BBBD, brains were segmented into 126 anatomically defined regions (MNI brain atlas: https://github.com/neurodebian/spm12/tree/master/tpm). The number of voxels with abnormally high BBB permeability (contrast accumulation rates exceeding the above-mentioned intensity threshold) was quantified within each region and divided by the total number of voxels comprising the region. This ratio was defined as the per cent of region volume with BBBD.
Diffusion tensor imaging analysis
Diffuse tensor imaging (DTI)-based fibre tracking was performed using mrDiffusion, an open-source software written by the Vision, Imaging Science and Technology Activities (VISTA) lab at Stanford University (https://github.com/vistalab/vistasoft, CA, USA), and in-house MATLAB scripts. For additional details see the Supplementary material.
Repeated scans comparison
To measure reproducibility of results, we calculated the similarity index between two scans (S1 and S2) of the players who were scanned twice:
| (4) |
where S1 and S2 are binary images in which voxels with abnormally high NPI = 1, and is the number of voxels within the brain. Hence, the similarity index is valued between 0 and 1. Similarity indices were calculated for the whole brain, as well as for white and grey matter.
BBB permeability analysis using MRI in rodents
DCE-MRI was analysed as reported (Tagge et al., 2018). An external standard of diluted gadopentetate dimeglumine (1:2000 dilution of Magnevist®, 0.5 mmol/ml, Bayer) was used for normalization of the T1-weighted signal. A linear fit was calculated for the final 900 s of the DCE curve, beginning ∼16 min following contrast injection. The slope of the linear fit, referred to as permeability index (PI), reflects brain accumulation of the contrast agent and serves as a measure of BBB permeability. The PI map was generated by averaging data from three windows with a 1 min shift. The mean ipsilateral and contralateral PIs were calculated using a custom MATLAB script developed to select region of interest (75 pixels) in both hemispheres. For visualization, PI maps were superimposed on the post-contrast T1-weighted image. A permeability threshold was defined as the mean PI value plus two standard deviations in the region of interest contralateral to the injured region. Voxels with supra-threshold PI were displayed in 8-bit colour scale on top of the grayscale T1-weighted image.
Animal BBB permeability analysis using intravital fluorescence imaging
Data analysis was performed as reported (Vazana et al., 2016) using in-house MATLAB scripts and included subpixel image registration, segmentation using noise filtration, hole-filling and adaptive threshold to produce a binary image, separating blood vessels from extravascular regions. For additional details see the Supplementary material.
Ex vivo assessment of BBB permeability
Ex vivo assessment of BBB permeability was performed as reported previously (Bar-Klein et al., 2017) (Supplementary material). Briefly, under deep isoflurane anaesthesia, Evans blue (48 mg/kg) was injected into the tail vein, followed 30 min later with intracardial perfusion (4% paraformaldehyde in phosphate-buffered saline). Immunohistochemistry was performed using standard techniques on 30-µm thick coronal sections, using primary anti-GFAP antibody (Dako Z0334), followed by secondary antibody donkey anti-rabbit IgG-Alexa Fluor® 488 (ThermoFisher Scientific, A21206, 1:500 dilution). Sections were visualized using a Zeiss Axioplan 2 microscope.
Statistical analysis
To compare between control and players groups, two-sided Mann-Whitney U-test was used. For voxel-wise analysis of areas with BBBD in players versus controls, each voxel in the statistical image is the result of a comparison of 2 × 2 neighbours for every subject, without overlaps. For multiple comparisons, two-sided Mann-Whitney U-test with false discovery rate (FDR) correction was used. For segment-wise analysis on fibre-flux diffusion density (FFDD) data of specific fibres, two-sided Mann-Whitney U-test was used with FDR correction for multiple comparisons. For correlation analysis of serum biomarkers and NPI values, either Pearson or Spearman methods were used, as denoted. Pearson method was used for correlation analysis of model-derived values.
Data availability
The data that support the findings of this study are available from the corresponding author, upon reasonable request.
Results
Repeated mild TBI is associated with persistent BBBD
We previously reported the use of DCE-MRI to detect a leaky BBB in a small cohort of American football players (Weissberg et al., 2014). In the present study, we used a modified DCE-MRI protocol in a larger cohort of amateur American football players (n = 42 males; age range, 18–39 years; median, 25 years) scanned during (on-season) and after (off-season) two consecutive seasons of play and practice. To obtain permeability values in healthy individuals, we first scanned a cohort of age- and sex-matched non-contact sport athletes (n = 27). Each registered brain voxel was assigned a value corresponding to an NPI (Fig. 1A). Based on a cumulative distribution function (CDF) of NPI values (the entire brain volume) in young healthy individuals, we defined an upper limit for ‘normal’ NPI as the 95th percentile of the mean CDF (Fig. 1B). Brain voxels with higher values were considered as ‘abnormally high NPI’.
Figure 1.
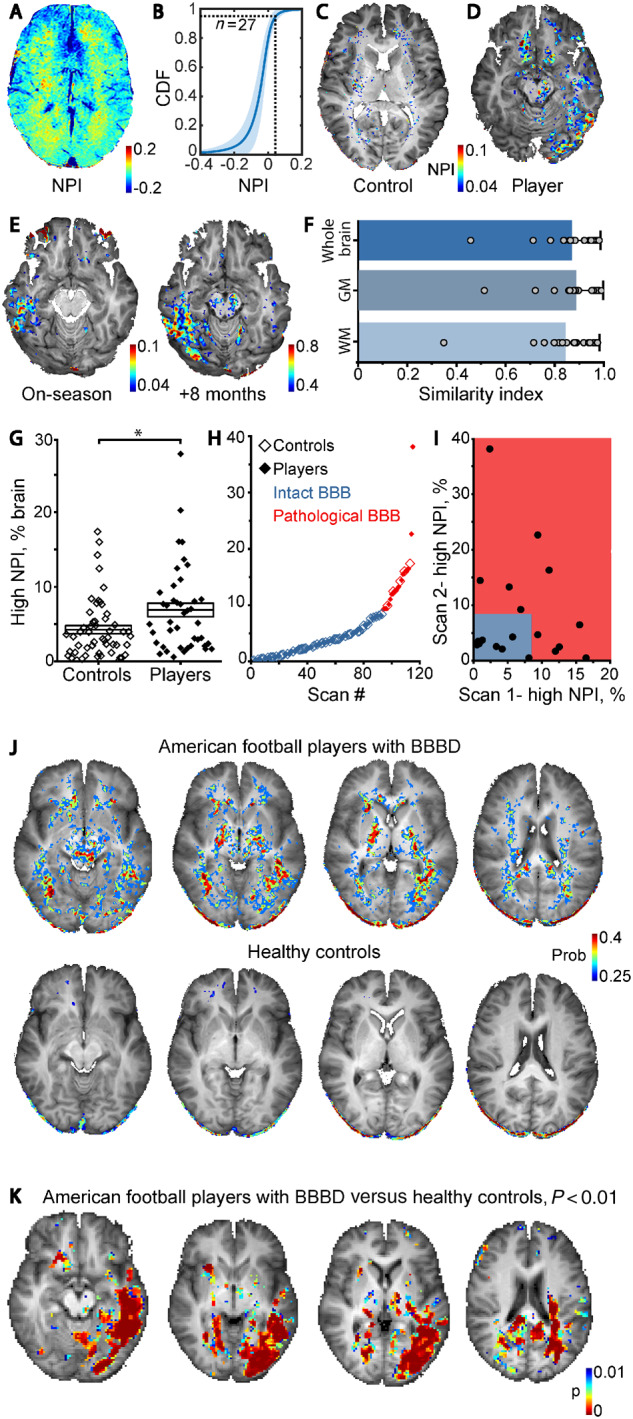
DCE-MRI reveals persistent BBBD in American football players. (A) Maps of NPI were created to measure changes in BBB permeability. (B) A cumulative distribution function (CDF) plot shows similar NPI values in controls (n = 27). (C and D) High NPI values (>0.04) are superimposed on anatomical scan of control (C) and a representative player with BBBD (D). (E) Repeated scans (8-month interval) revealed local increase in the number of voxels with high NPI. (F) Similarity analysis showed consistent results between repeated scans (n = 20), for whole brain, grey matter (GM) and white matter (WM). Bars represent mean similarity index ± SD. (G) Graph showing percentage of brain volume with above-threshold NPI in controls (n = 53) versus players (n = 41; for players that were scanned twice, the averaged value is shown) demonstrates statistically significant increase in players (P = 0.01, Mann-Whitney U-test). (H) K-means clustering of the entire dataset into ‘healthy’ (blue) and ‘pathological’ (red) BBB groups. (I) Comparison of percentage of brain volume with high NPI in players who were scanned twice; grey box represents the ‘healthy’ group. (J) Probabilistic map representing brain voxels with high probability to display high (pathological) NPI values in players (upper row) and controls (lower row). (K) Voxel-wise statistical comparison of NPI values in players with BBBD versus healthy controls. Areas where P < 0.01 (Mann-Whitney U-test with FDR correction for multiple comparisons) are superimposed over anatomical scan.
In healthy controls, voxels with above-threshold NPI were sparsely distributed throughout the brain with greater density in white matter compared to grey matter (Fig. 1A and C). In contrast, brain permeability maps from American football players often demonstrated clusters of brain voxels with high NPI values (Fig. 1D), suggesting accumulation of contrast agent in distinct brain regions (see below).
In all players, SWI excluded microhaemorrhagic lesions. Twenty players were scanned twice (on- and off-season) in a random order, with an inter-scan interval of 3.67–11 months (median, 6 months). Importantly, while in different individuals different brain regions displayed high NPI values, their spatial distribution was consistent in repeated scans of the same individual (Fig. 1E and F). Similarity index for repeated scans (Fig. 1F, n = 20, see ‘Materials and methods’ section) was found to be consistently high in whole brain analysis (mean ± SD, 0.87 ± 0.12), as well as segmentation to grey matter (0.88 ± 0.11) and white matter (0.84 ± 0.14). This finding suggests that localized post-traumatic microvascular pathology may persist for months in a subset of players.
Next, an additional control group of age-matched healthy non-athletes (n = 26; age range, 18–40 years; median, 30 years) were scanned. Because no statistical differences in NPI maps were found, the two control groups were merged. In total, 62 scans of players and 53 scans of control subjects were acquired. Players showed higher percentage of brain volume with high NPI values compared to controls (Fig. 1G, P = 0.006; following exclusion of one player, who had >50% of brain voxels with high NPI value and was considered an outlier, P = 0.01). Players showed higher percentage of brain volume with high NPI following repeating the analysis with a minimum cluster threshold of 10 voxels (P = 0.04), suggesting that BBBD tends to occur in distinct brain regions (see below and Supplementary Fig. 1). Using k-means clustering, a threshold was calculated defining an ‘intact BBB’ group (<8.4% of brain voxels with high NPI), and a ‘leaky’ (or pathological) BBB group (≥8.4% of voxels with high NPI, Fig. 1H). Players were three times more likely to be clustered in the pathological group (9.4% versus 27.4%, chi square, P = 0.01). In players with repeated scans, 47.4% (9/19) displayed a gradual resolution of the focal pathology, as indicated by a decreasing volume with high NPI, whereas in 52.6% (10/19), the number of high NPI voxels increased (Fig. 1I).
We found weak positive correlation between the per cent brain volume with BBBD and player age (r = 0.26, P = 0.044, Spearman), not observed in age-matched controls (see ‘Discussion’ section). No correlation was found between changes in permeability over time and likelihood of being concussed at the time of scanning (on- or off-season), inter-scan interval, number of reported concussions, age at start of football play or cumulative years of play. No differences were found between players with or without BBB pathology in number of years playing, number of reported concussions, symptoms number or score on a standardized concussion assessment test (Supplementary Tables 1 and 2). No correlation was found between the time since last reported concussion prior to imaging (range, 0.25–272 months; median, 12 months; n = 18 versus 12–228 months; median, 96 months; n = 5 in players versus controls, respectively) to the extent of BBB pathology. Yet, players with BBBD were significantly older than those with intact BBB (median age, 29 versus 25 years, P = 0.028) and started playing at an older age (median, 25 versus 21.5 years, P = 0.008).
In a search for susceptible brain structures, we created probabilistic BBB permeability maps in which the probability of each voxel to display above-threshold NPI was calculated (Fig. 1J). Brain regions that were found to be more susceptible to BBB pathology in players, but not in controls, included the left temporal lobe, thalamus, cerebral peduncles, and red nucleus as well as white matter tracts (see below). Voxel-wise statistical analysis comparing the two groups showed significant differences in permeability in the left temporal and left occipital lobes, as well as in white matter regions and basal ganglia (Fig. 1K). Regional analysis of BBBD was in-line with voxel-based statistics: upon brain clustering to 126 anatomical subregions (BBBD was defined if the percentage of voxels with high NPI was >2 SD of averaged percentage in controls within a region), most football players showed regional BBBD, confirming region-wise susceptibility in players (Supplementary Fig. 1).
Persistent BBBD co-localizes with white matter abnormalities
To examine white matter integrity in our cohort, we used DTI (Supplementary Table 3). Fractional anisotropy measurements significantly decreased in players compared to controls in the following tracts: left-thalamic radiation, corpus callosum, left inferior fronto-occipital fasciculus (IFOF) and left inferior longitudinal fasciculus (ILF). Mean diffusivity values significantly increased in the right arcuate fasciculus.
Given the focal nature of BBB abnormalities within long white matter tracts (Fig. 1K) and high variability of diffusion parameters within tracts, we produced a metric of local changes in tract diffusion characteristics using FFDD, a recently developed measure that combines diffusion parameters with geometric properties (Benou et al., 2019). The FFDD tract profile of the IFOF is shown in Fig. 2A for both fractional anisotropy and mean diffusivity, demonstrating the variability along the tract in healthy individuals (n = 17). In players (n = 13) we found a significant decrease in fractional anisotropy and increase in mean diffusivity in specific regions within the IFOF and the forceps minor of the corpus callosum (Fig. 2B, C, E and F). Specifically, an increase in mean diffusivity was found in caudal portion of the left IFOF towards the occipital lobe, as in the central region of the forceps minor (genu of the corpus callosum). Interestingly, these white matter changes were consistent with permeability changes as observed above: NPI values in the left posterior segment of the IFOF were significantly higher compared to those in the anterior segment (0.025 ± 0.084 versus −0.027 ± 0.074, P = 0.038, Wilcoxon signed-ranks test). Similarly, and consistent with FFDD data of the forceps minor (Fig. 2F), NPI values within the midline region of the tract (genu of corpus callosum) were significantly higher compared to those in the left anterior segment of the tract (−0.035 ± 0.16 versus −0.065 ± 0.11, P = 0.021, Wilcoxon signed-ranks test). No significant differences between the groups were found along the corticospinal tract in FFDD or NPI values (Fig. 2D and G).
Figure 2.

White matter changes correlate with persistent BBB pathology in American football players. (A) Local differences in diffusion were analysed by FFDD of fractional anisotropy (FA; left) and mean diffusivity (MD; right). Values were averaged along the IFOF white matter tracts in controls (n = 17) and players (n = 13). (B–D) Difference between players and control (ΔFFDD) in three fibres, namely inferior fronto-occipital fasciculus (IFOF, B), forceps minor (C) and corticospinal tract (D), are presented in units of standard deviation of FFDD. (E–G) Statistical comparison (Mann-Whitney U-test with FDR correction for multiple comparisons) was performed on 50 segments along each fibre, revealing significantly differences in IFOF and forceps minor, but not in corticospinal tracts.
Finally, analysis of serum samples collected at the time of scanning revealed no significant differences in levels of blood-based biomarkers of glial injury (S100B, GFAP), neuronal injury (neurogranin, SNCB, Tau, BDNF) or neuroinflammation (IL6, IL33, IL17, IL23, IL18, IFN) between players and healthy controls, or between players with or without high brain volume with BBB pathology (data not shown).
BBBD is associated with slow contrast agent accumulation
To validate the modified DCE-MRI approach, we examined patients with brain pathologies known to be associated with BBBD including malignant brain tumours (n = 4), ischaemic stroke (n = 46) and haemorrhagic traumatic contusion (n = 1). In all three conditions, a clearly defined brain lesion was associated with BBBD within the lesion and/or in the surrounding tissue. In patients with grade IV malignant glial tumours, T1-weighted MRI scan after injection of gadolinium (Gd)-based contrast agent showed an enhanced tumour surrounded by peritumoral oedema (Fig. 3A and B). Relative concentration-time curves showed rapid accumulation of the tracer in the tumour within the first 5 min after injection (Fig. 3C). In contrast, peritumoral brain regions showed a delayed and slower accumulation that was detectable only 6–15 min post-injection. In the tumour-free contralateral hemisphere, contrast agent washout was similar to that observed in large blood vessels (not shown). SWI revealed abnormal signal consistent with haemorrhage at the tumour core, but not in the surrounding brain, thus precluding active bleeding as the cause of contrast accumulation (Fig. 3D).
Figure 3.
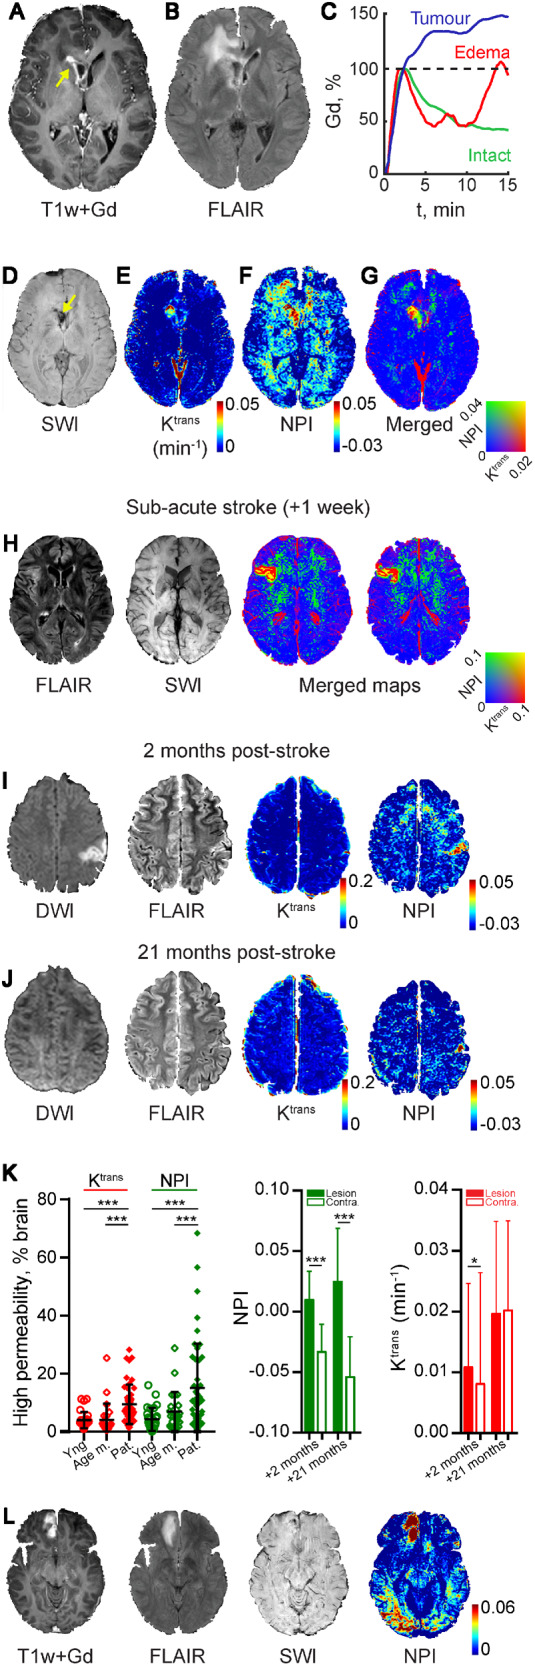
BBBD is characterized by fast and slow accumulation of contrast agent. (A–G) Images from a patient with malignant glial tumour. (A) T1-weighted image following Gd injection showing the enhanced tumour mass (arrow). (B) FLAIR image: note the bright right frontal region indicating peritumoral oedema. (C) Relative Gd concentration-time curve in tumour (blue), peritumoral oedema (red) and contralateral, apparently healthy brain (intact, green). (D) Susceptibility-weighted imaging (SWI) reveals blood products at the tumour site (arrow) but not in the surrounding brain. BBB permeability maps showing the fast (Ktrans using the Tofts model, E) and slow (NPI, F) contrast accumulation. (G) A merged image showing both fast and slow contrast accumulation. (H) Images from a patient 1 week after a stroke. The ischaemic lesion is visible on the right (FLAIR), with no haemorrhage (SWI). Merged maps of fast (Ktrans) and slow (NPI) contrast accumulation are shown. (I and J) Images from a patient 2 and 21 months after acute ischaemic stroke. Clinical imaging techniques (DWI, FLAIR) show the ischaemic region at 2 months with no sign of abnormality in the later scan. BBBD is more clearly shown when slow (compared to fast) Gd accumulation is calculated. Note the partial resolution of the peri-ischaemic BBBD in the later scan. (K) Left: Percentage of brain volume with abnormally high permeability (fast, i.e Ktrans and slow, i.e. NPI) in patients with subacute stroke (Pat.; n = 46) compared with young controls (Yng; n = 27) and age-matched controls (Age m.; n = 27). Middle and right: Slow and fast blood-to-brain permeability were calculated in the brain of the patient shown in I and J, 2 and 21 months following an acute stroke. The hemisphere ipsilateral to the ischaemic lesion and in the contralateral (Contra) (2 months: P < 0.0001 for NPI, P = 0.018 for Ktrans; 21 months: P < 0.0001 for NPI, P = 0.76 for Ktrans, t-test). (L) Images obtained 9 days after mild TBI due to occipital impact. Haemorrhagic contusion with oedema is observed at the base of the frontal lobe, with no occipital pathology in clinically routine sequences. Yet, abnormal increase in slow Gd accumulation (NPI) is found in both occipital and frontal regions.
We next compared vascular permeability calculated using the extended Tofts model (Tofts et al., 1999) and the delayed linear approximation method to evaluate fast and slow enhancement dynamics (NPI), respectively. A merged permeability map shows that while both methods detected high permeability at the tumour core (Fig. 3G, yellow), peritumoral BBB pathology was only detected when slow changes in contrast dynamics were measured (Fig. 3E and F, green). Similarly, a clear BBB lesion with both fast (Ktrans) and slow (NPI) contrast agent accumulation is seen in the ischaemic core, whereas in the surrounding brain tissue only a slow contrast accumulation is seen (Fig. 3H). Analysis of a cohort of patients with a subacute stroke (n = 46, 24 h to 7 days after the acute event) shows that while both Ktrans and NPI values are higher in patients compared to age-matched (n = 23) or young (n = 27) healthy controls, the distribution of values is strikingly different (Fig. 3K, age-matched controls versus patients: P = 0.008 for NPI, P < 0.0001 for Ktrans, Kruskal-Wallis, young controls versus patients: P < 0.0001 for NPI, P = 0.0001 for Ktrans, Kruskal-Wallis) Importantly, while the fast accumulation and the typical early changes in diffusion-weighted imaging (DWI) and fluid attenuation inversion recovery (FLAIR) had resolved in follow-up scans, high NPI values were persistent months after the acute ischaemic events (Fig. 3I–K). Figure 3L shows images from a patient with a haemorrhagic contusion at the base of the right frontal lobe resulting from contrecoup injury secondary to occipital trauma. The posterior injury resulted in a persistent left visual field defect. MRI revealed bleeding at the base of the frontal lobe with peri-contusional oedema and no other apparent brain pathology. However, BBB maps revealed high NPI in both frontal and occipital lobes, consistent with the injury mechanism and clinical sequelae. Finally, in our football players cohort (Fig. 1), no differences in Ktrans values, or brain volume with high Ktrans, were found between players and controls (cf.Fig. 1G and Supplementary Fig. 2).
Slow contrast enhancement characterizes focal BBBD in a rodent model of repeated mild closed-head injury
As we found indirect evidence for a slow extravasation of Gd-based contrast agent in DCE-MRI of patients with different brain pathology, we next aimed to confirm that this ‘slow enhancement’ indeed reflects a leaky BBB. We used two established rodent models for rmTBI. Consistent with the results obtained in football players (Fig. 1G), DCE-MRI in rats exposed to five repeated impacts (weight-drop model) revealed a large variability between animals with a higher brain volume with high NPI in injured rats (n = 19) compared to sham controls (n = 15, P = 0.01, Fig. 4A). To confirm a leaky BBB we performed fluorescent angiography using intravital microscopy. This directly revealed the leakage of fluorescent tracer in the cortex of injured rats (n = 3) compared to sham-controls (n = 5, P = 0.035, Fig. 4A and see below). We next scanned mice subjected to repeated mild closed-head impact injury (two impacts, 15-min interval; n = 3 mice) at different time points after injury (3 h, 1 day, 3 days, 1 week). We calculated changes of T1-weighted signal in initial and delayed phases (1–3 min and 16–30 min after contrast injection, respectively). No evidence for a BBBD was detected in controls (Fig. 4A) and none of the mice showed contrast accumulation during the initial early phase. In contrast, all TBI mice exhibited focal regions of enhancement during the delayed phase, localized predominantly in the left perirhinal cortex ipsilateral to the impact site. The lesions exhibited varying patterns of temporal evolution of BBBD, including a peak at Day 3 post-injury followed by partial resolution at 3 weeks (TBI1, Fig. 4B), slow progression during the 3-week evaluation period (TBI2, Fig. 4C), and subtle abnormalities in left lateral cortex and midline structures (TBI3, Fig. 4D). None of the injured mice displayed DCE-MRI evidence of right-sided BBBD. Post-mortem examination showed no macroscopic evidence of contusion, necrosis, haematoma, haemorrhage, or focal tissue damage in any of the injured mice (Fig. 4E). Metallomic imaging mass spectrometry (MIMS) confirmed the presence and localization of gadolinium in the brain 1-week post-injury (Fig. 4F). Extravasated gadolinium was detected in the left-lateral perirhinal cortex in a pattern similar to the corresponding DCE-MRI-derived permeability map (Fig. 4B). Histopathology examination revealed neuronal dropout and parenchymal rarefaction (spongiform changes, asterisk), consistent with cellular injury and neurodegeneration, in the superficial layers of the left perirhinal cortex ipsilateral and subjacent to impact site (Fig. 4G, region 1). Middle cortical layers also exhibited neurodegenerative changes marked by clusters of pyknotic, intensely eosinophilic neurons (region 2). Deep cortical layers showed evidence of neuronal dropout (lower half, region 3); adjacent deeper areas contained normal-appearing neurons (Fig. 4G, white arrows) and small blood vessels (Fig. 4G, black arrowheads). No evidence of red blood cells or haemosiderin-laden macrophages, indicative of active or prior microhaemorrhage, was observed. The contralateral right perirhinal cortex did not reveal observable pathology (Fig. 4H). Transmission electron microscopy confirmed traumatic microvascular injury in the ipsilateral perirhinal cortex 1 week after injury induction, showing involuting capillary, grossly thickened and tortuous basal lamina, degenerating pericytes and oedematous astrocyte endfeet and nearby degenerating neurons (Fig. 4I and J).
Figure 4.

In vivo DCE-MRI reveals distinct patterns focal neuropathology in rodents following head injury. (A) Left: Above-threshold permeability index values overlaid on T1-weighted MRI scans from rats before and 1 week following repeated mild TBI. Middle: Percentage of brain volume with high permeability index (P.I) in injured (n = 19) compared to sham-controls (n = 19, n = 15, respectively, P = 0.01); Right: Colour-coded permeability maps of cortical surface vessels (see ‘Materials and methods’ section). Higher permeability is shown in rmTBI rats (n = 3) compared with sham controls (n = 5) in the presence of grossly normal brain. (B–E) Above-threshold DCE pixels overlaid on T1-weighted MRI scans from mice subjected to sham procedure (B) or to lateral (left) closed-head impact injury (C and D) at 3 h, 1 day, 3 days, and 1 week following intervention. Despite comparable levels of transient neurobehavioural impairment, BBBD displayed in injured mice was variable. (E) Gross brain pathology showing left lateral surface of the brain ipsilateral to impact. Arrow indicates approximate impact area. (F–H) Confirmation of focal BBBD and corresponding neuropathology in impact-injured mouse TBI1 at 1 week post-injury. (F) MIMS brain map for gadolinium (157Gd, coloured areas) overlaid on corresponding MIMS map for phosphorus (31P, black and white) showing accumulation of extravasated Gd in the left perirhinal cortex (PRC) ipsilateral and to head impact. (G and H) Hematoxylin and eosin staining of an adjacent brain section shows pathological changes in the left PRC (G), but not in the contralateral right PRC (H). Left PRC displays paucity of blood vessels, neuronal dropout, and spongiform changes (asterisk) in the superficial cortical layers (region 1), clusters of pyknotic degenerating neurons (region 2) and neuronal dropout (lower half, region 3, see text for details) as well as adjacent areas with normal-appearing neurons (white arrows) and small blood vessels (black arrowheads). The right PRC exhibits normal cellular and tissue structure, including highly-branched blood vessels (black arrowheads). (I–L) Ultrastructural evidence of persistent traumatic microvascular injury in the left PRC. (I) Longitudinal section of a capillary (asterisk marks lumen). Note pale oedematous (hydropic) cytoplasm in astrocyte endfeet (ae). as = astrocyte soma; e = endothelial cell; p = pericyte; magnification = ×800. (J) Degenerating neuron (nx) and nearby normal-appearing neurons (n). ap = astrocyte process; magnification = ×800. (K) Involuting capillary (asterisk). d = passing dendrite; magnification = ×1200. (L) Higher magnification of the same involuting capillary (asterisk) shows thickened, tortuous basal lamina (arrowheads). Note hydropic cytoplasm and degenerating mitochondria (m) in the ensheathing astrocyte endfeet (ae). p = degenerating pericyte; magnification = ×3000. Scale bars = 5 µm (I–K), 2 µm (L).
Slow contrast enhancement characterizes the peri-ischaemic brain in a rodent model of vascular injury
As slow BBBD was also found in patients with subacute stroke, suggesting it is not specific to traumatic injury, we next tested an ischaemic vascular injury model in the rat cerebral cortex, by using Rose bengal-induced photothrombosis (Schoknecht et al., 2014). T1-weighted, T2-weighted, and DWI MRIs acquired 24 h after injury showed the lesion core, with high T2-weighted and DWI signals and low T1-weighted signals consistent with cytotoxic oedema. The surrounding region exhibited high T2-weighted and low DWI signals as well as slow accumulation of gadolinium during the 30 min post-injection scan. These results are consistent with BBBD and vasogenic oedema in the peri-injured brain, similar to the changes observed in the injured human cortex (Fig. 5C and D). Using intravital microscopy and the open window technique we measured directly cortical microvascular permeability and excluded microhaemorrhages as a cause for contrast accumulation. Fluorescent angiography (Fig. 5E) confirmed the hypoperfused ischaemic core (Fig. 5F, asterisks) surrounded by a region of hyperintense extravascular signal in adjacent cortex, indicating leakage of tracer (Fig. 5G). A linear fit model applied to each pixel using a variable starting point (0–24 min) showed that as the starting point progressed, the number of pixels with positive slope increased, while the slope within the vessels remained negative, indicating that while the vascular signal decays (due to tracer washout), the tracer continues to accumulate in the extravascular compartment (Fig. 5H–J).
Figure 5.

Slow contrast enhancement can be measured in a rodent model of vascular injury. BBB integrity was assessed 24 h after induction of vascular injury using the photothrombosis model. (A) T1-weighted (T1w) scan following Gd injection reveals a hypo-perfused core (asterisk) and a surrounding cortical region with contrast enhancement (blue line). (B) T2-weighted image demonstrates high signal in both hypoperfused core and contrast-enhanced surrounding region. (C and D) Permeability map (C, measured in units of intensity/time) was calculated based on a linear fit of the slow (30 min) change of T1 signal after contrast agent injection (D). (E–G) In vivo direct imaging after injection of the fluorescent tracer sodium fluorescein demonstrates the hypo-perfused core (F, asterisk). (H–J) Conversely, in the surrounding cortex gradual enhancement is seen during 20 min from injection, suggesting a slow leakage of the tracer.
Modelling predicts that slow tracer accumulation is due to increased cellular transport
The fast accumulation of gadolinium in malignant brain tumours (Fig. 3C) likely reflects dysfunctional tight junctions and increased paracellular diffusion. This is supported by simulating changes in enhancement using a general tissue model for exchange of contrast agent between blood and the extravascular extracellular space. An important physiological parameter that is widely reported in DCE-MRI studies is the volume-transfer constant Ktrans, which is the rate at which contrast agent is delivered to the extravascular extracellular space per volume of tissue and contrast agent concentration in the arterial blood plasma (Heye et al., 2014). While increase in Ktrans models the fast enhancement observed in DCE-MRI within (for example) malignant tumours (e.g. Fig. 3), no increase in permeability was found in the peritumoral brain, where contrast accumulation was slow.
Recent animal studies point to transcellular transport across the BBB that is independent of paracellular diffusion (Kang et al., 2013; Knowland et al., 2014; De Bock et al., 2016; Haley and Lawrence, 2016; Zhang et al., 2017). We thus hypothesized that the slow increase in contrast accumulation was due to cellular transport. To model this hypothesis, we introduced a third compartment representing a unidirectional transfer from vessels to cells, reflecting transcellular transport across the BBB (De Bock et al., 2016) (Fig. 6A). Simulations over a wide range of parameters revealed a strong linear correlation between the unidirectional (and not bi-directional) transfer constant to the additional (cellular) compartment (i.e. Kb,c) and a slow increase in contrast concentrations (Fig. 6B Model 1; r = 0.959, P < 10−6), consistent with the increased NPI values that were detected by DCE-MRI (Figs 1, 3 and 5).
Figure 6.
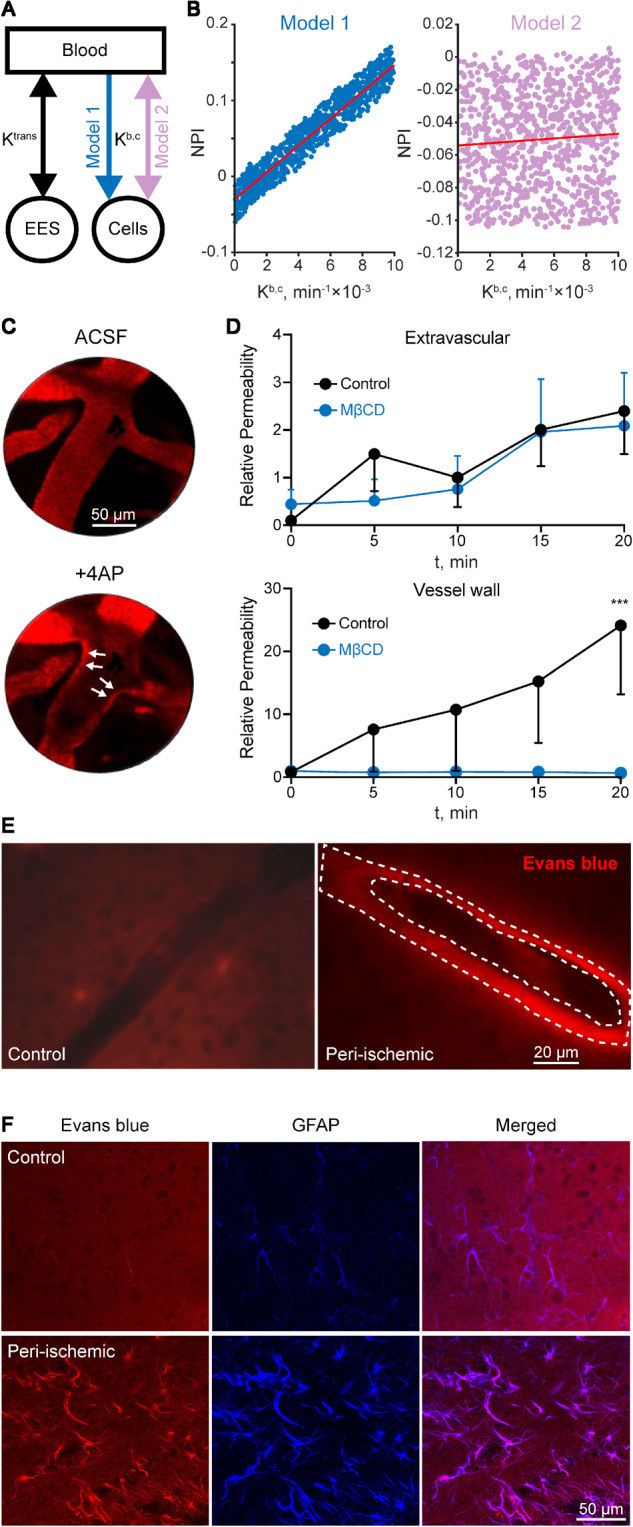
Slow tracer accumulation is consistent with increased cellular transport. (A) Modelling contrast accumulation rate using a three-compartment model, with a either a unidirectional (model 1) or bi-directional (model 2) volume-transfer constant (Kb,c). (B) Simulations over a wide range of parameters reveal a clear correlation between Kb,c and NPI values in the unidirectional model (model 1, r = 0.959, P < 10−6, Pearson correlation). No correlation was found using the bi-directional model (model 2, r = 0.069, P = 0.03, Pearson correlation). (C) In vivo direct confocal imaging of capillaries in the rat cerebral cortex (∼50 µm depth) shows leakage of Evans blue-albumin complex (red fluorescent) from the lumen to the vessel wall following 4-AP application. (D) The endocytosis inhibitor, methyl-β-cyclodextrin (MβCD), inhibits vessel wall, but not extravascular enhancement. (E and F) Histological analysis of the peri-injured cortex from similar experiments to that shown in Fig. 3 confirms the accumulation of Evans blue-albumin within blood vessel walls (dashed lines) in the cortical region with BBBD (E) and within cellular structures, mostly identified as GFAP-positive astrocytes (F). Scale bars = 20 µm (E), 50 µm (F). ASCF = artificial CSF; EES = extravascular extracellular space.
We next used confocal imaging to examine the transport of Evans blue-albumin complex before and after BBBD experimentally-induced using the K+ channel blocker 4-aminopyridine (4-AP) (Vazana et al., 2016). High-resolution analysis of changes in fluorescent intensity revealed that following 4-AP application, Evans blue-albumin first transfers from the vessel lumen to the vessel wall (<20 min post-4-AP; Fig. 6C and D), while Evans blue-albumin transit to the extravascular space was delayed (>20 min post-4-AP). Repeating the experiment in the presence of the endocytosis inhibitor MβCD, blocked Evans blue-albumin accumulation in the vessel wall (Fig. 6C). Histological analysis of brain sections from rats subjected to focal cerebrovascular injury (Fig. 5) and injected with Evans blue-albumin further confirmed Evans blue-albumin accumulation within the walls of small blood vessels in the peri-ischaemic core (Fig. 6C) and within cellular structures, mainly astrocytes (Fig. 6F). Together, these results support the notion that slow tracer accumulation occurred via transcellular transport.
Discussion
We developed a modified DCE-MRI protocol and analytical methods to investigate microvascular pathology and BBBD associated with rmTBI in amateur American football players. For the first time, using human brain imaging, we distinguish between fast and slow leakage through the pathological BBB. Together with recent studies from our group (Kamintsky et al., 2019; Serlin et al., 2019) this is one of a few studies using BBB imaging in healthy controls, allowing one to set threshold values for pathological permeability. These threshold values allow, for the first time, the identification of a subset of players showing evidence of focal brain microvascular pathology that persisted for many months (up to 10 months, the longest time point measured). Affected brain regions included temporal cortex, several long white matter tracts (e.g. left IFOF and left ILF), cerebral peduncles, and red nucleus of the midbrain. We further bring evidence to suggest that slow accumulation of peripherally-injected contrast agent reflects transcellular endothelial transport mechanisms that underlie BBBD detected in the American football players.
Widely used DCE-MRI methods are based on extended Tofts or Patlak models (Patlak and Blasberg, 1985; Tofts and Kermode, 1991; Sourbron and Buckley, 2013), primarily used to evaluate conditions defined by robust and rapid (≤5 min) leakage of contrast agent. Here, we demonstrate that measuring the slow signal changes following contrast agent injection enables the detection of a previously overlooked pathology, namely post-injury BBBD. The proposed analysis approach has the advantage over the classical Tofts models by detecting a slow signal change, and over the Patlak model by isolating the slow from the fast enhancement. We thus show that: (i) a fast leak occurred during the first ∼3 min after injection in the core of tumours, ischaemic stroke and haemorrhage; and (ii) a far slower leak can be found in perfused brain tissue surrounding tumours and the ischaemic core, as well as in non-haemorrhagic traumatic injury. Importantly, this slow subtle pathology may persist for months and be detected even in the presence of apparently normal brain tissue, as observed in routine clinical magnetic resonance sequences (T1, T2, FLAIR, DWI, SWI) (Fig. 3). We confirmed that a modified DCE-MRI protocol detects slow BBB leakage in animal models of rmTBI and vascular injury. Moreover, direct high-resolution imaging, histological analysis and computational modelling support the slow accumulation of systemically injected contrast agents even in the absence of fast leakage. Taken together, these results are consistent with microvascular pathology, likely due to increased cellular transport.
We implemented a modified DCE-MRI approach with a longer (16.7 min) acquisition time than usually applied (Vidarsson et al., 2009; Heye et al., 2014) to allow the detection of a slow biological process, which we found below the signal-to-noise detection levels with shorter acquisition (Supplementary Fig. 3). We used the commonly used gadoterate meglumine (Dotarem®) as a contrast agent. While testing different contrast agents and protocols (e.g. injection rate) was beyond the scope of the present study, our animal experiments using a different gadolinium-based, albumin-binding gadofosveset trisodium (Ablavar®), a fluorescent-tagged small molecule (sodium fluorescein) and the albumin-bound Evans blue, suggest a relatively non-specific transport mechanism.
Microvascular pathology is a prominent feature in all TBI animal models (DeWitt and Prough, 2003; Sashindranath et al., 2012; Boyd et al., 2015) and its role in neuroinflammation, neuronal dysfunction, and neurodegeneration has been documented (for reviews see Zlokovic, 2008; Abbott et al., 2010; Shlosberg et al., 2010). In humans, while imaging evidence for persistent BBB pathology after TBI is scarce (Tomkins et al., 2008; Li et al., 2016), post-mortem neuropathological studies confirm that microvascular changes and increased barrier permeability are common in TBI patients, even years after the acute insult (Rodríguez-Baeza et al., 2003; Hay et al., 2015; Doherty et al., 2016; Tagge et al., 2018). Moreover, recent studies have identified perivascular p-Tau pathology in post-mortem brains years after neurotrauma (Omalu et al., 2006; McKee et al., 2009, 2013; Mez et al., 2017; Tagge et al., 2018) and perivascular tauopathy as the uniquely defining brain lesion of early CTE (McKee et al., 2016). Our data showing persistent leaky BBB in young, active American football players, suggest that this early pathology may could serve for early diagnosis and monitoring of players at high-risk of developing delayed complications. Notably, we observed that in some players, BBB pathology continued to progress during the off-season, despite reported reduction in exposure to head trauma. No relations were found between the extent of BBBD and reported concussion symptoms, nor the time from last concussion. Interestingly, we found a weak positive correlation between BBBD and players age, not found in age-matched controls. In light of recent studies on age-related BBBD (Senatorov et al., 2019) this finding suggest trauma may underlie facilitated brain ageing and a long-lasting endothelial damage, and may not truthfully reflect brain response to an acute concussion. This seems to be consistent with emerging evidence from preclinical and clinical studies pointing to the cumulative effect of head injury exposure, rather than concussion per se, as the clinically relevant metric of risk for post-traumatic sequel, including CTE (Stamm et al., 2015; Huber et al., 2016; McAllister and McCrea, 2017; Montenigro et al., 2017; Tagge et al., 2018). While CTE is invariably associated with history of rmTBI, in a subset of cases, including those involving young adult amateur American football players, a history of frank concussion is frequently absent (McKee et al., 2014; Bieniek et al., 2015; Stein et al., 2015). While the present study was performed in otherwise-healthy amateur players, future studies are deserved to determine the prevalence and spatial-temporal characteristics of BBBD in professional players. Differences, if found, may improve the understanding the effects of impacts power and frequency, players age of onset and skills on the extent of vascular injury.
Although football players were three times more likely to display a leaky BBB than controls, imaging evidence of BBBD was detected in a subgroup (27.4%) of players, with variable anatomical location, extent, and temporal course. This inter-individual variability may explain the wide range of cognitive deficits and neuropsychiatric impairments observed in players, likely reflecting differences in affected brain networks. While the causes for the inter-player differences are unknown, it was interesting to find a similar variability in both rodent models of repeated mild TBI, despite a similar impact in each group. The differences found in controlled animal experiments suggest that variations in location, extent, timing, frequency, and cumulative exposure of head injuries may not be the only explanation for inter-individual variability. Genetic differences in response to trauma should be investigated in future studies. Despite this variability, specific brain regions were found more susceptible to BBBD in players. Of note, the observed susceptibility of long white matter tracts, midbrain regions and the temporal lobes is consistent with previous predictions based on imaging data and computational modelling (Ghajari et al., 2017). White matter damage following mild TBI has been reported in experimental models (Hutchinson et al., 2016; Robinson et al., 2017), with high variability among individual animals (Tu et al., 2017). In humans, several DTI-based studies that showed TBI-associated white matter damage consistently pointed to susceptible fibre bundles, including association (e.g. ILF, IFOF), commissural (e.g. forceps minor and major) and, to a lesser degree, projection fibres (Bendlin et al., 2008; Rutgers et al., 2008; Matsushita et al., 2011; Aoki et al., 2012; Shenton et al., 2012; Gajawelli et al., 2013; Bahrami et al., 2016; Strain et al., 2017). Our data showing high mean diffusivity and low fractional anisotropy in specific segments of the IFOF and forceps minor (Fig. 2) are consistent with these studies. Of note is the prominent asymmetry we found with higher sensitivity of the left hemisphere to BBBD, consistent with the left-side DTI pathology reported in football players (Bahrami et al., 2016).
Our observations of focal changes in BBB integrity highlighted the necessity of quantifying local changes in diffusion along white matter fibre tracts, by integrating local geometric properties with diffusion parameters. The co-occurrence of BBBD and white matter abnormalities may indicate a contribution of the microvascular damage to white matter changes post-injury. Notably, however, abnormal DTI was also observed in players without clear BBB pathology in imaging. This finding may indicate a longer-lasting effect of BBB on white matter fibres, subtle BBBD below our detection level or unrelated pathogenic processes. Primary functional changes in neuronal activity and/or metabolic state that directly or indirectly change microvascular permeability (Vazana et al., 2016; Rüber et al., 2018) should also be considered.
The search for serum biomarkers for mild TBI or associated brain damage has been the subject of intensive research. However, to date there is no single, validated serum biomarker of trauma-related neurodegeneration. We found no correlation between the extent of slow contrast accumulation in players imaging data and the levels of neuronal, astrocytic or inflammatory markers, and no significant differences between players and healthy controls. This negative result may reflect the large variability between players in the extent and localization of BBBD, duration of damage, or small sample size. Alternatively, our results may indicate that BBBD detected by DCE-MRI reflects greater sensitivity or different pathophysiology with regard to blood-based biomarkers of this type of mild neurotrauma.
Our results agree with a previous study showing that longer scans detect low permeability values more accurately (Cramer and Larsson, 2014). Similarly, analysis of contrast enhancement in delayed scans (75 min after contrast injection) was reported to reveal contrast accumulation that was undetected during the first 2 min (Zach et al., 2012). We found only partial overlap between regions of high permeability (NPI) values and those showing leakage using existing two-compartment models, e.g. extended Tofts, and no correlation between NPI values and Tofts model parameters (Ktrans, ve, Kep). Based on imaging of human patients with different neuropathologies, similar enhancement patterns in rats following focal vascular injury and in mice subjected to rmTBI, and Gd-MIMS brain mapping confirming the presence of gadolinium in regions where slow enhancement was detected by in vivo DCE-MRI, we suggest that the slow enhancement represents a true slow leak of contrast agent. Since magnetic resonance experiments inherently suffer from low resolution and low signal-to-noise ratio, we demonstrate slow leaky BBB using high resolution direct imaging of small cortical vessels (intravital fluorescent microscopy). These experiments, showing a slow accumulation of the injected fluorescent tracer following recurrent seizures, support a slow biological process underlying the enhancement. These results are consistent with previous data showing seizure-induced BBB opening (Vazana et al., 2016), and may further suggest that neuronal hyperexcitability underlies BBBD following TBI (McCrory et al., 1997; D’Ambrosio et al., 2009; Kuhl et al., 2018). An alternative explanation is a diffusion of the contrast agent from the fast-enhanced, BBB-disrupted core. While such diffusion may underlie part of the enhancement in some patients, it is less likely explaining most slowly-enhanced lesions because: (i) we found no correlation between the extent of slow enhancement and the distance from the core; and (ii) even in regions with identified ischaemic lesion, slow enhancement was often found in the absence of rapid contrast accumulation.
Following recent studies showing that increased transcellular transport is a key mechanism underlying BBBD in neuropathologies (Kang et al., 2013; De Bock et al., 2016; Haley and Lawrence, 2016; Andreone et al., 2017; Yang et al., 2017; Zhang et al., 2017), we added a cellular compartment to traditional imaging models. The additional volume-transfer constant was highly correlated to NPI values, supporting the role of transcellular transport as an underlying pathology in rmTBI. Future studies are required to uncover specific mechanisms regulating brain microvascular transcellular transport, its role in neuropsychiatric sequelae after TBI and potential as diagnostic and therapeutic targets.
Supplementary Material
Acknowledgements
We gratefully acknowledge the individuals whose participation and contributions made this work possible.
Funding
This study was supported by the European Union’s Seventh Framework Program (FP7/2007–2013; grant #602102, A.F.), the Israel Science Foundation (A.F.), the Israel-USA binational Science Foundation (A.F. and D.K.), the Nova Scotia Health Research Foundation and Canada Institute for Health Research (CIHR), Crown Family Foundation (L.E.G. and A.F.), NIH-NIA Boston University Alzheimer’s Disease Center (P30 AG013846, L.E.G.), Thermo Scientific (in kind support; L.E.G.), Office of the Dean, Boston University School of Medicine (L.E.G.).
Competing interests
The authors report no competing interests.
Glossary
- BBBD =
blood–brain barrier dysfunction
- CTE =
chronic traumatic encephalopathy
- DCE =
dynamic contrast-enhanced
- DTI =
diffusion tensor imaging
- FFDE =
fibre-flux diffusion density
- IFOF =
inferior fronto-occipital fasciculus
- NPI =
normalized permeability index
- rmTBI =
repetitive mild TBI
- TBI =
traumatic brain injury
References
- Abbott NJ, Patabendige AAK, Dolman DEM, Yusof SR, Begley DJ.. Structure and function of the blood-brain barrier. Neurobiol Dis 2010; 37: 13–25. [DOI] [PubMed] [Google Scholar]
- Andreone BJ, Chow BW, Tata A, Lacoste B, Ben-Zvi A, Bullock K, et al. Blood-brain barrier permeability is regulated by lipid transport-dependent suppression of caveolae-mediated transcytosis. Neuron 2017; 94: 581–94.e5. [DOI] [PMC free article] [PubMed] [Google Scholar]
- Aoki Y, Inokuchi R, Gunshin M, Yahagi N, Suwa H.. Diffusion tensor imaging studies of mild traumatic brain injury: a meta-analysis. J Neurol Neurosurg Psychiatry 2012; 83: 870–6. [DOI] [PMC free article] [PubMed] [Google Scholar]
- Artzi M, Liberman G, Nadav G, Blumenthal DT, Bokstein F, Aizenstein O, et al. Optimization of DCE-MRI protocol for the assessment of patients with brain tumors. Magn Reson Imaging 2016; 34: 1242–47. [DOI] [PubMed] [Google Scholar]
- Bahrami N, Sharma D, Rosenthal S, Davenport EM, Urban JE, Wagner B, et al. Subconcussive head impact exposure and white matter tract changes over a single season of youth football. Radiology 2016; 281: 919–26. [DOI] [PMC free article] [PubMed] [Google Scholar]
- Bar-Klein G, Lublinsky S, Kamintsky L, Noyman I, Veksler R, Dalipaj H, et al. Imaging blood–brain barrier dysfunction as a biomarker for epileptogenesis. Brain 2017; 140: 1–14. [DOI] [PubMed] [Google Scholar]
- Bendlin BB, Ries ML, Lazar M, Alexander AL, Dempsey RJ, Rowley HA, et al. Longitudinal changes in patients with traumatic brain injury assessed with diffusion-tensor and volumetric imaging. Neuroimage 2008; 42: 503–14. [DOI] [PMC free article] [PubMed] [Google Scholar]
- Benou I, Veksler R, Friedman A, Raviv TR.. Combining white matter diffusion and geometry for tract-specific alignment and variability analysis. Neuroimage 2019; 200: 674–89. [DOI] [PubMed] [Google Scholar]
- Bieniek KF, Ross OA, Cormier KA, Walton RL, Soto-Ortolaza A, Johnston AE, et al. Chronic traumatic encephalopathy pathology in a neurodegenerative disorders brain bank. Acta Neuropathol 2015; 130: 877–89. [DOI] [PMC free article] [PubMed] [Google Scholar]
- De Bock M, Van Haver V, Vandenbroucke RE, Decrock E, Wang N, Leybaert L.. Into rather unexplored terrain-transcellular transport across the blood-brain barrier. Glia 2016; 64: 1097–123. [DOI] [PubMed] [Google Scholar]
- Boyd BJ, Galle A, Daglas M, Rosenfeld JV, Medcalf R. Traumatic brain injury opens blood-brain barrier to stealth liposomes via an enhanced permeability and retention (EPR)-like effect. J Drug Target 2015; 23: 847–53. [DOI] [PubMed] [Google Scholar]
- Chassidim Y, Veksler R, Lublinsky S, Pell G, Friedman A, Shelef I.. Quantitative imaging assessment of blood-brain barrier permeability in humans. Fluids Barriers CNS 2013; 10: 9. [DOI] [PMC free article] [PubMed] [Google Scholar]
- Cramer SP, Larsson HB.. Accurate determination of blood-brain barrier permeability using dynamic contrast-enhanced T1-weighted MRI: a simulation and in vivo study on healthy subjects and multiple sclerosis patients. J Cereb Blood Flow Metab 2014; 34: 1655–65. [DOI] [PMC free article] [PubMed] [Google Scholar]
- Critchley M. Medical aspects of boxing, particularly from a neurological standpoint. Br Med J 1957; 1: 357–62. [DOI] [PMC free article] [PubMed] [Google Scholar]
- D’Ambrosio R, Hakimian S, Stewart T, Verley DR, Fender JS, Eastman CL, et al. Functional definition of seizure provides new insight into post-traumatic epileptogenesis. Brain 2009; 132: 2805–21. [DOI] [PMC free article] [PubMed] [Google Scholar]
- DeWitt DS, Prough DS.. Traumatic cerebral vascular injury: the effects of concussive brain injury on the cerebral vasculature. J Neurotrauma 2003; 20: 795–825. [DOI] [PubMed] [Google Scholar]
- Doherty CP, O’Keefe E, Wallace E, Loftus T, Keaney J, Kealy J, et al. Blood-brain barrier dysfunction as a hallmark pathology in chronic traumatic encephalopathy. J Neuropathol Exp Neurol 2016; 75: 656–62. [DOI] [PMC free article] [PubMed] [Google Scholar]
- Gajawelli N, Lao Y, Apuzzo MLJ, Romano R, Liu C, Tsao S, et al. Neuroimaging changes in the brain in contact versus noncontact sport athletes using diffusion tensor imaging. World Neurosurg 2013; 80: 824–8. [DOI] [PMC free article] [PubMed] [Google Scholar]
- Gavett BE, Stern RA, Mckee AC.. Chronic traumatic encephalopathy: a potential late effect of sport-related concussive and subconcussive head trauma. Clinics in Sports Medicine 2011; 30: 179–88. [DOI] [PMC free article] [PubMed] [Google Scholar]
- Ghajari M, Hellyer PJ, Sharp DJ.. Computational modelling of traumatic brain injury predicts the location of chronic traumatic encephalopathy pathology. Brain 2017; 140: 333–43. [DOI] [PMC free article] [PubMed] [Google Scholar]
- Haley MJ, Lawrence CB.. The blood-brain barrier after stroke: structural studies and the role of transcytotic vesicles. J Cereb Blood Flow Metab 2016; 37: 456–70. [DOI] [PMC free article] [PubMed] [Google Scholar]
- Hay JR, Johnson VE, Young AMH, Smith DH, Stewart W.. Blood-brain barrier disruption is an early event that may persist for many years after traumatic brain injury in humans. J Neuropathol Exp Neurol 2015; 74: 1147–57. [DOI] [PMC free article] [PubMed] [Google Scholar]
- Heye AK, Culling RD, Valdes Hernandez MDC, Thrippleton MJ, Wardlaw JM.. Assessment of blood-brain barrier disruption using dynamic contrast-enhanced MRI. A systematic review. NeuroImage Clin 2014; 6: 262–74. [DOI] [PMC free article] [PubMed] [Google Scholar]
- Huber BR, Alosco ML, Stein TD, McKee AC.. Potential long-term consequences of concussive and subconcussive injury. Phys Med Rehabil Clin N Am 2016; 27: 503–11. [DOI] [PMC free article] [PubMed] [Google Scholar]
- Hutchinson EB, Schwerin SC, Radomski KL, Irfanoglu MO, Juliano SL, Pierpaoli CM.. Quantitative MRI and DTI abnormalities during the acute period following CCI in the Ferret. Shock 2016; 46: 167–76. [DOI] [PMC free article] [PubMed] [Google Scholar]
- Kamintsky L, Cairns KA, Veksler R, Bowen C, Beyea SD, Friedman A, et al. Blood-brain barrier imaging as a potential biomarker for bipolar disorder progression. NeuroImage Clin 2019; 102049. [DOI] [PMC free article] [PubMed] [Google Scholar]
- Kane MJ, Angoa-Pérez M, Briggs DI, Viano DC, Kreipke CW, Kuhn DM.. A mouse model of human repetitive mild traumatic brain injury. J Neurosci Methods 2012; 203: 41–9. [DOI] [PMC free article] [PubMed] [Google Scholar]
- Kang EJ, Major S, Jorks D, Reiffurth C, Offenhauser N, Friedman A, et al. Blood-brain barrier opening to large molecules does not imply blood-brain barrier opening to small ions. Neurobiol Dis 2013; 52: 204–18. [DOI] [PubMed] [Google Scholar]
- Kassner A, Merali Z.. Assessment of blood-brain barrier disruption in stroke. Stroke 2015; 46: 3310–5. [DOI] [PubMed] [Google Scholar]
- Knowland D, Arac A, Sekiguchi KJJ, Hsu M, Lutz SEE, Perrino J, et al. Stepwise recruitment of transcellular and paracellular pathways underlies blood-brain barrier breakdown in stroke. Neuron 2014; 82: 603–17. [DOI] [PMC free article] [PubMed] [Google Scholar]
- Kuhl NO, Yengo-Kahn AM, Burnette H, Solomon GS, Zuckerman SL.. Sport-related concussive convulsions: a systematic review. Phys Sportsmed 2018; 46: 1–7. [DOI] [PubMed] [Google Scholar]
- Li W, Watts L, Long J, Zhou W, Shen Q, Jiang Z, et al. Spatiotemporal changes in blood-brain barrier permeability, cerebral blood flow, T2 and diffusion following mild traumatic brain injury. Brain Res 2016; 1646: 53–61. [DOI] [PubMed] [Google Scholar]
- Ling H, Morris HR, Neal JW, Lees AJ, Hardy J, Holton JL, et al. . Mixed pathologies including chronic traumatic encephalopathy account for dementia in retired association football (soccer) players. Acta Neuropathol 2017; 133: 337–52. [DOI] [PMC free article] [PubMed] [Google Scholar]
- Lublinsky S, Major S, Kola V, Horst V, Santos E, Platz J, et al. Early blood-brain barrier dysfunction predicts neurological outcome following aneurysmal subarachnoid hemorrhage. EBioMedicine 2019; 43: 460–72. [DOI] [PMC free article] [PubMed] [Google Scholar]
- Marmarou A, Foda MA, van den Brink W, Campbell J, Kita H, Demetriadou K.. A new model of diffuse brain injury in rats. Part I: pathophysiology and biomechanics. J Neurosurg 1994; 80: 291–300. [DOI] [PubMed] [Google Scholar]
- Matsushita M, Hosoda K, Naitoh Y, Yamashita H, Kohmura E.. Utility of diffusion tensor imaging in the acute stage of mild to moderate traumatic brain injury for detecting white matter lesions and predicting long-term cognitive function in adults. J Neurosurg 2011; 115: 130–9. [DOI] [PubMed] [Google Scholar]
- McAllister T, McCrea M.. Long-term cognitive and neuropsychiatric consequences of repetitive concussion and head-impact exposure. J Athl Train 2017; 52: 309–17. [DOI] [PMC free article] [PubMed] [Google Scholar]
- McCrory PR, Bladin PF, Berkovic SF.. Retrospective study of concussive convulsions in elite Australian rules and rugby league footballers: phenomenology, aetiology, and outcome. BMJ 1997; 314: 171–4. [DOI] [PMC free article] [PubMed] [Google Scholar]
- McKee AC, Cairns NJ, Dickson DW, Folkerth RD, Dirk Keene C, Litvan I, et al. The first NINDS/NIBIB consensus meeting to define neuropathological criteria for the diagnosis of chronic traumatic encephalopathy. Acta Neuropathol 2016; 131: 75–86. [DOI] [PMC free article] [PubMed] [Google Scholar]
- McKee AC, Cantu RC, Nowinski CJ, Hedley-Whyte ET, Gavett BE, Budson AE, et al. Chronic traumatic encephalopathy in athletes: progressive tauopathy after repetitive head injury. J Neuropathol Exp Neurol 2009; 68: 709–35. [DOI] [PMC free article] [PubMed] [Google Scholar]
- McKee AC, Daneshvar DH, Alvarez VE, Stein TD.. The neuropathology of sport. Acta Neuropathol 2014; 127: 29–51. [DOI] [PMC free article] [PubMed] [Google Scholar]
- McKee AC, Stein TD, Nowinski CJ, Stern RA, Daneshvar DH, Alvarez VE, et al. The spectrum of disease in chronic traumatic encephalopathy. Brain 2013; 136: 43–64. [DOI] [PMC free article] [PubMed] [Google Scholar]
- Mez J, Daneshvar DH, Kiernan PT, Abdolmohammadi B, Alvarez VE, Huber BR, et al. Clinicopathological evaluation of chronic traumatic encephalopathy in players of American football. JAMA 2017; 318: 360–70. [DOI] [PMC free article] [PubMed] [Google Scholar]
- Montagne A, Barnes SR, Law M, Zlokovic BV, Montagne A, Barnes SR, et al. Blood-brain barrier breakdown in the aging human report blood-brain barrier breakdown in the aging human hippocampus. Neuron 2015; 85: 296–302. [DOI] [PMC free article] [PubMed] [Google Scholar]
- Montenigro PH, Alosco ML, Martin BM, Daneshvar DH, Mez J, Chaisson CE, et al. Cumulative head impact exposure predicts later-life depression, apathy, executive dysfunction, and cognitive impairment in Former High School and College Football Players. J Neurotrauma 2017; 34: 328–40. [DOI] [PMC free article] [PubMed] [Google Scholar]
- Mychasiuk R, Farran A, Esser MJ.. Assessment of an experimental rodent model of pediatric mild traumatic brain injury. J Neurotrauma 2014; 31: 749–57. [DOI] [PubMed] [Google Scholar]
- Nahirney PC, Reeson P, Brown CE.. Ultrastructural analysis of blood–brain barrier breakdown in the peri-infarct zone in young adult and aged mice. J Cereb Blood Flow Metab 2016; 36: 413–25. [DOI] [PMC free article] [PubMed] [Google Scholar]
- Nation DA, Sweeney MD, Montagne A, Sagare AP, D’Orazio LM, Pachicano M, et al. Blood–brain barrier breakdown is an early biomarker of human cognitive dysfunction. Nat Med 2019; 25: 270–6. [DOI] [PMC free article] [PubMed] [Google Scholar]
- Omalu BI, DeKosky ST, Hamilton RL, Minster RL, Kamboh MI, Shakir AM, et al. Chronic traumatic encephalopathy in a National Football League player: part II. Neurosurgery 2006; 59: 1086–92. [DOI] [PubMed] [Google Scholar]
- Patlak CS, Blasberg RG.. Graphical evaluation of blood-to-brain transfer constants from multiple-time Uptake Data. J Cereb Blood Flow Metab 1985; 5: 584–90. [DOI] [PubMed] [Google Scholar]
- Robinson S, Berglass JB, Denson JL, Berkner J, Anstine CV, Winer JL, et al. Microstructural and microglial changes after repetitive mild traumatic brain injury in mice. J Neurosci Res 2017; 95: 1025–35. [DOI] [PMC free article] [PubMed] [Google Scholar]
- Rodríguez-Baeza A, Reina-de la Torre F, Poca A, Martí M, Garnacho A.. Morphological features in human cortical brain microvessels after head injury: a three-dimensional and immunocytochemical study. Anat Rec A Rec 2003; 273: 583–93. [DOI] [PubMed] [Google Scholar]
- Rüber T, David B, Lüchters G, Nass RD, Friedman A, Surges R, et al. Evidence for peri-ictal blood-brain barrier dysfunction in patients with epilepsy. Brain 2018; 141: 2952–65. [DOI] [PubMed] [Google Scholar]
- Rutgers DR, Toulgoat F, Cazejust J, Fillard P, Lasjaunias P, Ducreux D.. White matter abnormalities in mild traumatic brain injury: a diffusion tensor imaging study. AJNR Am J Neuroradiol 2008; 29: 514–9. [DOI] [PMC free article] [PubMed] [Google Scholar]
- Salehi A, Zhang JH, Obenaus A.. Response of the cerebral vasculature following traumatic brain injury. J Cereb Blood Flow Metab 2017; 37: 0271678X1770146. [DOI] [PMC free article] [PubMed] [Google Scholar]
- Sashindranath M, Sales E, Daglas M, Freeman R, Samson AL, Cops EJ, et al. The tissue-type plasminogen activator-plasminogen activator inhibitor 1 complex promotes neurovascular injury in brain trauma: evidence from mice and humans. Brain 2012; 135: 3251–64. [DOI] [PMC free article] [PubMed] [Google Scholar]
- Schoknecht K, Prager O, Vazana U, Kamintsky L, Harhausen D, Zille M, et al. Monitoring stroke progression: in vivo imaging of cortical perfusion, blood-brain barrier permeability and cellular damage in the rat photothrombosis model. J Cereb Blood Flow Metab 2014; 34: 1791–801. [DOI] [PMC free article] [PubMed] [Google Scholar]
- Senatorov VV, Friedman AR, Milikovsky DZ, Ofer J, Saar-Ashkenazy R, Charbash A, et al. Blood-brain barrier dysfunction in aging induces hyperactivation of TGFβ signaling and chronic yet reversible neural dysfunction. Sci Transl Med 2019; 11: 1946–6234. [DOI] [PubMed] [Google Scholar]
- Serlin Y, Ofer J, Ben-Arie G, Veksler R, Ifergane G, Shelef I, et al. Blood-brain barrier leakage: a new biomarker in transient ischemic attacks. Stroke 2019; 50: 1266–1269. [DOI] [PubMed] [Google Scholar]
- Shenton MEE, Hamoda HMM, Schneiderman JSS, Bouix S, Pasternak O, Rathi Y, et al. A review of magnetic resonance imaging and diffusion tensor imaging findings in mild traumatic brain injury. Brain Imaging Behav 2012; 6: 137–92. [DOI] [PMC free article] [PubMed] [Google Scholar]
- Shlosberg D, Benifla M, Kaufer D, Friedman A.. Blood–brain barrier breakdown as a therapeutic target in traumatic brain injury. Nat Rev Neurol 2010; 6: 1–23. [DOI] [PMC free article] [PubMed] [Google Scholar]
- Sourbron SP, Buckley DL.. Classic models for dynamic contrast-enhanced MRI. NMR Biomed 2013; 26: 1004–27. [DOI] [PubMed] [Google Scholar]
- Stamm JM, Bourlas AP, Baugh CM, Fritts NG, Daneshvar DH, Martin BM, et al. Age of first exposure to football and later-life cognitive impairment in former NFL players. Neurology 2015; 84: 1114–20. [DOI] [PMC free article] [PubMed] [Google Scholar]
- Stein TD, Alvarez VE, McKee AC.. Concussion in chronic traumatic encephalopathy. Curr Pain Headache Rep 2015; 19. [DOI] [PMC free article] [PubMed] [Google Scholar]
- Strain JF, Didehbani N, Spence J, Conover H, Bartz EK, Mansinghani S, et al. White matter changes and confrontation naming in retired aging National Football League Athletes. J Neurotrauma 2017; 34: 372–9. [DOI] [PMC free article] [PubMed] [Google Scholar]
- Sweeney MD, Zhao Z, Montagne A, Nelson AR, Zlokovic BV.. Blood-brain barrier: from physiology to disease and back. Physiol Rev 2019; 99: 21–78. [DOI] [PMC free article] [PubMed] [Google Scholar]
- Tagge CA, Fisher AM, Minaeva OV, Gaudreau-Balderrama A, Moncaster JA, Zhang XL, et al. Concussion, microvascular injury, and early tauopathy in young athletes after impact head injury and an impact concussion mouse model. Brain 2018; 141: 422–58. [DOI] [PMC free article] [PubMed] [Google Scholar]
- Tofts PS. Modeling tracer kinetics in dynamic Gd-DTPA MR imaging. J Magn Reson Imaging 1997; 7: 91–101. [DOI] [PubMed] [Google Scholar]
- Tofts PS, Brix G, Buckley DL, Evelhoch JL, Henderson E, Knopp MV, et al. Estimating kinetic parameters from dynamic contrast-enhanced T1- weighted MRI of a diffusable tracer: standardized quantities and symbols. J Magn Reson Imaging 1999; 10: 223–32. [DOI] [PubMed] [Google Scholar]
- Tofts PS, Kermode AG.. Measurement of the blood-brain barrier permeability and leakage space using dynamic MR imaging. 1. Fundamental concepts. Magn Reson Med 1991; 17: 357–67. [DOI] [PubMed] [Google Scholar]
- Tomkins O, Shelef I, Kaizerman I, Eliushin A, Afawi Z, Misk A, et al. Blood – brain barrier disruption in post-traumatic epilepsy. J Neurol Neurosurg Psychiatry 2008; 79: 774–7. [DOI] [PubMed] [Google Scholar]
- Tu T-W, Lescher JD, Williams RA, Jikaria N, Turtzo LC, Frank JA.. Abnormal injury response in spontaneous mild ventriculomegaly Wistar rat brains: a pathological correlation study of diffusion tensor and magnetization transfer imaging in mild traumatic brain injury. J Neurotrauma 2017; 34: 248–56. [DOI] [PMC free article] [PubMed] [Google Scholar]
- Vazana U, Veksler R, Pell G, Prager O, Fassler M, Chassidim Y, et al. Glutamate-mediated blood–brain barrier opening: implications for neuroprotection and drug delivery. J Neurosci 2016; 36: 7727–39. [DOI] [PMC free article] [PubMed] [Google Scholar]
- Veksler R, Shelef I, Friedman A.. Blood-brain barrier imaging in human neuropathologies. Arch Med Res 2014; 45: 646–52. [DOI] [PMC free article] [PubMed] [Google Scholar]
- Vidarsson L, Thornhill RE, Liu F, Mikulis DJ, Kassner A.. Quantitative permeability magnetic resonance imaging in acute ischemic stroke: how long do we need to scan?. Magn Reson Imaging 2009; 27: 1216–22. [DOI] [PubMed] [Google Scholar]
- Villringer K, Sanz Cuesta BE, Ostwaldt A-C, Grittner U, Brunecker P, Khalil AA, et al. DCE-MRI blood-brain barrier assessment in acute ischemic stroke. Neurology 2016; 88: 433–40. [DOI] [PubMed] [Google Scholar]
- Weissberg I, Veksler R, Kamintsky L, Saar-Ashkenazy R, Milikovsky DZ, Shelef I, et al. Imaging blood-brain barrier dysfunction in football players. JAMA Neurol 2014; 71: 1453–5. [DOI] [PubMed] [Google Scholar]
- Yang Y, Xiong X, Liu J, Wu L, Zhong Q, Zhou K, et al. Mfsd2a (Major facilitator superfamily domain containing 2a) attenuates intracerebral hemorrhage–induced blood–brain barrier disruption by inhibiting vesicular transcytosis. J Am Heart Assoc 2017; 6 Available from: http://jaha.ahajournals.org/content/6/7/e005811 [DOI] [PMC free article] [PubMed] [Google Scholar]
- Zach L, Guez D, Last D, Daniels D, Grober Y, Nissim O, et al. Delayed contrast extravasation MRI for depicting tumor and non-tumoral tissues in primary and metastatic brain tumors. PLoS One 2012; 7: e52008. [DOI] [PMC free article] [PubMed] [Google Scholar]
- Zhang J, Liu H, Du X, Guo Y, Chen X, Wang S, et al. Increasing of blood-brain tumor barrier permeability through transcellular and paracellular pathways by microbubble-enhanced diagnostic ultrasound in a C6 glioma model. Front Neurosci 2017; 11: 86. [DOI] [PMC free article] [PubMed] [Google Scholar]
- Zlokovic BV. The blood-brain barrier in health and chronic neurodegenerative disorders. Neuron 2008; 57: 178–201. [DOI] [PubMed] [Google Scholar]
Associated Data
This section collects any data citations, data availability statements, or supplementary materials included in this article.
Supplementary Materials
Data Availability Statement
The data that support the findings of this study are available from the corresponding author, upon reasonable request.