Abstract
Background
A high-salt diet may result in chronic disease and changes in the intestinal microbiota. This pilot study aimed to investigate the microbial composition of the intestine in Wistar rats given intragastric high-salt infusions for four weeks.
Material/Methods
Six 4-week-old male Wistar rats were fed standard chow and divided into the high-salt group (n=3) and the control study group (n=3). Rats in the high-salt group were given 1 ml of 10% NaCl solution intragastrically three times per week for four weeks. The fecal pellets were collected, and the microbiota was characterized using 16S rRNA gene sequencing that targeted the V4 region. The relative abundance of microbial populations was compared using linear discriminant analysis effect size (LEfSe) statistical analysis for the identification of biomarkers between two or more groups, principal component analysis (PCA), and linear discriminant analysis (LDA). Microbial genome prediction was performed using the phylogenetic investigation of communities by reconstructing the unobserved states (PICRUSt) bioinformatics software.
Results
There was no significant difference in the alpha diversity of the fecal microbiota between the high-salt group and the control group. However, PCA showed structural segregation between the two groups. Further analysis using LEfSe showed that the intestinal contents in the high-salt group had significantly reduced populations of Lactobacillus and Prevotella NK3B31, and a significant increase in Alloprevotella and Prevotella 9, without physiological or pathological changes.
Conclusions
A pilot study in Wistar rats showed that high-salt intake was associated with a change in the composition of the intestinal microbiota.
MeSH Keywords: Salinity; Microbiota; Rats, Wistar
Background
The human gastrointestinal tract hosts a microbiota that contains abundant and varied micro-organisms involved in physiological processes, metabolic processes, and the immune response. Therefore, changes in the composition of the microbiota may affect host health. The human intestine is rapidly colonized by microbes following birth, and many environmental factors, including the mode of delivery or diet, play a key role in changes in the composition of the microbiota [1–3]. The microbiota undergoes changes during early life, leading to the development of a profile that is characteristic of the adult gastrointestinal tract [4,5], which is relatively stable over time [6]. However, changes in dietary patterns and food types may cause a change in the profile of the intestinal microbiota. Previous studies have shown that the consumption of a diet that is rich in whole grains was associated with an increased fecal Bifidobacteria in healthy volunteers, whereas the consumption of red wine increased Enterococcus, Prevotella, Bacteroides, Bifidobacteria, Bacteroides uniformis, Eggerthella lenta, and Blautia coccoides-Eubacterium rectale [7–10]. Other dietary factors, including a high-fat and low-fiber diet, may affect the composition of the microbiota and potentially contribute to disease pathogenesis [11].
Dysbiosis of the gut microbiota is involved in some chronic diseases, such as hypertension, and preeclampsia [12]. Yang et al. showed that an animal model of hypertension developed reduced diversity of the gut microbiota, with an increased ratio of Firmicutes/Bacteroidetes [13]. A high-salt diet has been reported to increase the serum sodium to potassium ratio in the gut, which is associated with hypertension [14]. Each 1.00 gm of dietary salt reduction in hypertensive individuals resulted in a 0.94 mmHg reduction in systolic blood pressure [14]. However, the underlying mechanism of these effects remains unclear. An epidemiological study in China showed that a high-salt diet contributes to 14.5%, 7.8%, and 25.2% of deaths caused by chronic disorders, tumors, and cardiovascular disease, respectively [15]. In 2017, Wilck et al. showed that a high-salt intake was associated with a change in the composition of the microbiota, leading to Th17 cell activation in mice [16]. These previous studies have shown an association between a high-salt diet and disease that may result from a shift in the composition of the gut microbiota. Therefore, this pilot study aimed to investigate the microbial composition of the intestine in Wistar rats given intragastric high-salt infusions for four weeks.
Material and Methods
Animal diet and study groups
Four-week-old male Wistar rats (n=6), weighing between 80–120 gm, were purchased from Beijing HFK Bioscience Co., Ltd. (Beijing, China). The rats were housed in the Animal Laboratory, Qilu Hospital of Shandong University. The rats were allowed to acclimatize for one week and were then housed under standard laboratory conditions at 25±1°C and 60% humidity, with a 12-hourly light and dark cycle. The rats were fed standard specific pathogen-free (SPF) ShooBree laboratory cubed rat chow pellets, consisting of wheat protein (200 gm/kg), fats (40 gm/kg), fiber (50 gm/kg), crude ash (80 gm/kg), calcium (10–18 gm/kg), phosphorus (6–12 gm/kg), lysine (13.2 gm/kg), DL-methionine (7.8 gm/kg), and water (100 gm/kg) (Jiangsu Province Collaborative Pharmaceutical Bioengineering Co., Ltd., Jiangyin City, Jiangsu Province, China). The approximate percentage of total calories were derived from 22.8% protein, 63.4% carbohydrate, and 13.8% fat. The experimental protocol was approved by the Experimental Animal Ethics Committee of Qilu Hospital of Shandong University (Approval No. DWLL-2018-009).
Six rats were randomly divided into the high-salt group (n=3) and the control group (n=3). The high-salt group was given 1 ml of 10% NaCl solution by intragastric administration (gavage). The control group was given 1 ml of water three times per week for four weeks. The rats were allowed unrestricted access to food and water during the study period and were monitored by daily observation of the coat condition and any deviation from normal behavior, including changes in normal appetite.
Histology of the rat intestinal tissue
At the end of the study, the rats were euthanized with 10% chloral hydrate by intraperitoneal anesthesia (300 mg/kg). The intestinal tissue samples were collected, placed in processing cassettes and fixed in 4% paraformaldehyde for 18 h, then dehydrated in graded ethanols at 75%, 85%, 90%, 95%, and 100% for 60 min, 60 min, 60 min, 60 min, 90 min, and 90 min, respectively. Following deparaffinization and clearing with xylene, the tissue samples were embedded in paraffin wax, sectioned at 3 μm, and routinely stained using hematoxylin and eosin (H&E) using a DP260 Autostainer (Dakewe Biotech Co., Ltd., Beijing, China), according to the manufacturer’s instructions.
Biochemical serum assays
Blood samples from the rats were collected in 5 ml Vacutainer tubes (BD Vacutainer, Plymouth, Devon, UK). The tubes were incubated at room temperature (20–25°C) for 30 min to 1 h. After centrifuging at 3,000×g for 10 min at room temperature, the serum was transferred into 1.5 ml Eppendorf tubes and stored at −80°C. The serum levels of aspartate aminotransferase (AST), alanine aminotransferase (ALT), glutamate dehydrogenase (GDH), albumin, total bilirubin, creatinine, urea, glucose, triglyceride, and cholesterol were measured. All assays were conducted using the Cobas® 8000 modular chemistry analyzer (Roche Diagnostics, Basel, Switzerland), according to the manufacturer’s instructions.
Analysis of the composition of the fecal intestinal microbiota
After the final intragastric administration, the fecal pellets of the rats in the high-salt group and the control group were collected. DNA was extracted and purified using cetyltrimethylammonium bromide cationic detergent. The DNA samples were diluted to 1 ng/μL, and the polymerase chain reaction (PCR) was performed. The 16S ribosomal RNA (16S rRNA) V4 region was amplified with 515F–806R primers for the microbiome. The gene library was established using the Ion Plus Fragment Library Kit 48 rxns (Cat. No. A28950) (Thermo Fisher Scientific, Waltham, MA, USA), and was validated and quantified using Qubit software. The DNA samples were then sequenced using the Life Ion S5™ XL system (Thermo Fisher Scientific, Waltham, MA, USA), according to the manufacturer’s instructions.
Analysis of the fecal microbiota
Microbial diversity was analyzed by filtering the DNA sequences with Cutadapt version 1.9.1, and the chimeric sequences were detected and removed by comparison with the Genomes Online Database (GOLD) (http://drive5.com/uchime/uchime_download.html) using the UCHIME algorithm (http://www.drive5.com/usearch/manual/uchime_algo.html) [17–19]. The sequences identified were further analyzed using Uparse version 7.0.1001 software to identify operational taxonomic units (OTUs), defined by ≥97% identity to the 16S sequences [20]. The OTUs underwent taxonomic analysis with a Bayesian classifier that was based on the SILVA ribosomal RNA gene database (https://www.arb-silva.de) [21,22].
Statistical analysis
Adonis (for permutational multivariate analysis of variance) was used for principal component analysis (PCA). PCA was based on the weighted and unweighted UniFrac distance metric for comparison of biological populations. The PCA module in the ade4 package and the ggplot2 package of R software (version 2.15.3) were used to visualize the data. For classification results in each species or each group, the species of special concern (the genera with the maximum relative abundance in the default top ten) were selected for species classification tree statistics. Linear discriminant analysis (LDA) was used to identify the differences in the bacteria species of the two groups. The Z-value of each sample by classification was calculated, and a heat map was plotted. The Z-value was the difference between the score and the mean of the distribution divided by the standard deviation (SD) of all samples included in the classification. Two-way analysis of variance (ANOVA) followed by Bonferroni’s post hoc test were used to compare the weighted difference between the two groups. The data were expressed as the mean±standard error (SEM), unless otherwise specified. A P-value <0.05 was considered to be statistically significant.
Results
Diversity of the microbiota in the intestine of rats in the high-salt group and the control group
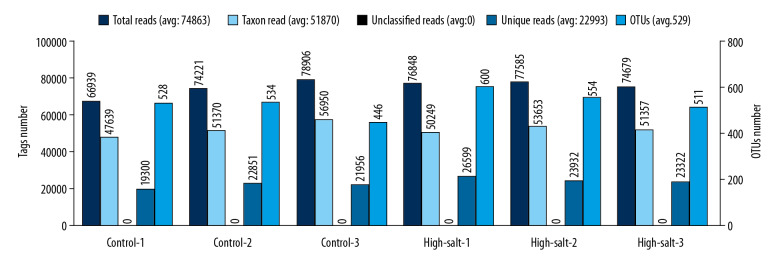
The number of reads were comparable between the high-salt group (n=3) and the control group (n=3) of the rats in the study, and the mean operational taxonomic unit (OTU) number was 555 and 503, respectively. No significant difference in species diversity was detected between the high-salt group (6.06±0.63) and the control group (6.54±0.32) (P=0.40) (Figure 1).
Figure 1.
Operational taxonomic unit (OTU) clustering and annotation statistics for the individual rats in the study group and the control group. Microbial DNA was extracted from the rat fecal pellets after a four-week scheduled intragastric administration of a high-salt solution (the study group) or water (the control group). The X-axis, individual rats of the control and high-salt group. The Y-axis (left), reads number. The Y-axis (right), the OTU number.
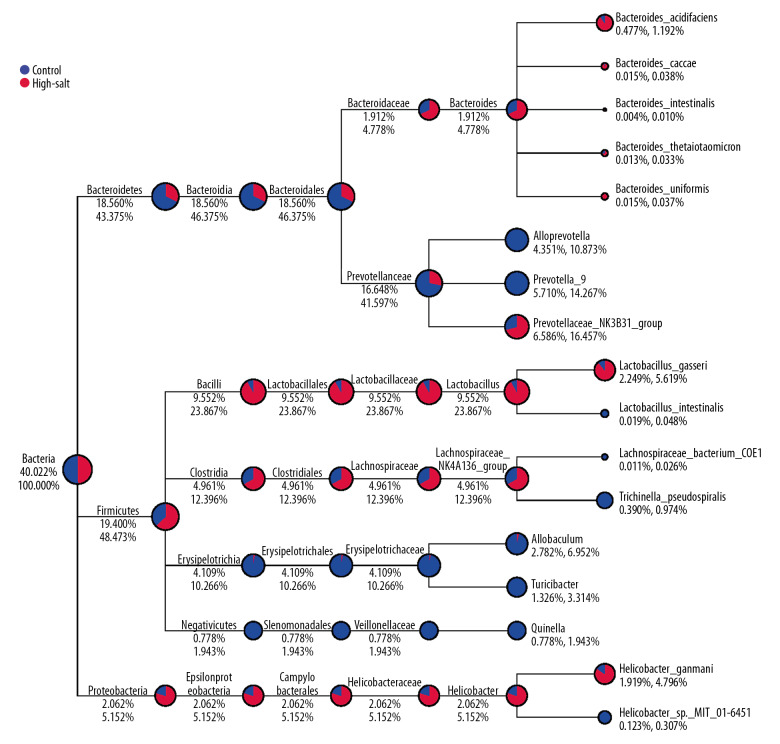
The relative abundances of each phylum or genus in the two study groups are summarized in Table 1 and Table 2. At the phylum level, Bacteroidetes in the intestine of the high-salt group (58.4%) were the most abundant, whereas Firmicutes were most abundant in the control group (48.0%). Also, Spirochaetes and Acidobacteria were only observed in the high-salt group of rats, whereas Lentisphaerae was only found in the control group. At the genus level, Lactobacillus, Prevotellaceae NK3B31, Lachnospiraceae NK4A136, Helicobacter, and Bacteroides were significantly more abundant in the control rats. In contrast, Prevotella 9, Allobaculum, Turicibacter and Quinella were more abundant in the high-salt group of rats (Figure 2).
Table 1.
Changes in the phylum level of the control group and the high-salt group of rats.
| Taxonomy | Control (%) | High-salt (%) | P-value |
|---|---|---|---|
| Bacteroidetes | 46.8195±20.5722 | 58.4108±15.2788 | 0.4805 |
| Firmicutes | 48.0279±18.6839 | 36.7640±11.4529 | 0.4332 |
| Proteobacteria | 3.7777±1.6880 | 3.3040±3.5810 | 0.8497 |
| Spirochaetes | 0 | 0.3275±0.4655 | 0.3473 |
| Cyanobacteria | 0.5877±0.1673 | 0.1673±0.3545 | 0.4816 |
| Tenericutes | 0.4009±0.3400 | 0.2897±0.0782 | 0.6315 |
| Actinobacteria | 0.0784±0.0337 | 0.2239±0.1297 | 0.1855 |
| Verrucomicrobia | 0.2512±0.0534 | 0.0063±0.0001 | 0.0155 |
| Saccharibacteria | 0.0112±0.0104 | 0.1525±0.0539 | 0.0409 |
| Euryarchaeota | 0.0329±0.0285 | 0.0938±0.0361 | 0.0874 |
| Deferribacteres | 0.0028±0.0048 | 0.0091±0.008 | 0.3188 |
| Lentisphaerae | 0.0021±0.0036 | 0 | 0.4226 |
| Gemmatimonadetes | 0.0014±0.0024 | 0.0007±0.0012 | 0.6856 |
| Acidobacteria | 0 | 0.0014±0.0024 | 0.4226 |
| Others | 0.0063±0.0056 | 0.0112±0.0176 | 0.6842 |
Mean±standard deviation (SD).
Table 2.
Changes in the genus level of the control group and the high-salt group of rats.
| Taxonomy | Control (%) | High-salt (%) | P-value |
|---|---|---|---|
| Prevotellaceae_NK3B31 | 9.3614±1.9140 | 3.8113±0.0513 | 0.6077 |
| Lactobacillus | 17.585±0.0380 | 1.5191±0.0111 | 0.0001 |
| Alloprevotella | 0.0133±0.0001 | 8.6897±0.2407 | 0.0336 |
| Prevotella_9 | 0.0315±0.0001 | 11.3884±0.0261 | 0.0009 |
| Allobaculum | 0.2323±0.0009 | 5.3325±0.3052 | 0.1433 |
| Lachnospiraceae_NK4A136 | 6.6479±0.2856 | 3.2739±0.1289 | 0.4666 |
| Bacteroides | 2.6015±0.0340 | 1.2231±0.0022 | 0.2259 |
| Turicibacter | 0.0182±0.0001 | 2.6344±0.0556 | 0.0947 |
| Helicobacter | 3.2963±0.0258 | 0.8278±0.0156 | 0.0742 |
| Quinella | 0.0049±0.0001 | 1.5506±0.0355 | 0.1810 |
Mean±standard deviation (SD).
Figure 2.
The taxa_tree of the specific species for rats in the study group and the control group. The different colors in the circle represented the different groups. The fan-shaped size indicates the relative abundance ratio in each classification of the two groups. The number below the category name indicates the percentage of average relative abundance in this classification. The number on the left represents the percentage of all species. The number on the left represents the percentage of the selected species.
Composition of the microbiota in the individual rats
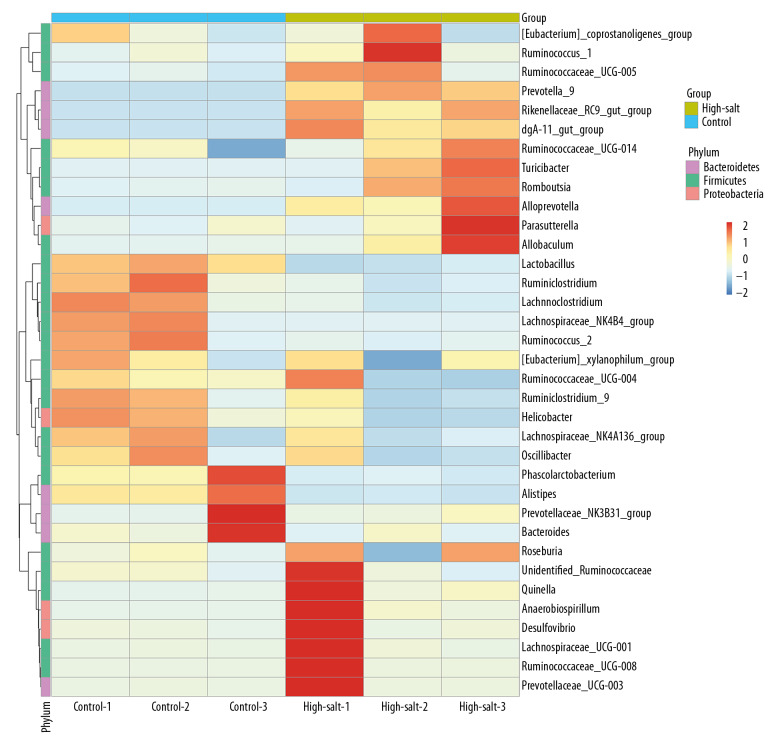
The composition of the microbiota was further analyzed using principal component analysis (PCA), which showed a significant difference between the two rat groups (Figure 3). A heat map was developed that showed the abundance of bacteria at the genus level (the 35 most abundant) for the individual rats (Figure 4). In addition to the previously described genera, Ruminococcus 1, Ruminococcaceae UCG-005, Prevotella 9, Rikenellaceae RC9 gut group, dgA-11 gut group, Ruminococcaceae UCG, Turicibacter, Romboutsia, Alloprevotella, and Allobaculum were enriched in the high-salt rat group. However, Lactobacillus, Ruminiclostridium, Lachnoclostridium, Lachnospiraceae NK4B4 group, Ruminococcus 2, Phascolarctobacterium, and Alistipes were enriched in the control rats. The criteria was set at a linear discriminant analysis (LDA) ≥4, and the linear discriminant analysis effect size (LEfSe) analysis between two groups showed that at the genus level, Lactobacillus was significantly more abundant in the control rats. In contrast, Turicibacter, Prevotella 9, and Alloprevotella were significantly more abundant in the high-salt rat group (Figure 5).
Figure 3.
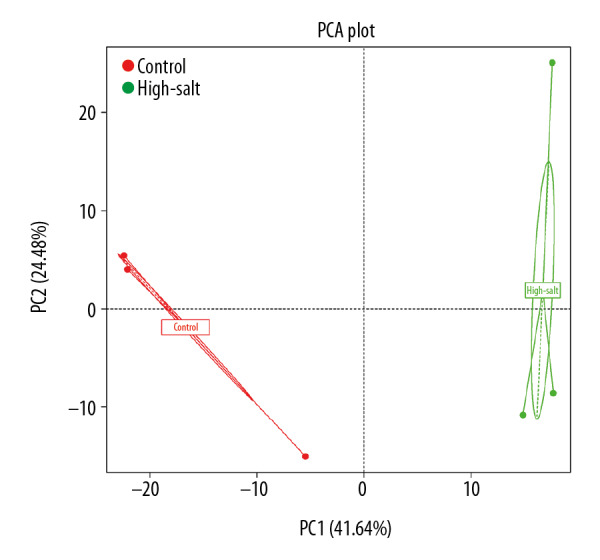
The principal component analysis (PCA) plots for the high-salt group and the control group of rats. The percentage in the X-axis represents the contribution of the first principal component. The Y-axis represents the contribution of the second principal component. The dot in the figure represents one sample.
Figure 4.
The species abundance clustering map of the control group and the high-salt group of rats. The sample information is shown vertically, and the species annotation information is shown horizontally. Left is the clustering tree for the microbial species. The top is the clustering tree for the different groups. The intermediate heat map value is obtained after the standardization of the relative abundance of the microbial species.
Figure 5.
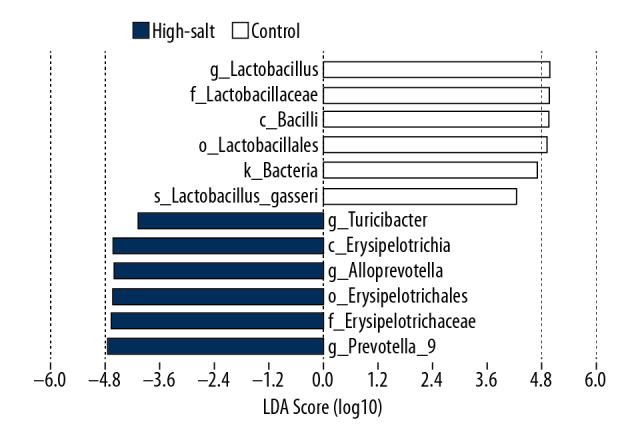
Histogram of the linear discriminant analysis (LDA) score for the gut microbiota in the control group and the high-salt group of rats. The statistically significant differences in the microbiota of the two groups were analyzed using linear discriminant analysis effect size (LEfSe) statistical analysis for the identification of biomarkers between two or more groups and is shown in the histogram. The length of histogram represents the degree of influence of the different microbiota.
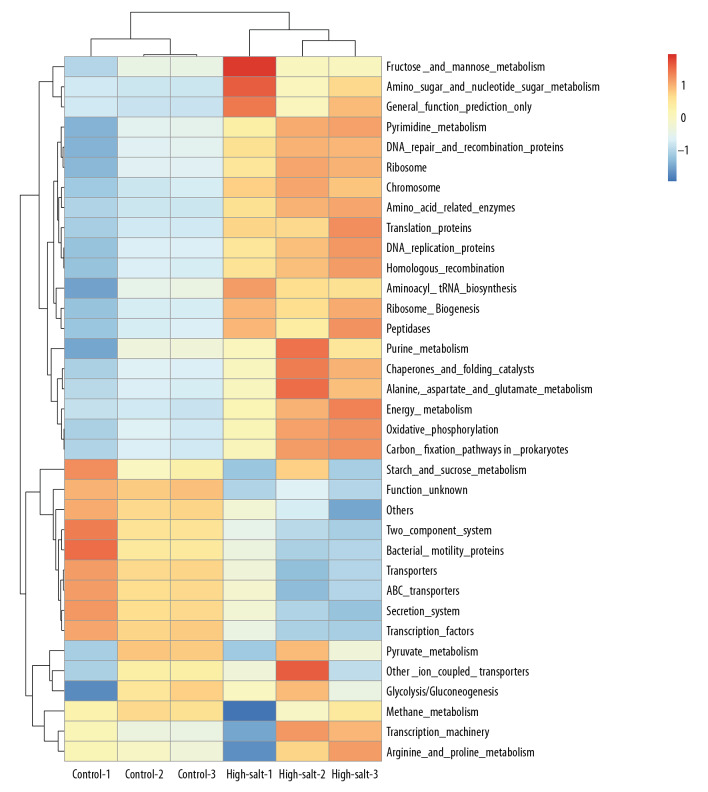
The functional composition of the microbiota used the phylogenetic investigation of communities by reconstructing the unobserved states (PICRUSt) algorithm, as previously described [23]. PICRUSt is a computational approach in which evolutionary modeling is used to predict the gene families from 16S rRNA gene sequencing data and a reference genome database. The results showed that the composition of microbiota was associated with biological functions, which included metabolism and cellular processes (Figure 6). Further analysis showed that the microbiota associated with pyruvate metabolism had changed significantly in the high-salt group (1.13±0.02) compared with the control group (1.21±0.01) (P=0.026).
Figure 6.
The prediction of the functional composition of the rat gut microbiota in the control group and the high-salt group using the phylogenetic investigation of communities by reconstructing the unobserved states (PICRUSt) bioinformatics software.
Physiological conditions of the high-salt and control rats
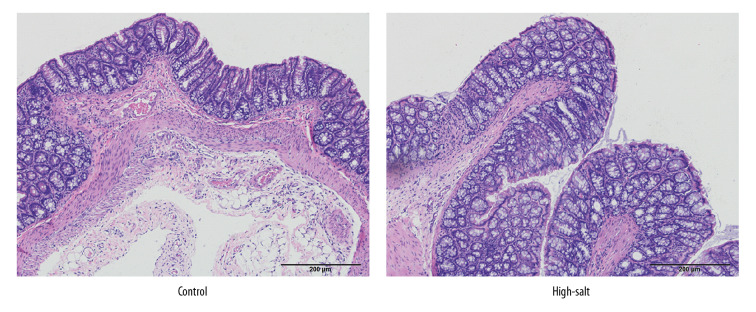
The physiological conditions in the high-salt and control rats were also evaluated. Body conditions were compared between the two groups. No abnormal behavior was observed in the two rat groups. Food intake was slightly increased in the high-salt rat group when compared with the control rats, but this did not result in a significantly increased gain in weight (Figure 7). No significant morphological changes in the rat gut tissues were observed in the two groups (Figure 8). Blood pressure did not differ significantly between the two groups (P>0.05). No significantly different physiological parameters were identified in the serum between the high-salt group and the control group of rats studied (all P>0.05) (Table 3).
Figure 7.
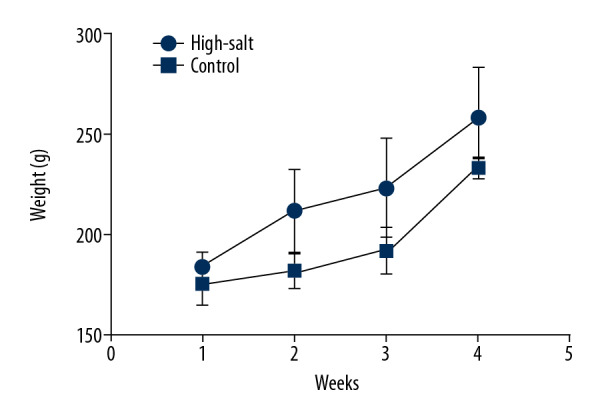
Changes in the body weight of the control group and the high-salt group of rats. The weight of the rats was recorded weekly for four weeks following the intragastric administration of the high-salt solution.
Figure 8.
The morphological changes of rat intestinal tissue in the control group and the high-salt group of rats. The rats were euthanized, and the intestinal tissue samples were prepared for histology, sectioned, and stained with hematoxylin and eosin (H&E). The histology shows that no significant histological changes were observed in the high-salt group or the control group of rats.
Table 3.
Changes in the physiological parameters in the serum of the control group and the high-salt group of rats.
| Parameters | Control | High-salt | P-value |
|---|---|---|---|
| Alanine aminotransferase (ALT) (U/L) | 32.67±4.04 | 31.33±4.04 | 0.707 |
| Aspartate aminotransferase (AST) (U/L) | 117.70±9.50 | 113.30±12.01 | 0.650 |
| Glutamate dehydrogenase (GLDH) (U/L) | 8.07±0.55 | 8.27±0.54 | 0.680 |
| Total bilirubin (g/L) | 60.03±2.14 | 59.87±1.14 | 0.948 |
| Albumin protein (g/L) | 35.73±0.60 | 35.70±0.26 | 0.934 |
| Creatinine (Cr, μmol/L) | 41.67±4.73 | 40.67±4.16 | 0.800 |
| Urea (mmol/L) | 6.56±0.44 | 6.57±0.23 | 0.974 |
| Glucose (GLU) (mmol/L) | 8.46±0.35 | 8.30±0.42 | 0.640 |
| Triglycerides (TG) (mmol/L) | 1.15±0.18 | 1.19±0.17 | 0.775 |
| Cholesterol (CHO) (mmol/L) | 2.17±0.37 | 2.20±0.25 | 0.932 |
Mean±standard deviation (SD).
Discussion
The aim of this study was to investigate the effects of high-salt intake on the composition of the gut microbiota in Wistar rats. The results showed that the population of Alloprevotella, Prevotella 9, Allobaculum, and Turicibacter were enriched in the high-salt group of rats. In contrast, the populations of Lactobacillus, Prevotella NK3B31, and Helicobacter were reduced in the high-salt group. No physiological or pathological changes were observed in the high-salt group, which indicated that the change in the composition of the microbiota occurred before the development of physiological symptoms.
The findings from the present study were supported by those from previous studies, which have also shown similar effects of a high-salt diet on the gut microbiota. Bier et al. [24] showed that a high-salt diet modulated gut microbiota and the production of short-chain fatty acids. However, the Erwinia genus, the Christensenellaceae and Corynebacteriaceae families, and the Anaerostipes genus were changed [24]. It is possible that these findings may have been due to the use of different rats and different concentrations of salt used. In 2019, Towhid [25] reported the findings from a meta-analysis on the effects of a high-salt diet on the gut microbiome in rodents, which identified the dependence of the mammalian gut microbiome on the amount of salt ingested. These studies support that the relationship between high-salt and gut microbiota should be further explored.
Although no physiological or pathological differences were observed in the present study, the administration of high-salt solution during four weeks was associated with a change in the composition of the microbiota. The gastrointestinal tract is host to an estimated 100 trillion bacteria, and the role of the gut microbiome on the health of the host has been increasingly recognized [26]. For example, Lactobacillales are beneficial to human health [27,28], whereas Bacteroides are known pathogens [29]. A previously published study has shown that Erysipelotrichia is associated with the pathogenesis of fatty liver [30]. In the present study, four weeks of administration of a high-salt solution significantly increased the abundance of Erysipelotrichia.
Also, a high-salt intake might increase appetite, which contributes to weight gain. The findings from the present study also showed that the body weight of rats in the high-salt group was increased, although the difference was not statistically significant. This finding was supported by Pindjakova et al., who reported that Erysipelotrichia was more abundant in obese mice [31]. Also, the findings from this study showed that the population of Lactobacillus in the rat gut was significantly reduced in the high-salt group. It has previously been shown that salt (NaCl) could alter the composition of the bacterial capsule of Lactobacillus, including the fatty acid composition, with an increase in the ratio of unsaturated to saturated fatty acid, phosphatidylinositol, and cardiolipin, resulting in damage to the bacterium [32]. A previous study also showed that demonstrated high-salt intake could induce Th17 cells and reduced the population of Lactobacillus, which may result in changes in the immune response [16].
In the present study, the functional composition of the rat gut microbiota was predicted using the phylogenetic investigation of communities by reconstructing the unobserved states (PICRUSt) bioinformatics software. Gut microbiota associated with pyruvate metabolism were significantly changed in the high-salt group. The genus Lactobacillus has been reported to modulate some important metabolic pathways, including pyruvate metabolism [33]. Salzillo et al. also found that pyruvate dehydrogenase of Lactobacillus contributed to binding with collagen type I, which mediating host cell adhesion and invasion [34]. Fernandez et al. showed that Lactobacillus had effects on fatty acid biosynthesis by altering pyruvate metabolism [35]. In the present study, pyruvate metabolism was reduced in the high-salt group. Therefore, it is possible that a high-salt diet reduces pyruvate metabolism, which reduces glucose or fat metabolism to promote fat accumulation. In the present study, food intake was slightly higher in the high-salt group, and the body weight increased, although this increase did not reach statistical significance when compared with the control group (Figure 7). Following the development of the Lactobacillus strain and the construction of the high-salt rat model, we intend to investigate the underlying mechanism involved by multiple technical methods, including gas chromatography-mass spectrometry (GC-MS) and liquid chromatography with tandem mass spectrometry (LC-MS/MS) metabolomic methods, and next-generation sequencing (NGS).
An increase of Lachnospiraceae and Ruminococcus has also been previously reported [36]. However, in contrast to the findings from the present study of a reduced Firmicutes/Bacteroidetes ratio in the high-salt group (36.8/58.4) compared with the control group (48.0/46.8), this ratio was previously found to be increased [36]. This inconsistency is may be due to the different protocols, as rats in the present study were given the salt solution for four weeks by gastric gavage. The different findings might also be due to the differences in the genetic background of rats used in the different studies. This finding may also have relevance to human diseases, such as hypertension, cardiovascular disease, and gastrointestinal symptoms associated with a high-salt diet, which may arise from the shift in the composition of the microbiota and which are specific to each individual.
This was a preliminary study and had several limitations. A small number of rats were used in this preliminary study, and they were young adult rats. Because the effects of high-salt intake on the composition of the microbiota may require time to develop, future studies should be conducted during a longer period to determine the long-term impact of a high-salt diet on health.
Conclusions
This pilot study aimed to investigate the microbial composition of the intestine in Wistar rats given intragastric high-salt infusions for four weeks. High-salt intake was associated with a shift in the composition of the gastrointestinal microbiota, with reduced Lactobacillus and increased Erysipelotrichia. This shift occurred without significant physiological or pathological abnormalities. These findings may provide a foundation for improving the understanding of the role of microbiota in the pathogenesis of diseases associated with high-salt intake.
Footnotes
Conflict of interest
None.
Source of support: This study was supported by the National Natural Science Foundation of China (Grant No: 81572070, 31500741, 81601757, 81401709, and 81601572), the Natural Science Foundation of Shandong Province (Grant No: ZR2017MH044, ZR2017PH049, and BS2014SW022), the Key Research and Development Project of Shandong Province (Grant No. 2016GSF201122, 2016GSF201124, 2015GSF118152, 2018GSF118104, 2019GSF108121), the Science and Technology Development Project in Jinan (Grant No. 201805084, 201805061), the Resident Standardized Training Research of Qilu Hospital of Shandong University (Grant No. ZPZX2017A05), and the Science Foundation of Qilu Hospital of Shandong University (Grant No. 2015QLQN38)
References
- 1.Dominguez-Bello MG, Costello EK, Contreras M, et al. Delivery mode shapes the acquisition and structure of the initial microbiota across multiple body habitats in newborns. Proc Natl Acad Sci USA. 2010;107(26):11971–75. doi: 10.1073/pnas.1002601107. [DOI] [PMC free article] [PubMed] [Google Scholar]
- 2.Fernandez L, Langa S, Martin V, et al. The human milk microbiota: Origin and potential roles in health and disease. Pharmacol Res. 2013;69(1):1–10. doi: 10.1016/j.phrs.2012.09.001. [DOI] [PubMed] [Google Scholar]
- 3.Fouhy F, Guinane CM, Hussey S, et al. High-throughput sequencing reveals the incomplete, short-term recovery of infant gut microbiota following parenteral antibiotic treatment with ampicillin and gentamicin. Antimicrob Agents Chemother. 2012;56(11):5811–20. doi: 10.1128/AAC.00789-12. [DOI] [PMC free article] [PubMed] [Google Scholar]
- 4.Avershina E, Storro O, Oien T, et al. Major faecal microbiota shifts in composition and diversity with age in a geographically restricted cohort of mothers and their children. FEMS Microbiol Ecol. 2014;87(1):280–90. doi: 10.1111/1574-6941.12223. [DOI] [PubMed] [Google Scholar]
- 5.Palmer C, Bik EM, DiGiulio DB, et al. Development of the human infant intestinal microbiota. PLoS Biol. 2007;5(7):e177. doi: 10.1371/journal.pbio.0050177. [DOI] [PMC free article] [PubMed] [Google Scholar]
- 6.Mehta RS, Abu-Ali GS, Drew DA, et al. Stability of the human faecal microbiome in a cohort of adult men. Nat Microbiol. 2018;3(3):347–55. doi: 10.1038/s41564-017-0096-0. [DOI] [PMC free article] [PubMed] [Google Scholar]
- 7.Carvalho-Wells AL, Helmolz K, Nodet C, et al. Determination of the in vivo prebiotic potential of a maize-based whole grain breakfast cereal: A human feeding study. Br J Nutr. 2010;104(9):1353–56. doi: 10.1017/S0007114510002084. [DOI] [PubMed] [Google Scholar]
- 8.Kabeerdoss J, Devi RS, Mary RR, et al. Faecal microbiota composition in vegetarians: Comparison with omnivores in a cohort of young women in southern India. Br J Nutr. 2012;108(6):953–57. doi: 10.1017/S0007114511006362. [DOI] [PubMed] [Google Scholar]
- 9.Ou J, Carbonero F, Zoetendal EG, et al. Diet, microbiota, and microbial metabolites in colon cancer risk in rural Africans and African Americans. Am J Clin Nutr. 2013;98(1):111–20. doi: 10.3945/ajcn.112.056689. [DOI] [PMC free article] [PubMed] [Google Scholar]
- 10.Queipo-Ortuno MI, Boto-Ordonez M, Murri M, et al. Influence of red wine polyphenols and ethanol on the gut microbiota ecology and biochemical biomarkers. Am J Clin Nutr. 2012;95(6):1323–34. doi: 10.3945/ajcn.111.027847. [DOI] [PubMed] [Google Scholar]
- 11.Conlon MA, Bird AR. The impact of diet and lifestyle on gut microbiota and human health. Nutrients. 2014;7(1):17–44. doi: 10.3390/nu7010017. [DOI] [PMC free article] [PubMed] [Google Scholar]
- 12.Gomez-Arango LF, Barrett HL, McIntyre HD, et al. Increased systolic and diastolic blood pressure is associated with altered gut microbiota composition and butyrate production in early pregnancy. Hypertension. 2016;68(4):974–81. doi: 10.1161/HYPERTENSIONAHA.116.07910. [DOI] [PubMed] [Google Scholar]
- 13.Yang T, Santisteban MM, Rodriguez V, et al. Gut dysbiosis is linked to hypertension. Hypertension. 2015;65(6):1331–40. doi: 10.1161/HYPERTENSIONAHA.115.05315. [DOI] [PMC free article] [PubMed] [Google Scholar]
- 14.Wang M, Moran AE, Liu J, et al. A meta-analysis of effect of dietary salt restriction on blood pressure in Chinese adults. Glob Heart. 2015;10(4):291–99.e6. doi: 10.1016/j.gheart.2014.10.009. [DOI] [PMC free article] [PubMed] [Google Scholar]
- 15.Liu M, Li YC, Liu SW, et al. [Burden of disease attributable to high- sodium diets in China, 2013]. Zhonghua Yu Fang Yi Xue Za Zhi. 2016;50(9):759–63. doi: 10.3760/cma.j.issn.0253-9624.2016.09.003. [in Chinese] [DOI] [PubMed] [Google Scholar]
- 16.Wilck N, Matus MG, Kearney SM, et al. Salt-responsive gut commensal modulates TH17 axis and disease. Nature. 2017;551(7682):585–89. doi: 10.1038/nature24628. [DOI] [PMC free article] [PubMed] [Google Scholar]
- 17.Edgar RC, Haas BJ. UCHIME improves sensitivity and speed of chimera detection. Bioinformatics. 2011;27(16):2194–200. doi: 10.1093/bioinformatics/btr381. [DOI] [PMC free article] [PubMed] [Google Scholar]
- 18.Haas BJ, Gevers D, Earl AM, et al. Chimeric 16S rRNA sequence formation and detection in Sanger and 454-pyrosequenced PCR amplicons. Genome Res. 2011;21(3):494–504. doi: 10.1101/gr.112730.110. [DOI] [PMC free article] [PubMed] [Google Scholar]
- 19.Martin M. Cutadapt removes adapter sequences from high-throughput sequencing reads. EMBnet. 2011;17(1):10–12. [Google Scholar]
- 20.Edgar RC. UPARSE: Highly accurate OTU sequences from microbial amplicon reads. Nat Methods. 2013;10(10):996–98. doi: 10.1038/nmeth.2604. [DOI] [PubMed] [Google Scholar]
- 21.Quast C, Pruesse E, Yilmaz P, et al. The SILVA ribosomal RNA gene database project: Improved data processing and web-based tools. Nucleic Acids Res. 2013;41(Database issue):D590–96. doi: 10.1093/nar/gks1219. [DOI] [PMC free article] [PubMed] [Google Scholar]
- 22.Wang Q, Garrity GM, Tiedje JM, et al. Naive Bayesian classifier for rapid assignment of rRNA sequences into the new bacterial taxonomy. Appl Environ Microbiol. 2007;73(16):5261–67. doi: 10.1128/AEM.00062-07. [DOI] [PMC free article] [PubMed] [Google Scholar]
- 23.Langille MG, Zaneveld J, Caporaso JG, et al. Predictive functional profiling of microbial communities using 16S rRNA marker gene sequences. Nat Biotechnol. 2013;31(9):814–21. doi: 10.1038/nbt.2676. [DOI] [PMC free article] [PubMed] [Google Scholar]
- 24.Bier A, Braun T, Khasbab R, et al. A high salt diet modulates the gut microbiota and short chain fatty acids production in a salt-sensitive hypertension rat model. Nutrients. 2018;10(9) doi: 10.3390/nu10091154. pii: E1154. [DOI] [PMC free article] [PubMed] [Google Scholar]
- 25.Towhid ST. Effect of high-salt consumption on rodent gut microbiome: A meta-analysis. Mymensingh Med J. 2019;28(3):567–73. [PubMed] [Google Scholar]
- 26.Mitsuoka T. Intestinal flora and human health. Asia Pac J Clin Nutr. 1996;5(1):2–9. [PubMed] [Google Scholar]
- 27.Martin R, Miquel S, Ulmer J, et al. Role of commensal and probiotic bacteria in human health: A focus on inflammatory bowel disease. Microb Cell Fact. 2013;12:71. doi: 10.1186/1475-2859-12-71. [DOI] [PMC free article] [PubMed] [Google Scholar]
- 28.Mu Q, Tavella VJ, Luo XM. Role of Lactobacillus reuteri in human health and diseases. Front Microbiol. 2018;9:757. doi: 10.3389/fmicb.2018.00757. [DOI] [PMC free article] [PubMed] [Google Scholar]
- 29.Wexler HM. Bacteroides: The good, the bad, and the nitty-gritty. Clin Microbiol Rev. 2007;20(4):593–621. doi: 10.1128/CMR.00008-07. [DOI] [PMC free article] [PubMed] [Google Scholar]
- 30.Spencer MD, Hamp TJ, Reid RW, et al. Association between composition of the human gastrointestinal microbiome and development of fatty liver with choline deficiency. Gastroenterology. 2011;140(3):976–86. doi: 10.1053/j.gastro.2010.11.049. [DOI] [PMC free article] [PubMed] [Google Scholar]
- 31.Pindjakova J, Sartini C, Lo Re O, et al. Gut dysbiosis and adaptive immune response in diet-induced obesity vs. systemic inflammation. Front Microbiol. 2017;8:1157. doi: 10.3389/fmicb.2017.01157. [DOI] [PMC free article] [PubMed] [Google Scholar]
- 32.Gandhi A, Shah NP. Effect of salt stress on morphology and membrane composition of Lactobacillus acidophilus, Lactobacillus casei, and Bifidobacterium bifidum, and their adhesion to human intestinal epithelial-like Caco-2 cells. J Dairy Sci. 2016;99(4):2594–605. doi: 10.3168/jds.2015-10718. [DOI] [PubMed] [Google Scholar]
- 33.De Angelis M, Calasso M, Cavallo N, et al. Functional proteomics within the genus Lactobacillus. Proteomics. 2016;16(6):946–62. doi: 10.1002/pmic.201500117. [DOI] [PubMed] [Google Scholar]
- 34.Salzillo M, Vastano V, Capri U, et al. Pyruvate dehydrogenase subunit beta of Lactobacillus plantarum is a collagen adhesin involved in biofilm formation. J Basic Microbiol. 2017;57(4):353–57. doi: 10.1002/jobm.201600575. [DOI] [PubMed] [Google Scholar]
- 35.Fernandez A, Ogawa J, Penaud S, et al. Rerouting of pyruvate metabolism during acid adaptation in Lactobacillus bulgaricus. Proteomics. 2008;8(15):3154–63. doi: 10.1002/pmic.200700974. [DOI] [PubMed] [Google Scholar]
- 36.Wang C, Huang Z, Yu K, et al. High-salt diet has a certain impact on protein digestion and gut microbiota: A sequencing and proteome combined study. Front Microbiol. 2017;8:1838. doi: 10.3389/fmicb.2017.01838. [DOI] [PMC free article] [PubMed] [Google Scholar]


