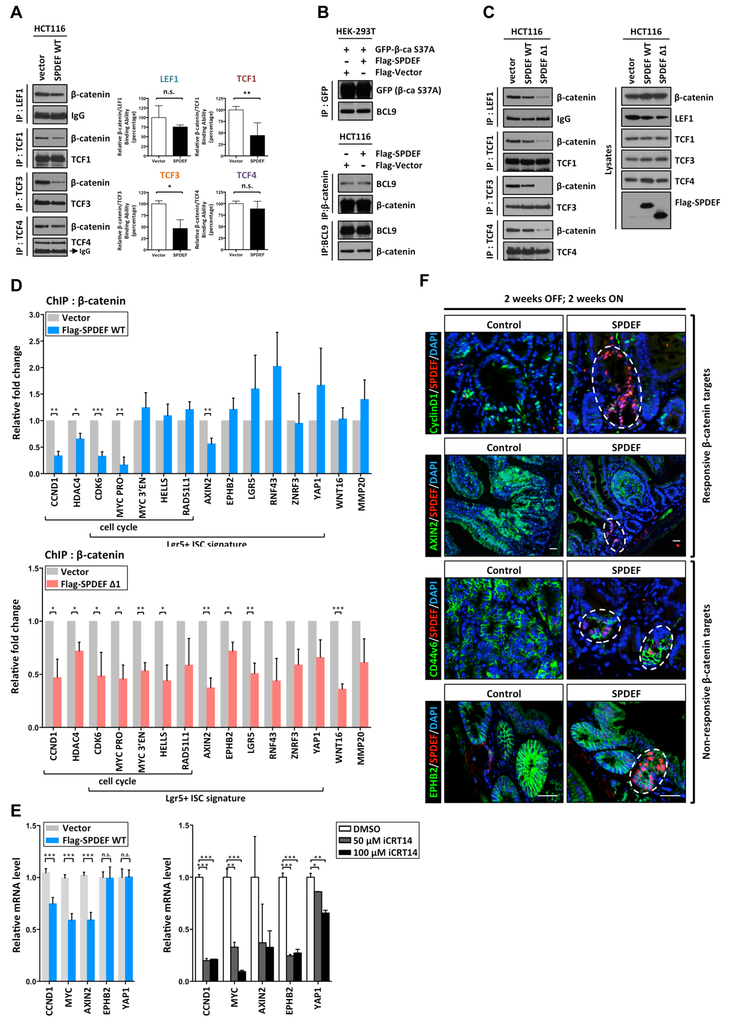
Figure 7. SPDEF selectively displaces β-catenin binding from the chromatin, resulting in the inhibition of β-catenin-mediated cell cycle machinery.
(A) Immunoprecipitation was performed with an anti-LEF1, an anti-TCF1, anti-TCF3, and an anti-TCF4 antibody respectively in HCT116 pINDUCER20 Flag-SPDEF WT and Vector control cell lines 48h post-doxycycline (1 μg/ml) induction. The precipitated β-catenin and LEF/TCFs interaction was detected by the antibodies as indicated. Quantitated result of relative binding derived from at least three independent experiments was shown. (B) HEK-293T and HCT116 cells were transfected with the indicated plasmids. The immunoprecipitation was performed 48hr post-transfection, and the precipitated β-catenin and BCL9 were detected by immunoblot analysis by the corresponding antibodies as indicated. (C) Immunoprecipitation was performed with anti-LEF1, anti-TCF1, anti-TCF3, and anti-TCF4 antibodies as indicated in HCT116 pINDUCER20 Flag-SPDEF WT, Flag-SPDEF Δ1 and Vector control cell lines 48h post-doxycycline (1 μg/ml) induction. The precipitated β-catenin and LEF/TCFs interaction was detected by immunoblot analysis. (D) Doxycycline inducible pINDUCER20 Flag-tagged SPDEF (Flag-SPDEF WT), pINDUCER20 Flag-tagged SPDEF Δ1 (Flag-SPDEF Δ1) and pINDUCER20 empty vector control (Vector) HCT116 stable lines were established. Chromatin immunoprecipitation (ChIP) was performed with an anti-β-catenin antibody 48h post-doxycycline (1 μg/ml) induction. Relative β-catenin binding on chromatin (β-catenin targets) was quantified by qPCR as indicated. Quantitated result of relative binding derived from at least three independent ChIP experiments was shown. (E) Relative mRNA level of β-catenin targets was quantitated by RT-qPCR in Flag-SPDEF WT and Vector HCT116 stable lines 72h post-doxycycline (2 μg/ml) induction. Relative mRNA level of β-catenin targets was quantitated by RT-qPCR in HCT116 treated by DMSO or iCRT14 for 48h. (F) Mouse intestines from control mice or SPDEF mice (Model 2) were collected followed by immunofluorescent staining. The expression of β-catenin targets, CYCLIND1 and AXIN2, but not CD44v6 and EPHB2 were reduced in SPDEF-expressing tumor cells. The white line outlines SPDEF-expressing tumor cells. Scale bars: 20 μm. Error bars, S.E.M., ***, p<0.001; **, p<0.005; *. P<0.05.

