

Abstract
Plants employ a diverse set of defense mechanisms to mediate interactions with insects and fungi. These relationships can leave lasting impacts on host plant genome structure such as rapid expansion of gene families through tandem duplication. These genomic signatures provide important clues about the complexities of plant/biotic stress interactions and evolution. We used a pseudo‐backcross hybrid family to identify quantitative trait loci (QTL) controlling associations between Populus trees and several common Populus diseases and insects. Using whole‐genome sequences from each parent, we identified candidate genes that may mediate these interactions. Candidates were partially validated using mass spectrometry to identify corresponding QTL for defensive compounds. We detected significant QTL for two interacting fungal pathogens and three insects. The QTL intervals contained candidate genes potentially involved in physical and chemical mechanisms of host–plant resistance and susceptibility. In particular, we identified adjoining QTLs for a phenolic glycoside and Phyllocolpa sawfly abundance. There was also significant enrichment of recent tandem duplications in the genomic intervals of the native parent, but not the exotic parent. Tandem gene duplication may be an important mechanism for rapid response to biotic stressors, enabling trees with long juvenile periods to reach maturity despite many coevolving biotic stressors.
Keywords: community genetics, comparative genomics, plant–biotic interactions, Populus, tandem duplication
This work focuses on elucidating the host genetic drivers of community composition in a hybrid Populus family. We mapped quantitative trait loci for pathogenic fungi and leaf modifying insects in plantations and connected these to genomic intervals of the two host species. We found that tandemly duplicated genes were significantly enriched in the intervals and that these genes have functions that are consistent with rapid host co‐evolution with the interacting organisms.

1. INTRODUCTION
In natural ecosystems, the dynamics of plant interactions with other living organisms are complex. This is especially true for organisms that rely on plants for shelter, nutrition, and reproduction, such as fungi and insects (Chisholm, Coaker, Day, & Staskawicz, 2006; Panda & Khush, 1995). Although fungi and insects can provide some of the same useful services in return, those that do not can be extremely harmful to plant productivity. To mitigate the effects of biotic stress, plants employ a diverse set of defense mechanisms including chemical, protein‐derived molecules, and physical barriers (Panda & Khush, 1995). Insects and fungi must develop strategies in parallel to overcome these obstacles to survive (Chisholm et al., 2006; Mello & Silva‐Filho, 2002). The theory of gene‐for‐gene coevolution has frequently been used to describe this host plant genetic relationship to its arthropod and fungal communities (Chisholm et al., 2006; Ehrlich & Raven, 1964; Mello & Silva‐Filho, 2002; Thompson, 1988).
The gene‐for‐gene theory suggests a very simple dynamic for the genetic interactions that occur between two species. A gene in the host plant that is important in biotic relationships has a corresponding, coevolving gene from a pathogen/insect which can lead to resistance or susceptibility depending on the life history of the pathogen/insect (Flor, 1971; Friesen, Meinhardt, & Faris, 2007). Much of the evidence for these interactions has been found in crop systems where plant species often have dominant, single‐gene resistance to feeding (Thompson, 1988). For example, there are over twenty different genes in wheat (Triticum aestivum L.) that each confers resistance to the Hessian fly, Mayetiola destructor (Thompson & Burdon, 1992). Exposure of Hessian fly populations to these resistant varieties of wheat created selection pressure that led to increased virulent gene combinations in the pest (Gallun, 1977; Panda & Khush, 1995). Similarly, in plant–fungal systems breeding for dominant resistance in cereal crops resulted in new selective forces that increased virulent gene frequencies in Puccinia spp. cereal rusts (Chen, 2005; Pretorius, Singh, Wagoire, & Payne, 2000). This in turn can lead to an evolutionary arms race between plants, insects, and fungi with the continual development of mechanisms to overcome both genetic defenses and virulent attacks (Bergelson, Kreitman, Stahl, & Tian, 2001; Thompson & Burdon, 1992).
The relationships of host plant genetics and biotic association can also be more complex than these crop breeding systems suggest, and they can leave a lasting impact on genome structure (Lefebvre & Chèvre, 1995). Host plant and biotic associations can lead to the expansion of gene families responsible for the host plant response to biotic stress. For example, the Kunitz protease inhibitors (KPIs) in Populus are important in defense responses against insects by inhibition of herbivore digestion (Haruta, Major, Christopher, Patton, & Constabel, 2001; Major & Constabel, 2008). The KPI gene family has greatly expanded in response to insect attack through tandem duplication events (Philippe, Ralph, Külheim, Jancsik, & Bohlmann, 2009). Similarly, plant resistance (R) genes, which are important in the defense response of plants to fungal pathogen attack, have also expanded through tandem and segmental duplication events due to biotic pressures (Hulbert, Webb, Smith, & Sun, 2001; Leister, 2004). Analyzing how the genome is structured in the host plant when it associates with fungi and insects is important for studying these relationships and understanding the complexities of their genetic interactions.
Given their rapid growth and vegetative reproduction, Populus species have become a focus for research into biofuel production making them a valuable commercial crop (Meilan et al., 2002; Stanton, Neale, & Li, 2010; Taylor, 2002). Populus has also become an important genetic model for research into a wide variety of ecological and adaptive traits (McKown et al., 2014), including interactions with the biotic community (Crutsinger et al., 2014; Whitham et al., 2006). In particular, interspecific hybrids of P. trichocarpa × P. deltoides segregate for a wide variety of traits including resistance to insect and fungal attack (Newcombe, 1998; Newcombe & Ostry, 2001). Such hybrid family crosses can be used to identify regions of the genome that are important in mediating biotic stress.
In this study, we investigated the genome composition of loci associated with insect and fungal species in an interspecific Populus family. We surveyed insects and fungal pathogens in a P. deltoides × P. trichocarpa pseudo‐backcross family and used quantitative trait locus (QTL) analysis and comparative genomics to address three main questions: (a) Is there heritable, host genetic control of fungal and insect species? (b) What protein domains and gene ontology terms are enriched in the QTL intervals in the genomes of each Populus species? (c) What candidate genes in the intervals are unique to each species when comparing the P. trichocarpa and P. deltoides genomes?
2. METHODS
2.1. QTL mapping pedigree
The 52–124 family was developed by crossing a male Populus deltoides, ILL‐101 from southern Illinois, with a female Populus trichocarpa clone, 93–968 from western Washington State. The F1 clone, 52–225, was then crossed with a male Populus deltoides clone, D124 from Minnesota, to generate the final 749 progeny in the pseudo‐backcross population.
2.2. Field site descriptions
Clonal cuttings of the 52–124 progeny were obtained from the University of Minnesota and the University of Florida. The individuals were propagated in the West Virginia University (WVU) greenhouses in March 2006. A hay production field was tilled and disked at the WVU Agronomy farm (39°39′32″N 79°54′19″W) in Morgantown, West Virginia for planting. In July 2007, the rooted cuttings were planted with two clonal replicates for each of 749 genotypes at 2 m × 2 m spacing in an interlocking block design. The plantation was thinned in December of 2008 by removing 50% of the trees in a diamond fashion resulting in 2.83 m × 4 m spacing of the remaining trees. A plantation of the same family cross was established at the Westport Research Station in the Columbia River floodplain (46°07ʹ58.8ʺN 123°22ʹ05.0ʺW) in April 2016. The trial was planted with a total of 339 progeny replicated in a randomized complete block design with three blocks.
2.3. SNP genotyping and genetic map construction
SNP loci were selected from whole‐genome resequencing data generated for the parent trees of the pedigree, focusing on loci that were fixed for different alleles in P. deltoides and P. trichocarpa. Sequencing was performed on the Illumina GAII system with single‐end read lengths of 75 bp and a total depth of ~35× on average. Reads were aligned using MAQ, and SNPs were called using Samtools mpileup with a minimum quality of 30 and a minimum depth of 5 reads per allele, and a subset of loci was confirmed by Sanger sequencing (Slavov et al., 2012). Polymorphic loci were selected that were maternally informative for P. trichocarpa. These were incorporated into an Illumina Infinium Bead Array which was used to genotype 3,568 SNP loci in 692 of the progeny. These data were then used to create the genetic map which was composed of 19 linkage groups corresponding to 19 Populus chromosomes. Genotyping and map construction are described in more detail elsewhere (Muchero et al., 2015).
2.4. Family 52–124 parent and progeny phenotyping
In order to identify regions of the Populus genome associated with biotic stress, a variety of fungal pathogens and insect herbivore species was surveyed in the WVU Morgantown and Westport Oregon plantation sites. Melampsora sp. rust was identified visually by local pathologist Dr. William MacDonald. Sphaerulina musiva was identified by sequencing of the ITS region (Verkley, Quaedvlieg, Shin, & Crous, 2013). Insect identification was completed using insect morphological features, feeding symptoms, and known hosts/species distributions for Phyllocolpa sp. (Kopelke, 2007; Smith & Fritz, 1996), Mordwilkoja vagabunda (Ignoffo & Granovsky, 1961a, 1961b), and Pemphigus populitransversus (Bird, Faith, Rhomberg, Riska, & Sokal, 1979; Faith, 1979).
Melampsora sp. leaf rust (Figure 1a) and S. musiva fungal leaf spot symptoms (Figure 1b) were scored on a 0–3 scale of disease severity, with 0 the indicating absence of symptoms and 3 indicating high degree of pathogen leaf damage, in the 2008 growing season for all 1,353 tree canopies. In the fall of 2014, stem canker symptoms caused by the same fungus S. musiva (Figure 1c) were scored on a 0–5 disease severity scale for a subset 498 unique genotypes and a total of 580 trees. Upon further examination of field conditions for S. musiva disease severity, it was determined that none of the progeny displayed complete resistance. The original 0–5 scale was binarized with scores from 2.5–5 scaled to 1 and 0–2 scaled to 0. The new scale indicated the progression of infection with 1 specifying severe canker development and 0 indicating less aggressive canker symptoms.
FIGURE 1.

Biotic phenotype symptoms observed on trees including (a) leaf symptoms of Melampsora sp. fungal leaf rust, (b) leaf spot symptoms of the S. musiva fungus, (c) S. musiva canker symptoms, (d) branch gall created by the M. vagabunda aphid (e) petiole gall created by the P. populitransversus aphid, and (f) Phyllocolpa sp. leaf folding gall
Two abundant species of galling aphid were also surveyed during the 2016 growing season. To equalize the biomass surveyed for the aphid insect observations on each tree, branches of equal diameter were selected for insect counts and the remaining branches in the canopy were not surveyed. Tree canopy presence or absence for the petiole galling aphid P. populitransversus (Figure 1d) and the branch galling aphid M. vagabunda (Figure 1e) was recorded for 201 unique genotypes and a total of 218 trees. For all of the damage scores in every survey year, 0 indicated a complete absence of fungal or insect presence in tree canopy.
In early August 2017, at the Westport site full canopies were scored by counting galls of the leaf‐folding sawfly Phyllocolpa sp. (Figure 1f), on 534 unique genotypes and a total of 1,020 trees. To estimate productivity of individuals and confirm that availability of resources did not drive insect attraction or feeding, main stem diameter in millimeters was recorded for all trees to be used as a covariate in the analysis.
2.5. Leaf metabolites
The metabolomic profiles for 211 genotypes of family 52–124 were determined for leaves (leaf plastochron index 7 ± 2) sampled on 14 September 2006 at a USDA‐FS field site near Grand Rapids, MI from plants in their first growing season in the field. Leaves were quickly collected and flash‐frozen on dry ice, prior to shipping back to Oak Ridge National Laboratory, where ~200 mg fresh weight per sample was extracted in 80% ethanol (aqueous), as described in Zhao et al. (2010), and analyzed for the major aromatic metabolites following trimethylsilylation and analysis by gas chromatography–mass spectrometry (GC‐MS) using electron impact ionization (70 eV). The analytical and data extraction protocols were similar to that reported previously in Weston et al. (2015). The major phenolic metabolites quantified included salicortin, α‐salicyloylsalicin, salicyl‐salicylic acid‐2‐O‐glucoside, salirepin (gentisyl alcohol 2‐O‐glucoside), gentisic acid 5‐O‐glucoside, 1,2,4‐benzenetriol, and gentisyl alcohol 5‐O‐glucoside.
2.6. Statistical analysis
2.6.1. Within‐family broad‐sense heritability (H 2) calculation
To prevent arbitrary score bias, Melampsora sp. and S. musiva values were normalized to have a mean of 0 and standard deviation of 1 (score.transform function of the CTT R package) by applying the inverse of the cumulative distribution function of the normal distribution to the sample percentile score (Gianola & Norton, 1981). Surveys of the Melampsora sp. leaf rust, S. musiva leaf spot, and counts of the Phyllocolpa sp. galls had within‐garden microsite variation removed using thin‐plate spline regression (fields R package). Residuals of the spatial correction were added to the mean of each survey dataset for each tree observation to spatially correct and rescale the values. These corrected values were then used to calculate the proportion of variance in the fungal and insect distributions that were due to genotype using a linear‐mixed model (lmer function of the lme4 R package) with insect counts and fungal scores as the response, tree genotype as the predictor, and either competing fungus score or stem diameter biomass estimates as a covariate where applicable. Broad‐sense heritability was calculated as , where is the genetic variance due to genotype, and is the residual variance. Rapid, simulation‐based exact likelihood ratio tests were used to evaluate the significance of variation due to genotype for each linear model (exactRLRT function of the RLRsim R package). SAS software version 9.4 (2013) was used to test for the normality of all datasets, and for all subsequent statistical analyses, transformations were conducted when necessary. Finally, best linear unbiased predictors (BLUPs) were extracted from these models to use in the QTL analysis.
2.6.2. Quantitative Trait Loci (QTL) analysis
The R software package R/qtl (Broman, Wu, Sen, & Churchill, 2003) was used for all QTL analyses described below. Composite interval mapping (CIM) was used to associate Melampsora sp. leaf rust, S. musiva leaf spot, and Phyllocolpa sp. to QTL positions (cim function). An additional CIM QTL analysis was conducted for fungi surveyed in 2008 to further evaluate potential competitive bias of co‐occurring fungal pathogens. This was done by subsetting individuals out of the full dataset to exclude trees with symptoms of both pathogens, leaving us with 90 individuals that only showed Melampsora sp. symptoms and 434 individuals only infected with S. musiva leaf spot. Single QTL mapping was used to associate the binary scores for the S. musiva canker, M. vagabunda, and P. populitransversus to QTL positions (scanone function). The method used for both mapping approaches was the expectation–maximization (EM) algorithm. Estimation of QTL interval significance was completed by performing 1,000 permutations. Intervals with logarithm of odds (LOD) scores that were above the p‐value threshold (alpha = 0.05), as determined from the permutation tests, were selected for further analysis. The percent variance explained by significant markers for fungal and insect surveys, that were mapped using CIM, were calculated by extracting significant marker positions and creating a fit QTL model (fitQTL function). The positive allele contributing to an increase in susceptibility to fungi and insects was found by generating effect plots for each phenotype and its significant marker position (effectplot function).
2.7. Physical genome intervals
Physical genome intervals in the P. trichocarpa genome (v3.0) were examined for each significant QTL for biotic associations. The intervals were defined as 1 Mb regions centered on the marker with the highest LOD score. Fixed physical genome sizes were used rather than intervals defined based on LOD scores due to the large variation in magnitude of LOD observed for the significant QTL. For example, intervals of 1 LOD centered on the QTL ranged in size from 169 to 4,620 kb. Much of this variation was likely due to variation in marker density and local recombination rates, in addition to phenotyping and genotyping error. We believe that a fixed 1 Mb interval is a more consistent and conservative approach given the size of the family and the variation in strength of the QTL (Yin, DiFazio, Gunter, Riemenschneider, & Tuskan, 2004). On average, this represents approximately 6.34 cM, based on a total map size of 2,617 cM and a total assembled genome length of 420 Mb.
Orthologous intervals were identified in the P. deltoides clone WV94 reference genome (v2.1) obtained from Phytozome (Goodstein et al., 2012). Orthology was determined using a combination of protein sequence conservation and synteny using MCScanX (Wang et al., 2012). Briefly, all proteins were compared in all‐vs‐all searches using blastp both within genomes and between genomes. These were then chained into collinear segments using the MCScanX algorithm. Orthologous segments were identified based on the presence of large numbers of gene pairs in collinear order with high sequence identity (median blastp E score < 1e−180; Figure 2). Synonymous (Ks) and nonsynonymous (Ka) nucleotide substitution rates were calculated using the Bioperl DNAstatistics module (Stajich, 2002; Table S1), domain composition (Table S2), and Gene Ontology (GO) terms (Table S3) were obtained for each genome from Phytozome (v12.1). Intervals were customized for the grandparents of the pseudo‐backcross progeny (clones 93–968 for P. trichocarpa and D124 for P. deltoides) by converting the respective reference genome based on alignment of short‐read sequences derived from each species. Specifically, we generated 243 and 248 million 250 bp paired‐end Illumina HiSeq sequences for 93–968 and D124, respectively. This yielded an average coverage of ~150× per genome. These were aligned to the respective reference genome for each species (Nisqually v3.0 for P. trichocarpa and WV94 v2.0 for P. deltoides) using bwa mem with default parameters. SNPs and small indels were identified using samtools mpileup and bcftools call with default multiallelic variant settings (Li, 2011; Li et al., 2009), and sequence depth was extracted using vcftools (Danecek et al., 2011). Sequences were converted using the vcftools utility vcf‐consensus. Genes with no coverage in the alignments were excluded from the intervals for each species.
FIGURE 2.

Collinear genes in P. deltodies (Pd) and P. trichocarpa (Pt) chromosomes, based on MCScanX alignments. (a) Chr02; (b) Chr05
2.8. Tandem duplications
Tandemly duplicated genes were identified using all‐vs‐all blastp searches within each genome for biotic stress‐associated intervals (Table S4). Genes with blastp E scores < 1e−180 that were located within 500 kb of one another were considered to be recent tandem duplications. The window size was determined by testing a range of values and choosing a window size at which the number of newly discovered tandem duplicates began to decline (Figure 3). The E score cutoff was chosen because P. trichocarpa and P. deltoides orthologs also have a median blastp E score in this range, suggesting that these tandem duplications mostly occurred after these species diverged from a common ancestor. This should focus the analysis primarily on genes that are recently duplicated and therefore potentially differentially duplicated between the species. The QTL intervals were tested for significant enrichment of tandem duplicates by using a Monte Carlo simulation. Sets of contiguous genes equal in number to those contained in each QTL interval were randomly selected from the whole genome, and the number of sampled tandem duplications was counted for each iteration. This was repeated 10,000 times, and the observed number of tandem duplicates was compared to the simulated distribution to derive an empirical p‐value.
FIGURE 3.
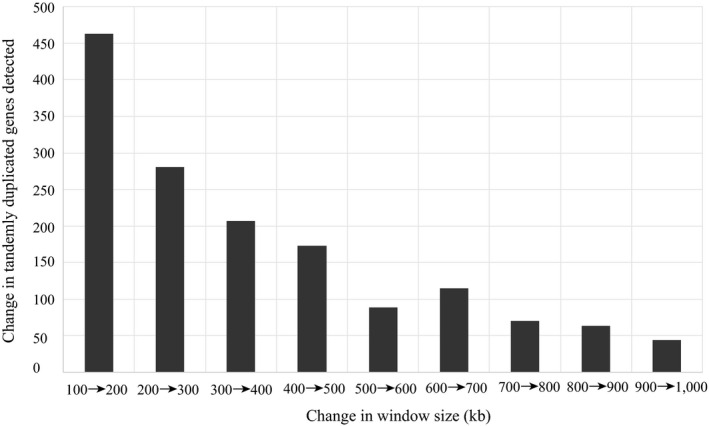
Change in number of tandemly duplicated genes discovered with increasing window size
3. RESULTS
3.1. Heritability of fungal and insect associations
Clonal repeatability (or within‐family broad‐sense heritability) was estimated for each categorical survey trait (Table 1). There was a significant host plant genetic contribution of moderate effect controlling the association of S. musiva leaf spot disease severity (H 2 = 0.250, p‐value < .0001). There was a strong effect of host plant genetics on associations of Melampsora sp. disease severity (H 2 = 0.609, p‐value < .0001) and the continuous count of leaf‐folding galls of Phyllocolpa sp. (H 2 = 0.391, p‐value < .0001).
TABLE 1.
Linear‐mixed model output for biotic surveys
| Fungus/insect | H 2 | Genetic variance | Error variance | RL ratio | p‐Value |
|---|---|---|---|---|---|
| Melampsora sp. leaf rust | 0.609 | 0.271 | 0.174 | 294 | <.0001 |
| S. musiva leaf spot | 0.250 | 0.153 | 0.459 | 32.0 | <.0001 |
| Phyllocolpa sp. | 0.391 | 11.9 | 18.5 | 129 | <.0001 |
Broad‐sense heritability (H 2) denotes the contribution of all host plant genetic factors to total variance in the biotic phenotype. R package RLRsim exactRLRT function was used to test significance of effects in mixed model.
3.2. QTL mapping of fungal and insect surveys
Four QTL intervals containing a total of 38 markers were significantly associated with the abundance of fungal pathogens (Table 2). An overlapping QTL on Chr04 (Figure 4a,b) was associated with both Melampsora sp. (marker position = 3.50687, p‐value = .001) and S. musiva leaf spot disease severity (marker position = 15.4912824, p‐value = .026) for analysis that included all clones. The marker with the highest LOD score explained 54.1% of the variance in the disease severity of Melampsora sp. within the Chr04 QTL interval, whereas the top marker within the overlapping interval only explained 3.31% of the variance in the disease severity of S. musiva in the analysis with all individuals.
TABLE 2.
Summary of QTL permutation test output
| Model | Chrom. | LOD score | p‐Value | % Variance | + Allele | Garden |
|---|---|---|---|---|---|---|
| Melampsora sp. leaf rust all individuals | Chr04 | 19.7 | .001 | 52.5 | D | Morgantown |
| Melampsora sp. leaf rust subsetted individuals | Chr04 | 30.1 | <.0001 | 57.9 | D | Morgantown |
| S. musiva leaf spot all individuals | Chr04 | 7.80 | .001 | 5.29 | D | Morgantown |
| S. musiva leaf spot subsetted individuals | Chr06 | 4.60 | <.0001 | 4.77 | T | Morgantown |
| S. musiva canker | Chr16 | 4.34 | .022 | NA | T | Morgantown |
| M. vagabunda | Chr05 | 5.39 | .001 | NA | D | Morgantown |
| P. populitransversus | Chr03 | 2.70 | >.05 | NA | NA | Morgantown |
| Phyllocolpa sp. | Chr10 | 6.60 | .015 | 9.65 | T | Westport |
| Phyllocolpa sp. | Chr13 | 4.99 | .045 | 8.82 | T | Westport |
| Gentisyl alcohol 5‐O‐glucoside | Chr17 | 12.2 | <.0001 | 25.760 | T | Grand Rapids |
| Gentisyl alcohol 5‐O‐glucoside | Chr10 | 10.3 | <.0001 | 23.104 | T | Grand Rapids |
| Gentisyl alcohol 5‐O‐glucoside | Chr14 | 5.96 | .0100 | 7.296 | T | Grand Rapids |
Percent variance in surveys for insects and fungi explained by significant marker indicated for composite interval mapping models. Positive (+) allele specifies genotype at significant interval that results in an increase in susceptibility. D indicates progeny are homozygous for P. deltoides alleles, and T indicates progeny are heterozygous for P. deltoides and P. trichocarpa alleles.
FIGURE 4.

QTL interval plots showing peaks across the genome that associate with 2008 biotic surveys. Lines on the plots indicate p‐value thresholds as determined by running 1,000 permutations of mapping model for (a) Melampsora sp. model with all individuals and clones subsetted to exclude individuals with S. musiva infection and (b) S. musiva leaf spot model with all individuals and clones subsetted to exclude individuals with Melampsora sp. infection
Upon exclusion of individuals that showed symptoms of the competing fungus, the strength of the association on Chr04 increased for Melampsora sp. (marker position marker position = 3.50687, p‐value = .0001), whereas the association was lost for S. musiva leaf spot, and a new association was revealed on Chr06 (marker position = 142.6761866, p‐value = .017). The top Chr04 marker explained 57.9% of variation in Melampsora sp. infection severity, while the new Chr06 association explained 4.77% of the variation in S. musiva leaf spot disease severity. The positive allele contributing to an increase in fungal infection on Chr04 was derived from P. deltoides, whereas the positive allele contributing to severity of S. musiva leaf spot infection on Chr06 was derived from P. trichocarpa. Binary presence of the canker symptoms caused by S. musiva (Figure 5a) was found to be associated with a QTL located on Chr16 (marker position = 60.81429, p‐value = .022). The positive allele contributing to increase in presence of S. musiva canker was from P. trichocarpa.
FIGURE 5.
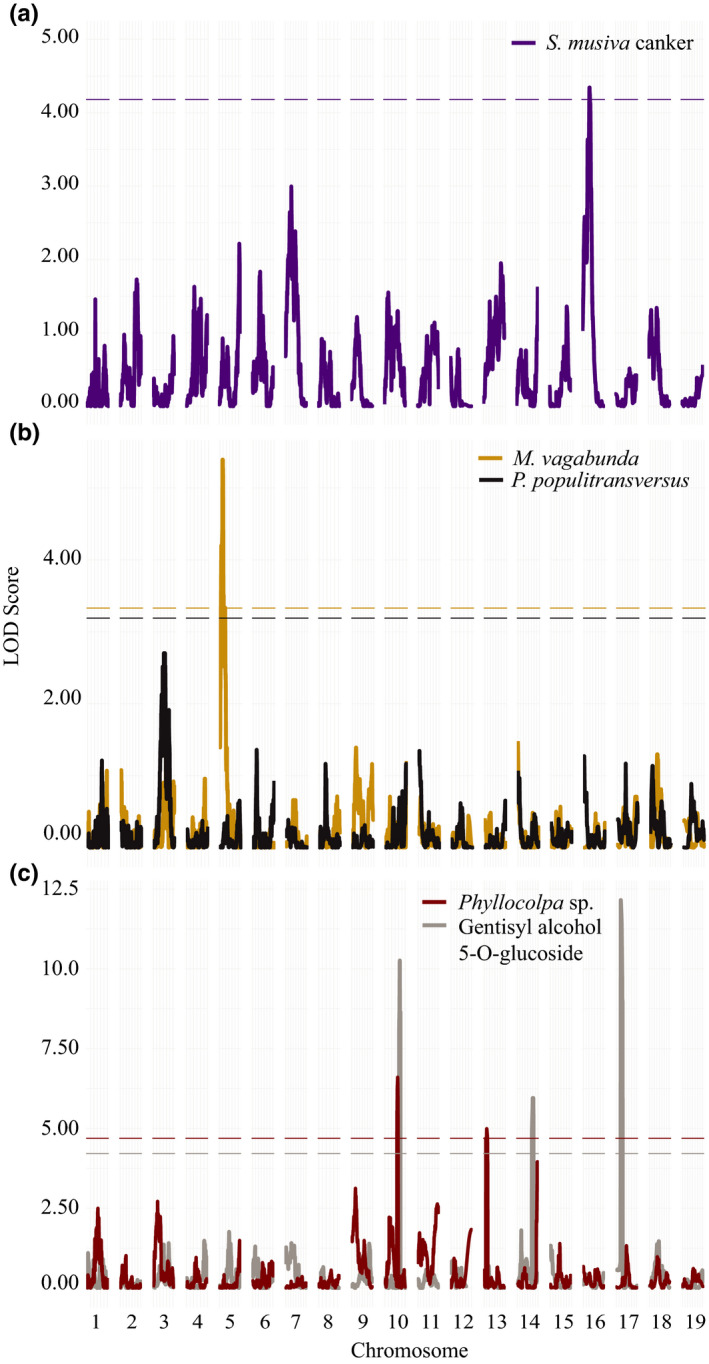
QTL interval plots showing peaks across the genome that associate with biotic surveys. Lines on the plots indicate p‐value thresholds as determined by running 1,000 permutations of mapping model for (a) binary fungal survey of S. musiva canker, (b) binary insect surveys of M. vagabunda and P. populitransversus, (c) and insect surveys of Phyllocolpa sp. leaf gall counts and overlapping peaks for gentisyl alcohol 5‐O‐glucoside compound QTL
Three QTL intervals containing a total of 40 markers were significantly associated with insect abundance (Table 2, Figure 5b,c). A QTL on Chr05 (marker position = 21.83874, p‐value = .001) was associated with binary presence of M. vagabunda branch galls (Figure 5b). The positive allele contributing to an increase in presence of M. vagabunda was from P. trichocarpa. Two QTLs, one located on Chr10 (marker position = 57.69914343, p‐value = .015) and one located on Chr13 (marker position = 84.43857329, p‐value =0.045), were associated with the number of leaf‐folding galls from Phyllocolpa sp. (Figure 5c). The marker with the highest LOD score explained 9.65% of the variance in oviposition gall count, while 8.82% of the variance was explained by the top marker located on Chr13. For both markers, the positive allele contributing to an increase in the number of female oviposition galls was from P. deltoides. There were no QTL intervals that passed the permutation threshold for the binary presence of P. populitransversus petiole galls (Figure 5c).
3.3. QTL mapping of leaf metabolites
Only one tested compound, gentisyl alcohol 5‐O‐glucoside levels, yielded significant QTL. Three QTL intervals containing a total of 56 significant markers were significantly associated with gentisyl alcohol 5‐O‐glucoside levels (Table 2, Figure 5c). This included markers on chromosome 17 (marker position = 21.54739208, p‐value < .0001) which explained 25.8% of variation, Chr10 (marker position = 109.8469079, p‐value < .0001) which explained 23.1% of variation, and chromosome 14 (marker position = 91.51828521, p‐value = .0100) which explained 7.30% of variation. The positive allele that contributed to an increase in gentisyl alcohol 5‐O‐glucoside levels for all markers was derived from P. trichocarpa.
3.4. Interaction between Melampsora sp. and S. musiva leaf infection
Melampsora sp. leaf rust infection severity was dependent upon the disease severity of S. musiva leaf spot symptoms (F = 35.2, p‐value = .0001; Table 3). The severity of Melampsora sp. infection for individuals with no S. musiva leaf spot was significantly higher than for individuals with S. musiva leaf spot symptoms (Figure 6). Similarly, S. musiva leaf spot disease severity was dependent upon the levels of Melampsora sp. leaf rust (F = 31.5, p‐value = .0001). S. musiva leaf spot infection severity was significantly lower for individuals with a Melampsora sp. leaf spot score of 3 compared to individuals with less severe Melampsora sp. leaf spot symptoms (Figure 6).
TABLE 3.
One‐way ANOVA, with genotype as a covariate, analyzing the effect of infection severity of the genus of one fungus on the infection severity of the competing leaf fungi in 2008
| Factor | df | Sum of squares | Mean square | F‐ratio | p‐Value |
|---|---|---|---|---|---|
| Dependent variable—Melampsora sp. leaf rust infection | |||||
| Genotype | 732 | 1,120 | 1.53 | 4.69 | <.0001 |
| S. musiva score | 3 | 34.4 | 11.5 | 35.2 | <.0001 |
| Residuals | 602 | 197 | 0.326 | ||
| Dependent Variable—S. musiva leaf spot infection | |||||
| Genotype | 732 | 379 | 0.518 | 1.77 | <.0001 |
| Melampsora sp. score | 3 | 27.6 | 9.19 | 31.5 | <.0001 |
| Residuals | 602 | 176 | 0.292 | ||
FIGURE 6.

Mean and standard error of fungal infection for individuals with varying category levels of competing fungus infection. Letters indicate significantly different means as determined by Tukey’s honest significance test for each one‐way ANOVA test
3.5. PFAM, GO term and tandem duplication enrichment
The total number of genes present in the QTL intervals of each parental species was 174 on Chr04, 81 on Chr16, 161 on Chr10, 445 on Chr13, and 156 on Chr05 (Table 4). There were 40 PFAM domains enriched relative to the rest of the P. trichocarpa genome across all QTL intervals (alpha = 0.05; p‐value threshold < .00014) and 25 PFAM domains enriched in the P. deltoides QTL intervals (alpha = 0.05, p‐value < .000059; Table S2). Additionally, there were 21 GO terms enriched in the P. trichocarpa intervals (alpha = 0.05, p‐value < .000226) and 46 GO terms enriched in the P. deltoides intervals (alpha = 0.05, p‐value < .000214; Table S3). Finally, seven of the genes in these intervals showed evidence of positive selection based on the ratio of nonsynonymous to synonymous nucleotide substitutions between the P. deltoides and P. trichocarpa orthologs (Table 5).
TABLE 4.
Number of genes in QTL intervals in parental genomes for biotic associations
| Fungus/insect | QTL interval | # Genes in P. trichocarpa | # Genes in P. deltoides |
|---|---|---|---|
| Melampsora sp. | Chr04 | 159 | 147 |
| S. musiva canker | Chr16 | 71 | 68 |
| S. musiva leaf spot | Chr06 | 129 | 132 |
| Phyllocolpa sp. | Chr10 | 146 | 154 |
| Phyllocolpa sp. | Chr13 | 252 | 425 |
| M. vagabunda | Chr05 | 129 | 147 |
TABLE 5.
Candidate genes under positive selection (Ka/Ks > 1) in genetic intervals associated with fungi and insects
| QTL | Arabidopsis function | P. trichocarpa gene | P. deltoides gene | Ka/Ks |
|---|---|---|---|---|
| Chr04 | Chitin elicitor receptor kinase 1 | Potri.004G005800 | Podel.04G004900.1.p | 1.35 |
| Chr04 | Cysteine‐rich RLK (RECEPTOR‐like protein kinase) | Potri.004G012600 | Podel.04G010900.1.p | 2.23 |
| Chr04 | Stigma‐specific Stig1 family protein | Potri.004G006800 | Podel.04G005700.1.p | 1.31 |
| Chr04 | Stigma‐specific Stig1 family protein | Potri.004G007200.1 | Podel.04G006100.1.p | 1.00 |
| Chr04 | Stigma‐specific Stig1 family protein | Potri.004G007200 | Podel.04G006100.1.p | 1.00 |
| Chr05 | Pentatricopeptide repeat (PPR) superfamily protein | Potri.005G038500.1 | Podel.05G042200.1.p | 1.52 |
| Chr10 | Copper amine oxidase family protein | Potri.010G088700 | Podel.10G084500.1.p | 1.19 |
In total, there were 107 recent tandem duplicates in the P. trichocarpa intervals and 195 in the P. deltoides intervals for all biotic QTLs (Figure 7, Table 6). This includes 23 and 41 recent tandem duplicates for the Melampsora sp. intervals; 6 and 10 for the S. musiva intervals; 32 and 96 for the Phyllocolpa sp. intervals; and 47 and 46 for the M. vagabunda intervals, for P. trichocarpa and P. deltoides, respectively. The total number of recent tandem duplicates was significantly enriched relative to tandem counts for random intervals of the same size as the QTL intervals for the P. deltoides grandparent (p‐value = .0118) but not for the P. trichocarpa grandparent (p‐value = .1191).
FIGURE 7.
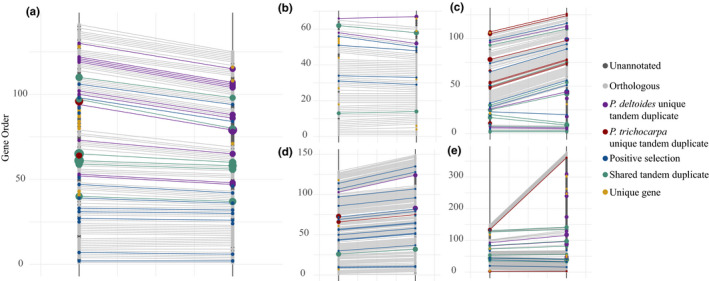
Comparison of gene content in P. trichocarpa grandparent 93‐968 (left line) and P. deltoides grandparent ILL‐101 (right line) for significant genetic intervals for (a) Melampsora sp. Chr04, (b) S. musiva Chr16, (c) M. vagabunda Chr05, (d) Phyllocolpa sp. Chr10, and (e) Phyllocolpa sp. Chr13 associations. QTL intervals were defined as 1Mb regions centered on the marker with the highest LOD score. Size of gene point is relative to the number of genes in the tandem duplication expansion
TABLE 6.
Tandem duplication profiles for genetic intervals. Number of copies next to species gene name indicates the size of tandem expansion for the gene
| Arabidopsis function | P. trichocarpa gene | Copy # | P. deltoides gene | Copy # | QTL Chr |
|---|---|---|---|---|---|
| ERD (early‐ responsive to dehydration stress) family protein | Potri.004G005900 | 3 | Podel.04G005000.1.p | 3 | Chr04 |
| Pentatricopeptide repeat (PPR) superfamily protein | NA | 0 | Podel.04G010100.1.p | 2 | Chr04 |
| Peroxidase superfamily protein | Potri.004G015300 | 1 | Podel.04G013500.1.p | Chr04 | |
| Disease resistance protein (TIR‐NBS‐ LRR class) | Potri.005G031900 | 7 | Podel.05G035500.1.p | 12 | Chr05 |
| Shikimate O‐Hydroxycinnamoyl‐transferase | Potri.005G028000 | 3 | Podel.05G029500.1.p | 2 | Chr05 |
| Protein tyrosine kinase (Pkinase_Tyr) Leucine‐rich repeat (LRR_8) | Potri.005G030600 | 4 | Podel.05G030600.1.p | 2 | Chr05 |
| Lipoxygenase | Potri.005G032400 | 4 | Podel.05G037200.1.p | 3 | Chr05 |
| Cytochrome P450, family 721, subfamily A, polypeptide 1 | Potri.005G034500 | 2 | Podel.05G039300.1.p | 1 | Chr05 |
| Cytochrome P450, family 76, subfamily G, polypeptide 1 | Potri.005G029200 | 5 | Podel.05G034500.1.p | 0 | Chr05 |
| Cytochrome P450, family 93, subfamily D, polypeptide 1 | Potri.005G037100 | 2 | NA | 0 | Chr05 |
| Cytochrome P450, family 76, subfamily G, polypeptide 1 | NA | 0 | Podel.05G034500.1.p | 4 | Chr05 |
| Disease resistance protein (TIR‐NBS class), putative | Potri.005G032000 | 1 | Podel.05G035800.1.p | 12 | Chr05 |
| Receptor‐like kinase in flowers | Potri.005G040200 | 1 | Podel.05G043500.1.p | 2 | Chr05 |
| Pentatricopeptide repeat (PPR) superfamily protein | Potri.010G083800 | 3 | Podel.10G079300.1.p | 3 | Chr10 |
| Copper amine oxidase family protein | Potri.010G088800 | 3 | NA | 0 | Chr10 |
| Ankyrin repeat family protein | Potri.013G133400 | 5 | Podel.13G142400.1.p | 10 | Chr13 |
| O‐methyltransferase family protein | Potri.013G143700 | 4 | Podel.13G181100.1.p | 1 | Chr13 |
| O‐methyltransferase family protein | NA | 0 | Podel.13G144000.1.p | 4 | Chr13 |
| G‐type lectin receptor‐like protein kinase | Potri.016G102500 | 4 | Podel.16G106900.1.p | 4 | Chr16 |
4. DISCUSSION
The goal of our research was to utilize QTL analysis as a tool to identify regions of the Populus genome that were important in mediating biotic interactions. Upon identification of these regions, we were able to directly compare the parental genomes of the hybrid cross to look for similarity in content and potential gene‐for‐gene interactions reflected in recent tandem duplication expansion. We found that the host plant genotype had a significant effect on fungi and insects in our study. Additionally, the progeny segregated for varying resistance to fungal and insect pathogens and pests that were inherited from the grandparents and parents of the 52–124 family cross.
Novel alleles (i.e., those from the grandparent that was not native to the region where the trials occurred) appear to be important for resistance to Melampsora sp. fungus, M. vagabunda galls, and Phyllocolpa sp. oviposition. This is not the first case of potential novel alleles being important in resistance to biotic stress. In a P. trichocarpa GWAS population, three genes have been found that confer novel resistance to S. musiva canker infection and an additional single gene that, when inherited, can suppress that resistance (Muchero et al., 2018). Although cases such as this are still under investigation to understand mechanisms of novel resistance, it can also originate from a variety of simple traits inherent to a non‐native species such as delayed emergence due to phenology (Mercader, Aardema, & Scriber, 2009) or changes in secondary metabolites that are important cues in insect recognition of the host important in oviposition (Nahrstedt, 1989). In contrast, the interval associated with S. musiva canker symptoms was the only case in which susceptibility to the fungus was dominant and inherited from the noncoevolved host (P. trichocarpa), as has been previously observed (Muchero et al., 2018; Newcombe & Ostry, 2001).
We detected a major QTL for Melampsora sp. resistance on Chr04. Although the specific strain that infected the trees is unknown, this genomic interval is known to contain the MXC3 locus which confers resistance to infection of multiple species of the Melampsora leaf rusts (Newcombe, Stirling, & Bradshaw, 2001; Yin, DiFazio, Gunter, Jawdy, et al., 2004). Based on mean parental infection scores and the allelic effects at the QTL, progeny in family 52–124 inherited this resistance from the P. trichocarpa grandmother 93–968. Furthermore, the QTL interval contained two tandem repeats of stigma‐specific proteins (Stig1) in both the P. trichocarpa genome and the orthologous interval in the P. deltoides genome. Several of these genes showed evidence of positive selection based on Ka/Ks ratios (Table 5). Stigma‐specific proteins, specifically Stig1, have been found to be associated with female sterility in tobacco (Nicotiana tabacum) and petunia (Petunia hybrida; Goldman, Goldberg, & Mariani, 1994; Verhoeven et al., 2005). Stig1 is known to mediate secretion of exudate lipids in the intercellular spaces and high expression of the protein inhibits pollen grains from penetrating style tissue preventing fertilization (Verhoeven et al., 2005). Most lipid transfer proteins, such as Stig1, are important in plant cell wall loosening, and their expression can prevent penetration of plant tissues (Nieuwland et al., 2005). Diversification of the protein family containing Stig1 may play an important role in lowering fungal infection in Populus by providing a physical barrier to resist the Melampsora sp. hyphae. Another protein domain that was found to be enriched in the P. trichocarpa Chr04 interval was the malonyl‐CoA decarboxylase C‐terminal domain. Similarly, the gene ontology function for malonyl‐CoA decarboxylase activity was also enriched in P. trichocarpa in the same interval. Genes which are capable of transforming malonyl‐CoA could be beneficial in resistance to Melampsora sp. as it is an important precursor in the production of several pathogen defensive compounds, such as isoprenoids in the Mevalonate pathway (Chen, Kim, Weng, & Browse, 2011; Dixon, 2001).
Interestingly, an overlapping interval on Chr04 was found to be associated with the activity of the leaf spot symptoms of the S. musiva fungus. Upon further investigation, we found that trees that were not infected by the S. musiva leaf spot had more severe symptoms of the Melampsora sp. leaf rust. This suggests that a competitive interaction occurred between the two pathogens in the field during the year of survey and was reflected in an inflated association on Chr04 with the S. musiva leaf spot score. Furthermore, when individuals with presence of Melampsora sp. infection were removed from the S. musiva analysis, the association with Chr04 is no longer significant, and a new QTL appeared on Chr06 (Table S5). Competition among fungal pathogens is not uncommon in field conditions with most examples focused on different genotypes within the same fungal species (Abdullah et al., 2017). The outcome of within host tissue colonization of multiple strains or species often relies upon the genetic similarity of the pathogens (Abdullah et al., 2017; Koskella, Giraud, & Hood, 2006). In our case, we had two very different pathogens that were utilizing the leaf tissue in vastly dissimilar ways. S. musiva is a necrotrophic fungus, which requires dead tissue to reproduce, and Melampsora sp. is biotrophic, requiring living tissue to reproduce. The presence of S. musiva on the trees had a much larger effect on the occurrence of Melampsora sp. infection. This may indicate that the S. musiva fungus had a competitive advantage over Melampsora sp. in utilization of the Populus leaf tissue at our site. Further supporting this finding was the complete loss of Melampsora sp. symptoms at the plantation site over the course of ten years and the continual presence of the S. musiva leaf spot. A similar interaction has been reported in wheat between the biotroph Blumeria graminis f.sp. tritici (Bgt), the powdery mildew pathogen, and necrotroph Zymoseptoria tritici, the cause of Septoria tritici blotch (Orton & Brown, 2016). Similarly, the outcome of the interaction of the two pathogens in wheat was competitive. However, the necrotroph was found to actually be capable of reducing the reproductive capability of the biotroph which indicates pathogen–pathogen interactions can be more direct rather than relying solely on the host plant genetics (Orton & Brown, 2016).
The S. musiva leaf spot and stem canker symptoms were found to be associated with QTL intervals on Chr06 and Chr16, respectively. In this study, susceptibility to the necrotrophic fungi appeared to be originating from the presence of P. trichocarpa alleles in the progeny for both symptoms. Previous work on a P. trichocarpa x deltoides intercross supports this with susceptibility to S. musiva necrotrophic fungi originating primarily from dominant alleles derived from P. trichocarpa (Newcombe, 1998; Newcombe & Ostry, 2001). The Chr06 leaf spot association contained numerous genes with methyltransferase activity which was higher in the P. deltoides interval. Methyltransferase enzymes are important in plant secondary metabolism and have been found to be key in the production of a variety of antimicrobial compounds (Noel, Dixon, Pichersky, Zubieta, & Ferrer, 2003). Interestingly, the loci conferring susceptibility in family 52–124 in the Chr16 canker interval did not overlap with the four loci that were uncovered in a previous genome‐wide association study of S. musiva susceptibility in P. trichocarpa (Muchero et al., 2018), suggesting that different mechanisms may be involved in hybrid interactions with this pathogen. However, the QTL did contain a tandem repeat of a G‐type lectin receptor‐like protein kinase that was expanded in P. deltoides. This protein could play a similar role to a receptor‐like kinase from the same family (Yang et al., 2016) that was associated with susceptibility to S. musiva in the P. trichocarpa study (Muchero et al., 2018).
M. vagabunda has been recorded completing its life cycle on several species of Populus including P. deltoides and P. tremuloides (Floate, 2010). Although the aphid's life history has been documented, little is known about the influence of host plant genetics on gall formation or resistance to feeding (Floate, 2010; Ignoffo & Granovsky, 1961a). We detected a QTL on Chr05 in which alleles inherited from P. deltoides were positively associated with gall occurrence. Genes conferring lipoxygenase and oxidoreductase activity were enriched in both the P. deltoides and the P. trichocarpa QTL intervals. Lipoxygenase genes are known to be associated with the Populus response to both abiotic and biotic stressors (Cheng et al., 2006; Ralph et al., 2006). They are often upregulated in the presence of mechanical damage, fungal pathogen invasion, and exposure to simulated insect feeding (Chen, Liu, Tschaplinski, & Zhao, 2009; Cheng et al., 2006). The lipoxygenases are important in the formation of jasmonic acid, the signaling molecule that upregulates plant defenses against herbivore feeding (Chen et al., 2009).
The M. vagabunda QTL interval on Chr05 also contained a tandem array of resistance genes (R‐genes) that encoded disease resistance proteins (TIR‐NBS‐LRR class) that were greatly expanded in P. trichocarpa compared to P. deltoides, as well as repeats of the leucine‐rich repeat protein kinase family proteins in both species. These protein families are well known for their roles in the recognition and upregulation of host plant defenses against bacterial and fungal infection (Bergelson et al., 2001; Martin, Bogdanove, & Sessa, 2003). Neofunctionalization of R‐genes through tandem duplication due to gene‐for‐gene coevolution has also been demonstrated in many plant–fungal pathosystems (Leister, 2004). Although R‐genes have been more frequently related to plant–fungal interactions, there is increasing evidence that they are also important in mediating plant–insect interactions, especially in insects that utilize piercing‐sucking feeding (Harris et al., 2003; Kaloshian, 2004).
In addition to the R‐genes, there were a series of genes encoding cytochrome P450 family proteins in both species and a unique tandem set that was only present in the P. trichocarpa genome. P450 enzymes are important in the production of many classes of secondary metabolites such as furanocoumarins and terpenoids which are highly toxic to insects (Keeling & Bohlmann, 2006; Schuler, 2011). Alternatively, cytochrome P450’s may also be implicated in the susceptibility of the host plant to galling aphids. They are important in the synthesis of fatty acids and production of suberin in plant tissues (Höfer et al., 2008; Pinot & Beisson, 2011). Typically, suberin is important in separation of different tissues as well as in the establishment of apoplastic barriers that restrict nutrient/water loss as well as pathogen invasion (Höfer et al., 2008; Qin & LeBoldus, 2014). Several insects are known to produce suberized spherical galls on leaves including hymenopteran pests of Rosacea species and dipteran pests of Fabaceae (Krishnan & Franceschi, 1988; Oliveira et al., 2016). If aphids induce the suberization mechanism of the plant genome, it may lead to the increased toughening of aphid galls, much like the woody structures M. vagabunda leaves behind on branches once they have finished feeding.
We detected two QTL for Phyllocolpa sp. with P. trichocarpa alleles being positively associated with leaf fold occurrence in both cases. The P. trichocarpa genomic interval corresponding to the Chr10 QTL was enriched for several domains and GO terms that could be involved in gall development. For example, the interval was enriched for sugar transporters as well as GO terms for sucrose transporter activity. Often in the case of galling insects, plant tissue is modified in such a way as to act as a sugar sink, thereby enhancing its nutritional value to larvae (Larson & Whitham, 1991; Nyman, Widmer, & Roininen, 2000; Wool, 2004). The presence of these combinations of sugar transporter genes may be mediating a similar interaction between the Phyllocolpa sp. female sawflies and their chosen Populus hosts.
Phyllocolpa sp. galls are formed early in the season when a female sawfly selects a leaf and injects the longitudinal fold with small amounts of fluid on the underside of young leaves (Fritz & Price, 1988; Kopelke, 2007). The adult sawfly will proceed to oviposit near the base of the leaf and after 1–2 days the leaf fold forms, and the newly hatched larvae feeds on the inside of the gall (Smith & Fritz, 1996). The Phyllocolpa sp. galls were a unique biotic phenotype to this study as they were an estimate of female sawfly ovipositional choice rather than feeding success. Host selection for oviposition is initially driven by visual cues and reinforced by females assessing the nutrition and chemical cues of foliage (Boeckler, Gershenzon, & Unsicker, 2011; Panda & Khush, 1995). Previous research in Salix (closely related to Populus) has shown that common phenolic glycosides in leaf tissue are important in host choice in both the free‐feeding Nematus oligospilus and galling Euura amerinae specialist sawflies (Fernández et al., 2019; Kolehmainen, Roininen, Julkunen‐Tiitto, & Tahvanainen, 1994). We therefore pursued QTL mapping of metabolites to determine whether phenolic compounds might be important determinants of the potential ovipositional relationship.
We detected three significant QTL for gentisyl alcohol 5‐O‐glucoside levels. One of these overlapped with the Phyllocolpa sp. leaf fold QTL on Chr10. The QTL on Chr14 also overlapped with a suggestive QTL peak for Phyllocolpa sp. (LOD = 3.96). This is the first case of an association of gentisyl alcohol 5‐O‐glucoside with a specialist arthropod in Populus, and is, in fact, the first report of this metabolite in Populus. Salirepin (gentisyl alcohol 2‐O‐glucoside), a closely related metabolite, is a well‐known constituent in Populus sp (Busov et al., 2006; Tschaplinski et al., 2019; Veach et al., 2018), and leaves of P. deltoides and P. trichocarpa x deltoides have a lower abundance, later eluting metabolite with a nearly identical fragmentation pattern to salirepin that we tentatively identify as gentisyl alcohol 2‐O‐glucoside. The QTL contains three putative candidate genes, including an aldehyde dehydrogenase 5F1 (Podel.10G175800) that may be involved in the reduction of gentisyl aldehyde to the alcohol, and two UDP‐glycosyltransferases (Podel.10G184800, Podel.10G185000) that may be involved in the gentisyl alcohol conjugation to glucose. Specific substrates have yet to be determined for these genes, but a previous report suggests aldehyde dehydrogenase 5F1 genes are likely involved in the basic metabolism of Populus (Tian et al., 2015).
Phyllocolpa sp. sawflies are considered a keystone species as the abandoned or unused leaf folds are often used as a habitat for many other species such as aphids and spiders (Bailey & Whitham, 2007). The presence of folds in aspen forests is associated with a twofold increase in arthropod species richness and around a fourfold increase in arthropod abundance relative to forests where the insect is absent (Bailey & Whitham, 2003). This in turn makes the host plant and sawfly relationship important in examining how shifts in the genes of a population ultimately structure whole communities, effectively linking ecology and evolutionary biology. Further investigation of this potential relationship could be a key to connecting Populus genetics to the assemblage of the surrounding communities of organisms.
A striking finding in this study was an elevated number of recent tandem duplications in the P. deltoides genome but not the P. trichocarpa genome for the biotic QTL intervals. Out of the six chromosomes that yielded significant QTL results, four were associated with phenotypes that were fungi and insects native to the distribution of P. deltoides, but not P. trichocarpa. Given that P. deltoides has been coevolving with the majority of the surveyed fungi and insects, it was not unexpected that there were more recent tandem duplicates in biotic intervals in its genome as there is more selective pressure on the native species to overcome biotic stress (Constabel & Lindroth, 2010; Newcombe, Martin, & Kohler, 2010). However, given the high amount of novel resistance occurring in the progeny, recent tandem duplication may also be important in naïve host resistance.
In our study, we demonstrated how host plant genetics directly affect associated fungi and insects in the field, as well as how Populus progeny indirectly structured interactions between pathogens (Whitham et al., 2006). The competition between Melampsora sp. and S. musiva highlights the complexities of how hybrid genetics are capable of strongly mediating multiple species interactions, which can result in inflated genetic associations. Finally, we have shown that many recent tandem duplications, found across biotic stress QTL intervals, have functional annotations that are involved in host plant physical/chemical resistance and tolerance as well as a few that may be implicated in host plant susceptibility. The enrichment of recent tandem duplications is a signature of gene‐for‐gene interactions and a mechanism that is essential to protect long‐lived plants such as trees, enabling them to reach maturity despite many coevolving biotic stressors.
CONFLICT OF INTEREST
None declared.
AUTHOR CONTRIBUTION
Sandra J. Simon: Conceptualization (equal); Data curation (supporting); Formal analysis (equal); Investigation (lead); Methodology (supporting); Writing‐original draft (lead); Writing‐review & editing (supporting). Timothy J. Tschaplinski: Formal analysis (supporting); Investigation (supporting); Methodology (supporting); Writing‐original draft (supporting); Writing‐review & editing (supporting). Jared Leboldus: Data curation (supporting); Investigation (supporting); Methodology (supporting); Writing‐original draft (supporting); Writing‐review & editing (supporting). Ken Keefover‐Ring: Data curation (supporting); Formal analysis (supporting); Investigation (supporting); Writing‐original draft (supporting); Writing‐review & editing (supporting). Muhammad Azeem: Formal analysis (supporting); Investigation (supporting). Jin‐Gui Chen: Data curation (supporting); Funding acquisition (supporting); Investigation (supporting); Writing‐review & editing (supporting). David Macaya‐Sanz: Data curation (supporting); Formal analysis (supporting); Investigation (supporting). William L. MacDonald: Data curation (supporting); Investigation (supporting); Methodology (supporting). Wellington Muchero: Conceptualization (supporting); Funding acquisition (supporting); Investigation (supporting); Methodology (supporting). Stephen P. DiFazio: Conceptualization (equal); Formal analysis (supporting); Funding acquisition (supporting); Investigation (equal); Methodology (equal); Project administration (equal); Writing‐original draft (supporting); Writing‐review & editing (lead).
Supporting information
Table S1‐S5
ACKNOWLEDGMENTS
We would like to thank Tanita Cheevaphantusri, Luke Evans, Nesatalu Hiese, Jacob Miller, Kathleen Haiby, and Richard Shuren for help with field work. We thank James B. McGraw for helpful comments on an earlier draft. This work was supported by BioEnergy Science Center, Center for Bioenergy Innovation, and the Plant‐Microbe Interfaces Scientific Focus Area by the Office of Biological and Environmental Research in the U.S. Department of Energy Office of Science. Oak Ridge National Laboratory is managed by UT‐Battelle, LLC, for the United States Department of Energy under contract DE‐AC05‐00OR22725. This study was supported by Department of Energy (DOE) Office of Science, Office of Biological and Environmental Research (BER) Grant DE‐SC0018196, US Department of Agriculture Grant 2012‐34103‐19771 (to J.M.L.), and the National Science Foundation Dimensions of Biodiversity Program (1542509 to S.D. and 1542479 to K.K.‐R.).
Simon SJ, Tschaplinski TJ, LeBoldus JM, et al. Host plant genetic control of associated fungal and insect species in a Populus hybrid cross. Ecol Evol. 2020;10:5119–5134. 10.1002/ece3.6266
DATA AVAILABILITY STATEMENT
DNA sequences are deposited at NCBI Sequence Read Archive under the following accession numbers: SRP112750, SRP109803, and SRP190316. The annotated P. deltoides clone WV94 genome assembly is available through Phytozome (https://phytozome.jgi.doe.gov/pz/portal.html).
REFERENCES
- Abdullah, A. S. , Moffat, C. S. , Lopez‐Ruiz, F. J. , Gibberd, M. R. , Hamblin, J. , & Zerihun, A. (2017). Host–multi‐pathogen warfare: Pathogen interactions in co‐infected plants. Frontiers in Plant Science, 8, 1806 10.3389/fpls.2017.01806 [DOI] [PMC free article] [PubMed] [Google Scholar]
- Bailey, J. K. , & Whitham, T. G. (2003). Interactions among elk, aspen, galling sawflies and insectivorous birds. Oikos, 101, 127–134. [Google Scholar]
- Bailey, J. K. , & Whitham, T. G. (2007). Biodiversity is related to indirect interactions among species of large effect In Ohgushi T., Craig T., & Price P. (Eds.), Ecological communities: Plant mediation in indirect interaction webs (pp. 306–328). Cambridge: Cambridge University Press. [Google Scholar]
- Bergelson, J. , Kreitman, M. , Stahl, E. A. , & Tian, D. (2001). Evolutionary dynamics of plant R‐Genes. Science, 292, 2281–2285. 10.1126/science.1061337 [DOI] [PubMed] [Google Scholar]
- Bird, J. , Faith, D. P. , Rhomberg, L. , Riska, B. , & Sokal, R. R. (1979). The morphs of Pemphigus populitransversus: Allocation methods, morphometrics, and distribution patterns. Annals of the Entomological Society of America, 72, 767–774. [Google Scholar]
- Boeckler, G. A. , Gershenzon, J. , & Unsicker, S. B. (2011). Phenolic glycosides of the Salicaceae and their role as anti‐herbivore defenses. Phytochemistry, 72, 1497–1509. [DOI] [PubMed] [Google Scholar]
- Broman, K. W. , Wu, H. , Sen, S. , & Churchill, G. A. (2003). R/qtl: QTL mapping in experimental crosses. Bioinformatics, 19, 889–890. [DOI] [PubMed] [Google Scholar]
- Busov, V. , Meilan, R. , Pearce, D. W. , Rood, S. B. , Ma, C. , Tschaplinski, T. J. , & Strauss, S. H. (2006). Transgenic modification of gai or rgl1 causes dwarfing and alters gibberellins, root growth, and metabolite profiles in Populus . Planta, 224, 288–299. 10.1007/s00425-005-0213-9 [DOI] [PubMed] [Google Scholar]
- Chen, F. , Liu, C.‐J. , Tschaplinski, T. J. , & Zhao, N. (2009). Genomics of secondary metabolism in Populus: Interactions with biotic and abiotic environments. Critical Reviews in Plant Sciences, 28, 375–392. 10.1080/07352680903241279 [DOI] [Google Scholar]
- Chen, H. , Kim, H. U. , Weng, H. , & Browse, J. (2011). Malonyl‐CoA synthetase, encoded by ACYL ACTIVATING ENZYME13, is essential for growth and development of Arabidopsis. The Plant Cell, 23, 2247–2262. 10.1105/tpc.111.086140 [DOI] [PMC free article] [PubMed] [Google Scholar]
- Chen, X. M. (2005). Epidemiology and control of stripe rust [Puccinia striiformis f. sp. tritici] on wheat. Canadian Journal of Plant Pathology, 27, 314–337. 10.1080/07060660509507230 [DOI] [Google Scholar]
- Cheng, Q. , Zhang, B. , Zhuge, Q. , Zeng, Y. , Wang, M. , & Huang, M. (2006). Expression profiles of two novel lipoxygenase genes in Populus deltoides . Plant Science, 170, 1027–1035. 10.1016/J.PLANTSCI.2005.12.012 [DOI] [Google Scholar]
- Chisholm, S. T. , Coaker, G. , Day, B. , & Staskawicz, B. J. (2006). Host‐microbe interactions: Shaping the evolution of the plant immune response. Cell, 124, 803–814. 10.1016/J.CELL.2006.02.008 [DOI] [PubMed] [Google Scholar]
- Constabel, C. P. , & Lindroth, R. L. (2010). The impact of genomics on advances in herbivore defense and secondary metabolism in Populus In Jansson S., Bhalerao R., & Groover A. (Eds.), Genetics and Genomics of Populus (pp. 279–305). New York, NY: Springer. [Google Scholar]
- Crutsinger, G. M. , Rudman, S. M. , Rodriguez‐Cabal, M. A. , McKown, A. D. , Sato, T. , MacDonald, A. M. , … El‐Sabaawi, R. W. (2014). Testing a ‘genes‐to‐ecosystems’ approach to understanding aquatic‐terrestrial linkages. Molecular Ecology, 23, 5888–5903. 10.1111/mec.12931 [DOI] [PubMed] [Google Scholar]
- Danecek, P. , Auton, A. , Abecasis, G. , Albers, C. A. , Banks, E. , DePristo, M. A. , … Durbin, R. (2011). The variant call format and VCFtools. Bioinformatics, 27, 2156–2158. 10.1093/bioinformatics/btr330 [DOI] [PMC free article] [PubMed] [Google Scholar]
- Dixon, R. A. (2001). Natural products and plant disease resistance. Nature, 411, 843–847. 10.1038/35081178 [DOI] [PubMed] [Google Scholar]
- Ehrlich, P. R. , & Raven, P. H. (1964). Butterflies and plants: A study in coevolution. Evolution, 18, 586–608. 10.2307/2406212 [DOI] [Google Scholar]
- Faith, D. P. (1979). Strategies of gall formation in Pemphigus aphids. Journal of the New York Entomological Society, 87, 21–37. [Google Scholar]
- Fernández, P. C. , Braccini, C. L. , Dávila, C. , Barrozo, R. B. , Aráoz, M. V. C. , Cerrillo, T. , … Zavala, J. A. (2019). The use of leaf surface contact cues during oviposition explains field Preferences in the willow sawfly Nematus oligospilus . Scientific Reports, 9, 4946 10.1038/s41598-019-41318-7 [DOI] [PMC free article] [PubMed] [Google Scholar]
- Floate, K. D. (2010). Gall‐inducing aphids and mites associated with the hybrid complex of cottonwoods, Populus spp. (Salicaceae) on Canada’s grasslands. Arthropods of Canadian Grasslands, 1, 281–300. 10.3752/9780968932148.ch13 [DOI] [Google Scholar]
- Flor, H. H. (1971). Current status of the gene‐for‐gene concept. Annual Review of Phytopathology, 9, 275–296. [Google Scholar]
- Friesen, T. L. , Meinhardt, S. W. , & Faris, J. D. (2007). The Stagonospora nodorum‐wheat pathosystem involves multiple proteinaceous host‐selective toxins and corresponding host sensitivity genes that interact in an inverse gene‐for‐gene manner. The Plant Journal, 51, 681–692. 10.1111/j.1365-313X.2007.03166.x [DOI] [PubMed] [Google Scholar]
- Fritz, R. S. , & Price, P. W. (1988). Genetic variation among plants and insect community structure: Willows and sawflies. Ecology, 69, 845–856. [Google Scholar]
- Gallun, R. L. (1977). Genetic basis of Hessian fly epidemics. Annals of the New York Academy of Sciences, 287, 223–229. 10.1111/j.1749-6632.1977.tb34241.x [DOI] [Google Scholar]
- Gianola, D. , & Norton, H. W. (1981). Scaling threshold characters. Genetics, 99, 357–364. [DOI] [PMC free article] [PubMed] [Google Scholar]
- Goldman, M. H. , Goldberg, R. B. , & Mariani, C. (1994). Female sterile tobacco plants are produced by stigma‐specific cell ablation. EMBO Journal, 13, 2976–2984. 10.1002/J.1460-2075.1994.TB06596.X [DOI] [PMC free article] [PubMed] [Google Scholar]
- Goodstein, D. M. , Shu, S. , Howson, R. , Neupane, R. , Hayes, R. D. , Fazo, J. , … Rokhsar, D. S. (2012). Phytozome: A comparative platform for green plant genomics. Nucleic Acids Research, 40, D1178–D1186. 10.1093/nar/gkr944 [DOI] [PMC free article] [PubMed] [Google Scholar]
- Harris, M. O. , Stuart, J. J. , Mohan, M. , Nair, S. , Lamb, R. J. , & Rohfritsch, O. (2003). Grasses and gall midges: Plant defense and insect adaptation. Annual Review of Entomology, 48, 549–577. [DOI] [PubMed] [Google Scholar]
- Haruta, M. , Major, I. T. , Christopher, M. E. , Patton, J. J. , & Constabel, C. P. (2001). A Kunitz trypsin inhibitor gene family from trembling aspen (Populus tremuloides Michx.): Cloning, functional expression, and induction by wounding and herbivory. Plant Molecular Biology, 46, 347–359. 10.1023/A:1010654711619 [DOI] [PubMed] [Google Scholar]
- Höfer, R. , Briesen, I. , Beck, M. , Pinot, F. , Schreiber, L. , & Franke, R. (2008). The Arabidopsis cytochrome P450 CYP86A1 encodes a fatty acid ω‐hydroxylase involved in suberin monomer biosynthesis. Journal of Experimental Botany, 59, 2347–2360. [DOI] [PMC free article] [PubMed] [Google Scholar]
- Hulbert, S. H. , Webb, C. A. , Smith, S. M. , & Sun, Q. (2001). Resistance gene complexes: Evolution and utilization. Annual Review of Phytopathology, 39, 285–312. 10.1146/annurev.phyto.39.1.285 [DOI] [PubMed] [Google Scholar]
- Ignoffo, C. M. , & Granovsky, A. A. (1961a). Life history and gall development of Mordwilkoja vagabunda (Homoptera: Aphidae) on Populus deltoides . Annals of the Entomological Society of America, 54, 486–499. 10.1093/aesa/54.4.486 [DOI] [Google Scholar]
- Ignoffo, C. M. , & Granovsky, A. A. (1961b). Life history and gall development of Mordwilkoja vagabunda (Homoptera: Aphidae) on Populus deltoides. Part II—gall development. Annals of the Entomological Society of America, 54, 635–641. [Google Scholar]
- Kaloshian, I. (2004). Gene‐for‐gene disease resistance: Bridging insect pest and pathogen defense. Journal of Chemical Ecology, 30, 2419–2438. 10.1007/s10886-004-7943-1 [DOI] [PubMed] [Google Scholar]
- Keeling, C. I. , & Bohlmann, J. (2006). Genes, enzymes and chemicals of terpenoid diversity in the constitutive and induced defence of conifers against insects and pathogens. New Phytologist, 170, 657–675. 10.1111/j.1469-8137.2006.01716.x [DOI] [PubMed] [Google Scholar]
- Kolehmainen, J. , Roininen, H. , Julkunen‐Tiitto, R. , & Tahvanainen, J. (1994). Importance of phenolic glucosides in host selection of shoot galling sawfly, Euura amerinae, on Salix pentandra . Journal of Chemical Ecology, 20, 2455–2466. 10.1007/BF02033213 [DOI] [PubMed] [Google Scholar]
- Kopelke, J.‐P. (2007). The European species of the genus Phyllocolpa, Part I: The leucosticta‐group (Insecta, Hymenoptera, Tenthredinidae, Nematinae). Senckenbergiana Biologica, 87, 75–109. [Google Scholar]
- Koskella, B. , Giraud, T. , & Hood, M. E. (2006). Pathogen relatedness affects the prevalence of within‐host competition. The American Naturalist, 168, 121–126. [DOI] [PubMed] [Google Scholar]
- Krishnan, H. B. , & Franceschi, V. R. (1988). Anatomy of some leaf galls of Rosa woodsii (Rosaceae). American Journal of Botany, 75, 369–376. [Google Scholar]
- Larson, K. C. , & Whitham, T. G. (1991). Manipulation of food resources by a gall‐forming aphid: The physiology of sink‐source interactions. Oecologia, 88, 15–21. 10.1007/BF00328398 [DOI] [PubMed] [Google Scholar]
- Lefebvre, V. , & Chèvre, A. (1995). Tools for marking plant disease and pest resistance genes: A review. Agronomie, 15, 3–19. [Google Scholar]
- Leister, D. (2004). Tandem and segmental gene duplication and recombination in the evolution of plant disease resistance genes. Trends in Genetics, 20, 116–122. 10.1016/J.TIG.2004.01.007 [DOI] [PubMed] [Google Scholar]
- Li, H. (2011). A statistical framework for SNP calling, mutation discovery, association mapping and population genetical parameter estimation from sequencing data. Bioinformatics, 27, 2987–2993. 10.1093/bioinformatics/btr509 [DOI] [PMC free article] [PubMed] [Google Scholar]
- Li, H. , Handsaker, B. , Wysoker, A. , Fennell, T. , Ruan, J. , Homer, N. , … Durbin, R. (2009). The Sequence Alignment/Map format and SAMtools. Bioinformatics, 25, 2078–2079. 10.1093/bioinformatics/btp352 [DOI] [PMC free article] [PubMed] [Google Scholar]
- Major, I. T. , & Constabel, C. P. (2008). Functional analysis of the Kunitz trypsin inhibitor family in poplar reveals biochemical diversity and multiplicity in defense against herbivores. Plant Physiology, 146, 888–903. 10.1104/pp.107.106229 [DOI] [PMC free article] [PubMed] [Google Scholar]
- Martin, G. B. , Bogdanove, A. J. , & Sessa, G. (2003). Understanding the functions of plant disease resistance proteins. Annual Review of Plant Biology, 54, 23–61. 10.1146/annurev.arplant.54.031902.135035 [DOI] [PubMed] [Google Scholar]
- McKown, A. D. , Klapste, J. , Guy, R. D. , Geraldes, A. , Porth, I. , Hannemann, J. , … Douglas, C. J. (2014). Genome‐wide association implicates numerous genes underlying ecological trait variation in natural populations of Populus trichocarpa . New Phytologist, 203, 535–553. 10.1111/nph.12815 [DOI] [PubMed] [Google Scholar]
- Meilan, R. , Han, K. H. , Ma, C. , DiFazio, S. P. , Eaton, J. A. , Hoien, E. A. , … Strauss, S. H. (2002). The CP4 transgene provides high levels of tolerance to Roundup® herbicide in field‐grown hybrid poplars. Canadian Journal of Forest Research, 32, 967–976. 10.1139/x02-015 [DOI] [Google Scholar]
- Mello, M. O. , & Silva‐Filho, M. C. (2002). Plant‐insect interactions: An evolutionary arms race between two distinct defense mechanisms. Brazilian Journal of Plant Physiology, 14, 71–81. 10.1590/S1677-04202002000200001 [DOI] [Google Scholar]
- Mercader, R. J. , Aardema, M. L. , & Scriber, J. M. (2009). Hybridization leads to host‐use divergence in a polyphagous butterfly sibling species pair. Oecologia, 158, 651–662. [DOI] [PubMed] [Google Scholar]
- Muchero, W. , Guo, J. , DiFazio, S. P. , Chen, J.‐G. , Ranjan, P. , Slavov, G. T. , … Tuskan, G. A. (2015). High‐resolution genetic mapping of allelic variants associated with cell wall chemistry in Populus . BMC Genomics, 16, 24 10.1186/s12864-015-1215-z [DOI] [PMC free article] [PubMed] [Google Scholar]
- Muchero, W. , Sondreli, K. L. , Chen, J. G. , Urbanowicz, B. R. , Zhang, J. , Singan, V. , … LeBoldus, J. M. (2018). Association mapping, transcriptomics, and transient expression identify candidate genes mediating plant‐pathogen interactions in a tree. Proceedings of the National Academy of Sciences of the United States of America, 115, 11573–11578. 10.1073/pnas.1804428115 [DOI] [PMC free article] [PubMed] [Google Scholar]
- Nahrstedt, A. (1989). The significance of secondary metabolites for interactions between plants and insects. Planta Medica, 55, 333–338. [DOI] [PubMed] [Google Scholar]
- Newcombe, G. (1998). A review of exapted resistance to diseases of Populus. Forest Pathology, 28, 209–216. 10.1111/j.1439-0329.1998.tb01175.x [DOI] [Google Scholar]
- Newcombe, G. , Martin, F. , & Kohler, A. (2010). Defense and nutrient mutualisms in Populus In Jansson S., Bhalerao R., & Groover A. (Eds.), Genetics and genomics of Populus (pp. 247–277). New York, NY: Springer. [Google Scholar]
- Newcombe, G. , & Ostry, M. (2001). Recessive resistance to Septoria stem canker of hybrid poplar. Phytopathology, 91, 1081–1084. 10.1094/PHYTO.2001.91.11.1081 [DOI] [PubMed] [Google Scholar]
- Newcombe, G. , Stirling, B. , & Bradshaw, H. D. Jr (2001). Abundant pathogenic variation in the new hybrid rust Melampsora× columbiana on hybrid poplar. Phytopathology, 91, 981–985. 10.1094/PHYTO.2001.91.10.981 [DOI] [PubMed] [Google Scholar]
- Nieuwland, J. , Feron, R. , Huisman, B. A. H. , Fasolino, A. , Hilbers, C. W. , Derksen, J. , & Mariani, C. (2005). Lipid transfer proteins enhance cell wall extension in tobacco. Plant Cell Online, 17, 2009–2019. 10.1105/tpc.105.032094 [DOI] [PMC free article] [PubMed] [Google Scholar]
- Noel, J. P. , Dixon, R. A. , Pichersky, E. , Zubieta, C. , & Ferrer, J.‐L. (2003). Chapter two Structural, functional, and evolutionary basis for methylation of plant small molecules In Romeo J. T. (Ed.), Recent advances in phytochemistry (Vol. 37, pp. 37–58). Elsevier; 10.1016/S0079-9920(03)80017-5 [DOI] [Google Scholar]
- Nyman, T. , Widmer, A. , & Roininen, H. (2000). Evolution of gall morphology and host‐plant relationships in willow‐feeding sawflies (Hymenoptera: Tenthradinidae). Evolution, 54, 526–533. 10.1111/j.0014-3820.2000.tb00055.x [DOI] [PubMed] [Google Scholar]
- Oliveira, D. C. , Isaias, R. M. , Fernandes, G. W. , Ferreira, B. G. , Carneiro, R. G. , & Fuzaro, L. (2016). Manipulation of host plant cells and tissues by gall‐inducing insects and adaptive strategies used by different feeding guilds. Journal of Insect Physiology, 1, 103–113. 10.1016/j.jinsphys.2015.11.012 [DOI] [PubMed] [Google Scholar]
- Orton, E. S. , & Brown, J. K. M. (2016). Reduction of growth and reproduction of the biotrophic fungus Blumeria graminis in the presence of a necrotrophic pathogen. Frontiers in Plant Science, 7, 742 10.3389/fpls.2016.00742 [DOI] [PMC free article] [PubMed] [Google Scholar]
- Panda, N. , & Khush, G. S. (1995). Host plant resistance to insects. Wallingford, UK: CAB International. [Google Scholar]
- Philippe, R. N. , Ralph, S. G. , Külheim, C. , Jancsik, S. I. , & Bohlmann, J. (2009). Poplar defense against insects: Genome analysis, full‐length cDNA cloning, and transcriptome and protein analysis of the poplar Kunitz‐type protease inhibitor family. New Phytologist, 184, 865–884. 10.1111/j.1469-8137.2009.03028.x [DOI] [PubMed] [Google Scholar]
- Pinot, F. , & Beisson, F. (2011). Cytochrome P450 metabolizing fatty acids in plants: Characterization and physiological roles. FEBS Journal, 278, 195–205. 10.1111/j.1742-4658.2010.07948.x [DOI] [PubMed] [Google Scholar]
- Pretorius, Z. A. , Singh, R. P. , Wagoire, W. W. , & Payne, T. S. (2000). Detection of virulence to wheat stem rust resistance gene Sr31 in Puccinia graminis. f. sp. tritici in Uganda. Plant Disease, 84, 203–203. 10.1094/PDIS.2000.84.2.203B [DOI] [PubMed] [Google Scholar]
- Qin, R. , & LeBoldus, J. M. (2014). The infection biology of Sphaerulina musiva: Clues to understanding a forest pathogen. PLoS ONE, 9, e103477 10.1371/journal.pone.0103477 [DOI] [PMC free article] [PubMed] [Google Scholar]
- Ralph, S. , Oddy, C. , Cooper, D. , Yueh, H. , Jancsik, S. , Kolosova, N. , … Bohlmann, J. (2006). Genomics of hybrid poplar (Populus trichocarpa× deltoides) interacting with forest tent caterpillars (Malacosoma disstria): Normalized and full‐length cDNA libraries, expressed sequence tags, and a cDNA microarray for the study of insect‐induced defences. Molecular Ecology, 15, 1275–1297. 10.1111/j.1365-294X.2006.02824.x [DOI] [PubMed] [Google Scholar]
- Schuler, M. A. (2011). P450s in plant–insect interactions. Biochimica Et Biophysica Acta (BBA) ‐ Proteins and Proteomics, 1814, 36–45. 10.1016/J.BBAPAP.2010.09.012 [DOI] [PubMed] [Google Scholar]
- Slavov, G. , DiFazio, S. , Martin, J. , Schackwitz, W. , Muchero, W. , Rodgers‐Melnick, E. , … Tuskan, G. (2012). Genome resequencing reveals multiscale geographic structure and extensive linkage disequilibrium in the forest tree Populus trichocarpa. New Phytologist, 196, 713–725. [DOI] [PubMed] [Google Scholar]
- Smith, D. R. , & Fritz, R. S. (1996). Review of the eastern United States species of the leaf‐folding sawflies of the genus Phyllocolpa Benson (Hymenoptera: Tenthredinidae). Proceedings of the Entomological Society of Washington, 98, 695–707. [Google Scholar]
- Stajich, J. E. (2002). The Bioperl Toolkit: Perl modules for the life sciences. Genome Research, 12, 1611–1618. 10.1101/gr.361602 [DOI] [PMC free article] [PubMed] [Google Scholar]
- Stanton, B. J. , Neale, B. , & Li, S. (2010). Populus breeding: From the classical to the genomic approach In Jansson S., Bhalerao R., & Groover A. (Eds.), Genetics and genomics of populus (pp. 309–348). New York, NY: Springer. [Google Scholar]
- Taylor, G. (2002). Populus: Arabidopsis for forestry. Do we need a model tree? Annals of Botany, 90, 681–689. 10.1093/aob/mcf255 [DOI] [PMC free article] [PubMed] [Google Scholar]
- Thompson, J. N. (1988). Coevolution and alternative hypotheses on insect/plant interactions. Ecology, 69, 893–895. 10.2307/1941238 [DOI] [Google Scholar]
- Thompson, J. N. , & Burdon, J. J. (1992). Gene‐for‐gene coevolution between plants and parasites. Nature, 360, 121–125. 10.1038/360121a0 [DOI] [Google Scholar]
- Tian, F.‐X. , Zang, J.‐L. , Wang, T. , Xie, Y.‐L. , Zhang, J. , & Hu, J.‐J. (2015). Aldehyde dehydrogenase gene superfamily in Populus: Organization and expression divergence between paralogous gene pairs. PLoS ONE, 10, e0124669 10.1371/journal.pone.0124669 [DOI] [PMC free article] [PubMed] [Google Scholar]
- Tschaplinski, T. J. , Abraham, P. E. , Jawdy, S. S. , Gunter, L. E. , Martin, M. Z. , Engle, N. L. , … Tuskan, G. A. (2019). The nature of the progression of drought stress drives differential metabolomic responses in Populus deltoides . Annals of Botany, 124, 617–626. 10.1093/aob/mcz002 [DOI] [PMC free article] [PubMed] [Google Scholar]
- Veach, A. M. , Yip, D. , Engle, N. L. , Yang, Z. K. , Bible, A. , Morrell‐Falvey, J. , … Schadt, C. W. (2018). Modification of plant cell wall chemistry impacts metabolome and microbiome composition in Populus PdKOR1 RNAi plants. Plant and Soil, 429, 349–361. 10.1007/s11104-018-3692-8 [DOI] [Google Scholar]
- Verhoeven, T. , Feron, R. , Wolters‐Arts, M. , Edqvist, J. , Gerats, T. , Derksen, J. , & Mariani, C. (2005). STIG1 controls exudate secretion in the pistil of petunia and tobacco. Plant Physiology, 138, 153–160. 10.1104/pp.104.054809 [DOI] [PMC free article] [PubMed] [Google Scholar]
- Verkley, G. J. M. , Quaedvlieg, W. , Shin, H.‐D. , & Crous, P. W. (2013). A new approach to species delimitation in Septoria. Studies in Mycology, 75, 213–305. 10.3114/sim0018 [DOI] [PMC free article] [PubMed] [Google Scholar]
- Wang, Y. , Tang, H. , Debarry, J. D. , Tan, X. , Li, J. , Wang, X. , … Paterson, A. H. (2012). MCScanX: A toolkit for detection and evolutionary analysis of gene synteny and collinearity. Nucleic Acids Research, 40, 1–14. 10.1093/nar/gkr1293 [DOI] [PMC free article] [PubMed] [Google Scholar]
- Weston, D. J. , Rogers, A. , Tschaplinski, T. J. , Gunter, L. E. , Jawdy, S. A. , Engle, N. L. , … Wullschleger, S. D. (2015). Scaling nitrogen and carbon interactions: What are the consequences of biological buffering? Ecology and Evolution, 5, 2839–2850. [DOI] [PMC free article] [PubMed] [Google Scholar]
- Whitham, T. G. , Bailey, J. K. , Schweitzer, J. A. , Shuster, S. M. , Bangert, R. K. , LeRoy, C. J. , … Wooley, S. C. (2006). A framework for community and ecosystem genetics: From genes to ecosystems. Nature Reviews Genetics, 7, 510–523. 10.1038/nrg1877 [DOI] [PubMed] [Google Scholar]
- Wool, D. (2004). Galling aphids: Specialization, biological complexity, and variation. Annual Review of Entomology, 49, 175–192. 10.1146/annurev.ento.49.061802.123236 [DOI] [PubMed] [Google Scholar]
- Yang, Y. , Labbé, J. , Muchero, W. , Yang, X. , Jawdy, S. S. , Kennedy, M. , … Chen, J. G. (2016). Genome‐wide analysis of lectin receptor‐like kinases in Populus . BMC Genomics, 17, 699 10.1186/s12864-016-3026-2 [DOI] [PMC free article] [PubMed] [Google Scholar]
- Yin, T.‐M. , DiFazio, S. P. , Gunter, L. E. , Jawdy, S. S. , Boerjan, W. , & Tuskan, G. A. (2004). Genetic and physical mapping of Melampsora rust resistance genes in Populus and characterization of linkage disequilibrium and flanking genomic sequence. New Phytologist, 164, 95–105. 10.1111/j.1469-8137.2004.01161.x [DOI] [PubMed] [Google Scholar]
- Yin, T.‐M. , DiFazio, S. P. , Gunter, L. E. , Riemenschneider, D. , & Tuskan, G. A. (2004). Large‐scale heterospecific segregation distortion in Populus revealed by a dense genetic map. Theoretical and Applied Genetics, 109, 451–463. [DOI] [PubMed] [Google Scholar]
- Zhao, N. , Guan, J. , Ferrer, J. L. , Engle, N. , Chern, M. , Ronald, P. , … Chen, F. (2010). Biosynthesis and emission of insect‐induced methyl salicylate and methyl benzoate from rice. Plant Physiology and Biochemistry, 48, 279–287. 10.1016/j.plaphy.2010.01.023 [DOI] [PubMed] [Google Scholar]
Associated Data
This section collects any data citations, data availability statements, or supplementary materials included in this article.
Supplementary Materials
Table S1‐S5
Data Availability Statement
DNA sequences are deposited at NCBI Sequence Read Archive under the following accession numbers: SRP112750, SRP109803, and SRP190316. The annotated P. deltoides clone WV94 genome assembly is available through Phytozome (https://phytozome.jgi.doe.gov/pz/portal.html).