

Abstract
Cytoskeletal‐based molecular motors produce force perpendicular to their direction of movement. However, it remains unknown whether and why motor proteins generate sidesteps movement along their filamentous tracks in vivo. Using Hessian structured illumination microscopy, we located green fluorescent protein (GFP)‐labeled intraflagellar transport (IFT) particles inside sensory cilia of live Caenorhabditis elegans with 3–6‐nanometer accuracy and 3.4‐ms resolution. We found that IFT particles took sidesteps along axoneme microtubules, demonstrating that IFT motors generate torque in a living animal. Kinesin‐II and OSM‐3‐kinesin collaboratively drive anterograde IFT. We showed that the deletion of kinesin‐II, a torque‐generating motor protein, reduced sidesteps, whereas the increase of neck flexibility of OSM‐3‐kinesin upregulated sidesteps. Either increase or decrease of sidesteps of IFT kinesins allowed ciliogenesis to the regular length, but changed IFT speeds, disrupted axonemal ninefold symmetry, and inhibited sensory cilia‐dependent animal behaviors. Thus, an optimum level of IFT kinesin sidestepping is associated with the structural and functional fidelity of cilia.
Keywords: Caenorhabditis elegans, cilia, intraflagellar transport, kinesin, torque generation
Subject Categories: Cell Adhesion, Polarity & Cytoskeleton
Modulation of sidestepping activity of ciliary kinesins OSM‐3 and kinesin‐II disrupts axonemal symmetry and chemosensation in Caenorhabditis elegans sensory neurons.

Introduction
An efficient intracellular transport system depends on the unidirectional translocation of cargo molecules by members of the myosin, kinesin, and dynein family motor proteins (Hartman et al, 2011; Scholey, 2013; Reck‐Peterson et al, 2018; Sweeney & Holzbaur, 2018). Intriguingly, these linear motor proteins do not always follow a strictly linear path along actin filaments or microtubules (MTs). They also produce force perpendicular to their direction of movement, generating sidesteps or off‐axis movement along their filamentous tracks (Ricca & Rock, 2010; Brunnbauer et al, 2012; Ferro et al, 2019). Torque generation of motor proteins was first demonstrated by the purified Tetrahymena axonemal dynein, which rotates the microtubules around their axes while translocating them (Vale & Toyoshima, 1988). Subsequently, in vitro studies revealed that such torsional and axial force generation appears to be a prevalent feature for all three families of molecular motors (Nishizaka et al, 1993; Yajima & Cross, 2005; Beausang et al, 2008; Yajima et al, 2008; Ricca & Rock, 2010; Brunnbauer et al, 2012; Can et al, 2014; Ferro et al, 2019). However, it remains unclear whether motor proteins take sidesteps and generate torque in a living cell.
Detection of sidesteps of motor proteins in a living organism requires observing the motor or cargo molecules with an unprecedented combination of temporal and spatial resolution. In particular, the spatial resolution needs to be higher than the diameter of the cytoskeletal tracks, and the temporal resolution should be sufficient to follow the stepping behaviors of motor proteins in the cellular environment of physiological adenosine 5′‐triphosphate concentration and temperature. Here, we developed an ultrafast live super‐resolution imaging system to track multi‐GFP‐labeled intraflagellar transport (IFT) particles being carried by MT motors along the sensory cilia of Caenorhabditis elegans with 3–6‐nanometer accuracy and 3.4‐ms resolution. IFT is a microtubule‐based transport system that drives the assembly and maintenance of cilia, which are essential for cell motility and signal perception in virtually all eukaryotic cells (Reiter & Leroux, 2017; Khan & Scholey, 2018; Breslow & Holland, 2019). During IFT, anterograde kinesin‐2 and retrograde IFT dynein motors bidirectionally transport IFT particles that deliver functional cargo molecules, including axoneme precursors, to the site of assembly within cilia (Scholey, 2013; Taschner & Lorentzen, 2016).
Sidestepping behavior is proposed to be advantageous for motor proteins to evade macromolecular obstacles such as cytoskeleton‐associated proteins and stationary organelles in the tracks. The model predicts that the reduction of the sidestepping of motor proteins will cause traffic jams on the cytoskeleton and slow down intracellular transport. Still, the underlying functional significance of torque generation has not been directly examined in vivo. In our study, we deleted the torque‐generating kinesin‐II and reduced its sidestepping behavior; however, we did not detect traffic jams within cilia and found an acceleration of IFT in the formation of the full‐length cilia. Instead of the obstacle avoidance model, we propose that an optimum level of the sidestepping of IFT kinesins is associated with proper axoneme symmetry and animal chemosensation.
Results
Development of an ultrafast super‐resolution imaging system for IFT in Caenorhabditis elegans
We first sought to label IFT protein machinery with the highest possible fluorescence signal and the lowest background in C. elegans. Using the CRISPR‐Cas9‐based genome editing method (Appendix Fig S1A), we inserted fluorescence tags into the genomic loci of the subunits of IFT particles (CHE‐2 or DYF‐11) or IFT dynein heavy chain (CHE‐3; the anterograde cargo for IFT kinesin). The endogenous expression level minimizes non‐specific background fluorescence. To increase the signal, we knocked seven copies of the GFP11 tag into the loci and used a ciliated neuron‐specific promoter Pdyf‐1 to express GFP1‐10 in 7XGFP11 knock‐in animals. GFP1‐10 and GFP11 self‐complemented in the ciliated neurons and illuminated IFT proteins with proportionally enhanced green fluorescence (Kamiyama et al, 2016; Jia et al, 2019). We also constructed knock‐in animals in which three copies of GFP were inserted into the sites of the C. elegans genome (Appendix Fig S1A). Next, we combined fluorescence markers by the genetic cross and achieved fluorescence labeling of IFT particles with up to 42 copies of GFP molecules (Appendix Fig S1A and B). We determined whether fluorescence labeling affected ciliary structure or functionality by measuring cilium length, IFT speeds, and the capacity of the animal to uptake fluorescence dye through sensory cilia (Dyf). Dye‐filling defects of C. elegans indicate the abnormality of sensory neurons to contact with the environment and suggest defective ciliary structure and function (Perkins et al, 1986). Expression of GFP with copy numbers more than 26 shortened cilium length, disrupted IFT, and completely abolished Dyf. In contrast, the ciliary structure and function in the animals with 14 GFP copies or less were indistinguishable to those of non‐labeling animals (Appendix Figs S1 and S2). Thus, we used the knock‐in animals expressing 12 or 14 copies of GFP or animals carrying 26 copies of GFP within the normal cilia in our imaging experiments.
We chose to study IFT in the middle ciliary segments of the phasmid PHA/B neurons because this region allows the visualization of an individual cilium in the animal (Fig 1A, Movie EV1; Inglis et al, 2007). The C. elegans typically grow at 15–25°C, and we performed our measurements at 20°C. Fluorescence images of IFT particles labeled with 12–26 GFP molecules were visualized with structured illumination microscopy based on Hessian matrixes (Hessian‐SIM), employing the second‐order partial derivative matrixes to minimize artifacts of SIM, and operating at a rolling reconstruction of a 3.4‐ms rate per frame (Huang et al, 2018). Super‐resolved fluorescence puncta could be fitted with a Gaussian function with an overall 3–6‐nm precision (Fig 1B and C, Appendix Fig S3A–C). By projecting the time‐lapse fluorescence images of IFT particles, we found four peaks of fluorescence intensity along the width of the middle ciliary segments in C. elegans (Appendix Fig S4A–C). To understand the number of fluorescence tracks, we modeled the laser illumination of an axoneme that contains nine doublet MTs. From most imaging angles, we detected four doublets on the focal plane (Appendix Fig S4D–G, Movie EV2). The spatial resolution of Hessian‐SIM is 88 nm (Huang et al, 2018), allowing us to distinguish MT doublet tracks. Considering that the diameter of the cilium is 300–400 nm, we suggest that IFT particles could be tracked on individual axonemal doublet MTs.
Figure 1. Visualization of IFT at high spatiotemporal resolutions in GFP knock‐in animals.
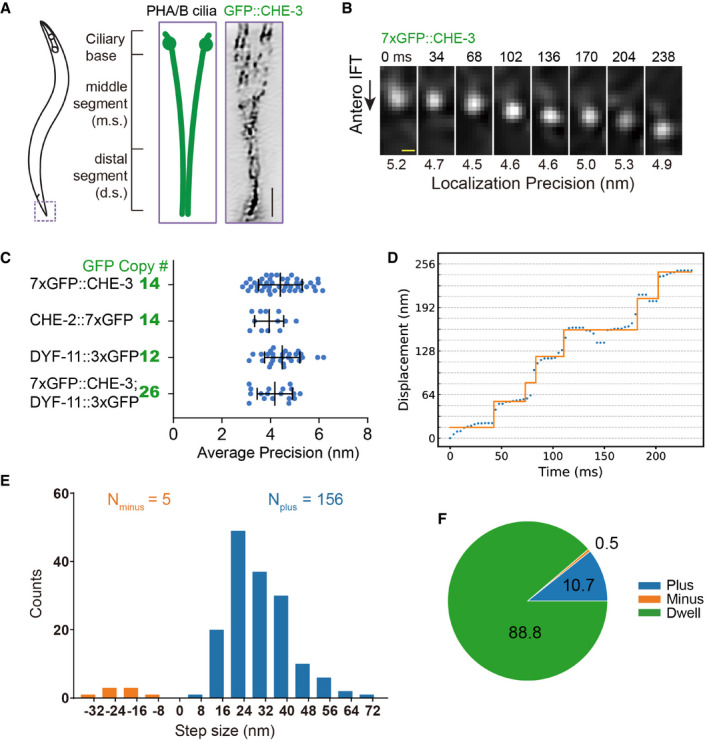
- Schematic depiction of the Caenorhabditis elegans phasmid cilia (left). Two sensory cilia are aligned into the phasmid channel (the dashed box and enlarged in the middle). Each cilium contains a ciliary base, a middle segment (m.s.), and a distal segment (d.s.). Right shows an inverted fluorescence Hessian‐SIM image of GFP‐tagged dynein‐2 heavy chain CHE‐3 in cilia, in which individual puncta were resolved. Scale bar: 1 μm. Also shown in Appendix Fig S4A.
- Frame series of an anterograde moving IFT particle from a 7xGFP::CHE‐3 worm. Localization precisions are shown under each frame. Time in millisecond (ms); scale bar, 100 nm. More examples from CHE‐2::7xGFP, DYF‐11::3xGFP, or 7xGFP::CHE‐3; DYF‐11::3xGFP animals are in Appendix Fig S3B and C.
- Localization precisions (mean ± SD) of tracks from multi‐GFP‐labeled worms. The number of GFP copies was estimated as the following: The dynein‐2 heavy chain of CHE‐3 forms a dimer, 14 = 2 × 7; IFT particle subunit CHE‐2 is also a dimer, 14 = 2 × 7; IFT particle subunit DYF‐11 can be a tetramer, 12 = 4 × 3; and the genetic cross combined 7xGFP::CHE‐3 with DYF‐11::3XGFP, 26 = 2 × 7 + 4 × 3.
- The representative diagram shows the displacement of the cargo within the middle ciliary segment. The y‐axis grid lines are spaced 16 nm. Protein CHE‐3 tagged with 7× GFP was used for tracking experiments. Trace was analyzed using the SIC fitting algorithm (Kalafut & Visscher, 2008).
- Histogram of 161 displacements detected in 15 tracks extracted from 12 WT worms. The plus and minus displacements are defined as the upward “jumping” or downward “jumping” in Fig 1D. Protein markers used for tracking experiments are CHE‐3 tagged with 7× GFP, CHE‐2 tagged with 7× GFP, or CHE‐3 tagged with 7× GFP plus DYF‐11 tagged with 3× GFP.
Sidestepping behavior of IFT in cilia
Two‐dimensional Gaussian‐fit localization showed that IFT particles underwent displacements in the anterograde direction. Because GFPs are labeled on the cargo molecules, not on the motors themselves, the “jumping” in Fig 1D reflects the displacement of the cargo, and we are not able to determine the step size of the motorheads. In agreement with in vitro kinesin assays (Yildiz et al, 2004), we detected some 8‐nm sizes within 161 displacements of the cargo; however, the majority of sizes were more substantial than 8 nm (Fig 1D and E). During 88% of imaging time, IFT particles did not move (Fig 1F); the large portion of dwelling time indicates that 3.4‐ms per frame imaging rate is not fast enough to follow each stepping behavior of IFT kinesins in vivo. The displacement of IFT particles must consist of multiple steps of IFT kinesins.
The transport paths revealed the sidestepping behavior of IFT particles along axoneme MTs in live animals. Figure 2A and B and Movie EV3 showed that the IFT particle deviated ~ 40 nm toward the right and then turned back to the left while moving from the ciliary base to the tip. The ~ 40 nm deviation is larger than the pixel size of 32.5 nm in our imaging step. As expected, we could directly detect the sidestepping from the original images (Fig 2A, yellow line, 10.2 ms), confirming the trajectories generated by the Gaussian fit (Fig 2B). This IFT particle may take sidesteps between two most lateral protofilaments of the doublet MT, whose diameter is about 45 nm. Importantly, a neighboring IFT particle (Fig 2A, green line) did not undergo an apparent off‐axis movement in the course of our imaging, making it a fiduciary marker to exclude motion artifacts from the failure of animal anesthetization or the microscopic stage drift.
Figure 2. Sidesteps of anterograde IFT particles.
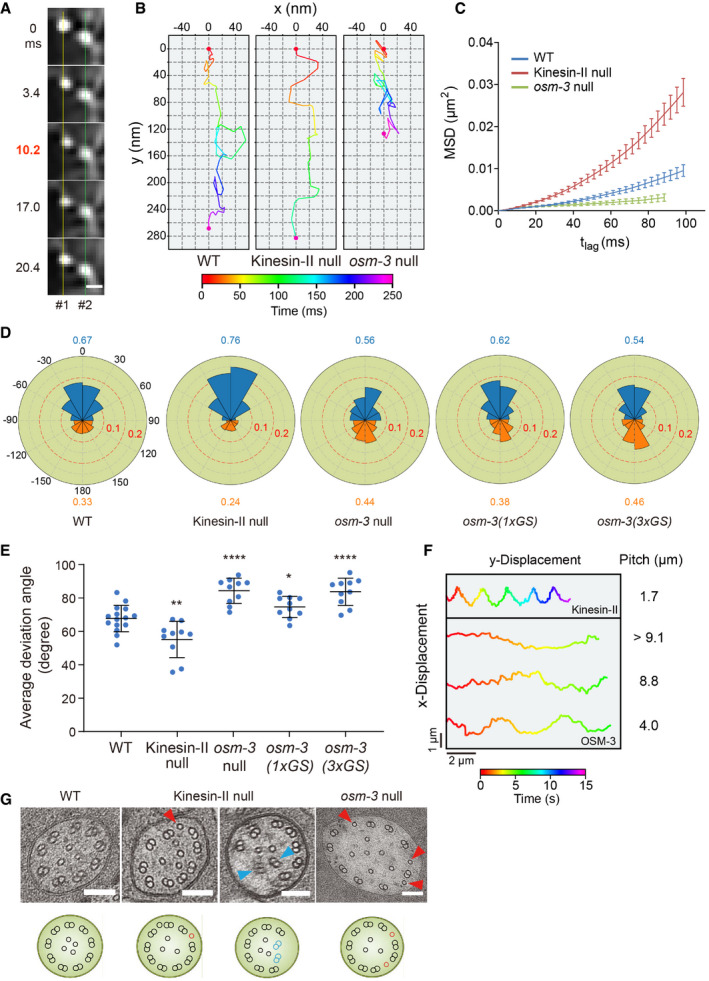
- Frame series shows the off‐axis movement of an IFT particle (#1). A neighboring particle (#2) serves as a fiduciary marker. Scale bar: 200 nm.
- Representative two‐dimensional IFT tracks from WT, kinesin‐II (klp‐11), and osm‐3 null animals. Red and violet circles indicate the start and end of the tracks, respectively. Proteins used for tracking experiments are CHE‐3 tagged with 7× GFP or DYF‐11 tagged with 3× GFP.
- Time‐averaged mean‐square displacement (MSD) versus lag time (t lag) of 10–15 tracks from WT and IFT kinesin mutant animals. Proteins used for tracking experiments are CHE‐3 tagged with 7× GFP, CHE‐3 tagged with 7× GFP plus DYF‐11 tagged with 3× GFP, CHE‐2 tagged with 7× GFP, or DYF‐11 tagged with 3× GFP. Error bars indicate standard errors.
- Angle histogram (rose plot) of the deviation angles of displacement in 10–15 tracks from WT and mutant animals. The deviation angle is defined as the angle between the displacement vector and the overall direction of motion. Deviation to the right or left of the overall direction is between 0° and 180° or between 0° and −180°, respectively. Deviations between 90°–180° and −90° to −180° are backstepping (orange). Proteins used for tracking experiments are the same as in Fig 1E.
- Average deviation angles in 10–15 tracks from WT and mutant animals. Comparisons were performed with the WT. Proteins used for tracking experiments are the same as in Fig 1E. *P < 0.05, **P < 0.01, ****P < 0.0001 by Student's t‐tests. Error bars indicate standard deviations.
- Representative tracks of the recombinant Caenorhabditis elegans kinesin‐II and OSM‐3‐kinesin moving along suspended MTs in the optical trap assay. Appendix Fig S3E depicts the experiment scheme.
- Representative TEM images of the middle ciliary segments from WT and IFT kinesin mutant animals. Red arrowheads indicate ectopic singlet microtubules. Blue arrowheads indicate ectopic doublet microtubules. The schematics below depict the phenotype of each image. Scale bars: 100 nm.
The anterograde IFT along the middle ciliary segment in C. elegans is driven by the coordinated action of a heterotrimeric kinesin‐II and a homodimeric OSM‐3‐kinesin in the kinesin‐2 family (Ou et al, 2005). To gain insights into how different motor proteins cooperate to generate sidesteps in vivo, we assayed IFT in the C. elegans mutant animals carrying putative null alleles of kinesin‐II (klp‐11[tm324]) or osm‐3(p802). In the absence of kinesin‐II, OSM‐3 alone moves the cargo and builds the full length of sensory cilia (Ou et al, 2005). Interestingly, sidesteps of IFT particles were significantly reduced compared with those in WT cilia (Fig 2B, middle, Movie EV4). In the absence of OSM‐3, kinesin‐II alone forms the middle ciliary segment (Ou et al, 2005), and in stark contrast to WT or kinesin‐II mutant cilia, sidesteps of IFT particles were much more pronounced (Fig 2B, right, Movie EV5). We performed the mean‐square displacement analysis of multiple trajectories. OSM‐3‐kinesin alone in kinesin‐II mutant cilia moved most directionally, whereas kinesin‐II alone in osm‐3 mutants moved at the least directional fashion. The combination of OSM‐3 and kinesin‐II in WT animals generated an intermediate directionality (Fig 2C). To better characterize the sidestepping behavior of IFT kinesins, we quantified the deviation of each trajectory from the overall direction of motion (Fig 2D). The average deviation angle of IFT particles in klp‐11 mutants is smaller than that of WT (Fig 2E), which indicates that IFT particles took less sidestepping in the absence of kinesin‐II. In contrast, IFT particles in osm‐3 mutant cilia underwent more sidestepping than WT, which supports the notion that kinesin‐II generates more sidestepping than OSM‐3‐kinesin. The deviation angles that are larger than 90° indicate backstepping, and IFT particles took more backstepping in osm‐3 mutant cilia but less backstepping in klp‐11 mutants than that in WT (Fig 2D and Appendix Fig S3D). These data are in agreement with IFT speeds that were previously determined using spinning disk confocal microscopy and kymography. In essence, kinesin‐II alone moves IFT cargo at 0.5 μm/s, OSM‐3 alone moves at 1.3 μm/s, and the cooperation of kinesin‐II and OSM‐3 generates an intermediate 0.7 μm/s speed in WT cilia (Ou et al, 2005).
The ability of motor proteins to take sidesteps itself would, in principle, give rise to torque because such movement can generate off‐axis force. As such, sidesteps can be used as a readout for torque generation even though torque is difficult to be directly measured in vivo. Notably, sidestepping will generate torque only if they occur in the same helical direction. If the motor is equally likely to step right or left, this will not lead to a net torque generation at the macroscopic scale. The different levels of sidesteps in WT and IFT kinesin mutant cilia (Fig 2A–E) suggest that kinesin‐II displays considerable torque, while OSM‐3‐kinesin moves torque less. In support of the in vivo observation (Fig 2A–E), recombinantly expressed kinesin‐II motor from C. elegans spiraled around a freely suspended MT with a characteristic pitch (Brunnbauer et al, 2012), which indicates that this motor exerts off‐axis force and thus would be able to generate torque during cargo transport. While the optical trapping experiments are useful to determine the helical directionality of the motors, the smooth helical movement of the bead is observed when many motor proteins carry the bead. Using the same optical tweezer setup (Appendix Fig S3E), we showed that kinesin‐II displayed a pronounced pitch (Fig 2F, upper panel, Movie EV6), which is consistent with our early results (Brunnbauer et al, 2012). However, OSM‐3‐kinesin appeared to take much less sidesteps and thus moved in the straighter fashion than kinesin‐II (Fig 2F, lower panel, Movie EV7). Therefore, these in vitro data correlate with our in vivo findings.
Perturbation of sidestepping affects axonemal ultrastructure and animal behavior
Why do kinesin‐II and OSM‐3 cooperate to produce an intermediate level of sidesteps in WT cilia? In the kinesin‐II mutants, OSM‐3‐kinesin builds up the full length of cilia, but sidesteps of IFT particles are significantly reduced (Fig 2B–E). We wondered whether the decrease of torque generation by kinesin‐II deletion might perturb the ciliary ultrastructure. To test this idea, we performed transmission electron microscopy (TEM) of high‐pressure frozen, freeze‐substituted WT and kinesin‐II mutant animals (Fig 2G). Our observation from serial sections confirmed that the kinesin‐II animals developed the distal and middle ciliary segments, as revealed by fluorescence microscopy (Appendix Fig S5A). Importantly, the organization of axonemal doublet microtubules was defective in klp‐11(tm324) mutant cilia. In the WT middle ciliary segments, nine doublets symmetrically distribute and surround a variable number of singlet microtubules (Fig 2G). However, four out of 19 examined cilia from three klp‐11(tm324) mutant animals only contained eight doublets on the periphery in the middle segments, and the last doublets spiraled into the axonemal lumen, revealing an impaired ninefold symmetry of axonemal MTs. Evans et al (2006) performed TEM analysis of kinesin‐II mutant cilia, but the perturbation of the axoneme organization was unknown. Inspired by our current observations, we revisited the TEM images in the early publication (Evans et al, 2006). We uncovered the same spiraling of a doublet MT into axoneme lumen in the middle ciliary segment of kap‐1 mutant, which deletes another subunit of heterotrimeric kinesin‐II (Appendix Fig S5B). Our TEM further confirmed the same doublet spiraling defect in kap‐1 mutant cilia (Appendix Fig S5C, 16 out of 43 cilia from four animals). These results show that the decrease of sidesteps of IFT particles by removal of a torque‐generating kinesin‐II disrupted ninefold symmetry of axoneme. Intriguingly, loss of kinesin‐II function in sea urchin embryos caused a similar inward collapse of outer doublet MTs (Appendix Fig S5D; Morris & Scholey, 1997), suggesting that inhibition of kinesin‐II led to a relatively widespread defect across species. We also found that the singlet MT abnormally appears between the doublet MTs in the kinesin‐II null in 2/19 micrographs. The frequency is less than the ectopic singlet insertion between doublets in osm‐3 null cilia (Fig 2G; 21 out of 27 cilia from three animals), which indicates that the doublet MT spiraling phenotype is caused by deleting kinesin‐II, whereas the ectopic singlet insertion is the primary defect by inhibiting OSM‐3‐kinesin.
To assess the more direct regulation of axoneme symmetry by torque generation of IFT kinesins, we sought to engineer an OSM‐3‐kinesin that takes increased sidesteps and, in turn, generates more torque. The early structural and optical trap studies show that the stability of kinesin's neck domain governs the torque‐generating properties, and the neck region but not the neck linker length determines the sidestepping behavior (Yildiz et al, 2008; Brunnbauer et al, 2012). Kinesin‐1 typically moves torque‐free along one protofilament of the MT. Insertion of flexible glycine–serine (GS) extensions between the neck linker and neck allows the motorheads to switch the protofilament and spiral around the MT (Brunnbauer et al, 2012). Using the same strategy, we inserted the flexible GS motif into the OSM‐3 neck domain. We first determined the adequate number of GS insertion by transgenesis in C. elegans. We transformed the plasmids expressing OSM‐3 that contain 1–5 copies of GS motifs into osm‐3(p802) null allele and assayed for the ciliary rescue effects (Appendix Figs S5E and F, and S6). The expression of WT osm‐3 gene rescued all the defects on the ciliary length, fluorescence dye uptake, and IFT speeds; however, OSM‐3 with five copies of GS repeats failed to recover, and three copies of GS inserts partially restored the ciliary phenotypes (Appendix Figs S5F and S6). Next, we used the genome editing technique to precisely insert one to three copies of GS motifs into the neck region of OSM‐3 in the WT genome (Fig 3A, Appendix Fig S7A). In support of the increase of torque generation of OSM‐3 from our design, the mean‐square displacement analysis of their transport paths showed that insertion of one or three GS motifs indeed caused IFT particles to move less directionally than that of WT (Fig 3B and C). One copy of GS insertion in OSM‐3‐kinesin did not significantly change the sidestepping behavior but increased backstepping, and three copies of GS insertion increased both sidestepping and backstepping of IFT particles (Fig 2D and E and Appendix Fig S3D). IFT slowed down in both the middle and distal ciliary segments, which is consistent with the observed increase of sidesteps (Fig 4A). While the GS insertions to OSM‐3 may increase its sidestepping, the inserts can also decrease the force output or forward rate of motion of OSM‐3 or both, these motility changes of which, rather than a change in sidestepping, could explain the decreased IFT in the distal ciliary segments. The GS inserts did not shorten the ciliary length even though IFT speeds were reduced, and an insertion of one copy GS did not cause any Dyf phenotype (Fig 4A–E), indicating that ciliary function is, at least, partially normal.
Figure 3. GS insertion of OSM‐3 increased sidestepping.
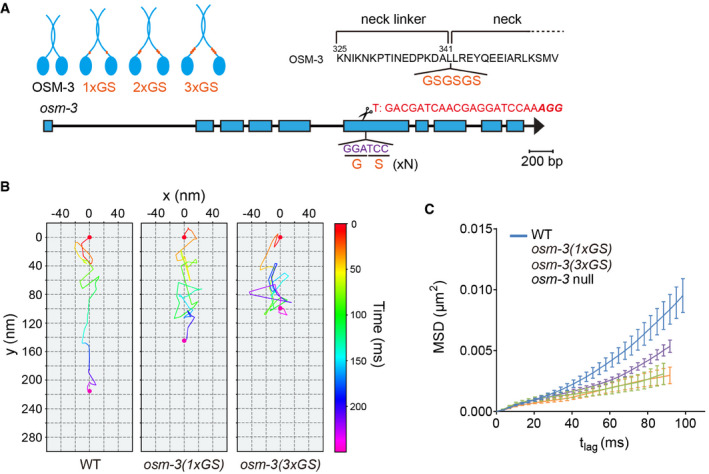
- Design of OSM‐3 constructs with flexible necks. Top, poly‐GS repeats (orange) were knocked into the endogenous osm‐3 locus. Bottom, schematic of osm‐3 gene model, and sgRNA sequence.
- Representative two‐dimensional IFT tracks from WT and OSM‐3(1 or 3xGS) animals. Red and violet circles indicate the start and end of the tracks, respectively. Proteins used for tracking experiments are the same as in Fig 1E.
- Time‐averaged mean‐square displacement (MSD) versus lag time (t lag) of 10–15 tracks from WT and mutant worms. Proteins used for tracking experiments are the same as in Fig 1E. Error bars indicate standard errors.
Figure 4. GS insertion of OSM‐3 reduced IFT speeds and perturbed ciliary ultrastructure.
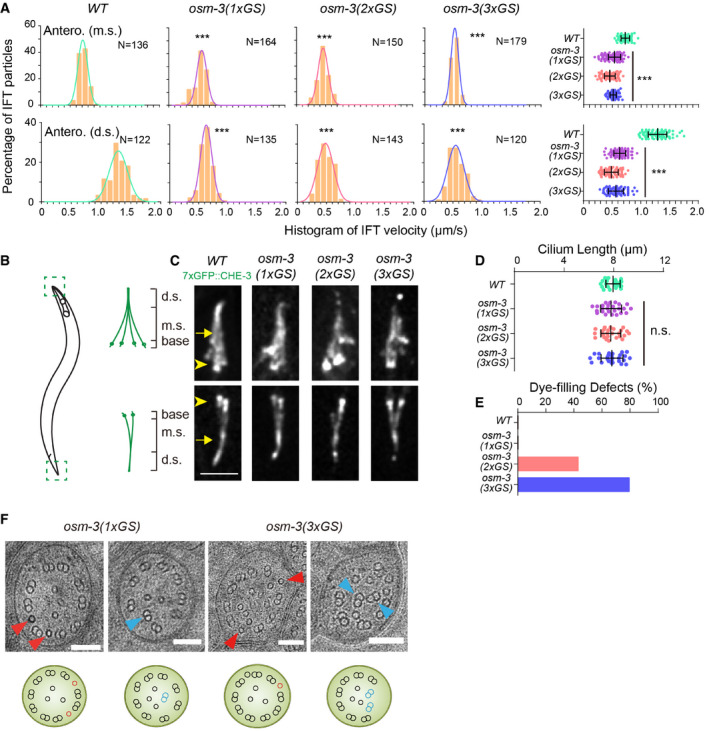
- Histogram of anterograde IFT speeds of 3xGFP::CHE‐3 at the middle (top) and distal (bottom) ciliary segments (top). The plots were fit by a Gaussian distribution. Comparisons were performed between the WT and osm‐3 mutants. ***P < 0.001 by Student's t‐tests. Error bars indicate standard errors.
- Schematic depiction of the Caenorhabditis elegans amphid and phasmid cilia. Each cilium contains a ciliary base, a middle segment (m.s.), and a distal segment (d.s.).
- Amphid (top) and phasmid (bottom) cilia in the WT and osm‐3 GS knock‐in animals. Cilia are marked with 7xGFP::CHE‐3. Arrowheads indicate the ciliary base. Arrows indicate the junctions between the middle and distal segments. Scale bars: 5 μm.
- Cilium length (mean ± SD) in WT and osm‐3 mutant animals. Comparisons were performed between the WT and osm‐3 mutants. N = 24–32. n.s., not significant by Student's t‐tests. Error bars indicate standard errors.
- Quantifications of dye‐filling defects from WT and osm‐3 mutant animals. N ≥ 100.
- Representative TEM images of the middle ciliary segments from osm‐3(1xGS) and osm‐3(3xGS) worms. Red arrowheads indicate ectopic singlet microtubules. Blue arrowheads indicate ectopic doublet microtubules. The schematics below depict the phenotype of each image. Scale bars: 100 nm.
We next performed TEM analysis of OSM‐3(1xGS, one copy of GS insertion) and OSM‐3(3xGS) cilia. We detected that the doublet MT spiraled into axoneme lumen from six out of 20 examined cilia from two OSM‐3(1xGS) or 14 out of 21 examined cilia from three OSM‐3(3xGS) mutant animals (Fig 4F), the phenotype of which is similar to structural defects in kinesin‐II mutant cilia (Fig 2G). We also uncovered that singlet MTs abnormally inserted between doublet MTs on the periphery of the axoneme in OSM‐3 carrying flexible GS inserts (Fig 4F). The singlet MTs also ectopically inserted into the doublet MTs of the remaining middle ciliary segments of osm‐3 null cilia (Fig 2G). The defective MT organization indicates that a synthetic increase of torque generation of OSM‐3‐kinesin disrupts ninefold symmetry of axoneme, phenocopying the symmetry perturbation in the reduction of sidestepping. Thus, an optimum level of sidestepping of IFT particles correlates to the ninefold symmetry of axoneme.
We determined whether the abnormal sidestepping behavior of IFT kinesins affects ciliary function. The C. elegans sensory cilia perceive the environmental cues and control animal behaviors such as osmotic avoidance (Osm) or chemotaxis (Che). In the Osm behavior assay, the majority of WT animals stayed away from the osmotic stress, and less than 10% of them failed to avoid; however, 31% of 1xGS or 31% of 2xGS or 43% of 3xGS OSM‐3 insertion animals ectopically escaped from the stress (Appendix Fig S7C). While the penetrance of their Osm defects was lower than that of osm‐3 null animals (76%), the insertion of GS motifs markedly reduced the animals’ capacity to avoid the osmotic stress. The deletion of kinesin‐II (klp‐11) but not osm‐3 mutations reduced the animals’ chemotaxis to acetone (Appendix Fig S7D), which suggests that the perturbation of sidestepping of IFT particles may affect the functionality of sensory cilia.
Discussion
This study followed the motility of GFP‐tagged IFT cargo molecules, which is quite a distance from the motorheads. The behavior of the IFT particle does not necessarily reflect the stepping behavior of IFT kinesins. The motility of IFT cargo is likely to be influenced by other factors, such as the alterations of the obstacles or posttranslational modifications on microtubule tracks in kinesin‐II or osm‐3 mutant cilia. The molecular identities of the obstacles on C. elegans axonemes are unclear, whereas the polyglutamylation is a common posttranslational modification on axonemal MTs and regulates the motility of kinesins (Sirajuddin et al, 2014). Our immunofluorescence did not detect a noticeable difference of polyglutamylation between WT and osm‐3 mutant cilia (Appendix Fig S7B). However, we cannot exclude the possibility that perturbations of other microtubule posttranslational modifications may affect the motility of IFT kinesins.
To explore the physiological importance of the sidestepping behavior of IFT kinesins, we deleted the torque‐generating kinesin‐II for less sidestepping or engineered a flexible neck of OSM‐3 for more sidestepping of IFT particles. Both perturbations permit cilium assembly to the regular length, but the ninefold symmetry of axonemes and chemosensory capability of cilia are affected. While the cilium length is a widespread parameter to measure the quality of cilium formation, the ciliary ultrastructure and functionality are equally important to define the fidelity of this organelle. We suggest that proper axoneme symmetry and animal chemosensory behavior may require a defined motor torque balance during anterograde IFT along the sensory cilium.
Three‐dimensional electron micrographs of primary mouse cilia showed that doublet MTs spiraled into the axoneme (Sun et al, 2019), which was ultra‐structurally similar to those of the C. elegans kinesin‐II mutant cilia. Interestingly, the prior optical trap study reported that mouse kinesin‐II generated less sidestepping than C. elegans kinesin‐II (Brunnbauer et al, 2012). The observations indicate that a low level of mouse kinesin‐II sidestepping correlates with a spiraling of axonemal microtubules in mouse cilia, mirroring the C. elegans kinesin‐II mutant cilia (Fig 2B and G). These results also demonstrate the diversity of kinesin‐II stepping behavior and ciliary structure across species.
How may the torque balance of IFT kinesins safeguard ciliogenesis? In general, the crowed MT‐associated proteins and cargo molecules moving by different types of motor proteins act as the roadblock for intracellular transport, and torque generation enables the motors to avoid obstacles by switching protofilaments. This model may not account for IFT kinesins because the deletion of the torque‐ generating kinesin‐II does not cause traffic jams but instead speeds up IFT. Alternatively, torque generation may allow IFT particles to move around multiple doublet MTs such that IFT kinesins may deposit cargo molecules evenly in the axoneme, facilitating the organization of doublet MTs into ninefold symmetry. Ciliary functionality requires constant transportation of axonemal components and ciliary receptor proteins. Too many sidesteps generated by GS insertion of OSM‐3 slow down IFT (Fig 4A and Appendix Fig S6A), which may affect ciliary functionality by reducing the dynamic turnover of membrane receptors and axoneme. Therefore, the balanced torque generation of motor proteins can regulate the fidelity of the organelles or biological processes that require a robust transport system. Analogously, two Drosophila myosin proteins Myo1D and Myo1C determined organismal chirality in an antagonistic manner, in which Myo1D generated counterclockwise motility of actin filaments, whereas Myo1C canceled the circular movement (Lebreton et al, 2018).
Materials and Methods
Caenorhabditis elegans strains and genetics
Caenorhabditis elegans strains were raised on NGM plates seeded with Escherichia coli strain OP50 at 20°C. Appendix Tables S1–S3 summarize the primers, plasmids, and strains used in this study.
Molecular biology for the generation of knock‐in or transgenic animals
CRISPR‐Cas9 targets were inserted to the pDD162 vector (Addgene #47549) by linearizing this vector with primers listed in the Appendix Table S1. The resulting PCR products containing 15 base pairs (bp) overlapped double‐strand DNA ends were treated with DpnI digestion overnight and transformed into E. coli. The linearized PCR products were cyclized to generate plasmids by spontaneous recombination in bacteria. For fluorescence tag knock‐in (KI), homology recombination (HR) templates were constructed by cloning the 2 kb 5′ and 3′ homology arms into pPD95.77 plasmids using In‐Fusion Advantage PCR cloning kit (Clontech, Palo Alto, CA, USA, Cat. # 639621). We used the CRISPR design tool (http://crispr.mit.edu) to select the target sequence. GFP, 3xGFP, and GFP11x7 tags were added to the C‐terminus of CHE‐3, whereas CHE‐2 and DYF‐11 were N‐terminal‐tagged. For flexible GS motif KI, GS sequences were inserted into the region between the neck linker and neck of OSM‐3. The knock‐in strains were confirmed by PCR and Sanger sequencing.
Pdyf‐1::osm‐3 constructs were generated using a PCR fusion‐based approach by placing a 454 bp ciliated neuron‐specific promoter of dyf‐1 adjacent to the cDNA fragment of osm‐3 and unc‐54 3′ UTR amplified from the C. elegans genomic DNA. GS sequences were inserted between the neck linker and the neck of OSM‐3 by linearizing Pdyf‐1::osm‐3 constructs with primers listed in Appendix Table S2. Transgenic lines carrying extrachromosomal arrays of the osm‐3 expression constructs were generated by germline transformation with the marker rol‐6 into WT or homozygous osm‐3(p802) mutant animals.
Live‐cell imaging
Young adult worms were anesthetized with 0.1 mmol/l levamisole in M9 buffer and mounted on 3% agarose pads at 20°C. Hessian‐SIM live‐cell imaging and image processing were performed as described before (Huang et al, 2018). In brief, images were acquired by 2D‐SIM with a 488‐nm laser in the 88 nm X‐Y resolution. We applied a frame rate of 24 or 97 Hz in live SIM imaging. Using rolling reconstruction, we increased the raw data acquisition rate to 291 Hz (with exposure and transition times of 0.5 and 0.62 ms, respectively). For spinning disk confocal imaging system, live‐cell imaging was performed on an Axio Observer Z1 microscope (Carl Zeiss, Oberkochen, Germany) equipped with a 100×, 1.49 numerical aperture (NA) objective, an electron‐multiplying (EM) charge‐coupled device (CCD) camera (Andor iXon+ DU‐897D‐C00‐#BV‐500), and the 488 nm line of a Sapphire CW CDRH USB Laser System attached to a spinning disk confocal scan head (Yokogawa CSU‐X1 Spinning Disk Unit). Time‐lapse images were acquired by μManager (https://www.micro-manager.org) at an exposure time of 200 ms.
Hessian matrices
Hessian matrix is denoted as the second‐order partial derivative along the xyt axis in our SIM reconstruction:
| (1) |
where f is the SIM images to be reconstructed, and σ is a parameter that is introduced to enforce the continuity of structures along the t axis. Employing this matrix, Hessian‐SIM could attain artifact‐minimized SR images at low signal intensities (Huang et al, 2018).
Protein preparation and optical tweezers setup
The C. elegans kinesin‐II and OSM‐3‐kinesin were expressed and purified as described previously (Brunnbauer et al, 2012; Mohamed et al, 2018). The setup of the optical tweezers was described (Brunnbauer et al, 2010; Gebhardt et al, 2010). The trapping laser is split into two beams with orthogonal polarization. One of the beams was passed through an AOD. The position control of the AOD by a DSP‐board allowed the rapid timesharing of this beam between two positions to generate the two steerable trapping potentials used to capture the pillar beads. The beads were monitored using a custom‐built, integrated, inverted microscope. Bright‐field images of the beads were recorded at a frame rate of 40 ms (Brunnbauer et al, 2012).
Single‐particle localization
For IFT particle localization, a single particle was chosen by hand, and an about 10 × 16 pixel image surrounding the particle was analyzed by a custom MATLAB program through 2D Gaussian fitting algorithm to obtain precise centroid position of the particle (Appendix Fig S3A; Yildiz et al, 2003, 2004). The resulting traces (x‐y coordinates of the particle in consecutive frames) plus time information were then plotted to reveal the track of the IFT movement. The step size and time were determined visually from the resulting trace when the displacement took a sudden change (Yildiz et al, 2003). Time‐averaged mean‐square displacement (MSD) curves were calculated according to the method that was described previously (Manzo & Garcia‐Parajo, 2015). The track sets used for MSD calculation are the following: 15 tracks in WT cilia including nine from 7xGFP::CHE‐3, four from CHE‐2::7xGFP, and two from 7xGFP::CHE‐3; DYF‐11::3xGFP; 10 tracks from kinesin‐II (klp‐11[tm324]) mutant cilia including eight from 7xGFP::CHE‐3 and two from DYF‐11::3xGFP; 10 tracks from osm‐3(p802) mutant cilia including one from 7xGFP::CHE‐3 and nine from DYF‐11::3xGFP; ten tracks from osm‐3(1xGS) mutant cilia including seven from 7xGFP::CHE‐3 and three from CHE‐2::7xGFP; and ten tracks of 7xGFP::CHE‐3 from osm‐3(3xGS) mutant cilia.
Transmission electron microscopy
Caenorhabditis elegans were loaded onto a 50 μm deep specimen carrier with a pipette and frozen with Leica EM HPM100 high‐pressure freezing system. Carriers were then transferred into a microcentrifuge tube containing 1 ml fixative (acetone solution of 1% osmium tetroxide and 0.1% uranyl acetate) under liquid nitrogen. The tubes were placed in Leica EM AFS2 machine and processed using a standard substitution and fixation program: −90°C for 48 h, −60°C for 24 h, −30°C for 18 h, and finally to 4°C. Fixed specimens were washed three times with pure acetone and infiltrated with SPI‐PON 812 resin. They were embedded in a flat mold and polymerized at 60°C. 90‐nm ultrathin sections were obtained with Leica EM UC7 Ultramicrotome and picked on 200 mesh copper grids. Sections were post‐stained with 2% uranyl acetate and Reynold's lead citrate and imaged on FEI Tecnai G2 Spirit (120 kV) electron microscope.
Dye‐filling assay
Young adult worms were randomly collected into 200 μl M9 solution and mixed with equal volume dyes (DiI, 1,1′‐dioctadecyl‐3,3,3′,3′,‐tetramethylindo‐carbocyanine perchlorate; Sigma‐Aldrich, St. Louis, MO, USA) at working concentration (20 μg/ml), followed by incubation at room temperature in the dark for 30 min. Worms were transferred to seeded NGM plates and examined for dye uptake 1 h later using a fluorescence stereoscope. At least 100 worms of each strain were tested in two independent assays.
Osmotic avoidance assay
The procedures were performed as described before (Culotti & Russell, 1978; Masyukova et al, 2016). An osmotic ring (1 cm in diameter) was created in the center of the plates by adding 30 μl 4 mol/l NaCl onto the surface of the agar. NaCl was allowed to soak into agar less than 5 min. Worms growing on NGM plates were washed three times with M9 and once with deionized water. Thirty worms were transferred to the center of the osmotic ring in each parallel experiment. When worms began to move, the timing of the trial started. Worms that were in the annular ring or beyond were scored as non‐avoiders and counted as a fraction of the total.
Chemotaxis assays
The chemotaxis procedures were performed as described previously (Bargmann et al, 1993; Evans et al, 2006). Two points were marked at opposite ends of the 85‐mm round plate (5 mm from the edge), to which 1 μl of 1 mol/l NaN3 (anesthetic) was applied. A total of 1 μl of acetone (diluted 1:100 in 95% ethanol) was spotted at one of these points, and 1 μl of ethanol was placed at the other point as a control. Young adult worms were washed three times with M9 buffer and once with deionized water, and then 20–40 animals were placed onto the center of the plate. After 50 min, the worms located at attractant and counter‐attractant were counted. The chemotaxis index was defined as: number of worms at attractant − number of worms at counter‐attractant/total number of worms (Peckol et al, 1999). Assays were repeated three times.
Quantifications and statistical analysis
We used the ImageJ software to measure cilium length and IFT speed following the published protocol (Jia et al, 2019). ImageJ software was used to circumscribe the fluorescence field and to measure the fluorescence intensity. We used the two‐tailed Student's t‐test analysis to determine the statistical differences, as indicated in figure legends.
Immunofluorescence imaging
For immunofluorescence imaging, we fixed young adult animals (strains GOU2356, GOU3422, GOU3424, GOU4093, and GOU4095). Worms growing on NGM plates were washed three times with M9 buffer. After incubation in 200 μl SDS‐DTT buffer (20 mM HEPES, 0.25% SDS, 200 mM DTT, 3% sucrose) at room temperature for 5 min, worms were fixed on slides with poly‐lysine (Sigma, Cat. #RABG2201). The samples were immersed in liquid nitrogen for 5 min before incubating in ice‐cold absolute methanol for 15 min. Worms were then washed once with PBS buffer (pH 7.4) and permeabilized in PBST (0.05% Tween 20) for 15 min. Worms were then blocked with the antibody buffer (1× PBS, 0.05% Tween 20, 1% BSA) for 30 min at room temperature. Then, animals were incubated with a 1:500 dilution (in the antibody buffer) of primary antibody (Adipogen, Cat. #AG‐20B‐0020‐C100) for 2 h at room temperature. After washing three times with PBS buffer (PH 7.4), Alexa 549‐conjugated goat anti‐mouse secondary antibodies (Abbkine, Cat. #A23310‐1) were added at a dilution of 1:5,000 and incubated for 1 h at room temperature. Worms were then washed three times with PBS buffer (pH 7.4) before sealed with a cover glass.
Author contributions
Conceptualization: GO, LC, and ZÖ. Data curation: CX, LL, ML, WS, QZ, XH, RC, and MB. Formal analysis: CX, LL, ML, WS, QZ, XH, RC, and MB. Funding acquisition: LC, ZÖ, WL, and GO. Investigation: CX, LL, ML, WS, QZ, XH, RC, and MB. Methodology: GO, LC, and ZÖ. Project administration: GO, LC, and ZÖ. Supervision: GO, LC, and ZÖ. Writing—original draft: GO. Writing—review & editing: GO, LC, and ZÖ.
Conflict of interest
The authors declare that they have no conflict of interest.
Supporting information
Appendix
Movie EV1
Movie EV2
Movie EV3
Movie EV4
Movie EV5
Movie EV6
Movie EV7
Review Process File
Acknowledgements
We thank Drs. J. Raff, A. Yildiz, J. Scholey, and R. Vale for discussion. This work was supported by the National Natural Science Foundation of China (grants 31991191, 31730052, 31525015 and 31561130153, 31671444, 31871352), the National Key R&D Program of China (2017YFA0102900), Beijing Municipal Natural Science Foundation (5172015), and the Newton Advanced Fellowship from the Royal Society.
EMBO Journal (2020) 39: e103955
Contributor Information
Liangyi Chen, Email: lychen@pku.edu.cn.
Guangshuo Ou, Email: guangshuoou@tsinghua.edu.cn.
Data availability
All data are available in the main text or the supplementary materials.
References
- Bargmann CI, Hartwieg E, Horvitz HR (1993) Odorant‐selective genes and neurons mediate olfaction in C. elegans . Cell 74: 515–527 [DOI] [PubMed] [Google Scholar]
- Beausang JF, Schroeder HW III, Nelson PC, Goldman YE (2008) Twirling of actin by myosins II and V observed via polarized TIRF in a modified gliding assay. Biophys J 95: 5820–5831 [DOI] [PMC free article] [PubMed] [Google Scholar]
- Breslow DK, Holland AJ (2019) Mechanism and regulation of centriole and cilium biogenesis. Annu Rev Biochem 88: 691–724 [DOI] [PMC free article] [PubMed] [Google Scholar]
- Brunnbauer M, Mueller‐Planitz F, Kosem S, Ho TH, Dombi R, Gebhardt JC, Rief M, Okten Z (2010) Regulation of a heterodimeric kinesin‐2 through an unprocessive motor domain that is turned processive by its partner. Proc Natl Acad Sci USA 107: 10460–10465 [DOI] [PMC free article] [PubMed] [Google Scholar]
- Brunnbauer M, Dombi R, Ho TH, Schliwa M, Rief M, Okten Z (2012) Torque generation of kinesin motors is governed by the stability of the neck domain. Mol Cell 46: 147–158 [DOI] [PubMed] [Google Scholar]
- Can S, Dewitt MA, Yildiz A (2014) Bidirectional helical motility of cytoplasmic dynein around microtubules. Elife 3: e03205 [DOI] [PMC free article] [PubMed] [Google Scholar]
- Culotti JG, Russell RL (1978) Osmotic avoidance defective mutants of the nematode Caenorhabditis elegans . Genetics 90: 243–256 [DOI] [PMC free article] [PubMed] [Google Scholar]
- Evans JE, Snow JJ, Gunnarson AL, Ou G, Stahlberg H, McDonald KL, Scholey JM (2006) Functional modulation of IFT kinesins extends the sensory repertoire of ciliated neurons in Caenorhabditis elegans . J Cell Biol 172: 663–669 [DOI] [PMC free article] [PubMed] [Google Scholar]
- Ferro LS, Can S, Turner MA, ElShenawy MM, Yildiz A (2019) Kinesin and dynein use distinct mechanisms to bypass obstacles. Elife 8: e48629 [DOI] [PMC free article] [PubMed] [Google Scholar]
- Gebhardt JC, Bornschlogl T, Rief M (2010) Full distance‐resolved folding energy landscape of one single protein molecule. Proc Natl Acad Sci USA 107: 2013–2018 [DOI] [PMC free article] [PubMed] [Google Scholar]
- Hartman MA, Finan D, Sivaramakrishnan S, Spudich JA (2011) Principles of unconventional myosin function and targeting. Annu Rev Cell Dev Biol 27: 133–155 [DOI] [PMC free article] [PubMed] [Google Scholar]
- Huang X, Fan J, Li L, Liu H, Wu R, Wu Y, Wei L, Mao H, Lal A, Xi P et al (2018) Fast, long‐term, super‐resolution imaging with Hessian structured illumination microscopy. Nat Biotechnol 36: 451–459 [DOI] [PubMed] [Google Scholar]
- Inglis PN, Ou G, Leroux MR, Scholey JM (2007) The sensory cilia of Caenorhabditis elegans .WormBook: 1–22 [DOI] [PMC free article] [PubMed] [Google Scholar]
- Jia R, Li D, Li M, Chai Y, Liu Y, Xie Z, Shao W, Xie C, Li L, Huang X et al (2019) Spectrin‐based membrane skeleton supports ciliogenesis. PLoS Biol 17: e3000369 [DOI] [PMC free article] [PubMed] [Google Scholar]
- Kalafut B, Visscher K (2008) An objective, model‐independent method for detection of non‐uniform steps in noisy signals. Comput Phys Commun 179: 716–723 [Google Scholar]
- Kamiyama D, Sekine S, Barsi‐Rhyne B, Hu J, Chen BH, Gilbert LA, Ishikawa H, Leonetti MD, Marshall WF, Weissman JS et al (2016) Versatile protein tagging in cells with split fluorescent protein. Nat Commun 7: 11046 [DOI] [PMC free article] [PubMed] [Google Scholar]
- Khan S, Scholey JM (2018) Assembly, functions and evolution of archaella, flagella and cilia. Curr Biol 28: R278–R292 [DOI] [PubMed] [Google Scholar]
- Lebreton G, Geminard C, Lapraz F, Pyrpassopoulos S, Cerezo D, Speder P, Ostap EM, Noselli S (2018) Molecular to organismal chirality is induced by the conserved myosin 1D. Science 362: 949–952 [DOI] [PMC free article] [PubMed] [Google Scholar]
- Manzo C, Garcia‐Parajo MF (2015) A review of progress in single particle tracking: from methods to biophysical insights. Rep Prog Phys 78: 124601 [DOI] [PubMed] [Google Scholar]
- Masyukova SV, Landis DE, Henke SJ, Williams CL, Pieczynski JN, Roszczynialski KN, Covington JE, Malarkey EB, Yoder BK (2016) A screen for modifiers of cilia phenotypes reveals novel MKS alleles and uncovers a specific genetic interaction between osm‐3 and nphp‐4. PLoS Genet 12: e1005841 [DOI] [PMC free article] [PubMed] [Google Scholar]
- Mohamed MAA, Stepp WL, Okten Z (2018) Reconstitution reveals motor activation for intraflagellar transport. Nature 557: 387–391 [DOI] [PMC free article] [PubMed] [Google Scholar]
- Morris RL, Scholey JM (1997) Heterotrimeric kinesin‐II is required for the assembly of motile 9 + 2 ciliary axonemes on sea urchin embryos. J Cell Biol 138: 1009–1022 [DOI] [PMC free article] [PubMed] [Google Scholar]
- Nishizaka T, Yagi T, Tanaka Y, Ishiwata S (1993) Right‐handed rotation of an actin filament in an in vitro motile system. Nature 361: 269–271 [DOI] [PubMed] [Google Scholar]
- Ou G, Blacque OE, Snow JJ, Leroux MR, Scholey JM (2005) Functional coordination of intraflagellar transport motors. Nature 436: 583–587 [DOI] [PubMed] [Google Scholar]
- Peckol EL, Zallen JA, Yarrow JC, Bargmann CI (1999) Sensory activity affects sensory axon development in C. elegans . Development 126: 1891–1902 [DOI] [PubMed] [Google Scholar]
- Perkins LA, Hedgecock EM, Thomson JN, Culotti JG (1986) Mutant sensory cilia in the nematode Caenorhabditis elegans . Dev Biol 117: 456–487 [DOI] [PubMed] [Google Scholar]
- Reck‐Peterson SL, Redwine WB, Vale RD, Carter AP (2018) The cytoplasmic dynein transport machinery and its many cargoes. Nat Rev Mol Cell Biol 19: 382–398 [DOI] [PMC free article] [PubMed] [Google Scholar]
- Reiter JF, Leroux MR (2017) Genes and molecular pathways underpinning ciliopathies. Nat Rev Mol Cell Biol 18: 533–547 [DOI] [PMC free article] [PubMed] [Google Scholar]
- Ricca BL, Rock RS (2010) The stepping pattern of myosin X is adapted for processive motility on bundled actin. Biophys J 99: 1818–1826 [DOI] [PMC free article] [PubMed] [Google Scholar]
- Scholey JM (2013) Kinesin‐2: a family of heterotrimeric and homodimeric motors with diverse intracellular transport functions. Annu Rev Cell Dev Biol 29: 443–469 [DOI] [PubMed] [Google Scholar]
- Sirajuddin M, Rice LM, Vale RD (2014) Regulation of microtubule motors by tubulin isotypes and post‐translational modifications. Nat Cell Biol 16: 335–344 [DOI] [PMC free article] [PubMed] [Google Scholar]
- Sun S, Fisher RL, Bowser SS, Pentecost BT, Sui H (2019) Three‐dimensional architecture of epithelial primary cilia. Proc Natl Acad Sci USA 116: 9370–9379 [DOI] [PMC free article] [PubMed] [Google Scholar]
- Sweeney HL, Holzbaur ELF (2018) Motor proteins. Cold Spring Harb Perspect Biol 10: a021931 [DOI] [PMC free article] [PubMed] [Google Scholar]
- Taschner M, Lorentzen E (2016) The intraflagellar transport machinery. Cold Spring Harb Perspect Biol 8: a028092 [DOI] [PMC free article] [PubMed] [Google Scholar]
- Vale RD, Toyoshima YY (1988) Rotation and translocation of microtubules in vitro induced by dyneins from Tetrahymena cilia. Cell 52: 459–469 [DOI] [PubMed] [Google Scholar]
- Yajima J, Cross RA (2005) A torque component in the kinesin‐1 power stroke. Nat Chem Biol 1: 338–341 [DOI] [PubMed] [Google Scholar]
- Yajima J, Mizutani K, Nishizaka T (2008) A torque component present in mitotic kinesin Eg5 revealed by three‐dimensional tracking. Nat Struct Mol Biol 15: 1119–1121 [DOI] [PubMed] [Google Scholar]
- Yildiz A, Forkey JN, McKinney SA, Ha T, Goldman YE, Selvin PR (2003) Myosin V walks hand‐over‐hand: single fluorophore imaging with 1.5‐nm localization. Science 300: 2061–2065 [DOI] [PubMed] [Google Scholar]
- Yildiz A, Tomishige M, Vale RD, Selvin PR (2004) Kinesin walks hand‐over‐hand. Science 303: 676–678 [DOI] [PubMed] [Google Scholar]
- Yildiz A, Tomishige M, Gennerich A, Vale RD (2008) Intramolecular strain coordinates kinesin stepping behavior along microtubules. Cell 134: 1030–1041 [DOI] [PMC free article] [PubMed] [Google Scholar]
Associated Data
This section collects any data citations, data availability statements, or supplementary materials included in this article.
Supplementary Materials
Appendix
Movie EV1
Movie EV2
Movie EV3
Movie EV4
Movie EV5
Movie EV6
Movie EV7
Review Process File
Data Availability Statement
All data are available in the main text or the supplementary materials.