Abstract
Objective
The objective of this study was to describe in life methods by which osteoarthritis can be staged in order to time therapeutic interventions that are relevant to osteoarthritis (OA) clinical trials
Methods
Twenty-two sheep underwent arthroscopic meniscal destabilization to induce OA. Serial computed tomography (CT) imaging and arthroscopy were used to monitor osteoarthritis progression at 3-month intervals over 9 months. Eleven sheep received 1 intra-articular injection of hyaluronate 3 months after OA induction and another group of 11 received saline. A linear mixed model was used to define the trajectory of shape change in the medial joint compartment. Ordinal logistic regression was used to investigate the association between morphological changes and sclerosis.
Results
Three months after meniscal destabilization there were early bipolar chondral lesions in the medial compartment of the knee, as well as osteophytes and bone remodeling. Superficial fissures and cartilage cracks progressed to discrete areas of cartilage thinning and fibrillation on the medial tibial plateau by 6 months that became cartilage erosions by nine months. A linear mixed effect model demonstrated significant change in medial compartment length and width with over time (P < 0.05) for both groups. A significant association between severity of sclerosis and medial compartment morphology was also observed.
Conclusions
The induction of osteoarthritic lesions with meniscal release model can be followed using noninvasive and minimally invasive procedures allowing for real-time decisions about redosing therapies, or other changes such as extending trial timelines without sacrificing animals to conduct assessments.
Keywords: trajectory, osteoarthritis, intervention, animal model
Introduction
The sheep has been a useful species in which to study osteoarthritis (OA) therapies but timing of treatment and staging of the disease can be challenging in any animal model. Since meniscal injury is strongly correlated with knee OA progression in patients, the meniscal destabilization model is used in laboratory animals1 and larger species such as the dog.2 Loss of meniscal load sharing creates a biomechanical overload in the medial compartment leading to highly reproducible chondral defects, osteophytes, bone remodeling, and synovitis. One drawback to meniscal release models in large animal species is the need for an arthrotomy. Orth and Madry3 have suggested alternative approaches to reduce the morbidity and confounding effects of arthrotomy incisions in sheep and goats. In these species, disruption of the periarticular retinaculum creates abnormal patellofemoral tracking leading to periarticular osteophytes, delayed healing and synovitis. Cake et al.4 described 3 arthrotomy methods by which the load sharing capacity of the meniscus was reduced and came to the conclusion that all methods created fissures and focal erosions in the medial compartment while sparing the lateral compartment. Diagnostic arthroscopy in the sheep knee has been assessed in normal5,6 and postmeniscectomy sheep knees.6
In life, assessments to characterize OA progression include ultrasonography, radiographs, computed tomography (CT), and magnetic resonance imaging (MRI) scans. Three-dimensional imaging is widely used to follow the development of chondropenia in the human knee using scoring system7-10 but owing to the thin (1 mm thick) articular cartilage in species such as sheep and dog, quantitative in vivo MRI is challenging. Some cartilage and meniscus repair studies have used this MRI to assess cartilage fill and surface continuity when combined with postmortem assessments in the sheep,11 but even at 3-T field strength, the predictive value of MRI is questionable in locations where the cartilage is thin such as the talar dome of human patients.12
Though patients usually enter clinical trials with grade 2 to 3 Kellgren-Lawrence OA, animal model systems seldom use this as a starting point for OA therapy. Interventions often begin immediately or soon after induction. This preventative timing of therapy has questionable translational value, particularly for patients who have no known injury or risk factor, yet their OA progression continues slowly and insidiously. One problem in animal models can be establishing the OA stage without pilot studies that sacrifice animals to validate the rate of progression. Small changes in animal care, genetics, and size can create unwelcome variability in progression rate.13,14 In this study, we describe methods for staging osteoarthritis in a large animal species by serial use of second look arthroscopy and CT imaging. This provides insights for researchers who plan interventions at clinically relevant time points and demonstrates the nonlinear rate of OA progression.
Materials and Methods
All procedures were approved an institutional animal care committee operating under the guidelines of the National Council on Animal Care. Twenty-two adult female Texel cross sheep 2 to 5 years old were allocated by body mass to 2 groups (n = 11) of 56 ± 7 kg weight. Sheep were housed in groups of 5 or 6 in large 6 × 10 m pens that allowed socialization and movement. Temperature was controlled between 15°C and 25°C and ambient light was provided through large transparent doors comprising the entire south wall of the pens. Mixed alfalfa grass hay was fed and an analysis for copper and other macro- and micronutrients was conducted on this forage. Water was supplied from an on-site well that was tested for microbiological pathogens yearly. All sheep underwent general health and specific musculoskeletal examinations, were sheared, and then conditioned for 4 weeks.
Clinical lameness was also scored weekly by trained observers where 0 was normal and 1 indicated mild intermittent reduction in weightbearing, while 2 was a consistent reduction in weightbearing with transfer of weight to the forelimbs and 3 was partial (toe only) and grade 4 was nonweightbearing on the affected limb.
On day 0, all sheep were anesthetized using diazepam (0.3 mg/kg) and ketamine (7.5 mg/kg) followed by endotracheal intubation and isoflurane general anesthesia. They were placed in dorsal recumbency for CT imaging of both knee joints (GE Brightspeed Elite, 16 slice, 0.625 mm isotropic voxels) was conducted. The sheep were transferred to the surgery for aseptic skin preparation of one knee (stifle) joint. A lateral arthroscope portal and medial instrument portal were used to gain access to the medial femorotibial joint compartment. After insertion of a 2.5 mm diameter arthroscope (Arthrex Vet Systems, Naples, FL, USA) the medial compartment was inspected. Careful valgus stress and elevation of the meniscus with a hooked probe was used to assist in visualization of the cartilage surfaces and menisci.5,15 A standardized reporting form used to record the ICRS (International Cartilage Repair Society) cartilage defect grade for the medial condyle and tibial plateau joint surfaces. Video and still image recordings were made as part of the medical record. The global Outerbridge score,16 osteophytes, and synovitis were also scored. Osteophytes were absent = 0, small/round = 1, moderate with early perichondrial vascularization = 2, and 3 = large with marked vascularization. Synovitis was scored using a system adopted from the dog,17 which included synovial frond hypertrophy, vascularity, hyperplasia, and abnormal shape.
To release the medial meniscus a retrograde knife was used to cut the anterior meniscotibial ligament and the abaxial capsular attachments of the meniscus to just along the anterior horn and body to the medial collateral ligament ( Fig. 1 ). A hooked probe was used to confirm that the meniscus could be prolapsed into the medial gutter and little or no meniscal load sharing was possible. All sheep were recovered from anesthesia and maintained in small 3 × 4 m pens for 48 hours and then returned to their original larger pens for the duration of the experiment. Clinical evaluations for lameness, joint effusion and periarticular enlargement continued weekly throughout the study. Three months after meniscal release all sheep underwent CT imaging and three of the 11 sheep in each group had second look arthroscopy. The first group of 11 animals received an intra-articular injection of sodium hyaluronate (High Hyalplus injectable, 10 mg, Humedix, Korea) and the second group received an equal volume of sterile physiological saline. Three sheep from each group were randomly assigned to have diagnostic arthroscopy at 3-month intervals through an anterior lateral portal. Video recordings were made and scored using the ICRS cartilage injury classification system (https://www.secot.es/uploads/descargas/formacion/escalas_valoracion/ICRS._TRAUMA_CARTaILAGO.pdf) with special attention to the extent and location of developing chondral defects.
Figure 1.
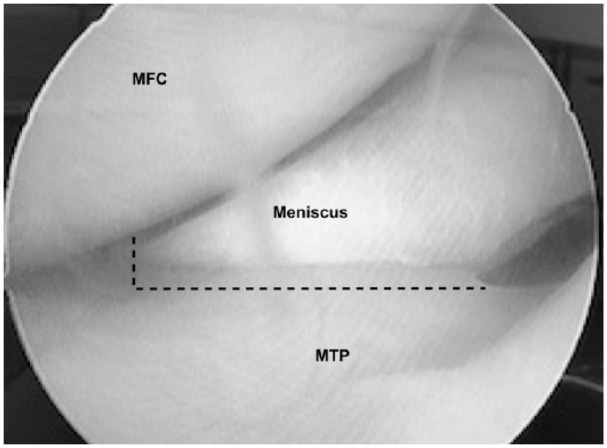
An arthroscopic view of the normal anterior aspect of the medial femorotibial joint. The dashed line indicates the locations for transection transection of the anterior meniscotibial ligament (vertical) and meniscal capsular attachment (horizontal incision).
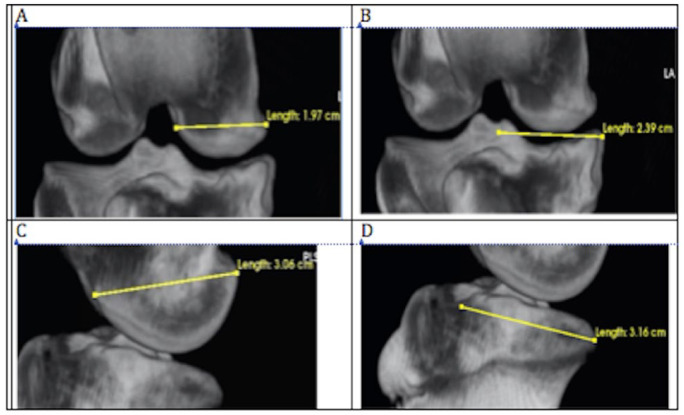
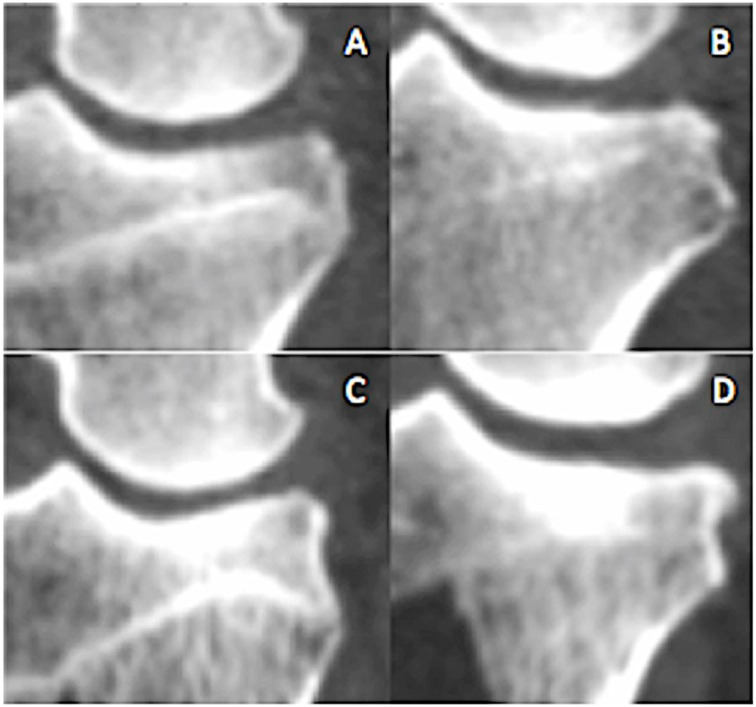
CT image stacks were reconstructed using the 3-dimensional rendering tool and the CT-bone contrast preset in Osirix medical imaging software (Osirix 9.0, Pixmeo, Geneva, Switzerland). Training of image readers was conducted on practice image files that included the entire spectrum of pathologic change. Osteophytes, subchondral sclerosis, and shape change were scored similar to the human knee as outlined by Altman and Gold18 ( Table 1 ) using 2-dimensional image slices in the coronal and sagittal planes. Flattening or changes in contour of the medial femoral condyle and tibial plateau were scored from 0 (normal) to severe (3) using the recommendations of Altman and Gold.18 Changes in medial compartment dimensions were measured using the linear measurement tool as shown in Figure 2A-D. The procedure for these measurements included using convergence of cortices and landmarks for insuring projection maximized the joint space and were exactly orthogonal to the chosen planes. Landmarks were defined in 2-dimensional slices to defined point coordinates that bisected the femoral condyle and tibial plateau in the coronal and sagittal planes. Printed plastic bone models of the cartilage surfaces were available to reference landmarks. Sclerosis ( Fig. 3 ) was scored using a 0 to 4 scale where 0 (normal) was characterized by a continuous 1 mm thick subchondral bone plate underpinned by trabecular bone. Increasing radiodensity, subchondral bone plate thickness, metaphyseal involvement constituted progression.
Table 1.
Computed Tomography (CT) Imaging Analysis Parameters.
| CT Scoring System | |
|---|---|
| Marginal osteophytes | 0-3 |
| Subchondral sclerosisa | 0-3 |
| Femoral condyle flatteninga | 0-3 |
| Subchondral cysts | Present/absent |
| MFC width | Measured in centimeters |
| MTP width | Measured in centimeters |
| MFC AP length | Measured in centimeters |
| MTP AP length | Measured in centimeters |
MFC = medial femoral condyle; MTP = medial tibial plateau; AP = anterior to posterior.
Scale of 0 to 3 where 0 = absent or normal, 1 = mild, 2 = moderate, and 3 = severe.
Figure 2.
Measurements of width and length (mm) of medial femoral condyle (MFC) and medial tibial plateau (MTP) of the right knee joint using the LineTool in OSiriX required consistent positioning. The 3-dimensional image was rotated in the coronal and transverse planes through both collateral ligament attachment sites resulting in the widest possible the joint space. The MTP width was measured from this specific projection. Similarly, the MFC and MTP length were measured using sagittal projections that maximized joint width and superimposed medial and lateral condyles exactly. (A) Width of the MFC (cm). (B) Width of the MTP (cm). (C) Length of the MFC (cm) and (D) length of the MTP (cm).
Figure 3.
Sclerosis was graded from 0 (normal) to 4 (severed) based on increasing gray scale brightness and the area of subchondral plate affected. (A) Grade 1, (B) grade 2, (C) grade 3, and (D) grade 4.
Data analysis of the serial CT images was conducted using the statistical software Rstudio (version 1.1.383, © 2009-2016 RStudio, Inc.). A linear mixed effects model was conducted to investigate the trajectory of change within each of the joint parameters over time. The statistical package lme419 was used to fit and analyze the data using a 95% confidence level. Predictors of change included time, group and severity of sclerosis. Sclerosis scores were converted to percentage changes relative to each subject’s baseline score of 0 (normal). Each scoring interval corresponded to a 20% increase with a score of 3 representing a change of 60% or greater from baseline (day 0.) Severity of sclerosis as a predictor of change in the width and length of the medial compartment was also assessed using ordinal logistic regression.
Results
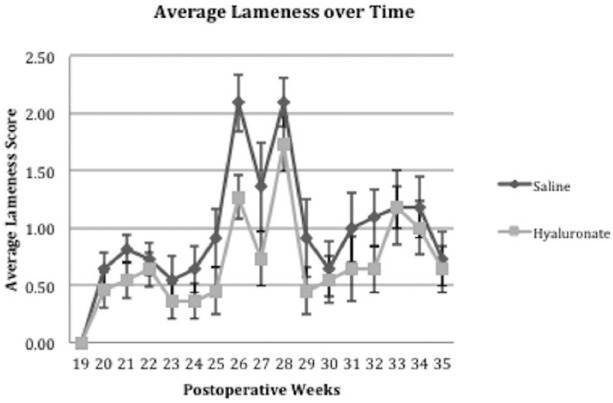
All sheep commenced the study with normal CT and arthroscopic findings. Postoperative knee joint swelling and effusion were resolved within 7 days of surgery and lameness (grade 1-2) diminished slowly over the ensuing 3 weeks. Lameness and effusion returned at week 24 and continued to week 36 as shown in Figure 4 .
Figure 4.
Mean and standard deviation of sheep in group 1 that received intra-articular saline and group 2 that received intra-articular hyaluronate at week 12. Between postoperative week 3 and 19, there was no observed lameness, lameness peaked between 25 and 29 weeks after meniscal release. There were no significant differences between the two groups at any time point.
Second look arthroscopy of the operated stifle joints 3 months after meniscal release confirmed there was meniscal prolapse and loss of load sharing in the medial compartment. Diffuse cartilage softening and fissures were present in the medial tibial plateau (Outerbridge grade 1) in addition to focal cartilage fibrillation and thinning (grade 2) in all animals. Synovial membrane hypertrophy (grade 1-2) and debris in the synovial fluid were also present. After 6 months of meniscal insufficiency, there were larger partial and full thickness chondral erosions (Outerbridge grade 3) as well as involvement of the opposing femoral condyle (Outerbridge grade 1 and 2).
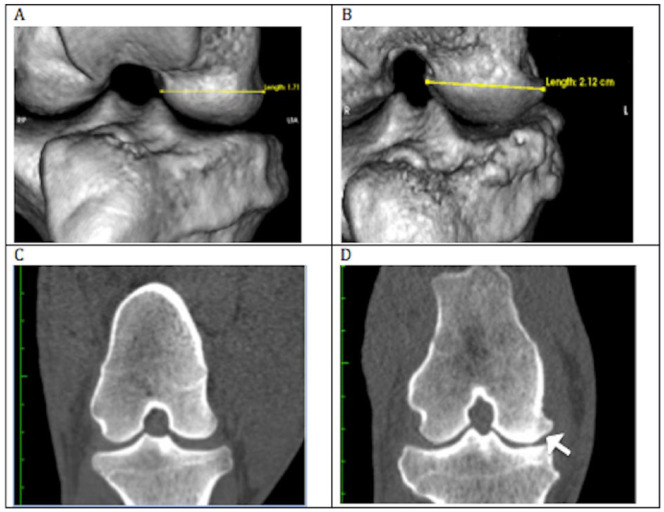
CT imaging showed that all sheep were developing medial tibial plateau osteophytes and significant medial cortical drift in the coronal plane in both groups ( Fig. 5 ). Width and length measurement data analyzed using the linear mixed model revealed that time was a significant predictor of change in each of the joint morphology measures in both groups ( Tables 2 and 3 ). When percent change over time of each parameter was analyzed with pooled groups, all time points were significant (P < 0.05). Additionally, significant changes in the medial compartment that correspond to incremental changes in the scoring of severity of sclerosis were observed ( Table 4 ). The ordinal logistic regression analysis yielded results that suggested changes in morphology of the joint correspond significantly to changes in scores associated with progressive OA pathology, such as sclerosis.
Figure 5.
Example of medial joint surface enlargement. Measurement of medial femoral condyle (MFC) width for 1 subject taken at month 0 and month 9 using OSiriX 3-dimensional rendering platform and linear measurement tool. (A) Width of MFC taken at week 0 (preoperative). (B) Width taken at week 35, or 9 months postmeniscal release. (C) Coronal view of MFC at week 0. (D) Coronal view of MFC and medial tibial plateau (MTP) taken at week 35. Arrow denotes area of bone remodeling and widening of the MFC.
Table 2.
Length and Width of MTP and MFC (cm) Recorded as a Means ± Standard Error.a
| MTP | MFC | |||
|---|---|---|---|---|
| Width (cm) | Length (cm) | Width (cm) | Length (cm) | |
| Group 1 | ||||
| Preoperative | 2.19 ± 0.03 | 3.46 ± 0.05 | 1.66 ± 0.03 | 2.78 ± 0.04 |
| 3 months | 2.26 ± 0.03 | 3.16 ± 0.04 | 1.74 ± 0.02 | 2.91 ± 0.04 |
| 6 months | 2.33 ± 0.03 | 3.26 ± 0.07 | 1.84 ± 0.03 | 2.98 ± 0.03 |
| 9 months | 2.38 ± 0.03 | 3.29 ± 0.05 | 1.89 ± 0.03 | 2.98 ± 0.04 |
| Group 2 | ||||
| Preoperative | 2.20 ± 0.03 | 2.96 ± 0.05 | 1.66 ± 0.03 | 2.88 ± 0.04 |
| 3 months | 2.27 ±0.03 | 3.19 ± 0.03 | 1.81 ± 0.02 | 2.91 ± 0.06 |
| 6 months | 2.36 ± 0.03 | 3.18 ± 0.04 | 1.86 ± 0.03 | 2.99 ± 0.05 |
| 9 months | 2.43 ± 0.04 | 3.20 ± 0.05 | 1.95 ± 0.03 | 3.01 ± 0.06 |
MFC = medial femoral condyle; MTP = medial tibial plateau.
Measurements were taken at 3-month intervals postoperatively using serial computed tomography analysis.
Table 3.
Summary of the Mixed Effects Model Including Estimates (and Standard Error in Parentheses) Showing the Relationship Between Each of Time, Group, and Sclerosis With Regard to Each of the Joint Parameters (MTP and MFC, Length, and Width).
| Dependent Variable | ||||
|---|---|---|---|---|
| MTP Length (1) | MTP Width (2) | MFC Length (3) | MFC Width (4) | |
| MTP sclerosis | 0.102*** (0.038) | −0.039 (0.045) | ||
| MFC sclerosis | 0.036 (0.059) | −0.06 (0.047) | ||
| Groups × Saline | −2.29 (1.452) | 1.226 (1.455) | −0.418 (2.374) | −3.769** (1.740) |
| Time | 0.024 (0.049) | 0.307*** (0.066) | 0.263*** (0.076) | 0.343*** (0.061) |
| Groups × Saline × Time | 0.068 (0.054) | −0.090 (0.079) | −0.113 (0.091) | 0.016 (0.073) |
| Constant | 2.655** (1.058) | 0.617 (1.072) | −0.261 (1.822) | 6.522*** (1.350) |
| Observations | 66 | 66 | 66 | 66 |
| Log likelihood | −162.123 | −174.380 | −185.510 | −179.745 |
| AIC | 342.246 | 366.760 | 389.020 | 377.491 |
| BIC | 361.953 | 386.467 | 408.727 | 397.197 |
AIC = Akaike information criterion; BIC, Bayesian information criterion; MFC = medial femoral condyle; MTP = medial tibial plateau.
P < 0.1. **P < 0.05. ***P < 0.01.
Table 4.
Summary of Ordinal Logistic Regression Between Joint Measurements and Change in Subchondral Bone Sclerosis Score from Baseline.
| Estimate | Standard Error | T | P | |
|---|---|---|---|---|
| MTP length | 0.371 | 0.099 | 3.75 | 0.0002 |
| MTP width | 0.119 | 0.057 | 2.09 | 0.037 |
| MFC length | 0.226 | 0.072 | 3.14 | 0.002 |
| MFC width | 0.155 | 0.05 | 3.10 | 0.002 |
MFC = medial femoral condyle; MTP = medial tibial plateau.
Length of the MTP changed significantly with respect to severity of sclerosis (b = 0.102, standard error [SE] = 0.038) but not for time ( Table 3 , Fig. 6 ). We observed a significant trend for changes in the length of the MTP across all levels of severity of sclerosis localized to the MTP (b = 0.371, SE = 0.099, P < 0.001). Hence, we found evidence of a predictable change in length with regard to changes in the severity of sclerosis (Table 4).
Figure 6.
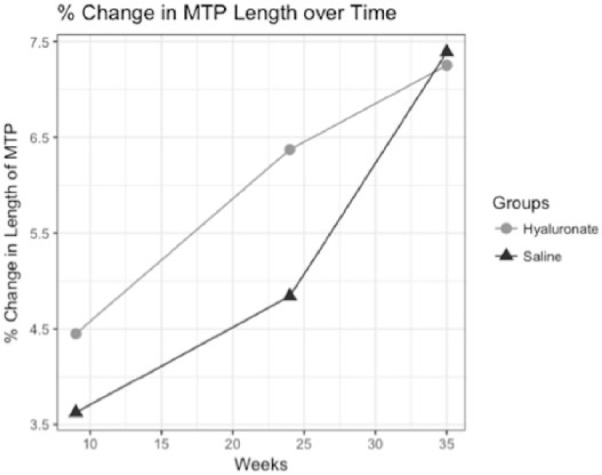
Trajectory of relative change in length of the medial tibial plateau (MTP) since Week 0 (preoperative) with regard to time is described for saline and hyaluronate condition. Average relative change was determined at weeks 9, 24, and 35.
Width and length of the medial tibial plateau increased significantly with regard to developing sclerosis over the course of the 9-month period ( Tables 3 and 4 ). The effect of time on width of the MTP in the mixed model was reported as significant (b = 0.307, SE = 0.066, P < 0.01) suggesting a predictable effect of time driving the widening of the tibial plateau ( Table 3 , Fig. 7 ). Furthermore, across all ordinal levels of sclerosis within the MTP, we observed a significant general trend that suggests there is predictable change in the width of the MTP as sclerosis worsens (b = 0.119, SE = 0.057, P < 0.05) ( Table 4 ).
Figure 7.
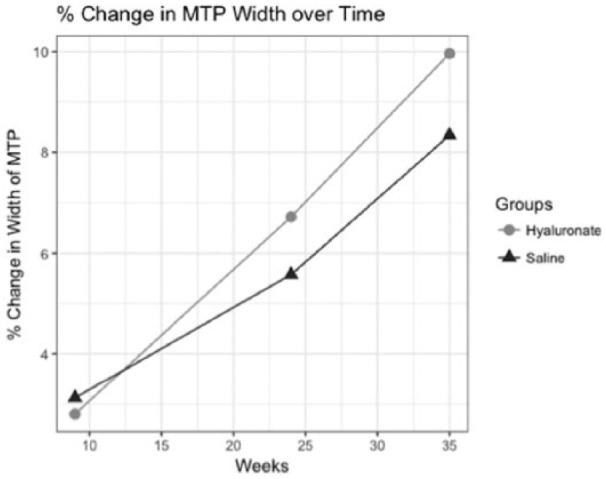
Trajectory of relative change in width of the medial tibial plateau (MTP) since week 0 (preoperative) with regard to time is described for saline and hyaluronate condition. Average relative change was determined at weeks 9, 24, and 35.
Time had a significant effect (b = 0.263, SE = 0.076, P < 0.01) on the rate of change in length of the MFC for both the saline and hyaluronate groups ( Table 3 , Fig. 8 ). Our ordinal logistic regression model provided evidence that changes in the length of the MFC could be predicted following incremental change in the severity of sclerosis of the MFC. The overall trend of change in length was significant (b = 0.155, SE = 0.050, P < 0.05) ( Table 4 ).
Figure 8.
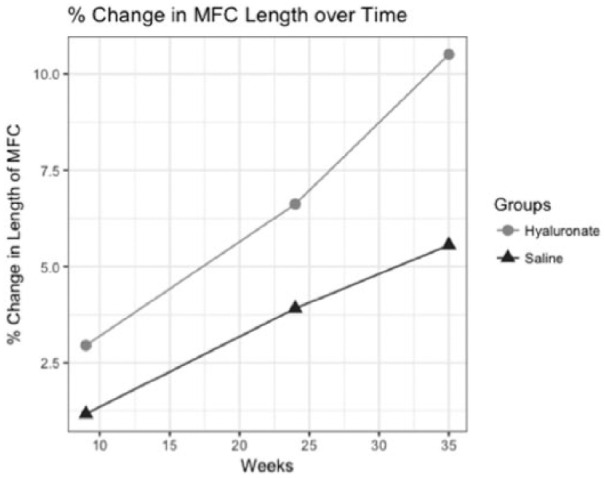
Trajectory of relative change in length of the medial femoral condyle (MFC) with regard to time for saline and hyaluronate treatment groups. Average relative change was determined at weeks 9, 24, and 35.
The overarching trend between changes in the width of the MFC and incremental change in scores of sclerosis was found to be significant using our model (b = 0.226, SE = 0.072, P < 0.01) ( Table 4 ). Thus, there is evidence of widening of the MFC with regard to changes in severity of sclerosis measured using the scale.
The coefficient estimates for group (b = −3.77, SE = 1.74, P < 0.05) and time (b = 0.343, SE = 0.061, P < 0.01) were significant using a Wald test. These coefficients can be useful in predicting differences in change of MFC width over time ( Table 3 , Fig. 9 ).
Figure 9.
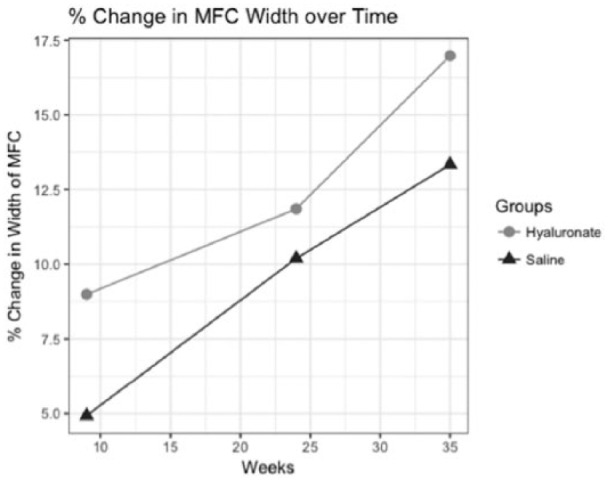
Trajectory of relative change in width of the medial femoral condyle (MFC) with regard to time is described for saline and hyaluronate treatment groups. Average relative change was determined at weeks 9, 24, and 35.
Discussion
Assessment of pain and lameness in sheep is controversial since like other grazing animal they are a “prey” species, which implies that they are less likely to demonstrate behavior that would make them appear more susceptible to predation.20 Our data show that early cartilage degeneration in sheep did not display observable lameness until ICRS grade 2 to 3 lesions, including exposure of subchondral bone developed 6 months after meniscal release. Synovitis may have played a role in creating lameness in the early postoperative period but was not a clear inciting factor thereafter. Gait analysis has been useful to monitor the evolution of lameness in the sheep knee but was time consuming and was only applicable to a subset of animals.4
This suggests that the arthroscopic meniscal release model in the sheep provides adequate opportunity for measuring changes in OA progression in order to plan therapeutic interventions. Intra-articular drugs, biologics, and cell therapies are unlikely to alter the trajectory of OA after the collagen network is widely disrupted resulting in widespread matrix proteoglycan, and chondrocyte loss. Conversely, therapies that reverse catabolic metabolism and cell loss are likely to be effective during the earlier hypertrophic phase of osteoarthritis when dysregulation of chondrocyte metabolism predominates. Early interventions during the period when degenerative changes are mild and potentially reversible would be most valuable. Ideally therapies that reduce catabolic metabolism and inflammation would trialed when ICRS grade 1 lesions are present between the induction of meniscal deficiency and 3 months. Therapies that have an additional anabolic reparative effect would be needed between 3 and 6 months postinduction when cracks and partial thickness erosions are present. The single injection of hyaluronate in study group 2 was not intended to alter the course of the meniscal release model but was used because it is frequently the carrier for cell therapies. We did observe a qualitative difference in the width and length CT measurements between the 2 groups and though not statistically significant, the hyaluronate treated group had a more rapid rate of change after 24 weeks. The analgesic, homeostatic and immunomodulatory effects of intra-articular hyaluronate in OA are well described,21 but this study was not designed to detect a therapeutic effect. To achieve this, 2 or more injections of high-molecular-weight hyaluronate would have been required at 3- to 6-month intervals, hence it is not surprising that the hyaluronate-treated group would converge with the control group at late time points.
CT imaging, while not inherently sensitive to changes in cartilage volume, revealed bony features of OA progression that correlated with cartilage abnormalities and chondropenia in this study. We have demonstrated meaningful changes in the dimensions of the medial compartment associated with the development of osteoarthritis in an ovine model following a meniscal injury intervention. Serial CT images were sensitive enough to detect widening of the medial compartment arising from remodeling of the tibia and femoral condyle during the 9-month study period. Other studies have demonstrated a correlation between lameness scoring and morphological changes in the medial compartments following meniscal release in canine2 and ovine4 models, unlike many other studies where animals are sacrificed for assessments at earlier time points, the timeframe of the present study occurred over a 9-month period, which allowed development of a broad spectrum of osteoarthritic changes. Knee joint shape change in OA is widely accepted as marker of disease progression,7,22 which supports our hypothesis that CT imaging can stage and model the rate of osteoarthritis progression.
Conclusion
Noninvasive monitoring of osteoarthritis progression can be conducted in real time by serial CT imaging by monitoring bone shape change and subchondral bone sclerosis. Diagnostic arthroscopy can be used to link bone shape change with cartilaginous lesions and synovitis. Decisions regarding adequacy of dosing, interdose interval, early termination of failing experiments or extension of successful ones can be made without sacrificing large groups of animals.
Footnotes
Acknowledgments and Funding: The author(s) received no financial support for the research, authorship, and/or publication of this article.
Declaration of Conflicting Interests: The author(s) declared no potential conflicts of interest with respect to the research, authorship, and/or publication of this article.
Ethical Approval: All procedures were approved an institutional animal care committee operating under the guidelines of the National Council on Animal Care.
Animal Welfare: The present study followed international, national, and/or institutional guidelines for humane animal treatment and complied with relevant legislation.
ORCID iD: Mark Hurtig  https://orcid.org/0000-0001-7632-937X
References
- 1. Glasson SS, Blanchet TJ, Morris EA. The surgical destabilization of the medial meniscus (DMM) model of osteoarthritis in the 129/SvEv mouse. Osteoarthritis Cartilage. 2007;15(9):1061-9. doi: 10.1016/j.joca.2007.03.006. [DOI] [PubMed] [Google Scholar]
- 2. Kuroki K, Cook CR, Cook JL. Subchondral bone changes in three different canine models of osteoarthritis. Osteoarthritis Cartilage. 2011;19(9):1142-9. doi: 10.1016/j.joca.2011.06.007. [DOI] [PubMed] [Google Scholar]
- 3. Orth P, Madry H. A low morbidity surgical approach to the sheep femoral trochlea. BMC Musculoskelet Disord. 2013;14:5. doi: 10.1186/1471-2474-14-5. [DOI] [PMC free article] [PubMed] [Google Scholar]
- 4. Cake MA, Read RA, Corfield G, Daniel A, Burkhardt D, Smith MM, et al. Comparison of gait and pathology outcomes of three meniscal procedures for induction of knee osteoarthritis in sheep. Osteoarthritis Cartilage. 2013;21(1):226-36. doi: 10.1016/j.joca.2012.10.001. [DOI] [PubMed] [Google Scholar]
- 5. Modesto RB, Mansmann KA, Schaer TP. Arthroscopy of the normal cadaveric ovine femorotibial joint: a systematic approach to the cranial and caudal compartments. Vet Comp Orthop Traumatol. 2014;27(5):387-94. doi: 10.3415/VCOT-14-03-0039. [DOI] [PubMed] [Google Scholar]
- 6. Oakley SP, Portek I, Szomor Z, Appleyard RC, Ghosh P, Kirkham BW, et al. Arthroscopy—a potential “gold standard” for the diagnosis of the chondropathy of early osteoarthritis. Osteoarthritis Cartilage. 2005;13(5):368-78. doi: 10.1016/j.joca.2004.12.005. [DOI] [PubMed] [Google Scholar]
- 7. Andreisek G, White LM, Sussman MS, Kunz M, Hurtig M, Weller I, et al. Quantitative MR imaging evaluation of the cartilage thickness and subchondral bone area in patients with ACL-reconstructions 7 years after surgery. Osteoarthritis Cartilage. 2009;17(7):871-8. doi: 10.1016/j.joca.2008.05.024. [DOI] [PubMed] [Google Scholar]
- 8. Eckstein F, Wirth W. Quantitative cartilage imaging in knee osteoarthritis. Arthritis. 2011;2011:475684. doi: 10.1155/2011/475684. [DOI] [PMC free article] [PubMed] [Google Scholar]
- 9. Hunter DJ, Guermazi A, Lo GH, Grainger AJ, Conaghan PG, Boudreau RM, et al. Evolution of semi-quantitative whole joint assessment of knee OA: MOAKS (MRI Osteoarthritis Knee Score). Osteoarthritis Cartilage. 2011;19(8):990-1002. doi: 10.1016/j.joca.2011.05.004. [DOI] [PMC free article] [PubMed] [Google Scholar]
- 10. Hunter D, Altman R, Cicuttini F, Crema MD, Duryea J, Eckstein F, et al. OARSI Clinical Trials Recommendations: knee imaging in clinical trials inosteoarthritis. Osteoarthritis Cartilage. 2015;23(5):698-715. doi: 10.1016/j.joca.2015.03.012. [DOI] [PubMed] [Google Scholar]
- 11. Jones CW, Willers C, Keogh A, Smolinski D, Fick D, Yates PJ, et al. Matrix-induced autologous chondrocyte implantation in sheep: objective assessments including confocal arthroscopy. J Orthop Res. 2008;26(3):292-303. doi: 10.1002/jor.20502. [DOI] [PubMed] [Google Scholar]
- 12. Gatlin CC, Matheny LM, Ho CP, Johnson NS, Clanton TO. Diagnostic accuracy of 3.0 Tesla magnetic resonance imaging for the detection of articular cartilage lesions of the talus. Foot Ankle Int. 2015;36:288-92. doi: 10.1177/1071100714553469. [DOI] [PubMed] [Google Scholar]
- 13. Smith MM, Clarke EC, Little CB. Considerations for the design and execution of protocols for animal research and treatment to improve reproducibility and standardization: “DEPART well-prepared and ARRIVE safely.” Osteoarthritis Cartilage. 2017;25(3):354-63. doi: 10.1016/j.joca.2016.10.016. [DOI] [PubMed] [Google Scholar]
- 14. Moran CJ, Ramesh A, Brama PAJ, O’Byrne JM, O’Brien FJ, Levingstone TJ. The benefits and limitations of animal models for translational research in cartilage repair. J Exp Orthop. 2016;3(1):1. doi: 10.1186/s40634-015-0037-x. [DOI] [PMC free article] [PubMed] [Google Scholar]
- 15. Oakley SP, Portek I, Szomor Z, Appleyard R, Ghosh P, Krikham B, et al. Arthroscopic estimation of the extent of chondropathy. Osteoarthritis Cartilage. 2007;15(5):506-15. doi: 10.1016/j.joca.2006.10.013. [DOI] [PubMed] [Google Scholar]
- 16. Outerbridge RE, Dunlop JA. The problem of chondromalacia patellae. Clin Orthop Relat Res. 1975;(110):177-96. [DOI] [PubMed] [Google Scholar]
- 17. Little JP, Bleedorn JA, Sutherland BJ, Sullivan R, Kalscheur VL, Ramaker MA, et al. Arthroscopic assessment of stifle synovitis in dogs with cranial cruciate ligament rupture. PLoS One. 2014;9(6):e97329. doi: 10.1371/journal.pone.0097329. [DOI] [PMC free article] [PubMed] [Google Scholar]
- 18. Altman RD, Gold GE. Atlas of individual radiographic features in osteoarthritis, revised. Osteoarthritis Cartilage. 2007;15(Suppl A):A1-A56. doi: 10.1016/j.joca.2006.11.009. [DOI] [PubMed] [Google Scholar]
- 19. Bates D, Maechler M, Bolker B, Walker S. Fitting linear mixed effects models using lme4. Journal of Statistical Software. 2015;67(1):1-46. doi: 10.18637/jss.v067.i01 [DOI] [Google Scholar]
- 20. Van Nuffel A, Zwertvaegher I, Pluym L, Van Weyenberg S, Thorup VM, Pastell M, et al. Lameness detection in dairy cows: part 1. How to distinguish between non-lame and lame cows based on differences in locomotion or behavior. Animals (Basel). 2015;5(3):838-60. doi: 10.3390/ani5030387. [DOI] [PMC free article] [PubMed] [Google Scholar]
- 21. Altman RD, Manjoo A, Fierlinger A, Niazi F, Nicholls M. The mechanism of action for hyaluronic acid treatment in the osteoarthritis knee: a systemic review. BMC Musculoskelet Disord. 2015;16:321. doi: 10.1186/s12891-015-0775-z. [DOI] [PMC free article] [PubMed] [Google Scholar]
- 22. Neogi T, Bowes MA, Nui J, De Souza KM, Vincent GR, Goggins J, et al. Magnetic resonance imaging-based three-dimensional bone shape of the knee predicts onset of knee osteoarthritis. Arthritis Rheum. 2013;65(8):2048-58. doi: 10.1002/art.37987. [DOI] [PMC free article] [PubMed] [Google Scholar]


