Abstract
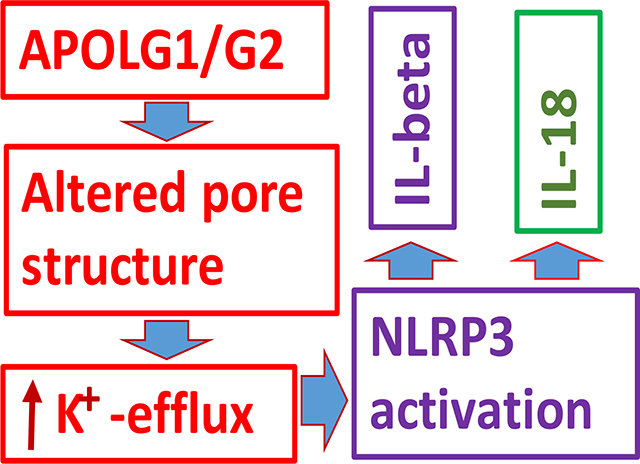
We evaluated alterations in the structural configurations of channels and activation of NLRP3 inflammasomes formation in APOL1 risk and non-risk milieus. APOL1G1- and APOL1G2- expressing podocytes displayed enhanced K+ efflux, induction of pyroptosis, and escalated transcription of interleukin (IL)-1β and IL-18. APOL1G1- and APOL1G2-expressing podocytes promoted the transcription as well as translation of proteins involved in the formation of inflmmasomes. Since glyburide (a specific inhibitor of K+ efflux channels) inhibited the transcription of NLRP3, IL-1β, and IL-18, the role of K+ efflux in the activation of inflammasomes in APOL1 risk milieu was implicated. To evaluate the role of structural alterations in K+ channels in plasma membranes, bioinformatics studies, including molecular dynamic (MD) simulation were carried out. Superimposition of bioinformatics reconstructions of APOL1G0, G1, and G2 showed several aligned regions. The analysis of pore-lining residues revealed that Ser342 and Tyr389 are involved in APOL1G0 pore formation and the altered conformations resulting from the Ser342Gly and Ile384Met mutation in the case of APOLG1 and deletion of the Tyr389 residue in the case of APOL1G2 are expected to alter pore characteristics, including K+ ion selectivity. Analysis of multiple membrane (lipid bilayer) models of interaction with the peripheral protein, integral membrane protein, and multimer protein revealed that for an APOL1 multimer model, APOL1G0 is not energetically favorable while the APOL1G1 and APOL1G2 moieties favor the insertion of multiple ion channels into the lipid bilayer. We conclude that altered pore configurations carry the potential to facilitate K+ ion transport in APOL1 risk milieu.
Keywords: Apolipoprotein L1 (APOL), pore structure, K+-efflux, inflammasomes, lipid bilayer
Graphical Abstract
Introduction
The apolipoprotein (APOL) gene appeared ~33 million ago, after the divergence of Old World primates and New World primates, and is unique to humans and gorillas (1). The APOL1 is located at chromosome 22q13.1 and the only member of the APOL family (six members, APOL1–6) with a signal peptide enabling the cellular export. Several APOL1 splice variants do not contain signal peptides, and these isoforms are predicted to code for intracellular APOL1. It is expressed in the liver, pancreas, kidney, and brain and in macrophages, endothelial, and several other cell types (2, 3). Initially, the role of circulating APOL1 was recognized as a trypanolytic factor (1). Until a decade ago, the role of the expressed protein in general, and in kidney cells in particular, was not appreciated (4). During the current decade, APOL1 mutants (G1 and G2) have been reported for their association with a higher incidence of chronic kidney disease (CKD) in patients with African ancestry and considered to be renal risk variants (RRVs). The G1 variant (rs73885319) is a compound missense mutation (S342G: I384M) encoding two nonsynonymous amino acids. The G2 variant is a 6-bp in-frame deletion which has resulted in the loss of two amino acids (N388 and Y389) at the C-terminal helix of APOL1 (5, 6). These two allelic variants arose on separate human phylogenetic lineages, and they have never been observed together on the same parental chromosome. The G1 and G2 alleles are mutually exclusive and follow a recessive pattern of inheritance. The APOL1 RRVs are characterized as two G1 (homozygous G1/G1), two G2 (homozygous G2/G2), or one G1 and one G2 (compound heterozygous G1/G2) risk alleles. Approximately 34% of AAs possess one of the two risk variants (APOL1Vs), and ∼13% have both coding variants (5–7). In the United States, ∼3 million African Americans carry both risk alleles. In contrast, APOL1Vs infrequently occur in European Americans, ∼0.3% carry G1, and 0.1% G2 alleles.
The full-length APOL1 wild type protein G0 has been sub-divided into four domains: signal peptide (SP, 1–27 AA), pore-forming domain (PFD, 60–237 AA), membrane-address domain (MAD, 238–303 AA), and SRA-interacting domain (339–398) (8–10). We and others have reported that the pore-forming domain plays a critical role in APOL1 function (11–15).
Initial reports suggested that APOL1 acts as an anion channel in the vacuolar membrane resulting in the disruption of the vacuolar compartment (8). These investigators used an internal segment of the APOL1 sequence to model it as a pore-forming region that generated modestly chloride-selective channels in planar lipid bilayers. They also reconstituted full-length APOL1 into lipid membranes at neutral pH and demonstrated that chloride uptake in this system was not inhibited by the chloride channel inhibitor DIDS, and the uptake was higher at acidic pH. Other investigators also demonstrated an activity that generated pores in phospholipid vesicles with the use of full-length APOL1 (11). These pores allowed passage of four negative charges at neutral pH. However, conditions required for the physical association and pore formation included low pH, the presence of negatively charged phospholipids, and low ionic strength. Other groups of investigators used a lipid bilayer approach showing insertion of APOL1 into the vacuolar membrane and its trafficking to the plasma membrane and activation of cation channel activity at neutral extracellular pH (12). Another report indicated that expression of APOL1 increased plasma membrane non-selective cation channel activity in mammalian cells (13). Thus it appears that insertion of APOL1 causes selective anion channel activity at lower pH but non-selective cation channel activity at neutral pH. However, in these models, comparative analysis of APOL1 risk and non-risk proteins was not conducted. Nonetheless, the cellular expression of APOL1 risk variants has been shown to enhance K+ efflux and activation of the MAP Kinase pathway in 293 T cells (13, 14). Moreover, this effect of APOL1 risk alleles resulted in cytotoxicity, which was dose-dependent (15).
Induction of K+ efflux is associated with calcium influx causing mitochondrial overload and destabilization, resulting in the formation of inflammasomes in LPS-primed macrophages (16). APOL1 risk alleles have also been shown to enhance K+ efflux (13) as well as stimulate inflammasomes formation (17). Thus, it becomes relevant to consider whether the insertion of APOL1 non-risk and risk variants into the plasma membrane may be acting with different selectivity as cationic channels to enhance K+ efflux. We hypothesized that altered structural pore configurations as a consequence of the insertion of APOL1 variants in lipid bilayer could be contributing to enhanced K+ efflux. If that is so, we asked whether glyburide, an inhibitor of K+ efflux, would be able to prevent APOL1 risk protein-mediated inflammasome formation.
In the present study, we have studied the effect of APOL1 and APOL1 variants on the stimulation of K+ efflux, activation of NLRP3 inflammasomes, and induction of pyroptosis in human podocytes. To confirm the role of K+ efflux in the activation of NLRP3 in APOL1 risk milieu, we evaluated the effect of a specific inhibitor of ATP-sensitive K+ channels. We used bioinformatics analysis to reconstruct the structural configurations of pores in cells expressing APOL1 risk and non-risk proteins and differences that could alter expected K+ efflux.
Results
APOL1 risk alleles (APOL1G1 and APOL1G2) promote inflammasomes formation and pyroptosis in podocytes
To evaluate the role of APOL1G0, APOL1G1, and APOL1G2 channels in the activation of NLRP3 inflammasomes, we expressed vector (PDV), APOL1G0 (PDG0), APOL1G1 (PDG1), and APOL1G2 (PDG2) in human podocytes employing a GFP-containing lentivirus expression system as described previously (18). Human podocytes were transduced with the same quantity of lentivirus (titrated as 0.8 pg p24 protein/cell), harboring APOL1G0, APOL1G1, or APOL1G2 cDNAs. Transduction efficiency was quantified using GFP expression was close to 90%. Subsequently, the expression of recombinant APOL1 in podocytes was confirmed as described previously (18).
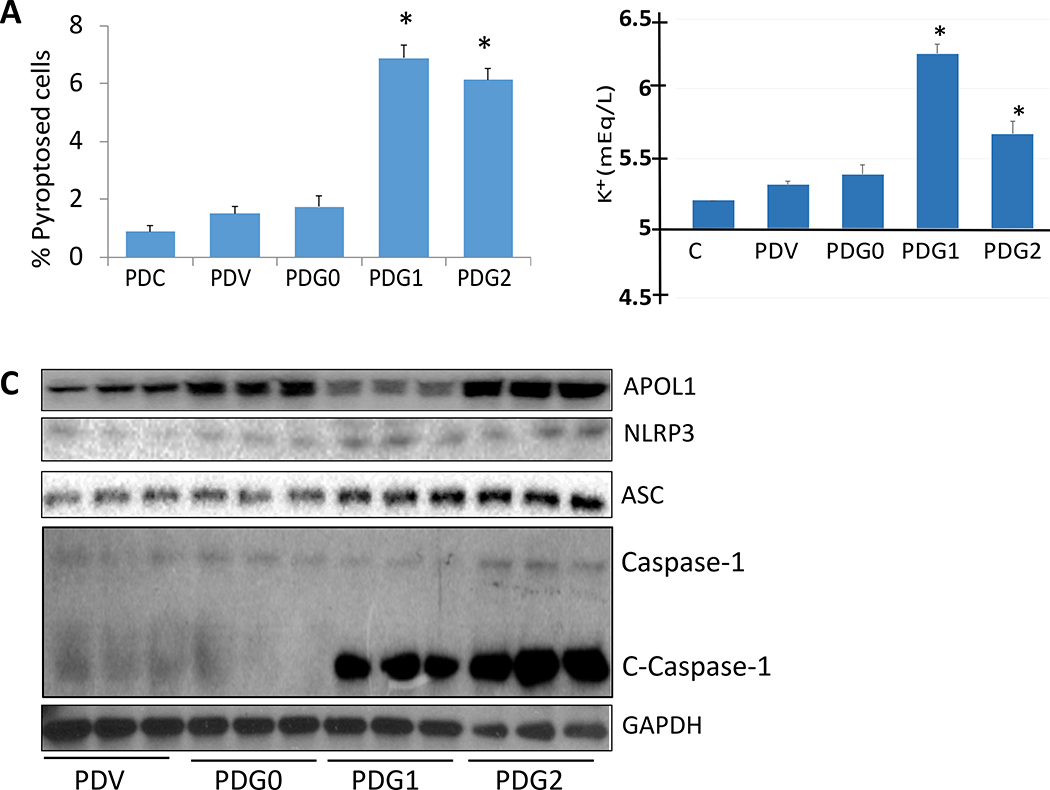
To analyze the occurrence of pyroptosis in control and experimental cells, control podocytes (PDCs), PDVs, PDG0s, PDG1s, and PDG2s were incubated in media containing (1% serum) for 24 hours. Subsequently, cells were stained with Hoechst 33342 and PI. After 10 min, cells were examined under a fluorescence microscope and percent pink cells with condensed nuclei counts. PDG1s and PDG2s displayed a higher percentage of pyroptosed cells (Fig. 1A).
Fig. 1. APOL1 risk alleles promote inflammasomes formation and pyroptosis in podocytes.
A. Control podocytes (PDCs), PDVs, PDG0s, PDG1s, and PDG2s were incubated in media containing (1% serum) for 24 hours (n=4). At the end of the experimental period, cells were stained with Hoechst 33342 and PI. Subsequently, cells were examined under a fluorescence microscope. For statistical analysis, one way ANOVA followed by Tukey multiple comparison test was used.
*P<0.05 compared with PDCs, PDVs, and PDG0s.
B. PDVs, PDG0s, PDG1s, and PDG2s were incubated in media for 24 hours (n=4). At the end of the experimental period, media were collected and assayed for K+. Medium without cells was used as a control (C ). Cumulative data is shown in a bar diagram. For statistical analysis, one way ANOVA followed by Tukey multiple comparison test was used.
*P<0.05 when compared with C, PDVs, and PDG0s.
C. PDVs, PDG0s, PDG1s, and PDG2s were incubated in media for 48 hours (n=3). At the end of the incubation period, cellular lysates were prepared. Proteins and RNAs were extracted. Protein blots were probed for APOL1, NLRP3, ASC, Caspase-1, and rerpobed for GAPDH. Gels from three independent lysates are displayed
To measure K+ efflux, PDVs, PDG0s, PDG1s, and PDG2s were incubated in media for 24 hours (n=4). Subsequently, media were collected and assayed for K+. Medium without cells was used as a control (C ). Cumulative data is shown in a bar diagram. Incubation media from PDG1s and PDG2 displayed a higher (P<0.05) concentration of K+ when compared with media from PDVs and PDG0s (Fig. 1B).
To determine the effect of APOL1G0, APOL1G1, and APOL1G2 on the expression of inflammasomes markers, PDVs, PDG0s, PDG1s, and PDG2s were incubated in media for 48 hours (n=3). At the end of the incubation period, cellular lysates were extracted and purified. Proteins and RNAs were isolated. Protein blots were probed for APOL1, NLRP3, ASC, Caspase-1, and reprobed for GAPDH. Gels from three independent lysates are displayed in Fig. 1C. PDG1s and PDG2 displayed enhanced expression of NLRP3, ASC, and cleaved Caspase-1.
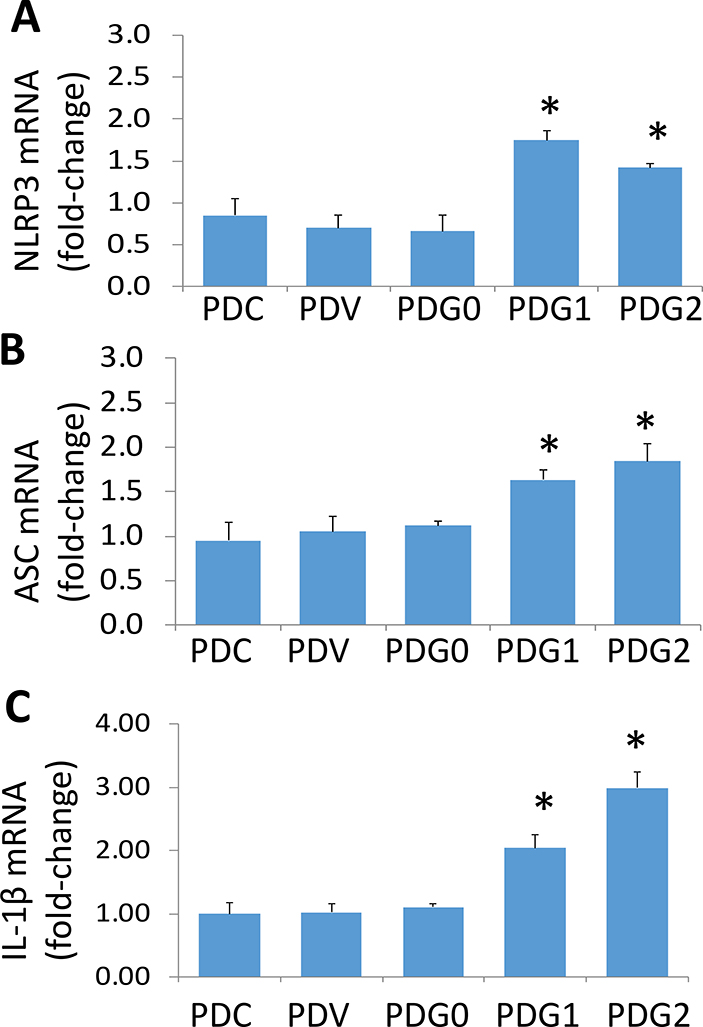
cDNAs were amplified with specific primers for NLRP3, ASC, and IL-1-β. Cumulative data are shown in bar graphs (Fig. 2). PDG1s and PDG2s displayed enhanced expression of NLRP3, ASC, and IL-1β when compared to PDVs and PDG0s.
Fig. 2. APOL1 risk alleles enhance transcription of inflammation molecules in podocytes.
RNAs were extracted from the protocol 1A. cDNAs were amplified with specific primers for NLRP3, ASC, and IL-1-β (n=3). Cumulative data are shown in bar graphs. PDG1s and PDG2s displayed enhanced expression of NLRP3 (A), ASC (B), and IL-1β (C) when compared to PDVs, and PDG0s. For statistical analysis, one way ANOVA followed by Tukey multiple comparison test was used.
*P<0.05 compared with respective PDC, PDV, and PDG0.
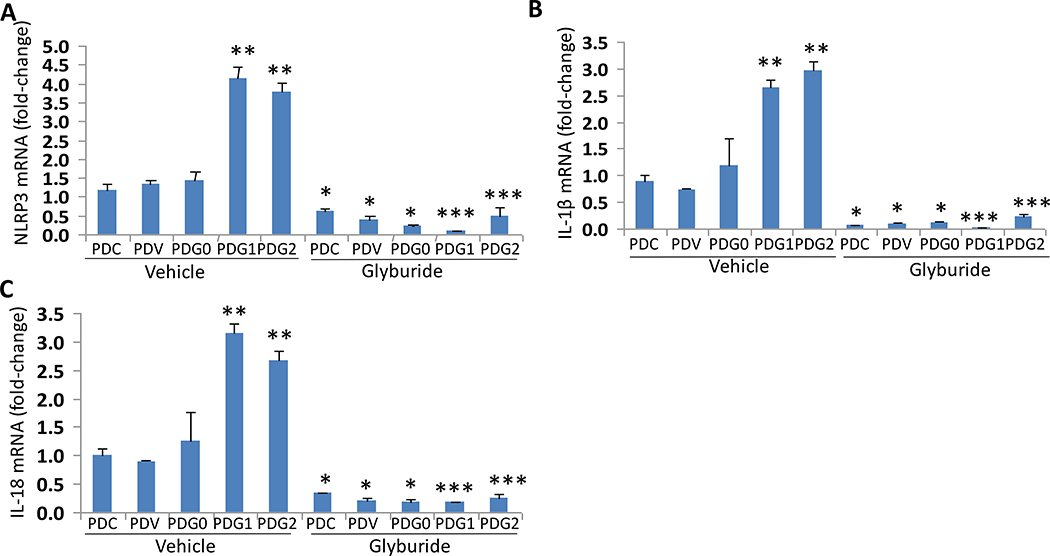
APOL1 variants have been reported to enhance K+ efflux and associated downstream signaling (13). A decreased concentration of intracellular K+ as a consequence of enhanced K+ efflux has been shown to stimulate NLRP3 inflammasome formation (16). We asked if enhanced K efflux is inducing NLRP3 inflammasome activation in APOL1 risk milieu, then glyburide (a specific inhibitor of K+ efflux) should inhibit transcription of NLRP3 inflammasomes. To test our hypothesis, control podocyte (PDCs), PDVs, PDG0s, PDG1s, and PDG2s were incubated in media with either vehicle (DMSO) or glyburide (100 μM) for 48 hours (n=4). Subsequently, RNAs were extracted, and cDNAs were amplified for NLRP3, IL-1β, and IL-18. Cumulative data is shown in a bar diagram (Fig. 3). PDG1s and PDG2s showed enhanced expression of NLRP3, IL-1β, and IL-18. Glyburide inhibited the transcription of NLRP3, IL-1β, and IL-18 under both non-risk and risk APOL1 variant milieus.
Fig. 3. Effect of Glyburide on the transcription of NLRP3, IL-1β, and IL-18 in podocytes expressing APOL1 risk and non-risk alleles.
PDCs, PDVs, PDG0s, PDG1s, and PDG2s were incubated in media containing either vehicle (DMSO) or glyburide (100 μM) for 48 hours (n=4). Subsequently, RNAs were extracted, and cDNAs were amplified for NLRP3 (A), IL-1β (B), and IL-18(C). Cumulative data is shown in a bar diagram. For statistical analysis, one way ANOVA followed by Tukey multiple comparison test was used.
*P<0.05 compared with respective PDC, PDV, and PDG0 (vehicle);
**P<0.01 compared with respective PDC, PDV, and PDG0 (vehicle);
***P<0.05 compared with respective PDC, PDV, and PDG0 (vehicle).
Evaluation of domain structures in APOL1 and its variants
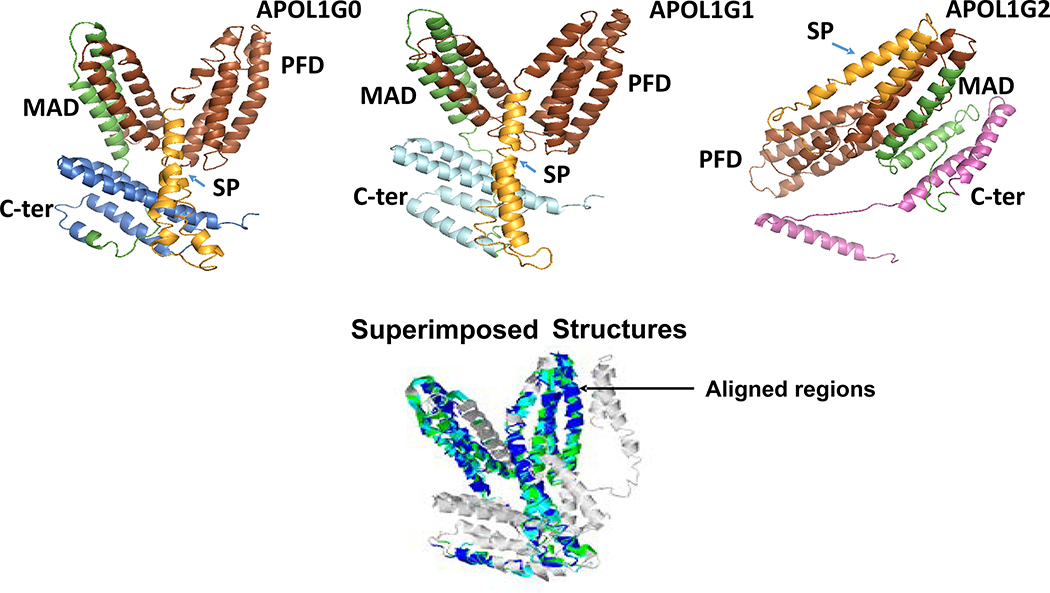
The sequence of APOL1 that is the G0 variant (398 aa residues) has different domains including an amino-terminal signal peptide (1–59 aa), pore-forming domain (60–237 aa) and membrane addressing domain (238–304) and the C-terminal region (305–398 aa). There are two kidney disease-associated variants, i.e., APOL1G1 and APOL1G2, which show mutations in the C-terminal region of ApoL1. The APOL1G1 variant has two site-specific mutations S342G and I384M, whereas, the APOL1G2 variant has two deletions N388 and Y389. Different domains in APOL1G0, APOL1G1, and APOL1G2 are shown in Fig. 4.
Figure 4. Different domains in APOL1 and its variants.
Structures of different domains of APOL1 and its variants are displayed.
A. APOL1G0, APOL1G1, and APOL1G2 structures. SP= Signal Peptide (Orange), PFD= Pore-Forming Domain (Brown), MAD= Membrane-Addressing Domain (Green). B. The superimposed structures. The aligned regions are indicated by color. APOL1G0 (cyan), APOL1G1 (blue) and APOL1G2 (green).
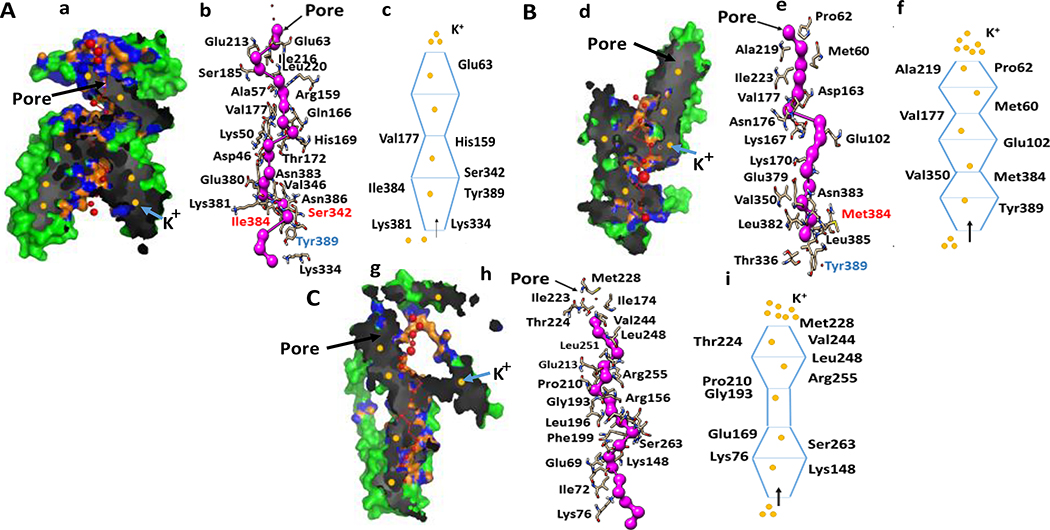
The structure of APOL1G0 has 22 helices with the number of residues ranging from 3 to 28, including 11 helices that consist of residues more than 15 residues (Table 1). The amino-terminal signal peptide has 5 α helices. The pore-forming domain has 9 α helices. The membrane addressing domain has 5α helices, including Lys232-Ala240 overlapping with the pore-forming domain. The C-terminal region has 3 larger α helices and a smaller α helix Ser302-Thr307 that overlaps with membrane addressing domain. The APOL1G0 structure also has 25 β turns, and 10 γ turns. (Table 2) The most important part of the structure is that APOL1G0 structure has 7 pores (Fig. 5A). Pores are connected by internal spaces going through the structure. Here, only pores longer than 25 Å have been included with residues type positive (H,K,R), negative (D,E), neutral (S,T,N,Q), aliphatic (A,V, L, I, M), aromatic (F,Y,W), pro and gly (P,G) and cysteine (C ). The structure has 5 tunnels. Tunnels are interior spaces connected with the protein surrounding. Here, only tunnels longer than 15 Å have been considered. The average hydropathy index, average normalized hydrophobicity, and polarity were calculated for both pores and tunnels that indicated that pores and tunnels are mostly polar and hydrophilic and less hydrophobic in nature. The identified shape of the pore is UDUD (D= decreasing diameter conical frustum, U=increasing diameter conical frustum, and S=cylinder). Commonly recognized shapes are DU=hourglass, UD=diamond, UDU/UDU= hourglass-diamond complex. (Table 3 and Fig. 5) (19–22)
Table 1.
The effect of APOL1 polymorphism on domain structures (related to α helices)
| Domain | Secondary Structure | APOL1G0 | APOL1G1 | APOL1G2 |
|---|---|---|---|---|
| Amino terminal signal peptide | α helices | Ala4-Leu6 Leu7-Val11 Met16-Phe20 Ala30-Ala32 Asn37-Ala56 |
Glu2-Ser17 Gly31-Gln35 Asn37-Asp43 Asp46- Gly58 |
Gly3-Met16 Val23-Asn37 Ser40- Thr44 |
| Pore forming domain | α helices | Ser64-Ile68 Glu69-Lys76 Asn83-Ala99 Glu107-Gln134 Trp139-Leu141 Ser149-Val168 Asn176-Leu196 Gly202-Thr227 Lys232-Ala240 |
Glu63-Lys76 Asn83-Ala101 Arg105-Met124 Lys127-Gln134 Phe140-Asp163 Val178-Leu196 Leu205-Thr227 Lys232-Gln239 |
Glu63-Lys76 Thr81-Ala99 Asp109-Met124 Lys132-Gln135 Phe140-Ala162 Val165-Val168 Val178-Leu196 Gly203-Asp229 |
| Membrane addressing domain | α helices | Lys232-Ala240 His241-Leu243 Val244-Glu260 Ser267-Ile283 Pro297-Ser300 Ser302-Thr307 |
Asp242-Gly259 Leu266-Asp282 |
Trp234-Glu260 Asn264-Arg284 |
| C-terminal region | α helices | Ser314-Arg331 Val338-His360 Ser365-Ile391 Ser302-Thr307 |
Pro304-Val321 Pro324-Asp337 Pro340-His360 Ser365-Leu392 |
Glu308-Met329 Val338-Lys357 Glu369-Ile389 |
Table 2.
The effect of APOL1 polymorphism on the loop turns
| Turns | APOL1G0 | APOL1G1 | APOL1G2 |
|---|---|---|---|
| β- turns | Met1-Ala4 Cys13-Met16 Ala27-Ala30 Ala32-Gln35 Ala56-Thr59 Thr59-Pro62 Met60-Glu63 Asp61-Ser64 Pro104-Glu107 Gln135-Asn138 Leu141-Phe144 Glu143-Arg146 Phe144-Leu147 His169-Thr172 Gly171-Ile174 Thr173-Asn176 Leu196-Phe199 Pro198-Glu201 Phe199-Gly202 Thr307-Ile310 Ile310-Glu313 Leu335-Val338 Gln393-Gln396 Ala394-Glu397 Asp395-Leu398 |
Leu19-Gly22 Val23-Arg26 Asp43-Asp46 Gly58-Asp61 Glu102-Arg105 Arg137-Phe140 Gly164-Lys170 Val168-Gly171 Thr173-Asn176 Ile174-Val177 Ala175-Val178 Leu196-Phe199 Phe199-Gly202 Asp282-Ala285 Ser295-His298 Val296-Ala299 Pro297-Ser300 Ala299-Ser302 Ala301-Pro304 Gln393-Gln396 Ala394-Glu397 Asp395-Leu398 |
Ser17-Phe20 Phe20-Val23 Asn37-Ser40 Thr44-Pro47 Gln48-Pro51 Pro51-Asp54 Leu52-Trp55 Ala101-Pro104 Lys127-His130 Gln135-Asn138 Arg137-Phe140 Val168-Gly171 His169-Thr172 Thr173-Asn176 Ala175-Val178 Leu196-Phe199 Tyr230-Lys233 Glu260-Ser263 Arg284-Arg287 Ala285-Arg288 Leu286-Ala289 Ser300-Arg303 Ala301-Pro304 Ser302-Arg305 Arg303-Val306 Pro304-Thr307 Arg305-Glu308 Met329-Gly332 Leu335-Val338 Ala392-Glu395 |
| γ- turns | Gly24-Arg26 (Inverse) Val25-Ala27 (Inverse) Gln134-Tyr136 (Inverse) Lys142-Phe144 (Inverse) Pro145-Leu147 (Inverse) Ile174-Asn176 (Classic) Pro198-Thr200 (Classic) Ala285-Arg287 (Inverse) Glu308-Ile310 (Inverse) Ala394-Gln396 (Classic) |
Leu103-Arg105 (Inverse) Gln166-Val168 (Classic) His169-Gly171 (Classic) Ile174-Asn176 (Inverse) Phe199-Glu201 (Classic) Ala299-Ala301 (Classic). |
Met16-Ala18 (Inverse) Leu19-Leu21 (Inverse) Asp54-Ala56 (Inverse) Lys170-Thr172 (Inverse) Leu286-Arg288 (Classic) Met329-Arg331 (Classic) |
Figure 5. The configuration of pore and pore-lining residues in APOL1 and its variants.
A. a. APOL1G0 pore. Pore configuration determined by the lowest coordinates along the x axis in the structure of APOL1G0 (Green), red spheres represent pore centers at 3 Å steps, and their radii are proportional to the corresponding measured diameter; pore densities are shown in black and grey, pore lining atoms and residues are shown in orange and blue respectively and K+ ions are shown as filled circles (yellow). b. APOL1 pore lining residues. The amino acid residues Ser342, Ile384 and Tyr389 are involved in pore formation. c. Diagramatic representation of APOL1G0 pore with significant residues. This depicts the pore shape- UDUD (D= decreasing diameter conical frustum, U=increasing diameter conical frustum and S=cylinder).
B. d. APOL1G1 pore. Pore configuration is depicted in colors as shown in Aa. e. APOL1G1 pore lining residues. The mutated residue Met384 is hydrophobic and may be involved in decreased selectivity of K+ ion. f. Diagramatic representation of APOL1G1 pore with significant residues. This displays the pore shape- UDUDUD shape of pore that means U=Increasing diameter conical frustum, D= decreasing diameter conical frustum, and S= cylinder.
C. g. APOL1G1 pore. Pore configuration is depicted in colors as shown in Aa. h. APOL1G1 pore lining residues. Tyr389 residue is deleted which can affect K+ ion transport. Lysine residues are structural feature for K+ ion selectivity and negatively charged residues such as Glutamate and Aspartate act as an entry gate and attract K+ ions. Polar residues facilitate K+ transport, while Valine and Glycine form hinges in the pore shape. i. Diagramatic representation of APOL1G2 pore with significant residues. This displays the pore shape- UDSUD (U=Increasing diameter conical frustum, D= decreasing diameter conical frustum, and S= cylinder).
Table 3.
The effect of APOL1 polymorphism on pore features
| Pore feature | APOL1G0 | APOL1G1 | APOL1G2 |
|---|---|---|---|
| Pore no. | 7 | 12 | 4 |
| Tunnel no. | 5 | 1 | |
| Residue type | positive (H,K,R), negative (D,E), neutral (S,T,N,Q), aliphatic (A,V, L, I, M), aromatic (F,Y,W), pro and gly (P,G) and cysteine (C) | positive (H,K,R), negative (D,E), neutral (S,T,N,Q), aliphatic (A,V, L, I, M), aromatic (F,Y,W), pro and gly (P,G) and cysteine (C). | positive (H,K,R), negative (D,E), neutral (S,T,N,Q), aliphatic (A,V, L, I, M), aromatic (F,Y,W), pro and gly (P,G) and cysteine (C). |
| Pore property | Polar, Hydrophilic, less hydrophobic | Polar, Hydrophilic, less hydrophobic | Polar, Hydrophilic, less hydrophobic |
| Pore shape | UDUD (D=decreasing diameter conical frustum, U=increasing diameter conical frustum and S=cylinder). | UDUDUD shape of pore that means U=Increasing diameter conical frustum, D=decreasing diameter conical frustum, and S=cylinder. | UDSUD (U=Increasing diameter conical frustum, D=decreasing diameter conical frustum, and S=cylinder). |
The structure of APOL1G1 has 18 helices with the number of residues ranging from 5 to 28 (Table 1). The amino-terminal signal peptide region has 4 α helices. The pore-forming domain has 8 α helices. The membrane addressing domain has 2 α helices, including Ala238 that is overlapping with the helix Lys232-Gln239 of the pore-forming domain. The C-terminal region has 4 large α helices. The structure of APOL1G1 has 24 β, and 6 γ turns (Table 2). The APOL1G1 structure has 12 pores and 1 tunnel. Here only pores longer than 25 Å and tunnel longer than 15 Å have been considered. Pores and tunnels are lined by residues type positive (H,K,R), negative (D,E), neutral (S,T,N,Q), aliphatic (A,V, L, I, M), aromatic (F,Y,W), pro and gly (P,G) and cysteine (C ). The average hydropathy index, average normalized hydrophobicity, and polarity of both pores and tunnels indicated that pores and tunnels are mostly polar and hydrophilic and less hydrophobic. The most important part of the structure is that APOL1G1 has UDUDUD shape of the pore (Table 3 and Fig. 5) (19–22).
The structure of APOL1G2 has 16 helices with the number of residues ranging from 4 to 27 (Table 1). The amino-terminal signal peptide region has 3 α helices. The pore-forming domain has 8 α helices including residues Trp235, Thr236, and Gln237 which overlap with the helix Trp234-Glu260 of membrane addressing domain. The membrane addressing domain has 2 α helices. The c-terminal region has 3 α helices. The ApoL1G2 structure has 30 β, and 6 γ turns. (Table 2) The most important part of the structure is that there are 4 pores of residue types positive (H,K,R), negative (D,E), neutral (S,T,N,Q), aliphatic (A,V, L, I, M), aromatic (F,Y,W), pro and gly (P,G) and cysteine (C ). The average hydropathy index, average normalized hydrophobicity, and polarity of both pores and tunnels indicated that pores and tunnels are mostly polar and hydrophilic and less hydrophobic. The shape of the pore is UDSUD (Table 3 and Fig. 5) (19–22).
The structure comparison of APOL1G0 and its variants suggested that there is a significant change in the overall root-mean-square deviation (RMSD) value. The individual RMSD values of APOL1G0 and G1 and APOL1G2 are 1.1808, 1.0920, and 1.4640, respectively. The overall RMSD is 2.175 with a Q score 0.2537. APOL1G0 and APOL1G1 both have 398 residues with two specific mutations (S342G and I384M) occur in APOL1G1. Moreover, the APOL1G2 has 396 residues with two deletions. The number of aligned residues is 247, and the number of aligned Secondary Structure Element (SSEs) match score is 6 (23).
Molecular Dynamic (MD) simulation of APOL1G0, APOL1G1, and APOL1G2
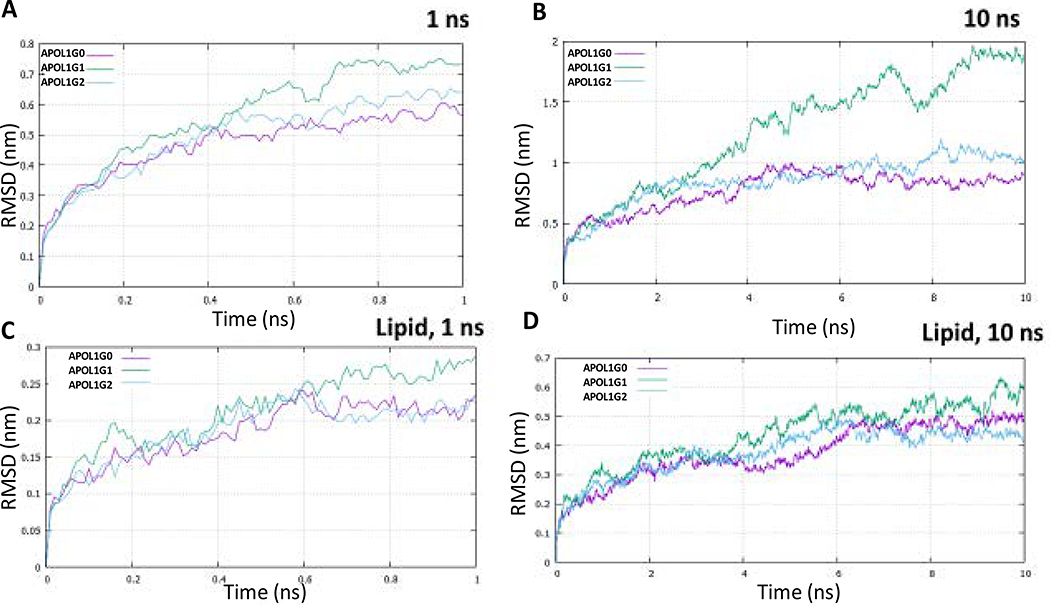
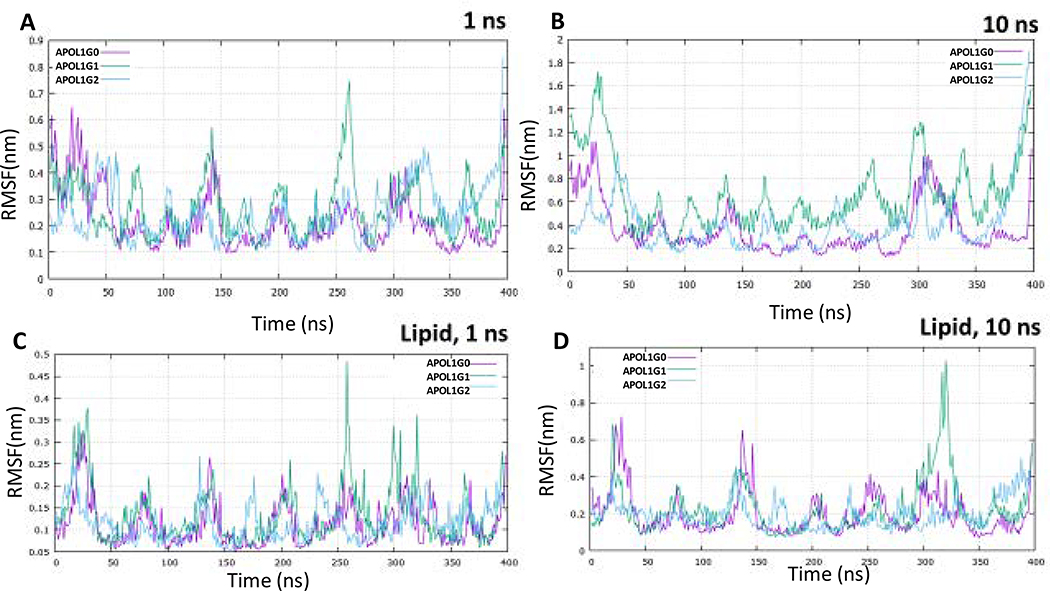
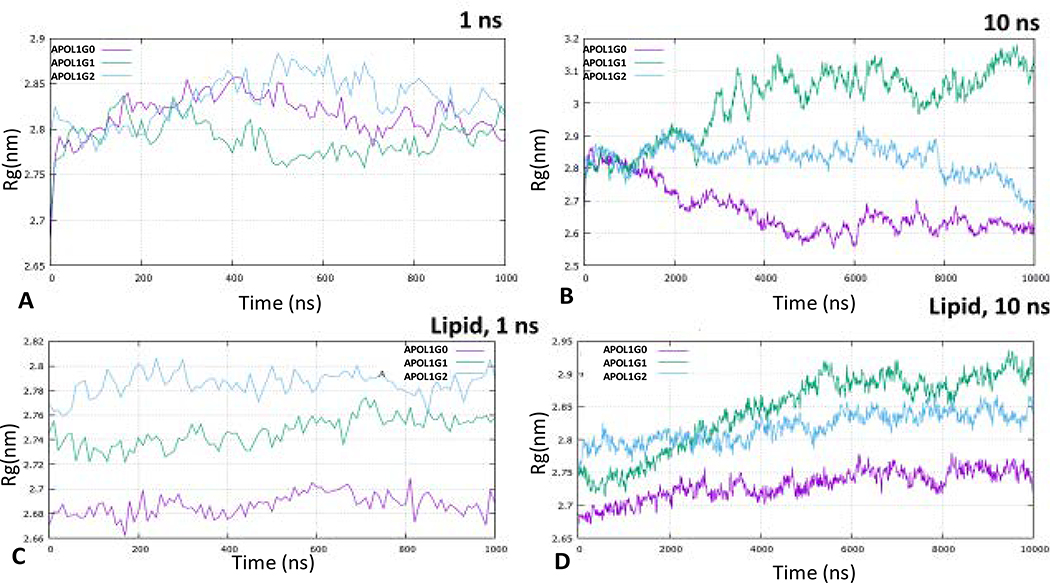
The molecular dynamics simulation of APOL1 and its variants for 1 ns and 10 ns shows that structurally APOL1G0 and APOL1G2 converge at lower energies in comparison to the APOL1G1 during the course of the simulation. The root mean square deviation (RMSD) values also show more deviation of APOL1G1 relative to the minimized and equilibrated structures in comparison to APOL1G0 and APOL1G2 both in 1 ns and 10 ns simulations (Fig. 6). The root means square fluctuation (RMSF) values of APOL1G1 and APOL1G2 show the higher fluctuation of residues in the pore-forming domain and also in the c-terminal region (Fig. 7). However, the radius of gyration (Rg) values indicated large changes in the APOL1G1 in comparison to the APOL1G0, which remains invariant, moreover, APOL1G2 shows a decrease after 10 ns of simulation. These values are represented in the plots (Fig. 8) The RMSD values from all trajectories after 10 ns simulation at the mutated residues in APOL1G1 show a significant deviation from the APOL1G0 structure. The RMSD of S342G in APOL1G0 (0.3014) and APOL1G1 (0.8073) and I384M in APOL1G0 (0.2854) and APOL1G1 (1.0318) shows a significant deviation that is probably due to the site-specific mutation. The residues in APOL1G2 at positions N388 (APOL1G0) and Y389 (APOL1G0) also show variation in terms of RMSD, i.e., K388 (1.2528) and I389 (1.2111) (Table 6).
Fig. 6. Root Mean Square Deviation (RMSD) for 1 and 10 nseconds.
A. RMSD of APOL1G0 (Pink), APOL1G1 (Green) and APOL1G2 (Cyan) simulation for 1 ns.
B. RMSD of APOL1G0 (Pink), APOL1G1 (Green) and APOL1G2 (Cyan) simulation for 10 ns without lipid membrane
C. RMSD of APOL1G0 (Pink), APOL1G1 (Green) and APOL1G2 (Cyan) simulation for 1 ns
D. RMSD of APOL1G0 (Pink), APOL1G1 (Green) and APOL1G2 (Cyan) simulation for 10 ns in Phosphatidylcholine (POPC) membrane.
Fig. 7. Root Mean Square Fluctuation (RMSF) simulation for 1 and 10 nseconds.
A. RMSF of APOL1G0 (Pink), APOL1G1 (Green) and APOL1G2 (Cyan) simulation for 1 ns
B. RMSF of APOL1G0 (Pink), APOL1G1 (Green) and APOL1G2 (Cyan) simulation for 10 ns without lipid membrane,
C. RMSF of APOL1G0 (Pink), APOL1G1 (Green) and APOL1G2 (Cyan) simulation for 1 ns
D. RMSF of APOL1G0 (Pink), APOL1G1 (Green) and APOL1G2 (Cyan) simulation for 10 ns in Phosphatidyl choline (POPC) membrane.
Fig. 8. Radius of gyration (Rg) simulation.
A. Radius of gyration (Rg) of APOL1G0 (Pink), APOL1G1 (Green) and APOL1G2 (Cyan) simulation for 1 ns
B. Radius of gyration (Rg) of APOL1G0 (Pink), APOL1G1 (Green) and APOL1G2 (Cyan) simulation for 10 ns without lipid membrane
C. Radius of gyration (Rg) of APOL1G0 (Pink), APOL1G1 (Green) and APOL1G2 (Cyan) simulation for 1 ns
D. Radius of gyration (Rg) of APOL1G0 (Pink), APOL1G1 (Green) and APOL1G2 (Cyan) simulation for 10 ns in Phosphatidylcholine (POPC) membrane.
Table 6:
Molecular Dynamics (MD) simulation parameters
| Simulation parameters | APOL1G0 | APOL1G1 | APOL1G2 |
|---|---|---|---|
| RMSD (Ser342Gly) 10 ns | 0.3014 | 0.8073 | |
| RMSD (Ile384Met) 10 ns | 0.2854 | 1.0318 | |
| RMSD (N388-K388) 10 ns | 1.2588 | ||
| RMSD (Y389-Ile389) 10 ns | 1.2111 | ||
| RMSD (Ser342Gly) 10 ns Lipid | 0.1014 | 0.1484 | |
| RMSD (Ile384Met) 10 ns Lipid | 0.0975 | 0.2085 | |
| RMSD (N388-K388) 10 ns, Lipid | 0.5014 | ||
| RMSD (Y389-Ile389) 10 ns, Lipid | 0.3694 | ||
| RMSF (Ser342Gly) 1 ns | 0.1122 | 0.1907 | |
| RMSF (Ser342Gly) 10 ns | 0.3014 | 0.8073 | |
| RMSF (Ser342Gly) 1 ns, Lipid | 0.0617 | 0.069 | |
| RMSF (Ser342Gly) 10 ns, Lipid | 0.1014 | 0.1486 | |
| RMSF (Ile384Met) 1 ns | 0.1282 | 0.2225 | |
| RMSF (Ile384Met)10 ns | 0.2854 | 1.0318 | |
| RMSF (Ile384Met) 1 ns, Lipid | 0.069 | 0.0906 | |
| RMSF (Ile342Met) 10 ns, Lipid | 0.0975 | 0.2085 | |
| RMSF (388) 1 ns | 0.3783 | ||
| RMSF (388) 10 ns | 1.2528 | ||
| RMSF (388) 1 ns, Lipid | 0.1655 | ||
| RMSF (388) 10 ns, Lipid | 0.5014 | ||
| RMSF (389) 1 ns | 0.4205 | ||
| RMSF (389) 10 ns | 1.2111 | ||
| RMSF (389) 1 ns, Lipid | 0.1475 | ||
| RMSF (389) 10 ns, Lipid | 0.3694 |
MD simulation of APOL1G0, APOL1G1, and APOL1G2 in the lipid membrane
The molecular dynamics simulation of APOL1G0, APOL1G1, and APOL1G2 in the lipid bilayer (POPC) for one ns and 10 ns suggests that lipid interaction with APOL1 and its variants plays an important role in the stabilization of APOL1 in the membrane as indicated by the RMSD, RMSF values. The trajectories indicated that APOL1G0 and its variants APOL1G1 and APOL1G2 show RMSD in the range of 0.4–0.6 nm (Fig. 6), however, there is more fluctuation in APOL1G1 in the pore-forming domain and in APOL1G2 in the C-terminal region in terms of RMSF values (Fig. 7). The fluctuation in APOL1G1 also indicates the gating mechanism involved in the pore that lipid interaction of pore-lining residues in the membrane opens up a gate for abruption transport. The RMSD values of S342G in APOL1G0 (0.1014) and APOL1G1 (0.1484) and I384M in APOL1G0 (0.0975) and APOL1G1 (0.2085) indicated a significant decrease in the RMSD values because of the lipid interaction. The residues in APOL1G2 at positions N388 (APOL1G0) and Y389 (APOL1G0) also show a reduction in deviation in terms of RMSD, i.e., K388 (0.5014) and I389 (0.3694); moreover, the RMSF values also show a decrease in the lipid. The Radius of gyration (Rg) values indicate the compactness of structures in the membrane, while the variants are still showing higher Rg values than APOL1G0 in the folded form over the course of 10ns simulation (Fig. 8).
Evaluation of membrane integration and orientation
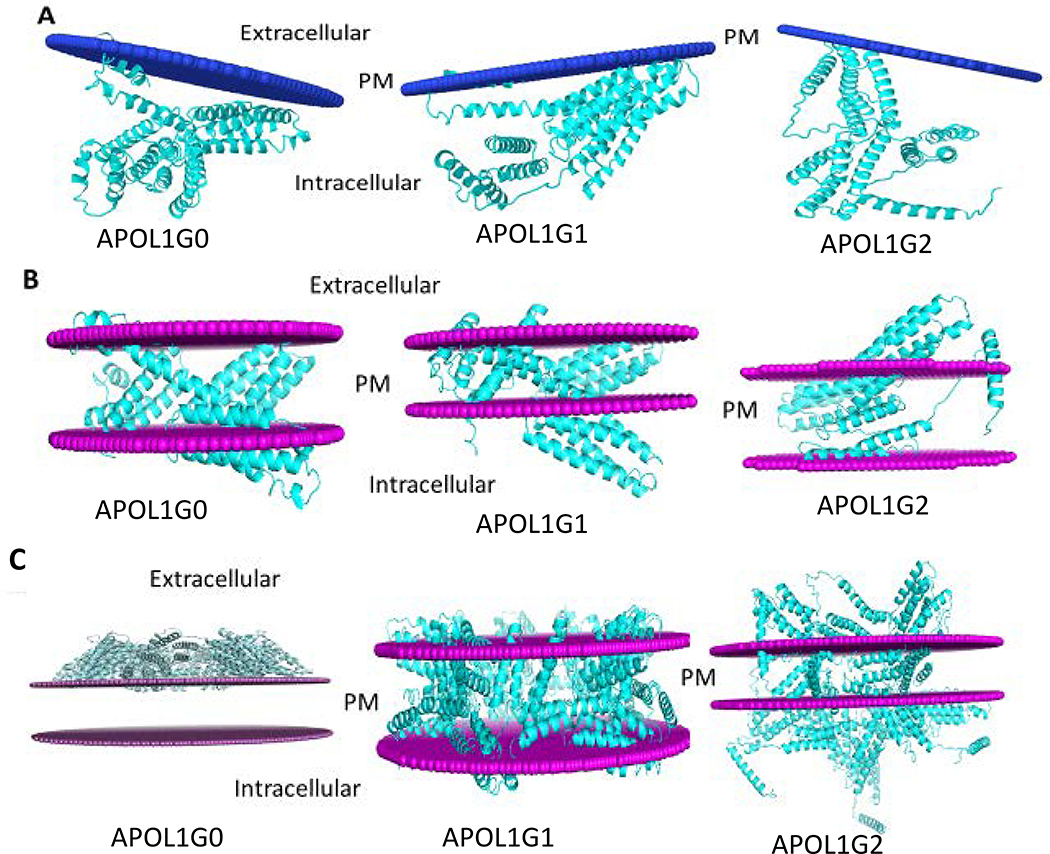
The membrane integration analysis of APOL1 and its variants suggested that there are different possibilities of membrane integration in case of APOL1 and its variants (Fig. 9). There is one possibility that APOL1 is a peripheral protein, and just membrane interacting helices are attached to the membrane. The membrane orientation analysis of peripheral protein model of APOL1 and its variants indicated that APOL1G0 is oriented in the membrane with depth/hydrophobic thickness 5.6 ± 2.0 Å, ΔGtransfer −8.3 kcal/mol and Tilt Angle 84 ± 8°. The interacting membrane residues are Ser10, Cys13, Trp15-Ser17, and Leu19-Val23. The APOL1G1 is oriented in the membrane with depth/hydrophobic thickness 4.9 ± 0.6 Å, ΔGtransfer −11.0 kcal/mol and Tilt Angle 80 ± 3°. The interacting membrane residues are Glu2, Ala5-Leu6, Val9-Ser10, Leu12-Leu21, Val79, Thr81, Leu86, Trp129, and Gln134. The APOL1G2 is oriented in the membrane with depth/hydrophobic thickness 4.5 ± 2.9 Å, ΔGtransfer −5.6 kcal/mol and Tilt Angle 47 ± 12°. The membrane interacting residues are Leu12, Trp15-Ala18, and Trp234 (Table 4) (24).
Figure 9. The membrane interaction models for APOL1G0, APOL1G1, and APOL1G2.
A. Peripheral protein model. In this model only membrane interacting helices are attached to the membrane. In APOL1G0, the membrane interacting residues are Ser10, Cys13, Trp15-Ser17 and Leu19-Val23. In APOL1G1, the membrane interacting residues are Glu2, Ala5-Leu6, Val9-Ser10, Leu12-Leu21, Val79, Thr81, Leu86, Trp129 and Gln134. In APOL1G2, the membrane interacting residues are Leu12, Trp15-Ala18 and Trp234.
B. Intgral membrane protein model. In this model APOL1 and its variants have some transmembrane regions. APOL1G0 has 5 transmembrane segments and the hydrophobic thickness is 25.2 Å, APOL1G1 has 7 transmembrane segments and the hydrophobic thickness is 19.8 Å, APOL1G2 has 2 transmembrane segments and the hydrophobic thickness is 33.0 Å.
C. Multimer model of APOL1 variants APOL1G1 and APOL1G2. In this model, APOL1 variants APOL1G1 and APOL1G2 can form multimer in the membrane, however, APOL1G0 multimer is not energetically favorable.
Table 4.
The effect of APOL1 polymorphism on the membrane integration
| Membrane Interaction | APOL1G0 | APOL1G1 | APOL1G2 |
|---|---|---|---|
| depth/hydrophobic thickness | 5.6 ± 2.0 Å | 4.9 ± 0.6 Å | 4.5 ± 2.9 Å |
| ΔGtransfer | −8.3 kcal/mol | −11.0 kcal/mol | −5.6 kcal/mol |
| Tilt Angle | 84 ± 8° | 80 ± 3° | 47 ± 12° |
| Membrane interacting residues | Ser10, Cys13, Trp15-Ser17 and Leu19-Val23 | Glu2, Ala5-Leu6, Val9-Ser10, Leu12-Leu21, Val79, Thr81, Leu86, Trp129 and Gln134 | Leu12, Trp15-Ala18 and Trp234 |
Another possibility is that APOL1 and its variants have some transmembrane regions; for example, APOL1G0 has hydrophobic thickness 25.2 Å, there are 5 TM (Transmembrane) segments. The APOL1G1 has a hydrophobic thickness of 19.8 Å, and there are 7 TM (Transmembrane) segments. The APOL1G2 has a hydrophobic thickness of 33.0 Å, and there are 2 TM (Transmembrane) segments. (Table 5) (25).
Table 5.
The effect of APOL1 polymorphism on transmembrane properties
| Transmembrane properties | APOL1G0 | APOL1G1 | APOL1G2 |
|---|---|---|---|
| Membrane thickness | 25.2 Å | 19.8 Å | 33.0 Å |
| Transmembrane segments | Gln35-Ser64 (Tilt: 62.3°), Gly171-Ala197 (Tilt: 58.6°), Phe199-Thr221 (Tilt: 42.5°), S342-S365 (Tilt: 50.6°), Thr367-Ala394 (Tilt: 55.7°) | Ala32-Thr59 (Tilt: 64.4°), Gly171-Leu196 (Tilt: 66.5°), Glu201-Ala218 (Tilt: 58.5°), Gly231-Ser263 (Tilt: 67.5°), Pro324-Ala339 (Tilt: 40.8°), Val341-Leu359 (Tilt: 50.2°), Ala375-Tyr389 (Tilt: 44.4°) | Phe199-Glu308 (Tilt: 11.9°), Met329-Ala363 (Tilt: 62.4°) |
| Multimer hydrophobic thickness | No multimer | 30.0 Å | 24.6 Å |
| Segments | Not any. | chain A:Lys148-Leu189 (Tilt: 30.6°), chain A:Lys372-Gln393 (Tilt: 32.0°), chain C: Lys148-Leu189 (Tilt: 29.4°), chain C: Lys373-Ala394 (Tilt: 28.2°), chain B: Lys148-Leu189 (Tilt: 29.9°), chain B: Lys372-Gln393 (Tilt: 32.4°), chain E: Lys148-Leu189 (Tilt: 30.5°), chain E: Lys372-Gln393 (Tilt: 31.3°), chain D: Lys148-Leu189 (Tilt: 29.7°) chain D: Lys373-Ala394 (Tilt:27.5°) | chain A: Ser40-Met60 (Tilt: 22.7°), chain A: Gly202-Asp229 (Tilt: 54.7°), chain A: Gln237-Arg255 (Tilt: 44.0°), chain C: Glu201-Ala312 (Tilt: 45.5°), chain C: Ser314-Glu361 (Tilt: 56.1°), chain B: Asn264-Glu316 (Tilt: 35.2°), chain B: Ala339-His360 (Tilt: 51.6°) |
| overall surface area | - | 107613.7 Å2 | 111551.4 Å2 |
| buried area | 17134.0 Å2 | 12601.5 Å2 | 15862.1 Å2 |
| solvation free energy gain (ΔGint) | −12.6 kcal/mol | −48.9 kcal/mol | −54.9 kcal/mol |
| free energy of assembly dissociation (ΔGdiss) | −27.6 kcal/mol | 6.5 kcal/mol | 25.7 kcal/mol |
| rigid body entropy change at dissociation (TΔSdiss) | 60.9 kcal/mol | 60.3 kcal/mol | 61.3 kcal/mol |
| Symmetry no | Multimer not favorable | 5 | 5 |
We also tested the hypothesis that APOL1 variants (APOL1G1 and APOL1G2) form multimers in the membrane, and the multimer models (26) suggested that APOL1G1 multimer (pentamer) has a hydrophobic thickness of 30.0 Å. (Table 5) (25). The thermodynamic properties (27) of APOL1G1 multimers suggested that overall surface area is 107613.7 Å2, the buried area is 12601.5 Å2. ΔGint that indicates the solvation free energy gain upon the formation of the assembly in kcal/mol is −48.9 kcal/mol. The value of ΔGdiss, which indicates the free energy of assembly dissociation in kcal/mol, is 6.5 kcal/mol. The free energy of dissociation corresponds to the free energy difference between dissociated and associated states. Positive values of ΔGdiss indicate that an external driving force should be applied in order to dissociate the assembly; therefore, the assemblies with ΔGdiss ˃ 0 are thermodynamically stable. The rigid body entropy change at dissociation TΔSdiss in kcal/mol is 60.3kcal/mol. The symmetry number that indicates the number of different but equivalent orientations of the assembly, which can be obtained by rotation, its value is 5. The APOL1G2 multimer (pentamer) has a hydrophobic thickness of 24.6 Å. (Table 5) The thermodynamic properties of APOL1G2 multimers suggested that overall surface area is 111551.4 Å2, the buried area is 15862.1 Å2 ΔGint that indicates the solvation free energy gain upon the formation of the assembly in kcal/mol. is −54.9 kcal/mol. The value of ΔGdiss, which indicates the free energy of assembly dissociation in kcal/mol, is 25.7 kcal/mol. The free energy of dissociation corresponds to the free energy difference between dissociated and associated states. Positive values of ΔGdiss indicate that an external driving force should be applied in order to dissociate the assembly; therefore, the assemblies with ΔGdiss ˃ 0 are thermodynamically stable. The rigid body entropy change at dissociation TΔSdiss in kcal/mol is 61.3kcal/mol. The symmetry number that indicates the number of different but equivalent orientations of the assembly, which can be obtained by rotation, its value is 5. The thermodynamic properties indicate that APOL1G2 is the most stable structure in multimer form. The thermodynamic properties of APOL1G0 multimer suggested that buried area is 17134.0 Å2, ΔGint that indicates the solvation free energy gain upon the formation of the assembly in kcal/mol. is −12.6 kcal/mol. The value of ΔGdiss, which indicates the free energy of assembly dissociation in kcal/mol, is −27.6 kcal/mol. The rigid body entropy change at dissociation TΔSdiss in kcal/mol is 60.9 kcal/mol. Here, the negative value of free energy of assembly dissociation indicates that the multimer of APOL1G0 is not favorable thermodynamically and also it does not integrate into the lipid bilayer (27).
We are mainly focusing the structure and shape of the pores present in the structure of APOL1, and its variants and the role of C-terminal region in the ion transport mediated by APOL1 as APOL1 is a known K+ ion transporter (22). The pore-lining residues of APOL1G0 include Glu63, Glu213, Leu220, Arg159, Gly58, Val177, Pro51, Lys50, Asn176, Asp46, Glu379, Glu380, Lys381, and Tyr389. The pore-lining residues in APOL1G1 are Pro62, Ala219, Ile223, Val177, Thr173, Gly180, Glu102, Pro47, Val350, Glu379, Leu382, Asn383, Met384, Leu385, and Tyr389. The pore-lining residues in APOL1G2 include Met228, Ile174, Thr224, Ile223, Arg255, Glu213, Pro210, Phe257, Leu196, Asn261, Ile262, Phe199, Thr200, Ile68, Arg156, Ser263, Glu152, Glu69, and Lys76 (22).
The pore in APOL1G0 seems to be an open type that usually transports K+ ion outward, but the variants G1 and G2 have mutations, and the conformational changes in their structures seem to be responsible for abrupt K+ ion efflux leading to a decreased K+ ion in the intracellular region. The constricted or decreasing diameter of the pores in G1 and G2 variants and the pore-lining residues could play an important role in ion selectivity and increased the binding affinity of K+ ion towards extracellular region causing more K+ efflux. In APOL1G0, there are two Glutamate residues (Glu63 and Glu213) at the extracellular side of the pore and may be acting as a gate. The residues Val177 in the middle of the pore may serve as a ‘hinge’ to open and close the ‘gate.’ The next amino acid Gly58 may show a low affinity for K+ ion, thus acting as a regulator. The presence of Tyr389 shows strong binding affinity towards K+ ion, that assists in the transport of K+ ion from the intracellular region to the extracellular region. It is observed that c-terminal residues Ser342, Ile384, and Tyr389 are also acting as pore-lining residues, so mutations in these residues may induce conformational changes in the pore structure and shape. The residues Val177, Val350, and Pro47 may constrict the pore in the structure of ApoL1 G1, whereas, Lys167 and Lys170 may provide some hydrophilic properties for ion transport and selectivity for monovalent cations over multivalent cations. Moreover, the mutated residues Gly342 and Met384 may provide conformational changes in the pore shape, and the hydrophobic residue Met384 may be involved in decreased selectivity for cations in APOL1G1. The residue Thr336 may act as a regulator in the intracellular region. In the APOL1G2 pore, the Glu213 residue may act as gate and Val192, Val244 may act as a hinge. The residue Met228 may be involved in decreased selectivity for cations. The leucine residues Leu248 and Leu251 may have an important role in the transduction of charge movement into channel opening and closing. Lys148 may provide some basic property and may facilitate K+ selection by electrostatically repelling other cations to a highly selective location sandwiched by the carboxylate groups of Asp163 and Glu69 at the constriction site. The highest binding energy of Na+ is observed at the valine residues in the middle, and the binding energy of Na+ subsequently decreases from intracellular to extracellular region. The K+- Efflux in ApoL1 variants may be associated with Ca2+ mediated Cl− influx causing toxicity and cell death.
Determination of electrostatic properties and pKa calculation
The electrostatic properties (28) such as pKa values and the plot between free energy change and pH or charge and pH suggested that the value of free energy change in APOL1 G0 is the lower at neutral pH in comparison to variants APOL1G1, while in APOL1G2 the free energy change is the smallest (Suppl. Fig. 1). The free energy change in APOL1G0 at pH 5 is 33.75 kJ/mol, at pH 7 it is 10.55 kJ/mol, and at pH 10 it is 13.95 kJ/mol, and in APOL1G1 the values of free energy change at pH 5 is 135.42 kJ/mol, at pH 7 it is 122.67 kJ/mol and at pH 10 it is 135.72 kJ/mol. The free energy change in APOL1G2 at pH 5 is −120.67 kJ/mol, at pH 7 it is −153.17 kJ/mol, and at pH 10 it is −155.92 kJ/mol. The values of free energy change between the pH ranges indicate about the conformational changes in the APOL1 structure, and at neutral pH APOL1 variants APOL1G2 and APOL1G1 seem to be more stable structures in comparison to APOL1G0. Also, the structures of APOL1 and its variants are negatively charged between pH 5 to pH 10, which indicates that amino acid residues are deprotonated and polar residues are exposed to the solvent. The charge on APOL1G0, APOL1G1, and APOL1G2 at neutral pH (pH7) is −5.66, −4.62 and −5.95 respectively. This supports the idea that APOL1 acts as a cation transporter at neutral pH. The charge and pH plot indicate that at lower pH (pH<5) the protein is positively charged or amino acids are protonated and at higher pH (pH>10) the protein is negatively charged, or amino acids are deprotonated (Suppl. Fig. 2). This also indicates that pH change may regulate the protein folding and the multimer model of APOL1 variants could be possible at a certain pH range as a change in pH can disrupt hydrogen bonds and salt bridges which are mainly responsible for aggregate formation. This also indicates that some other molecule protein or lipid may be involved in the membrane integration of APOL1, which is able to neutralize the amino acid residues at pH 5 to pH10. This also serves the compartmentalization of APOL1 and its variants (28).
Evaluation of Phosphatidic acid (PA) binding with APOL1 and its variants
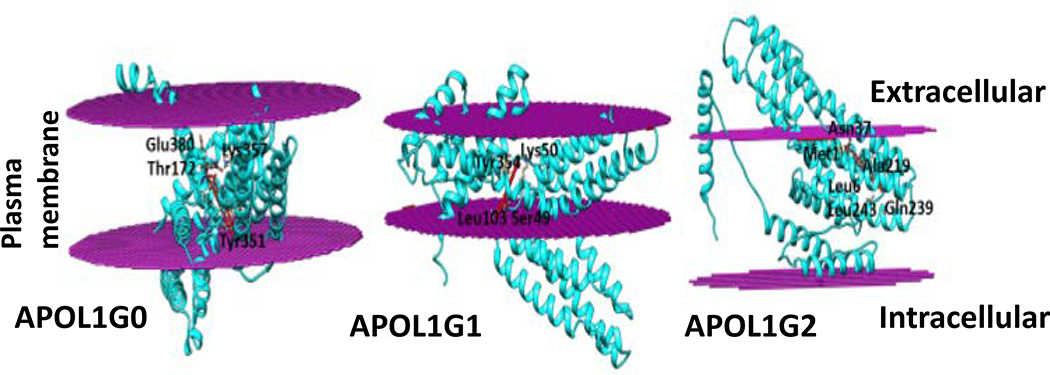
Phosphatidic acid (PA) is a phospholipid that consists of a glycerol backbone, with, a saturated fatty acid bonded to the first carbon, and an unsaturated fatty acid bonded to the second carbon and a phosphate group bonded to the third carbon. Phosphatidic acids are negatively charged, and they constitute about 0.25 % of phospholipids in the bilayer. The docking of Phosphatidic acid (29) into APOL1 and its variants suggested that the Phosphatidic acid interacts with residues Asp46, Lys50, Thr172, Asn176 and c-terminal residues Tyr351, Lys357, Glu379 and Glu380 in ApoL1G0, and with Ser49, Lys50, Leu103, Ile174 and Tyr354 residues in APOL1G1 and with Met1, Leu6, Ala30, Asn37, Ala219, Gln239 and Leu243 residues in APOL1G2 (Fig. 10).
Figure 10. Interaction of APOL1 and its variants with Phosphatidic acid (PA).
APOL1G0, APOL1G1 and APOL1G2 (cyan) interact with Phosphatidic acid (red). Some interacting residues are shown. The Phosphatidic acid interacts with residues Asp46, Lys50, Thr172, Asn176 and c-terminal residues Tyr351, Lys357, Glu379 and Glu380 in ApoL1G0, and with Ser49, Lys50, Leu103, Ile174 and Tyr354 residues in ApoL1G1 and with Met1, Leu6, Ala30, Asn37, Ala219, Gln239 and Leu243 residues in ApoL1G2.
APOL1G0, APOL1G1, and APOL1G2 (cyan) interact with Phosphatidic acid (red).
Some interacting residues are shown.
Evaluation of grid formation and docking of Glyburide
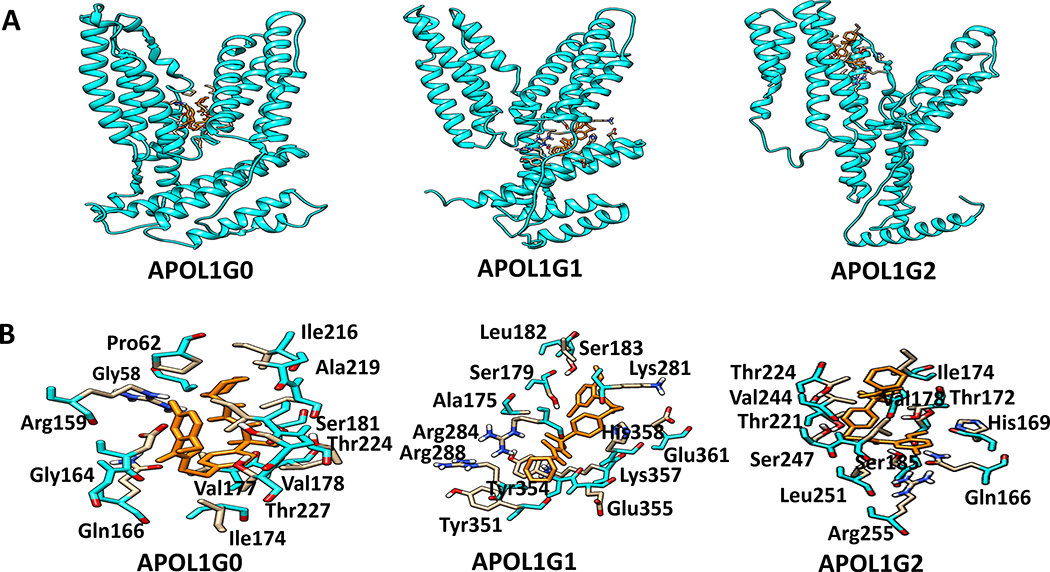
The ligand-binding pockets in the APOL1 G0, G1 and G2 complexes were calculated using AutoSite module of AutoGridFR tool (30). It provided several ligand-binding pockets defined as subsets of high-affinity grid points on a 1 Å resolution grid. The pocket with highest AutoSite score (30), i.e., for G0 37.75, RadGyr 3.66 and Burriedness 0.98; for G1, 139.91, RadGyr 5.69 and Burriedness 0.89, and for G2, 144.03, RadGyr 3.30, and Burriedness 0.98 were selected, and specific grid center was generated. The Na+-K+ ion channel blocker Glyburide (31) was docked into the APOL1 G0, G1, and G2 structures using AutoDock4 (32). For docking purpose, protein and the ligand were prepared using AutoDock Tools-1.5.6 (32). For APOL1G0, a grid centered at (80.089, 72.532, 73.507) with dimensions 36X38X44 (Å3 ) and 0.375 Å spacing, for APOL1G1, a grid centered at (81.261, 82.517, 74.857) with dimensions 40X53X72 (Å3 ) and 0.375 Å spacing, and for APOL1G2 a grid centered at (81.968, 55.365, 76.771) with dimensions 36X46X44 (Å3 ) and 0.375 Å spacing were used to map calculations and Lamarckian Genetic Algorithm was used for docking. The calculation of energy maps and docking of ligand were performed by AutoGrid4 and AutoDock4 programs, respectively. The docking conformations were analyzed by converting docking conformations into PDB files and visualizing in PyMol and Chimera (Fig. 11A) (33, 34). The top rank docked model of APOL1G0–Glyburide complex showed binding energy of −0.77 kcal/mol and estimated inhibition constant (Ki) value 272.90mM, the APOL1G1-Glyburide complex showed binding energy of −8.17kcal/mol and calculated inhibition constant (Ki) value 1.03μM, and RMSD from initial structure 123.594 Å, while, the APOL1G2-Glyburide complex showed binding energy of −8.17kcal/mol and estimated inhibition constant (Ki) value 1.03μM, and RMSD from initial structure 123.594 Å. Based on the binding energy it seems that Glyburide binding with APOL1G1 and APOL1G2 is stronger and the estimated inhibition constant (Ki) values are also less in comparison to APOL1G0 that indicates that Glyburide is a more potent inhibitor of APOL1G1 and APOL1G2.
Figure 11. The docking of a specific ATP sensitive K+ Efflux inhibitor on APOL1.
A. Binding sites of K+-efflux on APOL1 and its variants are displayed. Binding site of Glyburide (orange) in the APOL1G0, APOL1G1 and APOL1G2 structures.
B. Glyburide (orange) interacting residues. The Glyburide interacting residues in ApoL1G0 include Arg159, Pro62, Leu220, Ile216, Ser181, Val177, Gln166, Asp163, Ala57, Ile223, Thr224, Thr227, and Val178. The residue Arg284 forms a hydrogen bond with Glyburide. In the ApoL1G1-Glyburide complex, the glyburide interacting residues include Ser179, Leu182, Ser183, Lys281, Glu361, His358, Tyr354, Glu355, Arg288, Arg284, Lys357, and Tyr351. The residue Arg284 forms a hydrogen bond with Glyburide. The Glyburide interacting residues in ApoL1G2 include Thr224, Val244, Ser247, Leu251, Arg255, Gln166, His169, Ser185, Ser181, Thr221, Val178, and Leu248. The residue Ser185 forms hydrogen bond with Glyburide.
The interaction of APOL1G0 and its variants APOL1G1 and APOL1G2 with Glyburide suggested that the Glyburide interacting residues in APOL1G0 include Arg159, Pro62, Leu220, Ile216, Ser181, Val177, Gln166, Asp163, Ala57, Ile223, Thr224, Thr227, and Val178 (Fig. 11B). The residue Arg284 forms a hydrogen bond with Glyburide. In the APOL1G1-Glyburide complex, the glyburide interacting residues include Ser179, Leu182, Ser183, Lys281, Glu361, His358, Tyr354, Glu355, Arg288, Arg284, Lys357, and Tyr351. The residue Arg284 forms a hydrogen bond with Glyburide. The Glyburide interacting residues in APOL1G2 include Thr224, Val244, Ser247, Leu251, Arg255, Gln166, His169, Ser185, Ser181, Thr221, Val178, and Leu248. The residue Ser185 forms a hydrogen bond with Glyburide. The Serine residues interact with the hydroxyl group of the ligand and also may be involved in phosphorylation.
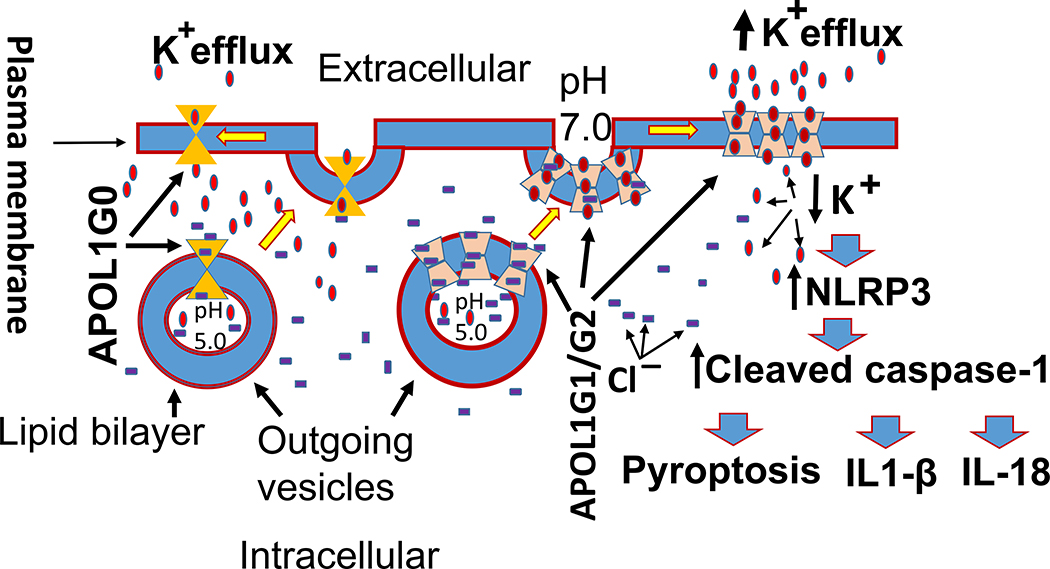
APOL1 and its variants insertion in outgoing vesicles at low and resuming the function of K+ selective transporter at neutral pH in the plasma membrane have been shown in a schematic diagram in Fig. 12. In brief, APOL1 channels are inserted into lipid bilayer in outgoing vesicle at low pH; however, APOL1 channel is chloride selective (Cl−) at low pH. After resuming a part of the plasma membrane, APOL1 channels become K+ selective at neutral pH. APOL1G1/G2 channels have altered the structural configuration and are favored for multimeric phenotype and thus, contribute to enhanced K+ efflux.
Figure 12. Schematic diagram showing insertion of APOL1 and its variants initially in outgoing vesicles and subsequently contributing plasma membrane.
Initially, APOL1 channels are inserted into lipid bilayer in outgoing vesicle at low pH. At low pH, the APOL1 channel is chloride selective (Cl−). However, in the plasma membrane at neutral pH, APOL1 channels become K+ selective and predominantly transport cations. APOL1G1/G2 channels because of mutated amino acid residues, altered structural configuration, and being favored for multimeric phenotype contribute to enhanced K+ efflux.
Discussion
In the present study, we have demonstrated that the expression of APOL1 risk alleles enhanced K+ efflux and stimulated the transcription and translation of proteins involved in the formation of inflammasomes; as expected, APOL1G1- and APOL1G2- expressing podocytes showed a higher percentage of pyroptosed cells. Interestingly, glyburide inhibited the transcription of NLRP3, IL1-β, and IL-18 in APOL1 risk and non-risk milieus. Utilization of bioinformatics studies revealed aligned regions through the superimposition of structures of APOL1G0, APOLG1, and APOL1G2. The analysis of pore-lining residues showed that residues Ser342 and Tyr389 are involved in APOL1G0. Since the mutated residue Met384 is hydrophobic, it could be contributing to decreased selectivity of K+ ion, thus resulting in enhanced flow of K+ ions through APOL1G1 pores. Similarly, deletion of Tyr389 residue would also facilitate K+ ion translocation through APOL1G2 pores. Additionally, alterations in amino acid residues also changed the morphology of pores, which might promote K+ efflux in APOL1G1 and APOL1G2 milieus. Interestingly, analysis of membrane interaction models demonstrated that the multimer protein model is feasible only in APOL1G1 and APOL1G2 milieus. In that scenario, the insertion of APOL1G1 and APOL1G2 would increase the number of pores for the transport of K+ ions. Protein-substrate/ligand interaction studies between glyburide (a K+ efflux inhibitor) and APOL1G0/APOLG1/APOL1G2 revealed strong binding of glyburide with APOL1G1s and APOL1G2s at lower concentrations. There was an altered relationship between energy level and pH in APOL1G0 when compared to APOL1G1 and APOL1G2; similarly, there was a different relationship between charge and pH when compared APOL1G0 to APOL1G1 and APOL1G2. These results support our hypothesis that altered pore configurations, energy level, charge, and pH carry the potential to facilitate K+ ion transport in APOL1 risk milieu.
Expression of APOL1G1 and APOL1G2 has been associated with inflammasome formation in podocytes both in vitro and in vivo studies (17). K+ efflux is the common trigger for NLRP3 inflammasome activation by bacterial toxins and particulate matter (35). In these studies, reduction of intracellular concentration triggered activation of NLRP3 inflammasomes. APOL1 variants have also been reported to enhance K+ efflux and associated downstream signaling (13). In the present study, glyburide an inhibitor of K+ efflux (36) inhibited the transcription of NLRP3 in podocytes expressing APOL1 variants confirming the role of K+ efflux in inflammasomes formation in podocytes. Docking studies of glyburide also suggested favorable interaction with APLOL1G1 and APLOL1G2.
APOL1 has been shown to confer chloride sensitive permeability to preformed phospholipid vesicles, and this selectivity only occurs at low pH (37). However, when these vesicles were brought to neutral pH, chloride permeability was suppressed, and potassium permeability predominated (37). Lysine residues are a structural feature for K+ ion selectivity, and negatively charged residues such as Glutamate and Aspartate act as an entry gate and attract K+ ions. Polar residues facilitate K+ transport, while Valine and Glycine form hinges in the pore shape. In the present study, the amino acid residues Ser342, Ile384, and Tyr389 were involved in pore formation in APOL1 G0, whereas, in APOL1G1, the mutated residue Met384 is hydrophobic and could be contributing to decreased selectivity for K+ ions. Similarly, deletion of Tyr389 residue would also alter K+ ion movement.
The structural configuration of a pore, net charge, and size play a role in cation transport (38). The shape is determined by the pore-lining amino acid residues. In the present study, alterations in amino acid residues were associated with pores with different configurations. APOL1G0 constituted the UDUD pores, whereas APOL1G1 and APOL1G2 formed UDUDUD and UDSUD pores, respectively. Mobility and pace of flow of cations could be affected by regional constriction and dilatation of pores. It is likely that altered structural configurations of these pores might have also contributed to enhanced K+ efflux in APOL1 risk milieus. Currently, we can only speculate on this aspect in the absence of the development of the crystal structure of APOL1 non-risk and risk proteins. We plan to carry out these important studies in the near future.
The number of cation channels in the plasma membrane is dependent on the monomer or multimer insertion of proteins. Theoretically, protein insertion into lipid bilayer may occur with different configurations. In the present study, we have studied three interaction models of protein insertion of APOL1G0, APOLG1, and APOL1G2. Only APOL1G1 and APOL1G2 favored the formation of multimer models; the latter carries a potential for enhanced cation transport. We observed that APOL1G0 was not energetically favorable.
APOL1 has been reported to bind to Phosphatidic acid with high affinity (39); phosphatidic acid is negatively charged and comprises approximately 0.25 % of phospholipids in the lipid bilayer. The presence of negatively charged phospholipids such as Phosphatidic acids facilitates the insertion of APOL1 in a lipid bilayer at low pH (12). In the present study, we modeled the docking of Phosphatidic acid into APOL1 and its variants. We observed that the Phosphatidic acid interacts with different amino acid residues in APOL1 and its variants. At present, the role of disparate docking pattern of Phosphatidic acid on ion channel transport is not clear; however, it will be worth investigating in future studies.
There is an ongoing controversy regarding the role of cellular expression of APOL1 risk alleles in terms of gain or loss of function (40). As far as the present study is concerned, APOL1G1 and APOL1G2 contributed to the altered structural configuration of channels which is likely to contribute to K+ efflux. On that account, it appears to be a gain of function. However, kidney biopsy specimens have shown a decreased expression of APOL1 in patients carrying APOL1 risk alleles (41). Nonetheless, it is not clear whether the reduced expression was a consequence of ongoing cellular injury or it was because of alterations in gene product in APOL1 risk milieu (42). One may argue that lower expression of APOL1 risk alleles could be potentially toxic in vivo, and one need not compare them with the expression levels of APOL1 in vitro studies. This notion is further supported by the enhanced expression of APOL1 variants by podocytes in HIVAN patients (43).
We conclude that APOL1 risk proteins carry the potential of altering the structural configuration of pores resulting in the modulation of cation channel transport activity.
Material and Methods
Human podocytes
Human podocytes (PDs) were conditionally immortalized by introducing temperature-sensitive SV40-T antigen by transfection (44). These cells proliferate at the permissive temperature (33˚C) and enter growth arrest after transfer to the non-permissive temperature (37˚C). The growth medium contained RPMI 1640 supplemented with 10% fetal bovine serum (FBS), 1× Pen-Strep, 1 mM L-glutamine, and 1× ITS (Invitrogen). The DNA sequencing of these podocytes revealed the endogenous APOL1G0 genotype.
Lentivirus preparation
For the preparation of lentivirus, we have describing the method published in our earlier publication (18). To amplify the DNA fragments corresponding to the whole APOL1 open reading frames, a forward primer GGATCCATGGAGGGAGCTGCTTTGCTGAGAG (BamHI cleavage site underlined) and reverse primer GTCGACTCACAGTTCTTGGTCCGCCTGCAG (SalI cleavage site underlined) were designed based on the sequences around the initial and stop codons, respectively. The PCR-amplified products were double-digested with BamHI and SalI and subcloned into an LG12 lentiviral vector to obtain a transfer plasmid designated LG12-“APOL1” 5. The transcription of targeting genes was driven by a CMV promoter. psPAX2 was the HIV-derived packaging construct, and the pMD2.G construct expressed the VSV-G envelope protein. The APOL1 lentivirus was produced by transfection of 293T cells by using Effectene Transfection Reagent (Qiagen), and the virus titer was determined by using QuickTiter Lentivirus Titer Kit (Cell Biolabs, San Diego, CA), following the manufacturer’s instructions (18).
Morphologic assay for pyroptosis
Pyroptosis is characterized by condensed nuclei and induction of pore formation in the cytoplasmic membrane. For morphologic evaluation of pyroptosis, we have used the method described in our earlier publication (45). To differentiate between types of cell death, we carried out morphologic assay of control and experimental cells with the use of Hoechst 33342 to label nuclei in normal cells (normal fluorescence, blue) or apoptosed cells (bright fluorescence by fragmented and/or condensed nuclei) and propidium iodide (PI) to label nuclei (pink) in cells with large cytoplasmic pores (pyroptosis and necrosis) (45). This double staining allowed us to identify normal cells (average fluorescence by Hoechst stained nuclei), apoptosed cells (bright fluorescence by Hoechst stained condensed nuclei), pyroptosed cells (PI stained condensed pink nuclei with swollen cell), necrosed cells (swollen cells with PI stained swollen pink nuclei). Hoechst and PI staining were performed for morphologic assay of cell death in control and experimental cells. In brief, in control and experimental cells,culture media was removed, and fresh media containing Hoechst 33342 (10 μg/ml) was added for 10 min at 37°C. Then, a PI stain was added and kept on ice for 10 minutes. Images of the stained cells were captured immediately after staining with a Zeiss microscope (Carl Zeiss Micro-Imaging, Jena, Germany) equipped with a digital imaging system. Pyroptosed cells were counted in eight fields by two investigators unaware of the experimental conditions. Percentage of pyroptosed cells was calculated.
Mesurement of K+ efflux
Incubation media was removed from control and experimental cells.
Typically 100 ml medium was used for injecting into a catridge (Chem8+/ Abbot labs), which measures various parameters including K+ using an iSTAT machine (Abbot labs).
RNA isolation and qPCR studies
Real-time PCR was performed using one-step iTaq Universal SYBR Green kit (BIO-RAD, USA) according to the manufacturer’s instructions using specific primers obtained from Thermo Fisher.
NLRP3 FWD: 5’ cacctgttgtgcaatctgaag 3’; Rev: 5’ gcaagatcctgacaacatgc 3’
ASC FWD: 5’ agttcaagctgaagctgctgt 3’; Rev: 5’ ccagcttgtcggtgaggt 3’
IL1-β FWD: 5’ tacctgtcctgcgtgttgaa 3’; Rev: 5’ ctttgggtaatttttgggatct 3’
IL-18 FWD: 5’ aacaaactatttgtcgcaggaat 3’; Rev: 5’ tgccacaaagttgatgcaat 3’
Quantitative PCR was performed using an ABI Prism 7900HT sequence detection system, and relative quantification of gene expression was calculated using the ΔΔCT method. Data were expressed as relative mRNA expression in reference to the control, normalized to the quantity of RNA input by performing measurements on an endogenous reference gene (GAPDH).
Western blotting studies
Western Blot studies were carried out as described previously (45–47). Briefly, control and experimental cells were harvested, lysed in RIPA buffer containing 50 mM Tris-Cl (pH 7.5), 150 mM NaCl, 1mM EDTA, 1% NP-40, 0.25% Deoxycholate, 0.1% SDS, 1X protease inhibitor cocktail (Calbiochem, Cocktail Set I), 1mM PMSF, and 0.2mM sodium orthovanadate. Protein concentration was determined using the Bio-Rad Protein Assay kit (PIERCE, Rockford, IL). Total protein lysed extracts (30 μg/lane) were loaded on a 10 % polyacrylamide (PAGE) premade gel (Bio-Rad, Hercules, CA) and after transferring onto PVDF membrane were processed for immunostaining with primary antibodies against APOL1 (anti-mouse, #66124-I-IG, Protein tech), NLRP3 (anti-mouse, #sc-66846; Santa Cruz); ASC (sc-22514-R; Santa Cruz Biotechnology), Caspase-1and Cleaved (C ) caspase-1 (antirabbit #4199;1:700, Cell Signaling): followed by treatment with horseradish peroxidase-labeled appropriate secondary antibodies. The blots were developed using a chemiluminescence detection kit (PIERCE, Rockford, IL) and exposed to X-ray film (Eastman Kodak Co., Rochester, NY). Equal protein loading and the protein transfers were confirmed by immunoblotting for determination of GAPDH protein using a monoclonal GAPDH antibody (#SC-47724; 1:3000, Santa Cruz) performed on the same (stripped) western blots.
Sequence retrieval and Homology modeling
We retrieved the sequence of APOL1 from the Uniprot database (Uniprot Id O14791). The sequence of APOL1 that is the APOL1G0 (398 aa residues) has different domains including an amino-terminal signal peptide (1–59 aa), pore-forming domain (60–237 aa) and membrane addressing domain (238–304) and the C-terminal region (305–398 aa). There are two kidney disease-associated variants, i.e., APOL1G1 and APOL1G2 which show mutations in the C-terminal region of APOL1. The APOL1G1 variant has two specific amino acid-altering mutations S342G and I384M, whereas, the APOL1G2 variant encodes two adjacent deletions N388 and Y389. These APOL1 variants have significant functional roles in kidney associated diseases, so we modeled all APOL1G0, APOL1G1, and APOL1G2 using Iterative Threading ASSEmbly Refinement (ITasser) server (19). Models were generated based on templates identified by threading approach to maximize percentage identity, sequence coverage, and confidence. The model of APOL1G0 was generated based on templates, i.e., 5ic0A (Talin triple domain), 4igg (Human alpha-catenin), 2pff (Yeast fatty acid synthase), 5j1iA (Spectrin repeats 7, 8, 9 of the plakin domain of plectin), 4hpqA (atg17 complex scaffold of autophagosome) and 6ezv (Cytotoxin MakA from Vibrio Cholera). The model of APOL1G1 was generated based on the same template as APOL1G0, including 5h7cA (A-DHR14 repeat proteins), and 1hciA (Rod domain of alpha-actinin), etc. The model of APOL1G2 was also generated based on the same templates as APOL1G0 including 6ek7A (YaxA from Yersinia enterocolitica), and 2odvA (the plakin domain of plectin, Cys to Ala mutant).
Model refinement
The models of APOL1G0, APOL1G1, and APOL1G2 were refined using GalaxyRefine (20). The refinement process is based on repetitive relaxations by short molecular dynamics simulations for mild (0.6 ps) and aggressive (0.8 ps) relaxations with four fs time step after structure perturbations. The refinement of models improved specific parameters, for example, an increase in Rama favored residues and a decrease in poor rotamers.
Structural analysis and structure comparison
The structures of APOL1G0, APOL1G1, and APOL1G2 were analyzed using ProFunc tool (21) that analyzes the protein sequence and structure identifying functional motifs or close relationship with functionally characterized structures. The pore shape and visualization of pores were performed using PoreWalker tool (22) that uses geometric criteria to identify and optimize the pore center and pore axis. Finally, pore features, including diameter profiles, pore-lining residues, size, shape, and regularity of the pore are calculated, providing a visual characterization of the channel.
Further, the structural models of APOL1G0, APOL1G1, and APOL1G2 were compared by PDBeFOLD analysis (23). This employs a secondary structure matching (SSM) algorithm of protein structure comparison in three dimensions, which is based on matching graphs built on the protein’s secondary structure elements, followed by an iterative 3D alignment of protein backbone Cα atoms. The structural comparison was construed in terms of the number of aligned residues, RMSD, and Q-score values.
Molecular Dynamics Simulation
Molecular Dynamics (MD) simulation of APOL1G0 and its variants APOL1G1 and APOL1G2 were performed using GROMACS (48). Protein-lipid structures were generated using the CHARMM-GUI tool (49), which generated lipid membrane composed of the phosphatidylcholine (POPC). The MD simulation production run was performed using CHARMM36 force field for 1 ns and 10 ns.
Membrane integration and orientation
The membrane interaction property of APOL1G0 and its variants were calculated using PPM (24) and OREMPRO (25) servers. The PPM method provides spatial positions of protein in a lipid bilayer and is based on the calculation of free energy of transfer of molecules from water to the anisotropic lipid environment. The OREMPRO method combines the ANVIL algorithm for positioning of protein structures in the lipid bilayer and the MAIDEN statistical potential for the evaluation of protein transmembrane domains structurally. Both the methods are based on the individual coordinates of Cα atoms.
Multimer docking and Thermodynamic calculations
We used M-ZDock tool (26) for multimer docking of APOL1G0, its variants APOL1G1 and APOL1G2. This method uses a grid-based Fast Fourier Transform approach for predicting the structure of cyclically symmetric (Cn) multimers based on the structure of unbound or partially bound monomer. We calculated the thermodynamic properties of multimers using PDBePISA tool (27) to study the stability of multimers.
Electrostatic properties and pKa calculation
We compared the expected electrostatic properties of APOL1G0 and its variants APOL1G1 and APOL1G2 in the molecular context using the Bluues tool (28). This tool uses Poisson-Boltzmann equations to calculate pairwise contributions of single atomic structures to the electrostatic properties of proteins based on generalized Born radii.
Docking of Phosphatidic acid (PA)
Phosphatidic acid has been demonstrated to play a role on Kv channel gating (50). Intracellular phosphatidic acid accounts for a nearly 50 mV shift in the midpoint of the activation curve in a direction consistent with stabilization of the voltage sensor’s closed conformation. We used PatchDock tool (36) for docking Phosphatidic acid (PA) into the APOL1G0, APOL1G1, and APOL1G2 structures. The PatchDock tool uses a geometry-based molecular docking algorithm and calculates docking transformations with molecular shape complementarity and atomic desolvation energy.
Grid formation and Docking of Glyburide
The grid formation with specific coordinates based on substrate binding pockets for docking of K+ ion channel inhibitor Glyburide was performed by AutoGridFR (AGFR) (30). Docking was performed using Autodock module of MGL Tools 1.5.6 (32). The 3D structure of Glyburide was retrieved from PubChem Compound (31).
Visualization
Visualization of structures and figures were generated by using PyMol (33) and Chimera tools (34).
Statistical analyses
Statistical comparisons were performed with the program PRISM using the Mann–Whitney U test for nonparametric data. One way ANOVA followed by Tukey multiple comparison test was used for experiments involved multiple groups. A p-value ≤ 0.05 was considered as statistically significant.
Acknowledgments
This work was supported by grants RO1DK 098074 (PCS) and RO1DK118017 (PCS) from National Institutes of Health, Bethesda, MD; by grants to KS from the Israel Science Foundation (ISF 182/15) and Rambam Medical Center, Kaylie Kidney Health Center of Excellence, and the Beutler Foundation for Genomic Medicine research.
Abbreviations
- AA
amino acid
- APOL1
Apolipoprotein L1
- APOL1G0
APOL1 non-risk allele
- APOL1G1 and G2
APOL1 risk alleles/mutant
- ASC
apoptosis-associated speck-like protein
- CKD
chronic kidney disease
- DIDS
4,4’-Diisothiocyanatostilbene-2,2’-disulfonic acid
- FBS
fetal bovine serum
- GAPDH
Glyceraldehyde 3-phosphate dehydrogenase
- GFP
Green fluorescent protein
- HIVAN
HIV-associated Nephropathy
- ITS
insulin, transferrin, and selenium
- Ki
inhibition constant
- MAD
membrane-address domain
- MAP Kinase
mitogen-activated protein kinase
- MD
Molecular Dynamics
- NLRP3
nucleotide-binding domain, leucine-rich-containing family, pyrin domain-containing-3
- PA
Phosphatidic acid
- POPC
phosphatidylcholine
- PD
podocytes
- PFD
pore-forming domain
- Rg
Radius of gyration
- RRVs
renal risk variants
- RPMI
Rosewell Park Memorial Institute
- RMSF
Root Mean Square Fluctuation
- RMSD
Root Mean Square Deviation
- SRA
serum- resistance-associated protein
- SP
signal peptide
- TM
transmembrane
Footnotes
Conflicts of Interest: None of the authors have any conflicts of interest.
References
- 1.Thomson R, Genovese G, Canon C, Kovacsics D, Higgins MK, Carrington M, Winkler CA, Kopp J, Rotimi C, Adeyemo A, Doumatey A, Ayodo G, Alper SL, Pollak MR, Friedman DJ, and Raper J (2014). Evolution of the primate trypanolytic factor APOL1. Proc Natl Acad Sci U S A 111: E2130–2139 [DOI] [PMC free article] [PubMed] [Google Scholar]
- 2.Duchateau PN, Pullinger CR, Orellana RE, Kunitake ST, Naya-Vigne J, O’Connor PM, Malloy MJ, and Kane JP (1997). Apolipoprotein L, a new human high-density lipoprotein apolipoprotein expressed by the pancreas. Identification, cloning, characterization, and plasma distribution of apolipoprotein L. J Biol Chem 272: 25576–25582 [DOI] [PubMed] [Google Scholar]
- 3.Vanhollebeke B, Pays E.The function of apolipoproteins L. (2006). Cell Mol Life Sci. 63,1937–44 [DOI] [PMC free article] [PubMed] [Google Scholar]
- 4.Friedman DJ and Pollak MR (2016). Apolipoprotein L1 and Kidney Disease in African Americans. Trends Endocrinol Metab 27: 204–215. [DOI] [PMC free article] [PubMed] [Google Scholar]
- 5.Genovese G, Friedman DJ, Pollak MR (2013). APOL1 variants and kidney disease in people of recent African ancestry. Nat Rev Nephrol 9: 240–244 [DOI] [PubMed] [Google Scholar]
- 6.Wasser WG, Tzur S, Wolday D, Adu D, Baumstein D, Rosset S, Skorecki K (2012). Population genetics of chronic kidney disease: the evolving story of APOL1. J Nephrol 25: 603–618 [DOI] [PubMed] [Google Scholar]
- 7.Kopp JB, Nelson GW, Sampath K, Johnson RC, Genovese G, An P, Friedman D, Briggs W, Dart R, Korbet S, Mokrzycki MH, Kimmel PL, Limou S, Ahuja TS, Berns JS, Fryc J, Simon EE, Smith MC, Trachtman H, Michel DM, Schelling JR, Vlahov D, Pollak M, Winkler CA (2011). APOL1 genetic variants in focal segmental glomerulosclerosis and HIV-associated nephropathy. J Am Soc Nephrol, 22: 2129–2137 [DOI] [PMC free article] [PubMed] [Google Scholar]
- 8.Pérez-Morga D, Vanhollebeke B, Paturiaux-Hanocq F, Nolan DP, Lins L, Homblé F, Vanhamme L, Tebabi P, Pays A, Poelvoorde P, Jacquet A, Brasseur R, Pays E. (2005). Apolipoprotein L-I promotes trypanosome lysis by forming pores in lysosomal membranes. Science. 309,469–472 [DOI] [PubMed] [Google Scholar]
- 9.Lecordier L, Vanhollebeke B, Poelvoorde P, Tebabi P, Paturiaux-Hanocq F, Andris F, Lins L, Pays E. (2009). C-terminal mutants of apolipoprotein L-I efficiently kill both Trypanosoma brucei brucei and Trypanosoma brucei rhodesiense. PLoS Pathog. 5,e1000685. [DOI] [PMC free article] [PubMed] [Google Scholar]
- 10.Lan X, Wen H, Lederman R, Malhotra A, Mikulak J, Popik W, Skorecki K, Singhal PC. (2015). Protein domains of APOL1 and its risk variants.Exp Mol Pathol. 99,139–44. [DOI] [PMC free article] [PubMed] [Google Scholar]
- 11.Harrington JM, Howell S, and Hajduk SL (2009) Membrane permeabilization by trypanosome lytic factor, a cytolytic human high density lipoprotein. J. Biol. Chem. 284, 13505–13512 [DOI] [PMC free article] [PubMed] [Google Scholar]
- 12.Thomson R, and Finkelstein A (2015) Human trypanolytic factor APOL1 forms pH-gated cation-selective channels in planar lipid bilayers: relevance to trypanosome lysis. Proc. Natl. Acad. Sci. U.S.A. 112, 2894–2899 [DOI] [PMC free article] [PubMed] [Google Scholar]
- 13.Olabisi OA, Zhang JY, VerPlank L, Zahler N, DiBartolo S 3rd, Heneghan JF, Schlöndorff JS, Suh JH, Yan P, Alper SL, Friedman DJ, and Pollak MR (2016) APOL1 kidney disease risk variants cause cytotoxicity by depleting cellular potassium and inducing stress-activated protein kinases. Proc. Natl. Acad. Sci. U.S.A. 113, 830–837 [DOI] [PMC free article] [PubMed] [Google Scholar]
- 14.Olabisi OA, Heneghan JF. (2017). APOL1 Nephrotoxicity: What Does Ion Transport Have to Do With It? Semin Nephrol. 37,546–551 [DOI] [PMC free article] [PubMed] [Google Scholar]
- 15.O’Toole JF, Schilling W, Kunze D, Madhavan SM, Konieczkowski M, Gu Y, Luo L, Wu Z, Bruggeman LA, Sedor JR. (2018). ApoL1 Overexpression Drives Variant-Independent Cytotoxicity.J Am Soc Nephrol. 29,869–879. [DOI] [PMC free article] [PubMed] [Google Scholar]
- 16.Yaron JR, Gangaraju S, Rao MY, Kong X, Zhang L, Su F, Tian Y, Glenn HL, Meldrum DR. (2015). K(+) regulates Ca(2+) to drive inflammasome signaling: dynamic visualization of ion flux in live cells. Cell Death Dis. 29, 6:e1954. [DOI] [PMC free article] [PubMed] [Google Scholar]
- 17.Beckerman P, Bi-Karchin J, Park AS, Qiu C, Dummer PD, Soomro I, Boustany-Kari CM, Pullen SS, Miner JH, Hu CA, Rohacs T, Inoue K, Ishibe S, Saleem MA, Palmer MB, Cuervo AM, Kopp JB, Susztak K. (2017). Transgenic expression of human APOL1 risk variants in podocytes induces kidney disease in mice.Nat Med. 23,429–438 [DOI] [PMC free article] [PubMed] [Google Scholar]
- 18.Lan X, Jhaveri A, Cheng K, Wen H, Saleem MA, Mathieson PW, Mikulak J, Aviram S, Malhotra A, Skorecki K, Singhal PC. (2014). APOL1 risk variants enhance podocyte necrosis through compromising lysosomal membrane permeability.Am J Physiol Renal Physiol. 307,:F326–36. [DOI] [PMC free article] [PubMed] [Google Scholar]
- 19.Yang J, Yan R, Roy A, Xu D, Poisson J, Zhang Y (2015). The I-TASSER Suite: Protein structure and function prediction. Nature Methods, 12: 7–8. [DOI] [PMC free article] [PubMed] [Google Scholar]
- 20.Shin W-H, Lee GR, Heo L, Lee H, Seok C. (2014) Prediction of Protein Structure and Interaction by GALAXY protein modeling programs, Bio Design, 2, 1: 1–11. [Google Scholar]
- 21.Laskowski RA, Watson JD, Thornton JM (2005). ProFunc: a server for predicting protein function from 3D structure. Nucleic Acids Res, 33, W89–W93. [DOI] [PMC free article] [PubMed] [Google Scholar]
- 22.Pellegrini-Calace M, Maiwald T and Thornton JM (2009) “Pore-Walker: a novel tool for the identification and characterization of transmembrane protein channels from their three-dimensional structure,” PLOS Comp. Biol, 5, 1–16. [DOI] [PMC free article] [PubMed] [Google Scholar]
- 23.Krissinel E, Henrick K (2004). Secondary-structure matching (SSM), a new tool for fast protein structure alignment in three dimensions. Acta Cryst. D60, 2256–2268. [DOI] [PubMed] [Google Scholar]
- 24.Lomize MA, Pogozheva I D, Joo H, Mosberg HI, Lomize AL (2012) OPM database and PPM web server: resources for positioning of proteins in membranes. Nucleic Acids Res, 40(Database issue):D370–6. [DOI] [PMC free article] [PubMed] [Google Scholar]
- 25.Postic G, Ghouzam Y, Gelly JC. (2016) Bioinformatics. 31:3782–3789. [DOI] [PubMed] [Google Scholar]
- 26.Pierce B, Tong W, Weng Z. (2005) M-ZDOCK: A Grid-based Approach for Cn Symmetric Multimer Docking. Bioinformatics 2, 1472–1476. [DOI] [PubMed] [Google Scholar]
- 27.Krissinel E, Henrick K (2007). ’Inference of macromolecular assemblies from crystalline state.’ J. Mol. Biol. 372, 774–797. [DOI] [PubMed] [Google Scholar]
- 28.Walsh I, Minervini G, Corazza A, Esposito G, Tosatto SCE and Fogolari F(2012) Bluues Server: electrostatic properties of wild-type and mutated protein structures. Bioinformatics. 28,2189–90. [DOI] [PubMed] [Google Scholar]
- 29.Duhovny DS, Inbar Y, Nussinov R, Wolfson HJ. (2005) PatchDock and SymmDock: servers for rigid and symmetric docking. Nucleic Acids Res; 33(Web Server issue): W363–W367. [DOI] [PMC free article] [PubMed] [Google Scholar]
- 30.Ravindranath PA and Sanner MF. (2016) AutoSite: identification and characterization of ligand-binding sites - Predicting key ligand atoms from AutoGrid affinity maps. Bioinformatics 32, 3142–3149. [DOI] [PMC free article] [PubMed] [Google Scholar]
- 31.Kim S, Chen J, Cheng T, Gindulyte A, He J, He S, Li Q, Shoemaker BA, Thiessen PA, Yu B, Zaslavsky L, Zhang J, Bolton EE. (2019) PubChem 2019 update: improved access to chemical data. Nucleic Acids Res. 47, D1102–1109. [DOI] [PMC free article] [PubMed] [Google Scholar]
- 32.Morris GM, Huey R, Lindstrom W, Sanner MF, Belew RK, Goodsell DS and Olson AJ (2009) Autodock4 and AutoDockTools4: automated docking with selective receptor flexiblity. J. Computational Chemistry. 16, 2785–91. [DOI] [PMC free article] [PubMed] [Google Scholar]
- 33.The PyMOL Molecular Graphics System, Version 2.0 Schrodinger, LLC. [Google Scholar]
- 34.Pettersen EF, Goddard TD, Huang CC, Couch GS, Greenblatt DM, Meng EC, Ferrin TE. (2004) UCSF Chimera--a visualization system for exploratory research and analysis. J Comput Chem. 25,1605–12. [DOI] [PubMed] [Google Scholar]
- 35.Muñoz-Planillo R, Kuffa P, Martínez-Colón G, Smith BL, Rajendiran TM, Núñez G. (2013). K⁺ efflux is the common trigger of NLRP3 inflammasome activation by bacterial toxins and particulate matter.Immunity. 38,1142–53 [DOI] [PMC free article] [PubMed] [Google Scholar]
- 36.Tamura K, Ishikawa G, Yoshie M, Ohneda W, Nakai A, Takeshita T, Tachikawa E. (2017). Glibenclamide inhibits NLRP3 inflammasome-mediated IL-1β secretion in human trophoblasts.J Pharmacol Sci.135,89–95. [DOI] [PubMed] [Google Scholar]
- 37.Bruno J, Pozzi N, Oliva J, Edwards JC. (2017). Apolipoprotein L1 confers pH-switchable ion permeability to phospholipid vesicles. J Biol Chem. 292,18344–18353 [DOI] [PMC free article] [PubMed] [Google Scholar]
- 38.Dani JA. (1986). Ion-channel entrances influence permeation. Net charge, size, shape, and binding considerations.Biophys J. 49,:607–18 [DOI] [PMC free article] [PubMed] [Google Scholar]
- 39.Zhaorigetu S, Wan G, Kaini R, Jiang Z, Hu CA. (2008). ApoL1, a BH3-only lipid-binding protein, induces autophagic cell death.Autophagy. 4,1079–82 [DOI] [PMC free article] [PubMed] [Google Scholar]
- 40.Kumar V, Singhal PC (2019) APOL1 and Kidney Cell Function.Am J Physiol Renal Physiol. 317:F463–F472 [DOI] [PMC free article] [PubMed] [Google Scholar]
- 41.Madhavan SM, O’Toole JF, Konieczkowski M, Ganesan S, Bruggeman LA, Sedor JR (2011).APOL1 localization in normal kidney and nondiabetic kidney disease.J Am Soc Nephrol. 22:2119–28 [DOI] [PMC free article] [PubMed] [Google Scholar]
- 42.Haque S, Patil G, Mishra A, Lan X, Popik W, Malhotra A, Skorecki K, Singhal PC (2017). Effect of APOL1 disease risk variants on APOL1 gene product.Biosci Rep.37 pii: BSR20160531. [DOI] [PMC free article] [PubMed] [Google Scholar]
- 43.Kumar V, Vashistha H, Lan X, Chandel N, Ayasolla K, Shoshtari SSM, Aslam R, Paliwal N, Abbruscato F, Mikulak J, Popik W, Atta MG, Chander PN, Malhotra A, Meyer-Schwesinger C, Skorecki K, Singhal PC. (2018). Role of Apolipoprotein L1 in Human Parietal Epithelial Cell Transition. Am J Pathol. 188,2508–2528 [DOI] [PMC free article] [PubMed] [Google Scholar]
- 44.Saleem MA, O’Hare MJ, Reiser J, Coward RJ, Inward CD, Farren T, Xing CY, Ni L, Mathieson PW, Mundel P. (2002). conditionally immortalized human podocyte cell line demonstrating nephrin and podocin expression. J Am Soc Nephrol. 13,630–8. [DOI] [PubMed] [Google Scholar]
- 45.Haque S, Lan X, Wen H, Lederman R, Chawla A, Attia M, Bongu RP, Husain M, Mikulak J, Saleem MA, Popik W, Malhotra A, Chander PN, Singhal PC (2016). HIV Promotes NLRP3 Inflammasome Complex Activation in Murine HIV-Associated Nephropathy.Am J Pathol. 186,347–58. [DOI] [PMC free article] [PubMed] [Google Scholar]
- 46.Kumar V, Paliwal N, Ayasolla K, Vashistha H, Jha A, Chandel N, Chowdhary S, Saleem MA, Malhotra A, Chander PN, Skorecki K, Singhal PC. (2019). Disruption of APOL1-miR193a Axis Induces Disorganization of Podocyte Actin Cytoskeleton.Sci Rep. 9, 3582. [DOI] [PMC free article] [PubMed] [Google Scholar]
- 47.Mishra A, Ayasolla K, Kumar V, Lan X, Vashistha H, Aslam R, Hussain A, Chowdhary S, Marashi Shoshtari S, Paliwal N, Popik W, Saleem MA, Malhotra A, Meggs LG, Skorecki K, Singhal PC. (2018). Modulation of apolipoprotein L1-microRNA-193a axis prevents podocyte dedifferentiation in high-glucose milieu.Am J Physiol Renal Physiol. 314, F832–F843. [DOI] [PMC free article] [PubMed] [Google Scholar]
- 48.Berendsen HJC, van der Spoel D., van Drunen R. GROMACS: A message-passing parallel molecular dynamics implementation. Computer Physics Communications. 1995; 91, 1–3: 43–56. [Google Scholar]
- 49.Jo Sunhwan, Kim Taehoon, Iyar Vidyashankara G., Wonpil I’m. CHARMM‐GUI: A web‐based graphical user interface for CHARMM. J Comput Chem. 2008; 29, 11: 1859–65. [DOI] [PubMed] [Google Scholar]
- 50.Hite RK, Butterwick JA, MacKinnon R (2014). Phosphatidic acid modulation of Kv channel voltage sensor function. 3: e04366. [DOI] [PMC free article] [PubMed] [Google Scholar]


