

Abstract
Objectives:
Evaluating children’s oral health status and treatment needs is challenging. We aim to build oral health assessment toolkits to predict Children’s Oral Health Status Index (COHSI) score and referral for treatment needs (RFTN) of oral health. Parent and Child toolkits consist of short-form survey items (12 for children and 8 for parents) with and without children’s demographic information (7 questions) to predict the child’s oral health status and need for treatment.
Methods:
Data were collected from 12 dental practices in Los Angeles County from 2015 to 2016. We predicted COHSI score and RFTN using random Bootstrap samples with manually introduced Gaussian noise together with machine learning algorithms, such as Extreme Gradient Boosting and Naive Bayesian algorithms (using R). The toolkits predicted the probability of treatment needs and the COHSI score with percentile (ranking). The performance of the toolkits was evaluated internally and externally by residual mean square error (RMSE), correlation, sensitivity and specificity.
Results:
The toolkits were developed based on survey responses from 545 families with children aged 2 to 17 y. The sensitivity and specificity for predicting RFTN were 93% and 49% respectively with the external data. The correlation(s) between predicted and clinically determined COHSI was 0.88 (and 0.91 for its percentile). The RMSEs of the COHSI toolkit were 4.2 for COHSI (and 1.3 for its percentile).
Conclusions:
Survey responses from children and their parents/guardians are predictive for clinical outcomes. The toolkits can be used by oral health programs at baseline among school populations. The toolkits can also be used to quantify differences between pre- and post-dental care program implementation. The toolkits’ predicted oral health scores can be used to stratify samples in oral health research.
Knowledge Transfer Statement:
This study creates the oral health toolkits that combine self- and proxy- reported short forms with children’s demographic characteristics to predict children’s oral health and treatment needs using Machine Learning algorithms. The toolkits can be used by oral health programs at baseline among school populations to quantify differences between pre and post dental care program implementation. The toolkits can also be used to stratify samples according to the treatment needs and oral health status.
Keywords: health services research, self report, proxy, surveys and questionnaires, patient reported outcome measures, psychometrics
Background
Children with poorer oral health tended to have worse school performance and miss more school days than children with better oral health (Jackson et al. 2011; Seirawan et al. 2012). There were large disparities in oral health status and treatment needs among children and adolescents (Mouradian et al. 2000; Flores and Tomany-Korman 2008). However, there was limited information about the oral health status of under-served populations in the United States, which made it harder to address oral health problems (Vargas et al. 2003).
The World Health Organization developed oral health questionnaires for both children and adults (WHO 2013). It was important that parents be involved in the collection of data for their younger children due to the parental responsiveness to children’s needs and expectations for positive oral health outcomes. A significant association was identified between parental and child dental fear and dental anxiety (Olak et al. 2013). Caregivers’ dental health literacy was shown to be significantly associated with the oral health status of children (Vann et al. 2010; Firmino et al. 2018). Parents with low oral health literacy scores had children with severe treatment needs as measured by Rapid Estimate of Adult Literacy in Dentistry (REALD-30) (Okada et al. 2002; Miller et al. 2010). Child surveys were very important on subjective measures, such as pain due to dental caries, facial appearance, and emotional well-being, as well as social interactions (Yusuf et al. 2006). Evidence showed school-aged children can effectively report their health measure (Riley 2004). We had previously constructed 2 short forms separately for children and parents that were associated with the Children’s Oral Health Status Index (COHSI) and referral for treatment needs (RFTN) (Liu et al. 2018; Wang et al. 2018). In this project, we aimed to build oral health assessment toolkits to predict the COHSI score and RFTN of oral health using machine learning algorithms. The short forms yielded scale information (inverse of total variation) that was comparable to that of the long forms (Liu et al. 2018; Wang et al. 2018). The objective of this paper was to utilize both parent and child responses to provide information of children’s oral health status and need for treatment that includes both children’s and parents’ perspectives.
The ultimate goal of the toolkits was to achieve at least 85% sensitivity when predicting RFTN and smaller error when predicting COHSI among different sets of model parameters. The toolkits included 3 essential components: 1) the foundation was the 2 short forms (self-reported the child and proxy-reported the parent); 2) socio-demographic information contributed to toolkit accuracy, which consists of children’s characteristics and household information that can affect children’s oral health (Edelstein 2002; Kumar et al. 2014; Mouradian et al. 2000); 3) machine learning algorithms with fine-tuned parameters were used to predict the clinical outcomes. Machine learning was increasingly used because of the ability to predict accurately with fast computation, particularly in oral health (Klingberg et al. 1999; Vellappally et al. 2018). In this paper, we used Naïve Bayesian (NB) method to predict the binary outcome RFTN (yes/no) and used Extreme Gradient Boosting (XGBoost) to predict COHSI score, a continuous variable.
NB (Zadrozny and Elkan 2001) was used intensively for classification problems because of its simplicity, but surprisingly high accuracy. It was recently used for disease prediction, diagnosis, and classification. It was a supervised learning optimal classifier algorithm based on Bayes’ Theorem. It had a smaller error rate than other tree-based algorithms, especially for large data sets (Das et al. 2018). The classification was determined by the posterior probability that was calculated by the prior information, the sample statistics, and the sample response space. In the context of the study, the posterior information was the prediction for clinical outcomes, given the survey responses. The prior information was estimated by the probability of treatment needs in the field test sample. The sample statistics were estimated by the conditional probability of the survey responses, given RFTN. The predicted RFTN fell onto the category with higher posterior probability. This was called maximum a posteriori (MAP). NB was widely used in the prediction of categorical outcomes. The only assumption in NB was conditional independence among predictors (short form and demographics), which was the same assumption used for the item response theory (IRT) models we used in creating the children’s and parents’ short forms (Liu et al. 2018; Wang et al. 2018). That was given the clinical outcomes, the answers of the survey responses are independent.
XGBoost is a scalable tree boosting algorithm widely used on many machine learning challenges, which can achieve better prediction results (accurate and fast) (Chen et al. 2015; Chen and Guestrin 2016; Sheridan et al. 2016). It has been widely used to predict disease status in medical research (Singh and Hanchate 2018). It is also a supervised learning algorithm built on a gradient boosting method. We predicted COHSI scores obtained from the dental exam by several additive functions (Koch et al. 1985; Hagan et al. 1986) developed from the short form responses and demographic information. The prediction is developed from the statistical objective function, including loss function (better prediction) and regulation function (less overfitting). XGBoost was very efficient on both sparse data and large data sets. There were a few parameters that needed to be fine-tuned for XGBoost (Chen et al. 2015; Chen and Guestrin 2016; Sheridan et al. 2016). For example, we used a greedy algorithm to search the best parameters (Friedman 2001). h controls the weights of subsequent trees searching from 0.05 to 0.4 (default is 0.3). The maximum depth was searched from 2 to 8 (default is 6). The maximum number of trees was from 5 to 500 (default is 10). Regulation parameter l was searched from 0 to 0.4 (default is 1); higher value was associated with a more conservative model.
Methods
The field test sample was collected at 12 dental practices across Los Angeles County from August 2015 to October 2016 (Liu et al. 2016; Liu et al. 2018; Wang et al. 2018). Institutional review board approval for this study was obtained from the University of California, Los Angeles, Office of the Human Research Protection Program (Institutional Review Board approval 13-001330). This study conformed to STROBE (Strengthening the Reporting of Observational Studies in Epidemiology) guidelines (Von Elm et al. 2007). Written consent was obtained from both children and their parents prior to participation (consent was obtained only from parents for children younger than 8). We excluded those who did not speak English and children who were currently in orthodontic treatment. The survey questions were answered by parents for all children (2–17 y) and children (8–17 y) who directly entered responses on computers using an Audio Computer-Assisted Self-Interview Software (Carlos et al. 2010). Therefore, there were no missing data for survey items. The only potential missing data happened during the dental exam; e.g., it was not possible to perform the exam on a 2-y-old child, or only the child or only the parent finished the survey. Any missing data were excluded from the analysis (about 4%).
All children received a dental exam to evaluate their clinical oral health outcomes, which were summarized as COHSI score and RFTN. COHSI was a weighted index consisting of facial features (including profile and lips), occlusal status, presence of decay, and missing and filled teeth (Koch et al. 1985; Hagan et al. 1986). RFTN was scored dichotomously as having at least 1 primary or permanent tooth with decay or more than 12 teeth bleeding upon probing (Liu et al. 2018; Wang et al. 2018). We checked the presence or absence of bleeding at 3 points per tooth, only on the buccal (facial) surfaces.
We used a greedy algorithm to search for the best set of parameters (Friedman 2001) for XGBoost algorithm in predicting the COHSI. Both NB and XGBoost were supervised learning and required a large sample size for the training set to achieve accurate prediction, stable parameters, and generalizable algorithms. The supervised learning algorithm meant that the algorithm was taught by the training data set with the existing mapping between the outcome and predictors (Friedman et al. 2001). The validating data set was used to correct the learning from training. The training process stopped if the prediction satisfied the criteria. Then the training algorithm was used on the test data set. The original data were divided into 70% for training the algorithm, and 30% used for validating the generalizability and stability of the algorithm (Shen et al. 2010). In this case, we reduced the overfitting problem during training the algorithm and developed a more stable and generalizable algorithm. The commonly used statistics for validating the prediction were sensitivity and specificity for the categorical outcome. For continuous outcomes, we commonly used Pearson correlation and root-mean-square error (RMSE) to evaluate the prediction results. Additionally, an external data were collected using the same protocol to further test the algorithm’s generalizability and stability. The new data were collected mainly for external validation and were never used for training the algorithm.
Machine learning methods require a large sample (usually more than 5,000) in order to develop a stable algorithm (Burges et al. 2005; Beleites et al. 2013). We artificially expanded the observations in the sample by resampling and manually introducing Gaussian noise of mean 0 and standard deviation 1 (Mosier 1941). The chosen noise had a standard normal distribution and was truncated at the response boundary and categories. The probability for the response without any change after introducing noise was higher than change within 1 level of category and was even higher than change within 2 levels of category. The probability of response change depended on the number of categories of the survey question. For example, the transition matrix for a 6-level response category (the most common response options in Table 2, always, almost always, often, sometimes, almost never, and never) was shown in the formula below. If the original response was sometimes, then after introducing the noise the probability for the response to change to always was 0.6%, to almost always was 6.7%, to often or almost never was 24.2%, to never was 6.1%, and staying the same (sometimes) was 38.2%. The probability for the response to change within only one level of category was 96.6%. The noise we introduced to the sample slightly changed the distribution.
Table 2.
Short Forms for Parents and Children to Measure RFTN and COHSI.
| Child Short Form | Parent Short Form | |||||
|---|---|---|---|---|---|---|
| Domains | Outcome | Item Questions | Response Dategories | Outcome | Item Questions | Response Categories |
| PHY/ Symptoms | COHSI | It hurts my teeth to chew. |
Always (1); Almost Always (2); Often (3);Sometimes (4); Almost Never (5); Never (6). | |||
| PHY/ Symptoms | COHSI | My teeth are straight. C_TEETHA |
No (0); Yes (1). | |||
| PHY/ Symptoms | COHSI | My child’s mouth hurts. P_CHOPA |
Always (1); Almost Always (2); Often (3); Sometimes (4); Almost Never (5); Never (6). |
|||
| PHY/ Symptoms | RFTN | It was hard for me to eat because of the pain in my
mouth. C_CHOPF |
Always (1); Almost Always (2); Often (3);Sometimes (4); Almost Never (5); Never (6). | Both | It was hard for my child to eat because of pain in his or her
mouth. P_CHOPF |
Always (1); Almost Always (2); Often (3); Sometimes (4); Almost Never (5); Never (6). |
| PHY/ Symptoms | RFTN | During the last school year, how many days of school did your
child miss because of pain in his/her mouth, tongue, teeth, or
gums? P_SCHMISS |
4 or more days (1); 2 to 3 days (2); 1 day (3); None (4). | |||
| PHY/ Functions | Both | In general, would you say your overall oral health
is: C_HEALT |
Poor (1); Fair (2); Good (3); Very Good (4); Excellent (5). | Both | In general, would you say your child’s oral health
is: P_CLDHEALT |
Poor (1); Fair (2); Good (3); Very Good (4); Excellent (5). |
| PHY/ Functions | Both | In the last 4 wk, how much of the time did you limit the kinds
or amounts of foods because of problems with your mouth, tongue,
teeth, jaws or gums? C_PHYFUNC |
Always (1); Almost Always (2); Often (3); Sometimes (4); Almost Never (5); Never (6). | |||
| MEN/ Affect | COHSI | How much are you afraid to go to a dentist? C_AFRAID |
A great deal (1); Somewhat (2); A little bit (3); Not at all (4). | |||
| MEN/ Affect | Both | In the last 4 wk, how much of the time were you pleased or happy
with the look of your mouth, teeth, jaws, or
gums? C_HAPPY |
Never (1); Almost Never (2); Sometimes (3); Often (4); Almost Always (5); Always (6). | Both | In the last 4 wk, how much of the time were you pleased or happy
with the look of your child’s mouth, teeth, jaws, or
gums? P_SH1 |
Never (1); Almost Never (2); Sometimes (3); Often (4); Almost Always (5); Always (6). |
| MEN/ Affect | Both | In the last 4 wk, how much of the time was your child worried or
concerned about problems with his/her mouth, tongue, teeth,
jaws, or gums? P_WORRY |
Always (1); Almost Always (2); Often (3); Sometimes (4); Almost Never (5); Never (6). | |||
| MEN/ Behavior | COHSI | How often do you brush your teeth? C_BRUSH |
Never (1); A few (2–3) times a month (2); Once a week (3); A few (2–3) times a week (4); Once a day (5); Two or more times a day (6). | |||
| MEN/ Cognition | RFTN | It was hard for me to pay attention because of the pain in my
mouth. C_CHOPJ |
Always (1); Almost Always (2); Often (3); Sometimes (4); Almost Never (5); Never (6). | Both | It was hard for my child to pay attention because of pain in his
or her mouth. P_CHOPJ |
Always (1); Almost Always (2); Often (3); Sometimes (4); Almost Never (5); Never (6). |
| MEN/ Cognition | RFTN | How often do you use dental floss on your
teeth? C_FLOSS |
Never or Don’t know what that is (1); A few (2–3) times a month (2); Once a week (3); A few (2–3) times a week (4); Once a day (5); Two or more times a day (6). | |||
| SOC/ Functions | COHSI | Have you ever avoided laughing or smiling because of the way
your teeth look? C_TEELOOK1 |
Yes (0); No (1). | |||
| SOC/ Functions | Both | In the last 4 wk, how much of the time did your child’s oral
health interfere with his/her social
activities? P_OHEFFECT |
Always (1); Almost Always (2); Often (3); Sometimes (4); Almost Never (5); Never (6). | |||
| SOC/Relation-ships | RFTN | Do other students make jokes about the way your teeth
look? C_TEELOOK2 |
Yes (0); No (1). | |||
COHSI, children’s oral health status index; PHY, physical; MEN, mental; RFTN, referral for treatment needs; SOC, social.
The methods used in this paper were implemented by Rstudio (Team 2015), using R package e1071 for NB (Dimitriadou et al. 2008) and xgboost for XGBoost (Chen et al. 2015; Chen and Guestrin 2016). When training the algorithm, we required the sensitivity to be at least 90% (i.e., for those who have the treatment needs, the algorithm can predict correctly at least 90% of the time). The NB algorithms developed delivered the results as the probability of RFTN, which can be easily interpreted by the Nomogram using Orange (an open-source data visualization, machine learning, and data mining toolkit) (Kim et al. 2016). The nomogram was printed out and used for probability prediction without the use of a computer or calculator. It printed the contribution from each item with contributed points. These individual contributed points summed together to transfer to posterior probabilities (Lewis 1998), i.e., the probability of RFTN given the response of survey items. One of the important advantages of using NB was that a missing response from a single item contributed average information for final estimation of the probability. Therefore, if no survey item was available, the probability of RFTN was the prior probability, i.e., the percentage of RFTN in the field test sample.
The toolkits predicted the probability of RFTN and COHSI (score and percentile) using 12 self-reported survey questions, 8 proxy-reported questions, and 7 sociodemographic questions, including age, sex, race/ethnicity of the child, whether they had dental insurance, any prior visit to emergency room for a dental problem, number of children in the household, and relationship with parents.
Results
The sample included 545 observations from proxy-reported short form responses (from parents or guardians) and 363 self-reported short form responses (from children directly). The additional sample included 35 families. All children had a dental exam, but only children 8 years old and older were eligible to complete the survey. Table 1 presents the characteristics of the children and parents and the household information. The 2 clinical outcomes from the dental exam in this paper were the COHSI score (mean 90, median 92, range 55 to 100, highly skewed to the left, the higher the score the better the oral health status) and RFTN (31% identified with a treatment need).
Table 1.
Characteristics of the Sample (Children, Parents, and Household) in the Field Test.a
| Variables | n (%) |
|---|---|
| Children’s Oral Health Status Index (COHSI), mean (SD) | 90.5 (8.5) |
| Clinical recommendation | |
| Continue your regular routine care | 312 (57.2) |
| See a dentist at your earliest convenience | 64 (11.7) |
| See a dentist within the next 2 wk | 130 (23.9) |
| See a dentist immediately | 39 (7.2) |
| Children’s age, y | |
| Mean (SD) | 9.7 (4.2) |
| 2–7 | 182 (33.4) |
| 8–12 | 214 (39.3) |
| 13–17 | 149 (27.3) |
| Children’s sex | |
| Male | 280 (51.4) |
| Female | 264 (48.4) |
| Male to female transgender | 1 (0.2) |
| Children’s race/ethnicity | |
| Caucasian/White | 111 (20.4) |
| Black/African American | 50 (9.2) |
| Hispanic/Latino | 226 (41.5) |
| Asian | 59 (10.8) |
| Other | 99 (18.2) |
| Parent’s sex | |
| Male | 160 (29.4) |
| Female | 385 (70.6) |
| Parent’s age, y | |
| Mean (SD) | 40.4 (9.0) |
| <30 | 67 (12.3) |
| 30–44 | 302 (55.4) |
| 45–59 | 161 (29.5) |
| ≥60 | 15 (2.8) |
| Parent’s primary language | |
| English | 394 (72.3) |
| Other | 151 (27.7) |
| Number of children in the household | |
| 1 | 130 (35.8) |
| 2 | 129 (35.5) |
| 3 | 54 (14.9) |
| ≥4 | 50 (13.8) |
| Child has dental insurance | |
| No | 111 (20.4) |
| Yes | 434 (79.6) |
| Parental employment status | |
| Full-time Job | 429 (78.7) |
| Part-time Job | 61 (11.2) |
| Not Working | 55 (10.1) |
Data are expressed as n (%) unless otherwise indicated.
Table 2 summarizes the previously developed short form survey questions, with the original response categories. The short form questions represented physical, mental, and social health domains, and subdomains of symptoms, physical functions, affect, behavior, cognition, social functions, and relationships. Each item in Table 2 was labeled as COHSI, RFTN, or both to indicate either or both clinical outcomes that the short form item predicted.
The accuracy (sensitivity and specificity) of predicting RFTN is shown in Table 3, using external data to evaluate the performance. The best prediction (higher accuracy and stable prediction) was from the algorithm using the most information, namely short forms from both child and parent regarding the child’s oral health and demographic information. Whenever new information was added, the prediction accuracy improved (either sensitivity or specificity). For the same level of sensitivity, the algorithm using only the proxy–short form had higher specificity. We reported the performance of 4 potential algorithms: using self-reported short form only, using proxy-reported short form only, and using both short forms with and without sociodemographic information. For each algorithm, there were 2 forms of data set (rows): the original and with manually introduced noise. For both forms, we calculated the sensitivity and specificity for training data and test data (columns). We required the cutoff point chosen to maintain sensitivity to be at least 85% in training data set. The sensitivity and specificity for training data with noise was 85% and 35% but had the performance of 93% and 49% when generalized to additional data source.
Table 3.
Sensitivity and Specificity with and without Manually Introduced Noise for Original Data and Test Data.
| Original Data (Training), % | New Data (Test), % | ||||
|---|---|---|---|---|---|
| Toolkits | Data Set | Sensitivity | Specificity | Sensitivity | Specificity |
| Children (C) | original | 86 | 20 | 79 | 19 |
| noise added | 85 | 24 | 71 | 29 | |
| Parents (P) | original | 86 | 28 | 100 | 24 |
| noise added | 85 | 31 | 79 | 33 | |
| Combination C&P | original | 86 | 28 | 93 | 24 |
| noise added | 85 | 37 | 93 | 48 | |
| C&P, Demographic | original | 86 | 26 | 93 | 24 |
| noise added | 85 | 35 | 93 | 49 | |
The NB algorithm using self- and proxy-reported short forms, including sociodemographic information to predict posterior probabilities, was shown in the nomograms (Fig.). The posterior probabilities can be directly calculated from the nomograms (circles, lines, and rulers). The bottom of the Figure mapped the probability of RFTN and the total points. The circle represented the prior probability from the field test sample (31% with RFTN). The total points were the summation of the points from each item. The point ruler for each category is listed at the top of the Figure. For example, if the parent reported that it was hard for the child to pay attention due to pain in his/her mouth with the frequency “always,” then the point was 2.0, corresponding to about 78% of RFTN. The contribution of each item to the final predicted probability and the structure of the NB method were illustrated in the Figure. For example, the most influential item from the child survey concerned those who reported “always” or almost always finding it hard to eat because of the pain in the mouth. If so, the probability for RFTN was 65% or 84% (with points 1.5 or 2.4). The demographic items contributed little to RFTN.
Figure.
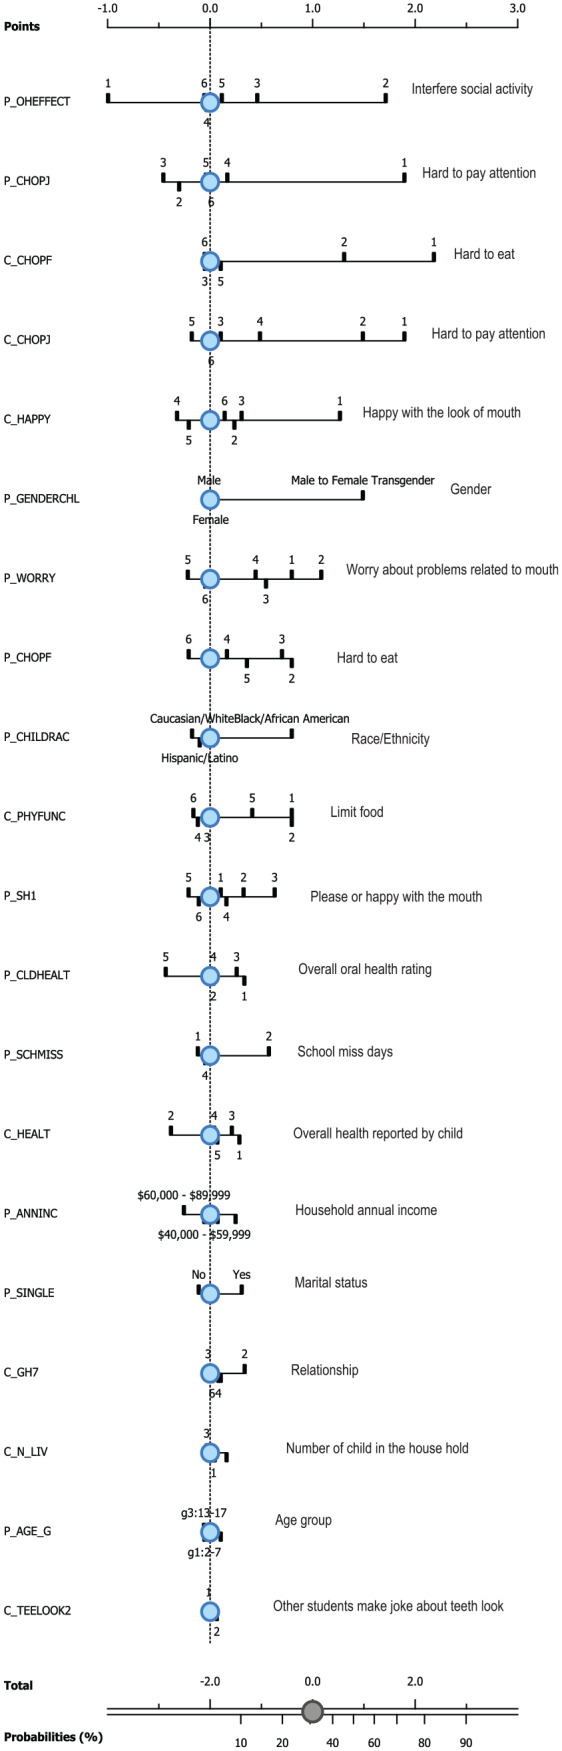
Nomograms for RFTN toolkit with noise.
The performance of the XGBoost that predicted current COHSI and percentile was shown in Table 4, with and without noise. Table 4A reported the 4 versions of algorithms by self-reported short form, proxy-reported short form, both versions, and both versions with demographic information using only original survey data. The performance was reported by the correlation between original value and predicted value and RMSE. The performance was poor in Table 4A. The algorithm performed much better when trained with noisy data as Table 4B. The Pearson correlation increased for all versions of short forms in Table 4B. The performance increased as more information was used. In Table 4B the correlation of predicted COHSI (percentile) with raw COHSI (percentile) was 0.41 (0.43), but with noisy COHSI was 0.90 (0.92) in the training results. In testing results, the correlation coefficient of predicted COHSI (percentile) with raw COHSI was 0.37 (0.39), but with noisy COHSI was 0.88 (0.91). The performance in Table 4B was more stable and generalizable to new data because the test results were comparable with the training results. The RMSE for predicting COHSI and percentile in Table 4B was better than those in Table 4A. The performance was more stable in Table 4B. In the results from the noisy sample, with information source added, the correlation was larger and the RMSE was smaller. The best performance achieved when all information was used, i.e., both short forms and demographic information. The RMSE for predicted COHSI score (percentile) was 3.89 (1.12) in noisy training data, with 4.19 (1.26) in testing data from additional source. The RMSE of training data and testing data results were more comparable in Table 4B than in 4A, which indicated the generalizability of the algorithm trained by noisy data.
Table 4.
Prediction for COHSI Score and Percentile of the Score without and with Noise.
| A. Without Noise | ||||
|---|---|---|---|---|
| Correlation | RMSE | |||
| COHSI Score | Validation Set | Test Set | Validation Set | Test Set |
| Children only | 0.39 | 0.29 | 8.21 | 9.16 |
| Parent only | 0.32 | 0.34 | 8.37 | 8.71 |
| Children + parent | 0.49 | 0.21 | 7.78 | 11.28 |
| Children + parent + household | 0.41 | 0.37 | 8.23 | 9.06 |
| Correlation | RMSE | |||
| COHSI Percentile | Validation Set | Test Set | Validation Set | Test Set |
| Children only | 0.41 | 0.21 | 2.78 | 3.27 |
| Parent only | 0.31 | 0.29 | 2.88 | 3.09 |
| Children + parent | 0.51 | 0.29 | 2.59 | 3.16 |
| Children + parent + household | 0.43 | 0.39 | 2.73 | 2.90 |
| B. With Noise | ||||
| Correlation | RMSE | |||
| COHSI Score | Validation Set | Test Set | Validation Set | Test Set |
| Children only | 0.59 | 0.58 | 7.03 | 7.31 |
| Parent only | 0.28 | 0.29 | 8.39 | 8.61 |
| Children + parent | 0.65 | 0.66 | 6.65 | 6.74 |
| Children + parent + household | 0.90 | 0.88 | 3.89 | 4.19 |
| Correlation | RMSE | |||
| COHSI Percentile | Validation Set | Test Set | Validation Set | Test Set |
| Children only | 0.58 | 0.60 | 2.38 | 2.41 |
| Parent only | 0.26 | 0.27 | 2.85 | 2.91 |
| Children + parent | 0.66 | 0.67 | 2.21 | 2.22 |
| Children + parent + household | 0.92 | 0.91 | 1.12 | 1.26 |
Discussion
We developed toolkits that use only a self-reported short form, only proxy-reported short form, and both versions together with and without demographic information to predict COHSI score (with percentile) and RFTN using machine learning algorithms. The algorithms were evaluated internally and externally for their accuracy. The 2 selected algorithms, NB and XGBoost, were still valid when there were missing data (Ramoni and Sebastiani 2001; Mitchell and Frank 2017). In the NB algorithm (Ramoni and Sebastiani 2001), the missing item was imputed by the prior information, which contributed no further information to the posterior probability (Kim et al. 2016; Singh and Hanchate 2018). Besides the prevalence from the field test sample, the missing survey information did not further contribute to the estimation of RFTN. In XGBoost, the missing variable was imputed by the default branch of the tree (Chen et al. 2015; Chen and Guestrin 2016; Sheridan et al. 2016). For example, the proxy short form can be used independently to predict RFTN and COHSI with percentile when the self-reported measures and demographics are not available. The best accuracy was achieved when using all available information. In our data, self-reported outcomes from children were only available for those who were 8 y and older. For younger children, the information was obtained from parents only. The toolkits could be used to predict the oral health of children even if only partial information was available.
The prediction accuracy (Baldi et al. 2000) was an important measure for the usefulness of the toolkits. The level of accuracy depended on the design of the survey questions, the oral health literacy of children and parents, and the time when surveys were conducted, and eventually on the development of the machine learning algorithm. The prediction accuracy relied on the consistency of the dental examination by dental professionals, machine learning algorithms by researchers, and the self-reported measures by parents and children. In this paper, the accuracy was evaluated by training and testing data, original data and noisy data, and internal and external data. In this way, we evaluated the performance of the toolkits on both stability and generalizability. These properties were reached by introducing artificial noise with known distribution to the bootstrap samples of original data. The sample size was always the bottleneck for using machine learning algorithms in clinical research. We proposed this method to introduce the variation to bootstrap samples of survey responses. The algorithms that were developed from training data sets with noise were more robust and stable algorithms and eventually performed better internally and externally. Noise was introduced to the response space, allowing answers to remain at the original category with higher probability but with a chance to change ±1 level from the original category and a very low chance to change ±2 levels. The method can be viewed as 1 way to impute rarely endorsed categories. In practice, certain categories of survey questions could not be endorsed as designed. In this study, all participant families were recruited conveniently from dental clinics located in Los Angeles County. These children had better oral health status than the general school population (especially those who do not go to dental appointments), which meant the sample was a skewed distribution. Most of the survey responses fell into the category of better oral health. This limited the generalizability of the toolkits if using traditional methods. The manually introduced noise solved this problem by allowing a small chance of moving categories in bootstrap samples.
The toolkits were developed to screen the oral health status of children and adolescents. The toolkits were not intended to replace the dental exam, but provided supporting information as an adjunct to population screening. The toolkits generated results, such as the posterior probability of treatment needs given survey responses, the overall oral health status by predicted COHSI score, and the ranking among peers by the percentile. The cutoff point of probability was determined to ensure higher sensitivity (at least 85%) and tolerable specificity (at least 30%). The practicality of the toolkits is indicated by sensitivity. It identified those who had dental-related treatment needs. Specificity was used to control the cost. It screened out those who did not need to visit a dental clinic. The predicted COHSI score was an indication of the oral health status of the child, and the percentile indicated the relative rank of the child’s oral health compared with his or her peers. These results can be useful to those who were not dental professionals, e.g., parents and school nurses. When used longitudinally, these results can evaluate the effectiveness of population-based oral health programs. The predicted COHSI can be used to compare overall oral health status among schools and among different areas. The percentile can be used to stratify samples according to their oral health status in oral health research. The distribution of noise could be adjusted to population distribution to increase prediction accuracy when generalizing the findings. In this way, although the field samples yielded a skewed distribution, the toolkits can be applied to the general population. Beyond the findings of this study, an additional value of this research was the application of machine learning trained by bootstrap samples with artificial noise to enable dental researchers to optimize survey results and obtain more effective predictive models.
Author Contributions
Y. Wang, R.D. Hays, M. Marcus, C.A. Maida, J. Shen, D. Xiong, H. Liu, contributed to conception, design, data acquisition, analysis, and interpretation, drafted and critically revised the manuscript; I.D. Coulter, S.Y. Lee, V.W. Spolsky, J.J. Crall, contributed to conception, design, data acquisition, and interpretation, drafted and critically revised the manuscript. All authors gave final approval and agree to be accountable for all aspects of the work.
Acknowledgments
We would like to acknowledge the following individuals for their assistance in both collecting the samples and providing the space for the field test: Dr. Suzanne Berger, Dr. Christie Burnett, Dr. Adrienne Fang, Dr. Roger Fieldman, Ms. Dale Gorman, Dr. Karen Ho, Dr. Oariona Lowe, Mr. Pastor Miranda, Dr. Evangelos Rossopoulos, Dr. Megha Sata, Dr. Justin Shuffer, Ms. Audrey Simons, and Mr. Dennis Young.
Footnotes
This research was supported by a National Institute of Dental and Craniofacial Research grant to the University of California, Los Angeles [U01DE022648].
The authors declare no potential conflicts of interest with respect to the authorship and/or publication of this article.
ORCID iDs: Y. Wang  https://orcid.org/0000-0002-4822-6514
R.D. Hays
https://orcid.org/0000-0001-6697-907X
M. Marcus
https://orcid.org/0000-0002-4351-2060
V.W. Spolsky
https://orcid.org/0000-0002-0643-2475
References
- Baldi P, Brunak S, Chauvin CA, Andersen Y, Nielsen H. 2000. Assessing the accuracy of prediction algorithms for classification: an overview. Bioinformatics. 16(5):412–424. [DOI] [PubMed] [Google Scholar]
- Beleites C, Neugebauer U, Bocklitz T, Krafft C, Popp J. 2013. Sample size planning for classification models. Anal Chim Acta. 760:25–33. [DOI] [PubMed] [Google Scholar]
- Burges C, Shaked T, Renshaw E, Lazier A, Deeds M, Hamilton N, Hullender G. 2005. Learning to rank using gradient descent. Proceedings of the 22nd International Conference on Machine Learning (ICML-05) 89–96. [Google Scholar]
- Carlos JA, Bingham TA, Stueve A, Lauby J, Ayala G, Millett GA, Wheeler D. 2010. The role of peer support on condom use among Black and Latino MSM in three urban areas. AIDS Educ Prev. 22(5):430–444. [DOI] [PubMed] [Google Scholar]
- Chen T, Guestrin C. 2016. XGBoost: A scalable tree boosting system. Proceedings of the 22nd ACM SIGKDD international conference on knowledge discovery and data mining 785–794. https://arxiv.org/abs/1603.02754 [Google Scholar]
- Chen T, He T, Benesty M. 2015. XGBoost: Extreme gradient boosting. R package version 04-2.1–4. [Google Scholar]
- Das H, Naik B, Behera H. 2018. Classification of diabetes mellitus disease (DMD): a data mining (DM) approach. Progress in computing, analytics and networking. Springer. p. 539–549. [Google Scholar]
- Dimitriadou E, Hornik K, Leisch F, Meyer D, Weingessel A. 2008. Misc functions of the department of statistics (e1071), tu wien. R package. 1:5–24. [Google Scholar]
- Edelstein BL. 2002. Disparities in oral health and access to care: Findings of national surveys. Ambulatory Pediatrics. 2(2):141–147. [DOI] [PubMed] [Google Scholar]
- Firmino RT, Ferreira FM, Martins CC, Granville-Garcia AF, Fraiz FC, Paiva SM. 2018. Is parental oral health literacy a predictor of children’s oral health outcomes? Systematic review of the literature. Int J Paediatr Dent. 28(5):459–471. [DOI] [PubMed] [Google Scholar]
- Flores G, Tomany-Korman SC. 2008. Racial and ethnic disparities in medical and dental health, access to care, and use of services in us children. Pediatrics. 121(2):e286–e298. [DOI] [PubMed] [Google Scholar]
- Friedman J, Hastie T, Tibshirani R. 2001. The elements of statistical learning. New York (NY): Springer. [Google Scholar]
- Friedman JH. 2001. Greedy function approximation: A gradient boosting machine. Ann Stat. 29(5): 1189–1232. [Google Scholar]
- Hagan P, Levy S, Machen J. 1986. Validation of the children’s oral health status index (COHSI). J Dent Child. 54(2):110–113. [PubMed] [Google Scholar]
- Jackson SL, Vann WF, Jr, Kotch JB, Pahel BT, Lee JY. 2011. Impact of poor oral health on children’s school attendance and performance. Am J Public Health. 101(10):1900–1906. [DOI] [PMC free article] [PubMed] [Google Scholar]
- Kim W, Kim KS, Park RW. 2016. Nomogram of Naive Bayesian model for recurrence prediction of breast cancer. J Healthc Inform Res. 22(2):89–94. [DOI] [PMC free article] [PubMed] [Google Scholar]
- Klingberg G, Sillén R, Norén JG. 1999. Machine learning methods applied on dental fear and behavior management problems in children. Acta Odontol Scand. 57(4):207–215. [DOI] [PubMed] [Google Scholar]
- Koch AL, Gershen JA, Marcus M. 1985. A children’s oral health status index based on dentists’ judgment. J Am Dent Assoc. 110(1):36–42. [DOI] [PubMed] [Google Scholar]
- Kumar S, Kroon J, Lalloo R. 2014. A systematic review of the impact of parental socio-economic status and home environment characteristics on children’s oral health related quality of life. Health Qual Life Out. 12:41. [DOI] [PMC free article] [PubMed] [Google Scholar]
- Lewis DD. 1998. Naive (Bayes) at forty: the independence assumption in information retrieval. European conference on machine learning. 4–15. [Google Scholar]
- Liu H, Hays R, Wang Y, Marcus M, Maida C, Shen J, Xiong D, Lee S, Spolsky V, Coulter I, et al. 2018. Short form development for oral health patient-reported outcome evaluation in children and adolescents. Qual Life Res. 27(6):1599–1611. [DOI] [PMC free article] [PubMed] [Google Scholar]
- Liu H, Hays RD, Marcus M, Coulter I, Maida C, Ramos-Gomez F, Shen J, Wang Y, Spolsky V, Lee S. 2016. Patient-reported oral health outcome measurement for children and adolescents. BMC Oral Health. 16(1):95. [DOI] [PMC free article] [PubMed] [Google Scholar]
- Miller E, Lee JY, DeWalt DA, Vann WF., Jr. 2010. Impact of caregiver literacy on children’s oral health outcomes. Pediatrics. 126(1):107–114. [DOI] [PMC free article] [PubMed] [Google Scholar]
- Mitchell R, Frank E. 2017. Accelerating the XGBoost algorithm using GPU computing. PeerJ Comput Sci. 3:e127. [Google Scholar]
- Mosier CI. 1941. A psychometric study of meaning. J Soc Psychol. 13(1):123–140. [Google Scholar]
- Mouradian WE, Wehr E, Crall JJ. 2000. Disparities in children’s oral health and access to dental care. JAMA. 284(20):2625–2631. [DOI] [PubMed] [Google Scholar]
- Okada M, Kawamura M, Kaihara Y, Matsuzaki Y, Kuwahara S, Ishidori H, Miura K. 2002. Influence of parents’ oral health behaviour on oral health status of their school children: An exploratory study employing a causal modelling technique. Int J Paediatr Dent. 12(2):101–108. [DOI] [PubMed] [Google Scholar]
- Olak J, Saag M, Honkala S, Nõmmela R, Runnel R, Honkala E, Karjalainen S. 2013. Children’s dental fear in relation to dental health and parental dental fear. Stomatologija. 15(1):26–31. [PubMed] [Google Scholar]
- Ramoni M, Sebastiani P. 2001. Robust learning with missing data. Mach Learn. 45(2):147–170. [Google Scholar]
- Riley AW. 2004. Evidence that school-age children can self-report on their health. Ambulatory Pediatrics. 4(4):371–376. [DOI] [PubMed] [Google Scholar]
- Seirawan H, Faust S, Mulligan R. 2012. The impact of oral health on the academic performance of disadvantaged children. Am J Public Health. 102(9):1729–1734. [DOI] [PMC free article] [PubMed] [Google Scholar]
- Shen C, Kim J, Wang L. 2010. Scalable large-margin Mahalanobis distance metric learning. IEEE Trans Neural Netw. 21(9):1524–1530. [DOI] [PubMed] [Google Scholar]
- Sheridan RP, Wang WM, Liaw A, Ma J, Gifford EM. 2016. Extreme gradient boosting as a method for quantitative structure–activity relationships. J Chem Inf Model. 56(12):2353–2360. [DOI] [PubMed] [Google Scholar]
- Singh SM, Hanchate DB. 2018. Improving disease prediction by machine learning. Int J Res Eng Technol. 5(6):1542–1548. [Google Scholar]
- Team R. 2015. Rstudio: Integrated development for R. RStudio, Inc, Boston, MA. URL http://www.rstudio.com/
- Vann WF, Jr, Lee JY, Baker D, Divaris K. 2010. Oral health literacy among female caregivers: impact on oral health outcomes in early childhood. J Dent Res. 89(12):1395–1400. [DOI] [PMC free article] [PubMed] [Google Scholar]
- Vargas CM, Ronzio CR, Hayes KL. 2003. Oral health status of children and adolescents by rural residence, united states. J Rural Health. 19(3):260–268. [DOI] [PubMed] [Google Scholar]
- Vellappally S, Al-Kheraif AA, Anil S, Basavarajappa S, Hassanein AS. 2018. Maintaining patient oral health by using a xeno-genetic spiking neural network. J Amb Intel Hum Comp. 1–9. 10.1007/s12652-018-1166-8 [DOI]
- Von Elm E, Altman DG, Egger M, Pocock SJ, Gøtzsche PC, Vandenbroucke JP, Initiative S. 2007. The strengthening the reporting of observational studies in epidemiology (STROBE) statement: guidelines for reporting observational studies. PLoS Medicine. 4(10):e296. [DOI] [PMC free article] [PubMed] [Google Scholar]
- Wang Y, Hays R, Marcus M, Maida C, Shen J, Xiong D, Lee S, Vladimir S, Coulter I, Crall J. 2018. Development of a parents’ short form survey of their children’s oral health. Int J Paediatr Dent. 29(3):332–344. [DOI] [PMC free article] [PubMed] [Google Scholar]
- WHO. 2013. Oral health surveys: Basic methods. World Health Organization. [Google Scholar]
- Yusuf H, Gherunpong S, Sheiham A, Tsakos G. 2006. Validation of an English version of the child-OIDP index, an oral health-related quality of life measure for children. Health Qual Life Outcomes. 4:38. [DOI] [PMC free article] [PubMed] [Google Scholar]
- Zadrozny B, Elkan C. 2001. Obtaining calibrated probability estimates from decision trees and Naive Bayesian classifiers. Proceedings of the Eighteenth International Conference on Machine Learning p 609–616. [Google Scholar]