

Abstract
Background:
The American Cancer Society (ACS), the Centers for Disease Control and Prevention (CDC), the National Cancer Institute (NCI), and the North American Association of Central Cancer Registries (NAACCR) collaborate to provide annual updates on cancer occurrence and trends in the United States.
Methods:
Data on new cancer diagnoses during 2001 to 2016 were obtained from the CDC-funded and NCI-funded population-based cancer registry programs and compiled by NAACCR. Data on cancer deaths during 2001 to 2017 were obtained from the National Center for Health Statistics’ National Vital Statistics System. Trends in incidence and death rates for all cancers combined and for the leading cancer types by sex, racial/ethnic group, and age were estimated by joinpoint analysis and characterized by average annual percent change during the most recent 5 years (2012–2016 for incidence and 2013–2017 for mortality).
Results:
Overall, cancer incidence rates decreased 0.6% on average per year during 2012–2016, but trends differed by sex, racial/ethnic group, and cancer type. Among males, cancer incidence rates were stable overall and among non-Hispanic white males but decreased in other racial/ethnic groups; rates increased for 5 of the 17 most common cancers, were stable for 7 cancers (including prostate), and decreased for 5 cancers (including lung and bronchus [lung] and colorectal). Among females, cancer incidence rates increased during 2012–2016 in all racial/ethnic groups, increasing on average 0.2% per year; rates increased for 8 of the 18 most common cancers (including breast), were stable for 6 cancers (including colorectal), and decreased for 4 cancers (including lung). Overall, cancer death rates decreased 1.5% on average per year during 2013–2017, decreasing 1.8% per year among males and 1.4% per year among females. During 2013–2017, cancer death rates decreased for all cancers combined among both males and females in each racial/ethnic group, for 11 of the 19 most common cancers among males (including lung and colorectal), and for 14 of the 20 most common cancers among females (including lung, colorectal, and breast). The largest declines in death rates were observed for melanoma of the skin (decreasing 6.1% per year among males and 6.3% among females) and lung (decreasing 4.8% per year among males and 3.7% among females). Among children younger than age 15 years, cancer incidence rates increased an average of 0.8% per year during 2012–2016, and cancer death rates decreased an average of 1.4% per year during 2013–2017. Among adolescents and young adults aged 15–39 years, cancer incidence rates increased an average of 0.9% per year during 2012–2016, and cancer death rates decreased an average of 1.0% per year during 2013–2017.
Conclusions:
While overall cancer death rates continue to decline, incidence rates are leveling off among males and increasing slightly among females. These trends reflect population changes in cancer risk factors, screening test use, diagnostic practices, and treatment advances. Many cancers can be prevented or treated effectively if found early. Population-based cancer incidence and mortality data can be used to inform efforts to decrease the cancer burden in the United States and regularly monitor progress towards goals.
Keywords: Annual Report to the Nation; Epidemiology; National Program of Cancer Registries (NPCR); National Vital Statistics System (NVSS); North American Association of Central Cancer Registries (NAACCR); Surveillance; Epidemiology, and End Results Program (SEER); cancer; incidence; mortality; trends
Precis
The Centers for Disease Control and Prevention, the American Cancer Society, the National Cancer Institute, and the North American Association of Central Cancer Registries collaborate to provide annual updates on cancer occurrence and trends in the United States and to address a special topic of interest. Part 1 of this report focuses on national cancer statistics and Part 2 characterizes progress in achieving select Healthy People 2020 objectives related to four common cancers.
INTRODUCTION
Each year, the Centers for Disease Control and Prevention (CDC), the American Cancer Society (ACS), the National Cancer Institute (NCI), and the North American Association of Central Cancer Registries (NAACCR) collaborate to provide updated information about cancer occurrence and trends in the United States and to address a special topic of interest.1 Part 1 of this report focuses on national cancer statistics and Part 2 characterizes progress in achieving Healthy People 2020 objectives related to four common cancers.2
MATERIALS AND METHODS
Data sources
Cancer incidence data
Population-based cancer incidence data by age, sex, and race/ethnicity were obtained from registries that participate in the CDC’s National Program of Cancer Registries (NPCR) and/or the NCI’s Surveillance, Epidemiology, and End Results (SEER) Program.3 Data from registries that satisfied NAACCR’s criteria for data quality and completeness were included in analyses; an exception was that data from New Mexico did not meet NAACCR completeness criteria but after review were included in this report.4 For rate analyses, 49 states and 1 territory (Puerto Rico) met data criteria for every year during 2012–2016, while for trend analyses, 46 states met data criteria for every year during 2001–2016, representing 99% and 93% of the population of the United States and Puerto Rico, respectively.
Anatomic site and histology were coded according to International Classification of Diseases for Oncology 3rd edition (ICD-O-3)5 and categorized according to SEER site groups.6 Only cases defined as malignant were included in this report, except that in situ and malignant bladder cancers were combined when reporting bladder cancer incidence rates.
Cancer mortality data
Cause of death was based on death certificate information reported to state vital statistics offices and compiled into a national file through CDC’s National Center for Health Statistics’ (NCHS) National Vital Statistics System.7 The underlying causes of death were selected according to ICD-10, then categorized according to SEER site groups to maximize comparability with ICD-O classifications.6
Population data
Population estimates used as rate denominators were a modification of intercensal (for July 1, 2001–2009) and Vintage 2017 (for July 1, 2010–2017) annual county population estimates by age, sex, bridged-race, and Hispanic origin produced by the US Census Bureau’s Population Estimates Program, in collaboration with NCHS, and with support from the NCI.8 The estimates incorporate bridged single-race estimates derived from the original multiple-race categories in the 2000 and 2010 Censuses and permit estimation of race-specific statistics.9
Demographic characteristics
Rates and trends are presented by sex, racial/ethnic group, and age (all ages, children aged 0–14 years and adolescents and young adults [AYA] aged 15–39 years). Information about race and ethnicity was collected separately and was based on information abstracted from medical records or death certificates. In this report, information about race and ethnicity was combined to create five mutually exclusive racial/ethnic groups: non-Hispanic white, non-Hispanic black, non-Hispanic American Indian/Alaska Native (AI/AN), non-Hispanic Asian/Pacific Islander (API), and Hispanic (any race). For purposes of brevity, in this report, the non-Hispanic groups will be referred to by race only. To minimize racial misclassification for AI/AN, this group was restricted to residents in Indian Health Service Purchased/Referred Care Delivery Areas (PRCDA)10 in states that provided county-level information (i.e., excluding Minnesota). Persons with other or unknown race or unknown ethnicity were included in overall rates but were not included as separate categories.
For males and females of all ages, rates and trends are presented for each cancer site that was one of the fifteen most common sites for incidence or death in any racial/ethnic group. For children and AYA, rates and trends are presented for each cancer site that was one of the three most common sites for incidence or death in any racial/ethnic group.
Statistical Methods
Cross-sectional incidence (2012–2016) and death (2013–2017) rates for all ages combined, children, and AYA by cancer site and racial/ethnic group were calculated using SEER*Stat software, version 8.3.5.11 All rates were age-standardized to the 2000 U.S. standard population and were expressed per 100,000 standard population. Incidence rates were adjusted for potential delays in case reporting.12 Corresponding 95% confidence intervals (CIs) were calculated as modified gamma intervals and allow for informal comparisons between groups, without specifying a referent group. Rates based on fewer than 16 cases were deemed to be statistically unreliable and were suppressed.
Temporal trends in delay-adjusted cancer incidence (2001–2016) and death (2001–2017) rates were estimated using joinpoint regression.13 The maximum number of joinpoints was based on the length of the period, with two joinpoints (three line segments) allowed for the 16-year period for incidence and a maximum of three joinpoints (four line segments) allowed for the 17-year period for deaths. Trends were characterized by annual percent change (APC), the slope of a single segment, and average APC (AAPC), a summary measure over a fixed interval.13 To determine whether APCs were significantly different from zero, a t-test was used; to determine whether AAPCs were significantly different from zero, a t-test was used for 0 joinpoints, and a z-test was used for ≥1 joinpoint. Rates were considered to increase if the slope of the trends (APC or AAPC) >0 (p<0.05) and to decrease if <0 (p<0.05); otherwise rates were considered stable. Trends based on fewer than 10 cases in any of the data years were considered statistically unreliable and were suppressed. All statistical tests were two sided. Corresponding 95% CIs for trends were calculated using the parametric method and allow for informal comparisons between groups, without specifying a referent group.
RESULTS
Cancer Incidence Rates and Trends
Overall, cancer incidence rates decreased 0.6% on average per year during the most recent 5 years (2012–2016) but trends differed by sex, being stable among males (AAPC = −1.0%, p=0.14) and increasing slightly among females (AAPC = 0.2%, p=0.007) (Table 1). The overall incidence rate of cancer among males decreased during 2001–2013 but was stable during 2013–2016, which resulted in a stable trend for the most recent 5 years (Figure 1, Table 2). Among females, overall cancer incidence rates were stable during 2001–2003 and increased slightly during 2003–2016 (APC = 0.2%) (Figure 1).
Table 1.
Age-standardized, delay-adjusted incidence ratesa and fixed-interval trends (2012–2016)b for the most common cancers,c all ages, by sex, age group, and racial/ethnic groupd for areas in the United States with high-quality incidence datae
| Sex/cancer site or type | All Races | Non-Hispanic White | Non-Hispanic Black | Non-Hispanic API | Non-Hispanic AI/AN (PRCDA) | Hispanic | |||||||||||||||||||
|---|---|---|---|---|---|---|---|---|---|---|---|---|---|---|---|---|---|---|---|---|---|---|---|---|---|
| Rank | Rate (95% CI) | AAPC (95% CI) | P | Rate (95% CI) | AAPC (95% CI) | P | Rate (95% CI) | AAPC (95% CI) | P | Rate (95% CI) | AAPC (95% CI) | P | Rate (95% CI) | AAPC (95% CI) | P | Rate (95% CI) | AAPC (95% CI) | P | |||||||
| All sites | |||||||||||||||||||||||||
| Both sexes | 447.9 (447.6, 448.2) | −0.6 (−0.7, −0.5) | f | <.001 | 467.5 (467.1, 467.9) | −0.4 (−0.5, −0.3) | f | <.001 | 466.9 (465.8, 467.9) | −1.1 (−1.4, −0.8) | f | <.001 | 293.6 (292.5, 294.8) | −0.5 (−0.6, −0.4) | <.001 | 401.4 (396.7, 406.1) | −0.1 (−0.3, 0.1) | .40 | 348.9 (348.0, 349.7) | −0.8 (−0.9, −0.7) | f | <.001 | |||
| Males | 487.9 (487.4, 488.4) | −1.0 (−2.4, 0.3) | .14 | 503.0 (502.4, 503.6) | −0.8 (−2.2, 0.7) | .31 | 547.6 (545.8, 549.3) | −1.7 (−2.8, −0.6) | f | .003 | 296.5 (294.7, 298.3) | −1.5 (−1.7, −1.3) | f | <.001 | 420.0 (412.6, 427.5) | −0.7 (−1.1, −0.3) | f | .001 | 377.8 (376.4, 379.2) | −1.4 (−2.1, −0.7) | f | .001 | |||
| Females | 421.4 (421.0, 421.8) | 0.2 (0.1, 0.3) | f | .007 | 444.5 (444.0, 445.0) | 0.3 (0.2, 0.4) | f | <.001 | 412.8 (411.6, 414.1) | 0.3 (0.2, 0.4) | f | <.001 | 295.7 (294.1, 297.3) | 0.4 (0.3, 0.6) | f | <.001 | 391.9 (385.8, 398.2) | 0.5 (0.3, 0.7) | f | <.001 | 333.6 (332.5, 334.8) | 0.6 (0.3, 0.9) | f | .002 | |
| Children (ages 00–14 years) | 16.8 (16.7, 17.0) | 0.8 (0.7, 1.0) | f | <.001 | 17.8 (17.6, 18.1) | 0.9 (0.7, 1.0) | f | <.001 | 13.5 (13.1, 13.8) | 1.2 (0.8, 1.6) | f | <.001 | 14.7 (14.1, 15.3) | 1.8 (1.1, 2.5) | f | <.001 | 12.4 (11.2, 13.8) | −0.2 (−1.6, 1.3) | .81 | 16.3 (16.0, 16.6) | 0.5 (0.2, 0.8) | f | .004 | ||
| AYA (ages 15–39 years) | 75.5 (75.2, 75.7) | 0.9 (0.8, 1.0) | f | <.001 | 84.1 (83.8, 84.5) | 1.1 (1.0, 1.2) | f | <.001 | 63.5 (62.9, 64.1) | 0.7 (0.6, 0.9) | f | <.001 | 54.8 (54.0, 55.6) | 1.8 (1.5, 2.0) | f | <.001 | 61.9 (59.4, 64.6) | 0.8 (0.1, 1.4) | f | .02 | 62.0 (61.5, 62.5) | 2.4 (1.6, 3.2) | f | <.001 | |
| Males | |||||||||||||||||||||||||
| Prostate | 1 | 108.1 (107.9, 108.3) | −2.1 (−9.2, 5.5) | .58 | 101.7 (101.5, 102.0) | −1.9 (−10.0, 6.9) | .66 | 182.3 (181.3, 183.3) | −2.1 (−6.3, 2.4) | .36 | 56.3 (55.5, 57.1) | −3.0 (−9.1, 3.6) | .37 | 75.7 (72.5, 79.0) | −2.3 (−7.8, 3.4) | .42 | 98.2 (97.5, 99.0) | −4.0 (−7.6, −0.3) | f | .04 | |||||
| Lung and bronchus | 2 | 69.5 (69.3, 69.7) | −2.6 (−2.7, −2.4) | f | <.001 | 73.4 (73.2, 73.6) | −2.3 (−2.5, −2.2) | f | <.001 | 83.9 (83.2, 84.6) | −3.2 (−3.6, −2.7) | f | <.001 | 44.4 (43.7, 45.1) | −1.6 (−1.8, −1.3) | f | <.001 | 62.9 (60.0, 65.9) | −5.7 (−12.1, 1.3) | .11 | 36.2 (35.7, 36.6) | −2.8 (−3.0, −2.5) | f | <.001 | |
| Colon and rectum | 3 | 45.1 (45.0, 45.3) | −1.1 (−2.1, −0.2) | f | .03 | 44.7 (44.5, 44.9) | −1.2 (−1.9, −0.6) | f | .002 | 55.0 (54.4, 55.6) | −2.7 (−3.0, −2.4) | f | <.001 | 36.2 (35.5, 36.8) | −2.3 (−2.5, −2.0) | f | <.001 | 51.9 (49.3, 54.6) | −0.6 (−1.2, 0.0) | .06 | 42.9 (42.4, 43.4) | −2.2 (−2.5, −1.9) | f | <.001 | |
| Urinary bladder | 4 | 35.5 (35.4, 35.7) | −1.6 (−2.3, −0.8) | f | <.001 | 40.1 (40.0, 40.3) | −1.4 (−2.3, −0.5) | f | .003 | 20.4 (20.1, 20.8) | −1.2 (−2.9, 0.7) | .21 | 15.3 (14.9, 15.8) | −0.6 (−1.0, −0.3) | f | .001 | 20.7 (18.9, 22.6) | 0.9 (−0.1, 2.0) | .08 | 19.0 (18.7, 19.4) | −1.5 (−1.8, −1.2) | f | <.001 | ||
| Melanoma of the skin | 5 | 28.5 (28.3, 28.6) | 2.2 (2.0, 2.4) | f | <.001 | 36.4 (36.2, 36.5) | 2.6 (2.4, 2.8) | f | <.001 | 1.2 (1.1, 1.3) | 0.0 (−1.0, 1.1) | .93 | 1.6 (1.4, 1.7) | −0.5 (−1.2, 0.3) | .18 | 10.8 (9.6, 12.1) | 7.9 (4.9, 11.0) | f | <.001 | 5.1 (5.0, 5.3) | 0.5 (0.0, 1.1) | .052 | |||
| Non-Hodgkin lymphoma | 6 | 23.8 (23.6, 23.9) | −1.0 (−2.3, 0.2) | .11 | 25.1 (25.0, 25.2) | −0.9 (−2.1, 0.3) | .14 | 17.9 (17.5, 18.2) | 0.3 (0.0, 0.5) | f | .03 | 16.4 (16.0, 16.8) | 0.4 (0.0, 0.9) | f | .04 | 16.6 (15.2, 18.2) | −0.8 (−2.2, 0.6) | .24 | 20.1 (19.8, 20.4) | 0.0 (−0.4, 0.4) | .91 | ||||
| Kidney and renal pelvis | 7 | 22.9 (22.8, 23.0) | 1.5 (1.3, 1.7) | f | <.001 | 23.4 (23.3, 23.5) | 1.6 (1.3, 2.0) | f | <.001 | 26.6 (26.2, 26.9) | 1.3 (0.7, 1.8) | f | <.001 | 11.4 (11.1, 11.8) | 0.7 (−0.6, 2.0) | .28 | 31.8 (29.9, 33.8) | 0.7 (−0.4, 1.9) | .19 | 20.8 (20.5, 21.2) | 2.2 (1.4, 3.1) | f | <.001 | ||
| Leukemia | 8 | 19.4 (19.3, 19.5) | −0.1 (−1.5, 1.4) | .94 | 20.7 (20.6, 20.9) | 0.2 (−1.6, 1.9) | .86 | 15.1 (14.8, 15.5) | 1.1 (0.6, 1.6) | f | <.001 | 10.3 (9.9, 10.6) | 0.8 (0.2, 1.4) | f | .02 | 14.2 (12.8, 15.6) | 1.0 (−0.4, 2.4) | .15 | 14.2 (13.9, 14.5) | 0.7 (0.2, 1.2) | f | .005 | |||
| Oral cavity and pharynx | 9 | 18.1 (18.0, 18.2) | 1.2 (1.0, 1.4) | f | <.001 | 20.0 (19.9, 20.1) | 1.9 (1.6, 2.1) | f | <.001 | 14.6 (14.4, 14.9) | −1.8 (−2.2, −1.5) | f | <.001 | 11.6 (11.3, 12.0) | 0.7 (0.2, 1.2) | f | .006 | 15.2 (13.9, 16.5) | 1.3 (−0.1, 2.7) | .06 | 11.3 (11.0, 11.5) | −0.6 (−1.0, −0.1) | f | .02 | |
| Pancreas | 10 | 14.7 (14.6, 14.8) | 1.1 (1.0, 1.1) | f | <.001 | 14.9 (14.8, 15.0) | 1.2 (1.1, 1.4) | f | <.001 | 17.8 (17.4, 18.1) | 0.6 (0.3, 1.0) | f | .001 | 10.3 (10.0, 10.7) | 0.6 (0.2, 1.0) | f | .01 | 13.2 (11.9, 14.6) | 2.2 (0.4, 4.0) | f | .02 | 11.9 (11.7, 12.2) | 0.5 (0.1, 0.8) | f | .01 |
| Liver and intrahepatic bile duct | 11 | 13.0 (12.9, 13.0) | 2.5 (1.9, 3.1) | f | <.001 | 10.8 (10.7, 10.9) | 2.1 (0.8, 3.5) | f | .005 | 18.4 (18.1, 18.7) | 1.9 (0.7, 3.1) | f | .004 | 20.0 (19.6, 20.5) | −0.9 (−1.3, −0.6) | f | <.001 | 22.6 (21.1, 24.2) | 4.7 (3.4, 6.1) | f | <.001 | 19.6 (19.3, 19.9) | 0.4 (−0.6, 1.4) | .44 | |
| Stomach | 12 | 9.1 (9.0, 9.1) | −1.5 (−3.0, 0.1) | .06 | 7.7 (7.7, 7.8) | −1.6 (−2.5, −0.8) | f | .002 | 14.1 (13.8, 14.4) | −1.9 (−2.1, −1.6) | f | <.001 | 13.6 (13.2, 14.0) | −2.8 (−3.3, −2.4) | f | <.001 | 12.0 (10.7, 13.3) | −3 (−4.0, −1.9) | f | <.001 | 12.1 (11.8, 12.3) | −2.0 (−2.4, −1.7) | f | <.001 | |
| Myeloma | 13 | 9.0 (9.0, 9.1) | 1.1 (−0.1, 2.4) | .07 | 8.3 (8.2, 8.3) | 1.1 (−0.1, 2.4) | .07 | 17.7 (17.4, 18.1) | 2.1 (1.8, 2.5) | f | <.001 | 5.2 (4.9, 5.4) | −1.5 (−4.0, 1.1) | .27 | 9.2 (8.0, 10.4) | 2.3 (−9.0, 14.9) | .71 | 8.4 (8.2, 8.6) | −0.6 (−3.2, 2.1) | .62 | |||||
| Esophagus | 14 | 7.9 (7.9, 8.0) | −0.5 (−1.3, 0.3) | .20 | 8.7 (8.7, 8.8) | −0.6 (−1.0, −0.2) | f | .005 | 6.6 (6.5, 6.8) | −4.6 (−5.0, −4.3) | f | <.001 | 3.6 (3.4, 3.8) | −0.9 (−2.0, 0.1) | .08 | 7.9 (7.0, 9.0) | −0.2 (−2.3, 2.0) | .86 | 5.0 (4.8, 5.1) | −1.7 (−2.3, −1.2) | f | <.001 | |||
| Brain and other nervous system | 15 | 7.8 (7.7, 7.8) | −0.3 (−0.4, −0.2) | f | <.001 | 8.9 (8.8, 8.9) | 0.0 (−0.1, 0.1) | .78 | 5.0 (4.9, 5.2) | 0.3 (−0.3, 0.8) | .32 | 4.4 (4.2, 4.6) | −0.5 (−1.7, 0.8) | .40 | 5.1 (4.4, 5.9) | −0.3 (−2.4, 1.8) | .74 | 5.7 (5.6, 5.9) | −0.9 (−1.1, −0.7) | f | <.001 | ||||
| Thyroid | 16 | 7.5 (7.5, 7.6) | 0.5 (−1.6, 2.6) | .65 | 8.4 (8.3, 8.4) | 0.6 (−1.5, 2.6) | .58 | 4.0 (3.9, 4.2) | 1.8 (−0.5, 4.1) | .11 | 7.4 (7.1, 7.7) | 0.5 (−3.4, 4.5) | .82 | 5.0 (4.3, 5.8) | 4.8 (2.3, 7.3) | f | .001 | 6.2 (6.1, 6.4) | 2.4 (0.8, 4.0) | f | .007 | ||||
| Larynx | 17 | 5.8 (5.7, 5.8) | −2.3 (−2.5, −2.2) | f | <.001 | 5.9 (5.8, 5.9) | −1.9 (−2.1, −1.8) | f | <.001 | 8.4 (8.1, 8.6) | −3.1 (−3.5, −2.8) | f | <.001 | 2.0 (1.9, 2.2) | −2.7 (−4.1, −1.3) | f | .001 | 5.3 (4.5, 6.1) | −1.5 (−3.1, 0.1) | .07 | 4.8 (4.6, 4.9) | −3.2 (−3.7, −2.8) | f | <.001 | |
| Females | |||||||||||||||||||||||||
| Breast | 1 | 126.8 (126.5, 127.0) | 0.5 (0.3, 0.6) | f | <.001 | 133.0 (132.7, 133.3) | 0.6 (0.4, 0.7) | f | <.001 | 129.6 (128.9, 130.3) | 0.6 (0.3, 0.9) | f | .003 | 96.5 (95.6, 97.4) | 1.5 (1.2, 1.9) | f | <.001 | 102.5 (99.4, 105.6) | 0.8 (0.3, 1.2) | f | .004 | 96.1 (95.5, 96.6) | 0.3 (0.1, 0.6) | f | .01 |
| Lung and bronchus | 2 | 51.8 (51.7, 51.9) | −1.1 (−1.3, −1.0) | f | <.001 | 57.5 (57.3, 57.7) | −0.9 (−1.0, −0.7) | f | <.001 | 49.3 (48.9, 49.8) | −1.6 (−2.0, −1.1) | f | <.001 | 28.2 (27.7, 28.7) | −1.5 (−3.1, 0.2) | .08 | 51.2 (48.9, 53.5) | −0.3 (−0.8, 0.2) | .22 | 23.1 (22.8, 23.4) | −0.8 (−1.1, −0.6) | f | <.001 | ||
| Colon and rectum | 3 | 34.4 (34.3, 34.6) | −0.3 (−0.7, 0.1) | .15 | 34.4 (34.3, 34.6) | −0.5 (−0.7, −0.3) | f | .001 | 40.8 (40.4, 41.2) | −1.3 (−2.6, 0.0) | .06 | 26.3 (25.8, 26.8) | −2.4 (−2.7, −2.1) | f | <.001 | 41.8 (39.8, 43.9) | −0.7 (−1.2, −0.2) | f | .01 | 30.0 (29.7, 30.3) | 0.3 (−0.9, 1.6) | .54 | |||
| Corpus and uterus, NOS | 4 | 26.9 (26.8, 27.1) | 1.3 (1.2, 1.4) | f | <.001 | 27.6 (27.5, 27.8) | 1.1 (1.0, 1.3) | f | <.001 | 27.1 (26.8, 27.4) | 2.4 (2.2, 2.6) | f | <.001 | 19.4 (19.0, 19.8) | 2.2 (1.9, 2.5) | f | <.001 | 24.5 (23.1, 26.0) | 1.7 (0.7, 2.6) | f | .002 | 24.0 (23.8, 24.3) | 2.9 (2.4, 3.4) | f | <.001 |
| Thyroid | 5 | 22.0 (21.9, 22.1) | −0.2 (−1.3, 0.8) | .65 | 23.3 (23.2, 23.5) | −0.3 (−1.3, 0.7) | .50 | 14.2 (14.0, 14.5) | −0.1 (−2.3, 2.2) | .94 | 22.4 (22.0, 22.8) | −1.8 (−4.0, 0.5) | .11 | 16.9 (15.7, 18.1) | 5.0 (3.9, 6.1) | f | <.001 | 23.3 (23.1, 23.6) | 1.7 (0.5, 2.9) | f | .01 | ||||
| Melanoma of the skin | 6 | 17.6 (17.5, 17.6) | 1.9 (1.5, 2.2) | f | <.001 | 23.8 (23.7, 23.9) | 2.5 (2.1, 2.8) | f | <.001 | 0.9 (0.9, 1.0) | −0.5 (−1.5, 0.4) | .25 | 1.2 (1.1, 1.3) | −0.3 (−1.6, 0.9) | .58 | 6.9 (6.0, 7.7) | 2.1 (0.6, 3.6) | f | .008 | 4.4 (4.3, 4.5) | 0.5 (−0.2, 1.2) | .14 | |||
| Non-Hodgkin lymphoma | 7 | 16.4 (16.3, 16.5) | −0.1 (−0.2, 0.0) | .16 | 17.1 (17.0, 17.2) | −0.1 (−0.2, 0.1) | .23 | 12.7 (12.5, 13.0) | 0.5 (0.3, 0.8) | f | .001 | 11.2 (10.9, 11.5) | 0.3 (−0.2, 0.9) | .23 | 14.2 (13.0, 15.4) | −0.7 (−1.7, 0.3) | .14 | 15.4 (15.2, 15.7) | 0.3 (0.0, 0.6) | .07 | |||||
| Kidney and renal pelvis | 8 | 11.7 (11.7, 11.8) | 0.6 (0.3, 0.9) | f | .002 | 11.8 (11.7, 11.9) | 1.2 (0.1, 2.2) | f | .03 | 13.6 (13.3, 13.8) | 0.5 (−0.3, 1.3) | .17 | 5.3 (5.1, 5.5) | 1.1 (0.2, 2.0) | f | .02 | 18.8 (17.5, 20.1) | 1.5 (0.4, 2.7) | f | .01 | 11.8 (11.6, 12.0) | 1.6 (1.2, 1.9) | f | <.001 | |
| Leukemia | 9 | 11.7 (11.6, 11.8) | 0.0 (−1.3, 1.3) | .98 | 12.3 (12.3, 12.4) | 0.0 (−1.5, 1.6) | .95 | 9.7 (9.5, 9.9) | 0.4 (−1.8, 2.7) | .69 | 6.6 (6.4, 6.8) | 1.0 (0.5, 1.6) | f | .001 | 8.7 (7.8, 9.7) | 0.4 (−1.3, 2.1) | .65 | 10.0 (9.8, 10.2) | 1.4 (0.9, 1.9) | f | <.001 | ||||
| Ovary | 10 | 11.4 (11.3, 11.4) | −1.6 (−1.7, −1.4) | f | <.001 | 11.9 (11.8, 12.0) | −1.7 (−1.8, −1.5) | f | <.001 | 9.4 (9.2, 9.6) | −0.8 (−1.1, −0.4) | f | <.001 | 9.5 (9.2, 9.8) | −0.2 (−0.6, 0.2) | .36 | 11.2 (10.2, 12.3) | −1.2 (−2.9, 0.5) | .14 | 10.2 (10.0, 10.4) | −1.3 (−1.6, −1.0) | f | <.001 | ||
| Pancreas | 11 | 11.3 (11.2, 11.4) | 1.0 (0.9, 1.2) | f | <.001 | 11.2 (11.1, 11.2) | 1.2 (1.0, 1.3) | f | <.001 | 14.9 (14.6, 15.1) | 0.6 (0.3, 1.0) | f | .001 | 8.8 (8.6, 9.1) | 0.7 (0.2, 1.2) | f | .007 | 10.7 (9.7, 11.8) | 0.5 (−0.9, 1.9) | .47 | 10.0 (9.8, 10.2) | 0.6 (0.4, 0.9) | f | <.001 | |
| Urinary bladder | 12 | 8.8 (8.7, 8.8) | −0.9 (−1.1, −0.7) | f | <.001 | 9.8 (9.8, 9.9) | −0.7 (−0.8, −0.5) | f | <.001 | 6.8 (6.6, 6.9) | −0.4 (−0.7, 0.0) | f | .03 | 3.7 (3.6, 3.9) | −0.8 (−1.7, 0.2) | .11 | 5.9 (5.1, 6.7) | 1.3 (−0.5, 3.1) | .15 | 5.0 (4.8, 5.1) | −1.3 (−1.9, −0.8) | f | <.001 | ||
| Cervix | 13 | 7.7 (7.7, 7.8) | 1.0 (−0.3, 2.4) | .15 | 7.2 (7.1, 7.3) | 1.4 (−0.1, 3.0) | .07 | 9.3 (9.1, 9.5) | −2.3 (−2.7, −1.9) | f | <.001 | 6.2 (5.9, 6.4) | −1.9 (−2.5, −1.3) | f | <.001 | 9.4 (8.5, 10.3) | −0.2 (−1.2, 0.8) | .70 | 10.0 (9.8, 10.1) | 1.1 (−0.4, 2.7) | .14 | ||||
| Oral cavity and pharynx | 14 | 6.5 (6.5, 6.6) | 0.5 (0.3, 0.7) | f | <.001 | 7.1 (7.0, 7.2) | 0.9 (0.7, 1.1) | f | <.001 | 5.3 (5.1, 5.4) | −0.7 (−0.9, −0.4) | f | <.001 | 5.4 (5.2, 5.6) | 0.2 (−0.6, 1.0) | .68 | 5.9 (5.2, 6.7) | −0.3 (−2.2, 1.7) | .75 | 4.3 (4.2, 4.5) | 0.3 (−0.3, 1.0) | .25 | |||
| Myeloma | 15 | 5.9 (5.8, 5.9) | 1.2 (0.4, 2.0) | f | .01 | 5.0 (4.9, 5.0) | 1.0 (0.0, 2.0) | f | .0496 | 13.1 (12.9, 13.4) | 2.3 (2.0, 2.7) | f | <.001 | 3.2 (3.0, 3.4) | 0.9 (0.0, 1.7) | f | .045 | 6.3 (5.5, 7.1) | 0.2 (−1.8, 2.2) | .87 | 5.8 (5.7, 6.0) | 2.0 (1.0, 2.9) | f | .001 | |
| Brain and other nervous system | 16 | 5.6 (5.6, 5.7) | −0.5 (−0.8, −0.3) | f | .001 | 6.4 (6.3, 6.5) | −0.3 (−0.6, 0.0) | .07 | 3.6 (3.5, 3.8) | −0.2 (−0.6, 0.3) | .48 | 3.3 (3.1, 3.5) | −1.7 (−6.3, 3.1) | .47 | 3.3 (2.8, 3.9) | −4.4 (−6.9, −1.8) | f | .005 | 4.5 (4.4, 4.6) | −0.7 (−1.1, −0.3) | f | .003 | |||
| Stomach | 17 | 4.7 (4.7, 4.7) | 0.1 (−0.4, 0.6) | .61 | 3.5 (3.5, 3.6) | 0.0 (−0.6, 0.6) | .98 | 7.6 (7.4, 7.8) | −1.2 (−1.6, −0.9) | f | <.001 | 8.0 (7.8, 8.3) | −2.5 (−3.1, −2.0) | f | <.001 | 6.9 (6.1, 7.7) | −1.5 (−3.2, 0.3) | .09 | 7.7 (7.5, 7.8) | −1.3 (−1.7, −0.9) | f | <.001 | |||
| Liver and intrahepatic bile duct | 18 | 4.5 (4.5, 4.6) | 3.7 (3.4, 4.0) | f | <.001 | 3.8 (3.7, 3.8) | 4.0 (3.7, 4.2) | f | <.001 | 5.6 (5.4, 5.7) | 3.7 (3.1, 4.2) | f | <.001 | 7.5 (7.3, 7.8) | −1.0 (−1.5, −0.4) | f | .003 | 9.8 (8.9, 10.8) | 2.9 (1.3, 4.5) | f | .001 | 7.5 (7.3, 7.7) | 2.3 (1.8, 2.8) | f | <.001 |
| Children | |||||||||||||||||||||||||
| Leukemia | 1 | 5.2 (5.1, 5.3) | 0.9 (0.5, 1.2) | f | <.001 | 5.3 (5.2, 5.4) | 0.8 (0.5, 1.1) | f | <.001 | 3.3 (3.1, 3.5) | 1.6 (1.0, 2.3) | f | <.001 | 5.2 (4.9, 5.6) | 0.6 (−0.2, 1.5) | .15 | 4.7 (3.9, 5.6) | 15.3 (0.6, 32.0) | f | .04 | 6.2 (6.0, 6.4) | 0.8 (0.2, 1.4) | f | .01 | |
| Brain and other nervous system | 2 | 3.8 (3.7, 3.8) | 0.8 (0.5, 1.1) | f | <.001 | 4.3 (4.2, 4.4) | 1.0 (0.6, 1.4) | f | <.001 | 3.0 (2.8, 3.1) | 1.5 (0.7, 2.3) | f | .001 | 2.8 (2.5, 3.0) | 1.1 (−0.1, 2.4) | .07 | 2.4 (1.9, 3.1) | —g | 3.0 (2.9, 3.1) | 0.0 (−0.4, 0.4) | .99 | ||||
| Lymphoma | 3 | 1.6 (1.6, 1.7) | 0.9 (0.4, 1.4) | f | .001 | 1.7 (1.6, 1.8) | 5.2 (0.7, 9.8) | f | .03 | 1.6 (1.5, 1.7) | 1.6 (0.5, 2.6) | f | .005 | 1.4 (1.3, 1.6) | 0.5 (−1.0, 2.1) | .50 | 1.2 (0.8, 1.6) | —g | 1.5 (1.4, 1.6) | 0.3 (−0.4, 0.9) | .38 | ||||
| AYA | |||||||||||||||||||||||||
| Female breast | 1 | 22.4 (22.2, 22.6) | 1.2 (0.5, 1.8) | f | .003 | 23.1 (22.8, 23.3) | 0.6 (0.4, 0.8) | f | <.001 | 27.1 (26.6, 27.7) | 0.5 (0.2, 0.7) | f | .002 | 19.8 (19.2, 20.5) | 0.9 (0.4, 1.5) | f | .003 | 16.6 (14.6, 18.7) | 0.3 (−1.4, 2.2) | .69 | 17.6 (17.2, 18.0) | 2.0 (−0.1, 4.2) | .06 | ||
| Thyroid | 2 | 12.2 (12.1, 12.3) | 1.7 (0.6, 2.8) | f | .006 | 14.0 (13.8, 14.1) | 1.4 (0.3, 2.5) | f | .02 | 5.8 (5.6, 6.0) | −0.1 (−5.5, 5.5) | .96 | 12.1 (11.7, 12.5) | 0.0 (−3.1, 3.1) | .99 | 8.6 (7.7, 9.6) | 3.7 (2.4, 4.9) | f | <.001 | 10.5 (10.3, 10.7) | 4.7 (4.2, 5.3) | f | <.001 | ||
| Testis | 3 | 10.9 (10.8, 11.1) | 0.8 (0.6, 0.9) | f | <.001 | 13.5 (13.3, 13.6) | 0.6 (0.4, 0.8) | f | <.001 | 2.5 (2.4, 2.7) | 0.5 (−0.7, 1.8) | .36 | 4.0 (3.7, 4.3) | 3.3 (2.1, 4.5) | f | <.001 | 10.8 (9.5, 12.3) | 0.6 (−0.7, 2.0) | .32 | 10.8 (10.5, 11.1) | 2.9 (2.4, 3.4) | f | <.001 | ||
| Lymphoma | 4 | 7.7 (7.6, 7.8) | −0.4 (−0.5, −0.3) | f | <.001 | 8.3 (8.2, 8.4) | −0.4 (−0.5, −0.2) | f | <.001 | 8.4 (8.2, 8.6) | −0.3 (−0.6, 0.0) | .06 | 5.2 (5.0, 5.5) | 2.1 (1.4, 2.7) | f | <.001 | 4.0 (3.3, 4.6) | −0.4 (−2.6, 2.0) | .75 | 6.1 (6.0, 6.3) | −0.1 (−0.4, 0.2) | .43 | |||
Abbreviations: AAPC, average annual percent change; AI/AN, American Indian/Alaska Native; API, Asian/Pacific Islander; AYA, adolescents and young adults; CI, confidence interval; NAACCR, North American Association of Central Cancer Registries; NOS, not otherwise specified; NPCR, National Program of Cancer Registries; PRCDA, Indian Health Services Purchased/Referred Care Delivery Area; SEER, Surveillance, Epidemiology, and End Results.
Rates are per 100,000 persons, adjusted for potential delays in reporting, and age standardized to the 2000 US standard population (19 age groups - Census P25–1130).
Fixed interval trends are characterized as the average annual percent change (AAPC), the weighted average of the annual percent changes over the fixed interval 2012–2016, using the underlying Joinpoint model (with up to two joinpoints) for the period of 2001–2016. Joinpoint Regression Program, Version 4.7.0.0 February 2019, Statistical Research and Applications Branch, National Cancer Institute.
Cancers are listed in descending rank order of sex-specific, age-adjusted incidence rates for 2012–2016 for all racial/ethnic groups combined. More than 15 cancers may appear males and females to include the top 15 cancers in each racial/ethnic group.
Racial/ethnic groups are mutually exclusive. Data for non-Hispanic AI/AN are restricted to PRCDA counties (excluding Minnesota).
NPCR and SEER areas reported by NAACCR as meeting high-quality incidence data standards for the specified time periods. Registries included in the incidence rate analysis (49 states and 1 Territory): Alabama, Alaska, Arizona, Arkansas, California, Colorado, Connecticut, Delaware, Florida, Georgia, Hawaii, Idaho, Illinois, Indiana, Iowa, Kansas, Kentucky, Louisiana, Maine, Maryland, Massachusetts, Michigan, Minnesota, Mississippi, Missouri, Montana, Nebraska, New Hampshire, New Jersey, New Mexico, New York, North Carolina, North Dakota, Ohio, Oklahoma, Oregon, Pennsylvania, Puerto Rico, Rhode Island, South Carolina, South Dakota, Tennessee, Texas, Utah, Vermont, Virginia, Washington, West Virginia, Wisconsin, Wyoming. Registries included in the Joinpoint regression analysis (46 states): Alabama, Alaska, Arizona, Arkansas, California, Colorado, Connecticut, Delaware, Florida, Georgia, Hawaii, Idaho, Illinois, Indiana, Iowa, Kansas, Kentucky, Louisiana, Maine, Maryland, Massachusetts, Michigan, Minnesota, Missouri, Montana, Nebraska, New Hampshire, New Jersey, New Mexico, New York, North Carolina, North Dakota, Ohio, Oklahoma, Oregon, Pennsylvania, Rhode Island, South Carolina, South Dakota, Texas, Utah, Vermont, Washington, West Virginia, Wisconsin, Wyoming.
The AAPC is statistically significantly different from zero (P < .05). Two-sided statistical significance for AAPC was determined using a t-test when the AAPC lay entirely within the last joinpoint segment or a z-test when the AAPC extended beyond the last joinpoint segment.
The statistic could not be calculated. The average annual percent change is based on <10 cases for at least 1 year within the time interval
Figure 1.
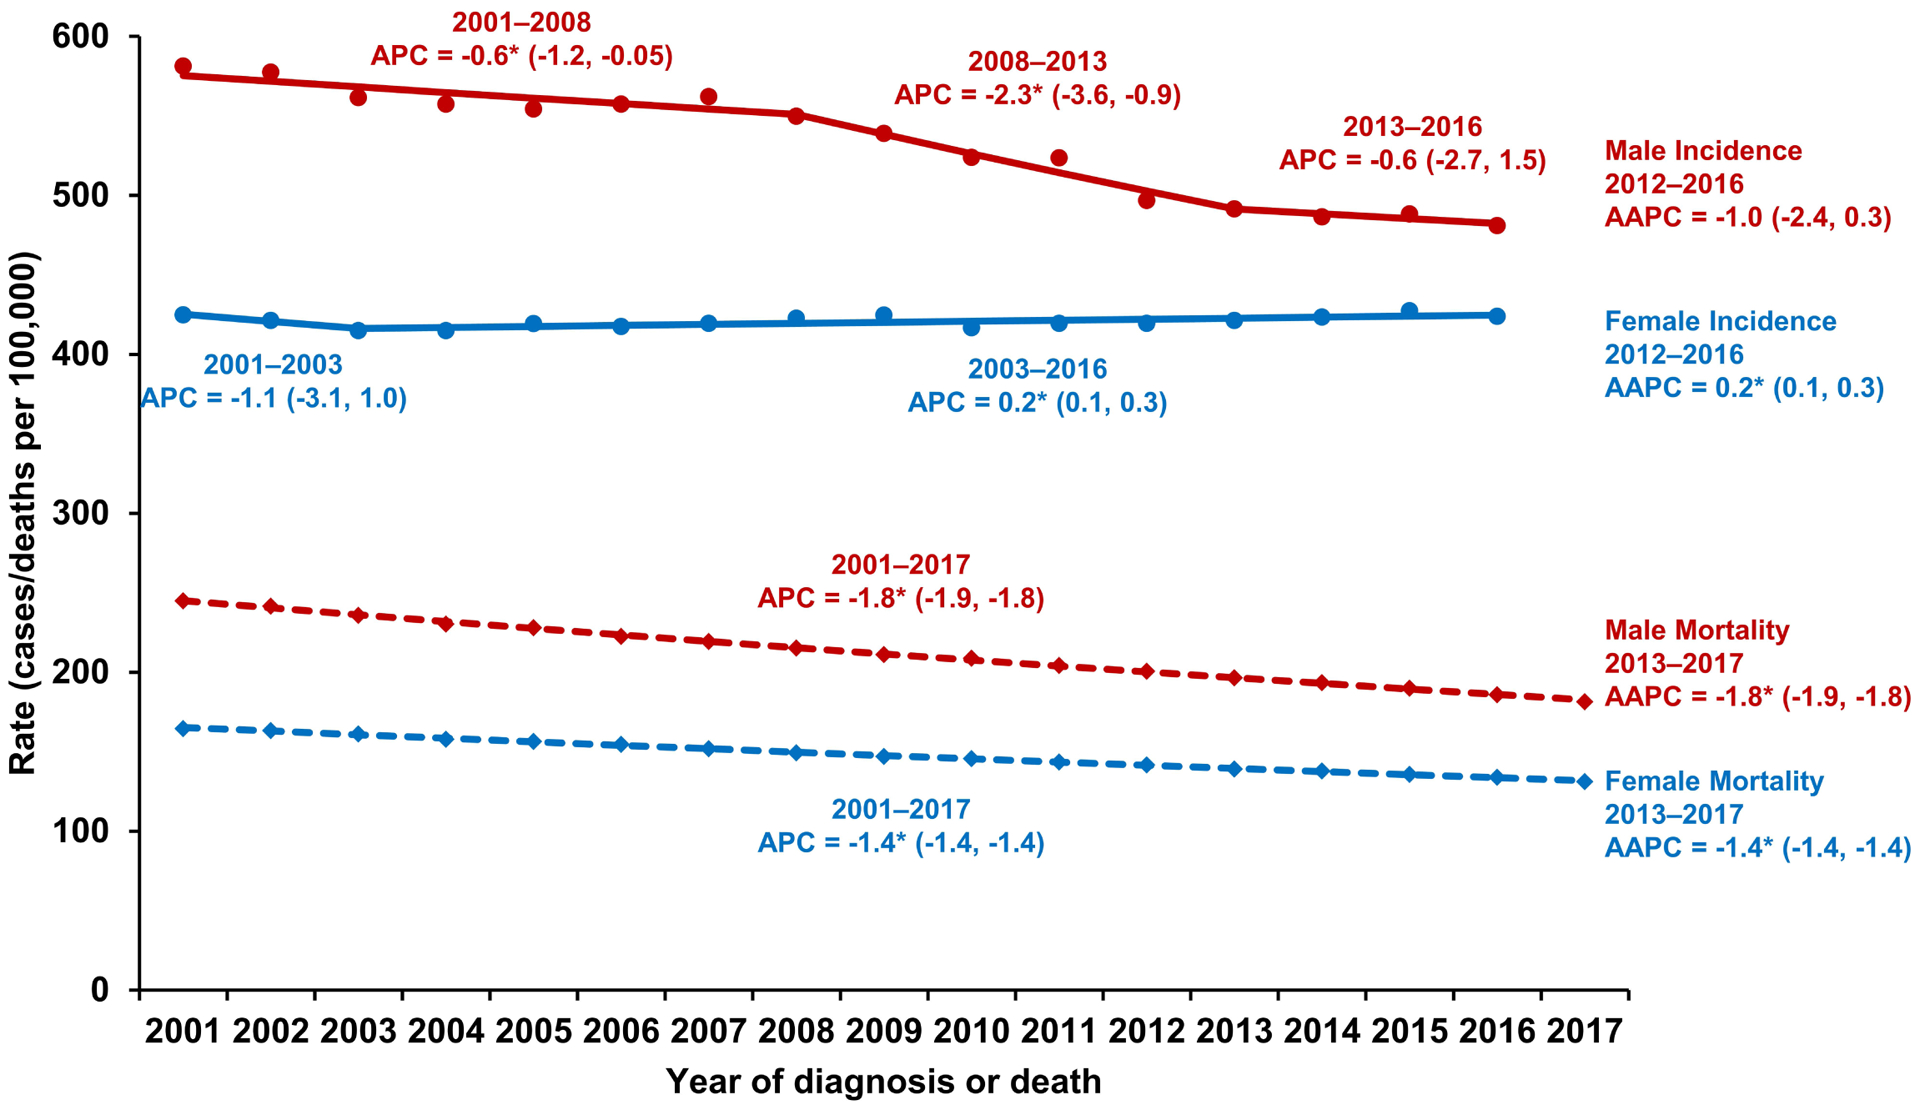
Trends in age-standardized incidence rates (2001–2016) and death rates (2001–2017) for all cancer sites combined, all races and ethnicities combined, by sex. Incidence rates were delay-adjusted and covered 93% of the US population and death rates covered the entire US population. Trends were estimated using joinpoint regression and characterized by annual percent change (APC), the slope of a single segment, and average APC (AAPC), a summary measure of the APCs over a fixed 5-year interval. The 16-year period for incidence allowed up to 3 different APCs, and the 17-year period for mortality allowed up to 4 different APCs. An asterisk (*) indicates that the APC or AAPC was statistically significantly different from 0 (p<.05). 95% confidence limits are given in parentheses.
Table 2.
Joinpoint trendsa in age-standardized, delay-adjusted incidence rates for the most common cancers,b all races/ethnicities combined by sex and age group, for areas in the United States with high-quality incidence data,c 2001–2016
| Trend 1 | Trend 2 | Trend 3 | Fixed Interval 2012–2016 | ||||||||||||
|---|---|---|---|---|---|---|---|---|---|---|---|---|---|---|---|
| Sex/Cancer Site or Type | Years | APC (95% CI) | P | Years | APC (95% CI) | P | Years | APC (95% CI) | P | AAPC (95% CI)d | P | ||||
| All sites | 1 | ||||||||||||||
| Both sexes | 2001–2016 | −0.6 (−0.7, −0.5) | e | <.001 | −0.6 (−0.7, −0.5) | e | <.001 | ||||||||
| Males | 2001–2008 | −0.6 (−1.2, 0.0) | e | .04 | 2008–2013 | −2.3 (−3.6, −0.9) | e | .004 | 2013–2016 | −0.6 (−2.7, 1.5) | .52 | −1.0 (−2.4, 0.3) | .14 | ||
| Females | 2001–2003 | −1.1 (−3.1, 1.0) | e | .28 | 2003–2016 | 0.2 (0.1, 0.3) | e | .007 | 0.2 (0.1, 0.3) | e | .007 | ||||
| Children (ages 0–14 years) | 2001–2016 | 0.8 (0.7, 1.0) | <.001 | 0.8 (0.7, 1.0) | e | <.001 | |||||||||
| AYA (ages 15–39 years) | 2001–2016 | 0.9 (0.8, 1.0) | e | <.001 | 0.9 (0.8, 1.0) | e | <.001 | ||||||||
| Males | e | ||||||||||||||
| Prostate | 2001–2009 | −1.6 (−3.2, 0.1) | .06 | 2009–2014 | −7.5 (−12.2, −2.6) | e | .008 | 2014–2016 | 3.7 (−12.4, 22.8) | .64 | −2.1 (−9.2, 5.5) | .58 | |||
| Lung and bronchus | 2001–2007 | −1.6 (−1.8, −1.3) | <.001 | 2007–2016 | −2.6 (−2.7, −2.4) | e | <.001 | −2.6 (−2.7, −2.4) | e | <.001 | |||||
| Colon and rectum | 2001–2012 | −3.2 (−3.4, −3.0) | e | <.001 | 2012–2016 | −1.1 (−2.1, −0.2) | e | .––03 | −1.1 (−2.1, −0.2) | e | .03 | ||||
| Urinary bladder | 2001–2005 | 0.1 (−0.5, 0.7) | e | .72 | 2005–2014 | −0.9 (−1.1, −0.7) | e | <.001 | 2014–2016 | −2.3 (−4.0, −0.5) | e | .02 | −1.6 (−2.3, −0.8) | e | <.001 |
| Melanoma of the skin | 2001–2016 | 2.2 (2.0, 2.4) | <.001 | 2.2 (2.0, 2.4) | e | <.001 | |||||||||
| Non–Hodgkin lymphoma | 2001–2014 | 0.3 (0.1, 0.4) | e | .003 | 2014–2016 | −2.3 (−5.1, 0.5) | .10 | −1.0 (−2.3, 0.2) | .11 | ||||||
| Kidney and renal pelvis | 2001–2007 | 3.0 (2.8, 3.2) | e | <.001 | 2007–2011 | 0.0 (−0.5, 0.5) | .88 | 2011–2016 | 1.5 (1.3, 1.7) | e | <.001 | 1.5 (1.3, 1.7) | e | <.001 | |
| Leukemia | 2001–2007 | −0.2 (−0.8, 0.4) | e | .43 | 2007–2014 | 2.1 (1.5, 2.7) | e | <.001 | 2014–2016 | −2.1 (−5.3, 1.1) | .17 | −0.1 (−1.5, 1.4) | .94 | ||
| Oral cavity and pharynx | 2001–2005 | −0.1 (−1.3, 1.1) | .87 | 2005–2016 | 1.2 (1.0, 1.4) | e | <.001 | 1.2 (1.0, 1.4) | e | <.001 | |||||
| Pancreas | 2001–2016 | 1.1 (1.0, 1.1) | <.001 | 1.1 (1.0, 1.1) | e | <.001 | |||||||||
| Liver and intrahepatic bile duct | 2001–2009 | 4.7 (4.1, 5.3) | e | <.001 | 2009–2016 | 2.5 (1.9, 3.1) | e | <.001 | 2.5 (1.9, 3.1) | e | <.001 | ||||
| Stomach | 2001–2006 | −2.1 (−3.0, −1.3) | e | <.001 | 2006–2014 | −0.4 (−0.9, 0.1) | .07 | 2014–2016 | −2.5 (−6.0, 1.1) | .14 | −1.5 (−3.0, 0.1) | .06 | |||
| Myeloma | 2001–2007 | 0.7 (0.2, 1.3) | e | .02 | 2007–2014 | 2.8 (2.3, 3.4) | e | <.001 | 2014–2016 | −0.5 (−3.3, 2.3) | .67 | 1.1 (−0.1, 2.4) | .07 | ||
| Esophagus | 2001–2008 | 0.3 (−0.2, 0.8) | .27 | 2008–2011 | −2.9 (−6.4, 0.7) | .10 | 2011–2016 | −0.5 (−1.3, 0.3) | .20 | −0.5 (−1.3, 0.3) | .20 | ||||
| Brain and other nervous system | 2001–2016 | −0.3 (−0.4, −0.2) | <.001 | −0.3 (−0.4, −0.2) | e | <.001 | |||||||||
| Thyroid | 2001–2009 | 7.0 (6.3, 7.7) | e | <.001 | 2009–2014 | 2.2 (0.6, 3.8) | e | .01 | 2014–2016 | −1.2 (−5.7, 3.5) | .56 | 0.5 (−1.6, 2.6) | .65 | ||
| Larynx | 2001–2016 | −2.3 (−2.5, −2.2) | e | <.001 | −2.3 (−2.5, −2.2) | e | <.001 | ||||||||
| Females | e | ||||||||||||||
| Breast | 2001–2004 | −2.8 (−4.3, −1.3) | .002 | 2004–2016 | 0.5 (0.3, 0.6) | e | <.001 | 0.5 (0.3, 0.6) | e | <.001 | |||||
| Lung and bronchus | 2001–2006 | 0.7 (0.2, 1.2) | e | .01 | 2006–2016 | −1.1 (−1.3, −1.0) | e | <.001 | −1.1 (−1.3, −1.0) | e | <.001 | ||||
| Colon and rectum | 2001–2007 | −2.4 (−2.6, −2.2) | e | <.001 | 2007–2012 | −3.4 (−3.8, −3.0) | e | <.001 | 2012–2016 | −0.3 (−0.7, 0.1) | .15 | −0.3 (−0.7, 0.1) | .15 | ||
| Corpus and uterus, NOS | 2001–2003 | −2.1 (−4.4, 0.3) | e | .09 | 2003–2016 | 1.3 (1.2, 1.4) | e | <.001 | 1.3 (1.2, 1.4) | e | <.001 | ||||
| Thyroid | 2001–2009 | 7.3 (6.8, 7.8) | <.001 | 2009–2013 | 2.3 (0.7, 4.0) | e | .01 | 2013–2016 | −1.1 (−2.7, 0.5) | .15 | −0.2 (−1.3, 0.8) | .65 | |||
| Melanoma of the skin | 2001–2016 | 1.9 (1.5, 2.2) | e | <.001 | 1.9 (1.5, 2.2) | e | <.001 | ||||||||
| Non–Hodgkin lymphoma | 2001–2016 | −0.1 (−0.2, 0.0) | e | .16 | −0.1 (−0.2, 0.0) | .16 | |||||||||
| Kidney and renal pelvis | 2001–2006 | 3.8 (2.7, 4.9) | <.001 | 2006–2016 | 0.6 (0.3, 0.9) | e | .002 | 0.6 (0.3, 0.9) | e | .002 | |||||
| Leukemia | 2001–2008 | 0.2 (−0.6, 1.1) | e | .52 | 2008–2011 | 3.6 (−2.4, 10.1) | .21 | 2011–2016 | 0.0 (−1.3, 1.3) | .98 | 0.0 (−1.3, 1.3) | .98 | |||
| Ovary | 2001–2016 | −1.6 (−1.7, −1.4) | <.001 | −1.6 (−1.7, −1.4) | e | <.001 | |||||||||
| Pancreas | 2001–2016 | 1.0 (0.9, 1.2) | e | <.001 | 1.0 (0.9, 1.2) | e | <.001 | ||||||||
| Urinary bladder | 2001–2016 | −0.9 (−1.1, −0.7) | e | <.001 | −0.9 (−1.1, −0.7) | e | <.001 | ||||||||
| Cervix | 2001–2003 | −3.8 (−7.6, 0.1) | e | .06 | 2003–2013 | −1.1 (−1.5, −0.7) | e | <.001 | 2013–2016 | 1.7 (−0.4, 3.9) | .10 | 1.0 (−0.3, 2.4) | .15 | ||
| Oral cavity and pharynx | 2001–2016 | 0.5 (0.3, 0.7) | <.001 | 0.5 (0.3, 0.7) | e | <.001 | |||||||||
| Myeloma | 2001–2007 | 0.1 (−0.6, 0.8) | e | .65 | 2007–2011 | 3.7 (1.7, 5.7) | e | .002 | 2011–2016 | 1.2 (0.4, 2.0) | e | .01 | 1.2 (0.4, 2.0) | e | .01 |
| Brain and other nervous system | 2001–2005 | 0.8 (−0.4, 2.1) | .17 | 2005–2016 | −0.5 (−0.8, −0.3) | e | .001 | −0.5 (−0.8, −0.3) | e | .001 | |||||
| Stomach | 2001–2008 | −1.1 (−1.7, −0.5) | .002 | 2008–2016 | 0.1 (−0.4, 0.6) | .61 | 0.1 (−0.4, 0.6) | .61 | |||||||
| Liver and intrahepatic bile duct | 2001–2016 | 3.7 (3.4, 4.0) | e | <.001 | 3.7 (3.4, 4.0) | e | <.001 | ||||||||
| Children | e | ||||||||||||||
| Leukemia | 2001–2016 | 0.9 (0.5, 1.2) | <.001 | 0.9 (0.5, 1.2) | e | <.001 | |||||||||
| Brain and other nervous system | 2001–2016 | 0.8 (0.5, 1.1) | e | <.001 | 0.8 (0.5, 1.1) | e | <.001 | ||||||||
| Lymphoma | 2001–2016 | 0.9 (0.4, 1.4) | e | .001 | 0.9 (0.4, 1.4) | e | .001 | ||||||||
| AYA | e | ||||||||||||||
| Female breast | 2001–2010 | 0.0 (−0.4, 0.3) | .95 | 2010–2016 | 1.2 (0.5, 1.8) | e | .003 | 1.2 (0.5, 1.8) | e | .003 | |||||
| Thyroid | 2001–2010 | 5.8 (5.1, 6.6) | <.001 | 2010–2016 | 1.7 (0.6, 2.8) | e | .006 | 1.7 (0.6, 2.8) | e | .006 | |||||
| Testis | 2001–2016 | 0.8 (0.6, 0.9) | e | <.001 | 0.8 (0.6, 0.9) | e | <.001 | ||||||||
| Lymphoma | 2001–2016 | −0.4 (−0.5, −0.3) | e | <.001 | −0.4 (−0.5, −0.3) | e | <.001 | ||||||||
Abbreviations: AAPC, average annual percent change; APC, annual percent change; AYA, adolescents and young adults; CI, confidence interval; NAACCR, North American Association of Central Cancer Registries; NOS, not otherwise specified; NPCR, National Program of Cancer Registries; SEER, Surveillance, Epidemiology, and End Results.
Joinpoint models with up to two joinpoints are based on rates per 100,000 persons, adjusted for potential delays in reporting and age standardized to the 2000 US standard population (19 age groups - Census P25–1130). Joinpoint Regression Program, Version 4.7.0.0 February 2019, Statistical Research and Applications Branch, National Cancer Institute.
Cancers are listed in descending rank order of sex-specific, age-adjusted incidence rates for 2012–2016 for all racial/ethnic groups combined. More than 15 cancers may appear males and females to include the top 15 cancers in each racial/ethnic group.
NPCR and SEER areas reported by NAACCR as meeting high-quality incidence data standards for 2001–2016 (46 states): Alabama, Alaska, Arizona, Arkansas, California, Colorado, Connecticut, Delaware, Florida, Georgia, Hawaii, Idaho, Illinois, Indiana, Iowa, Kansas, Kentucky, Louisiana, Maine, Maryland, Massachusetts, Michigan, Minnesota, Missouri, Montana, Nebraska, New Hampshire, New Jersey, New Mexico, New York, North Carolina, North Dakota, Ohio, Oklahoma, Oregon, Pennsylvania, Rhode Island, South Carolina, South Dakota, Texas, Utah, Vermont, Washington, West Virginia, Wisconsin, Wyoming.
The AAPC is the weighted average of the APCs over the fixed interval 2012–2016 using the underlying Joinpoint model for the period of 2001–2016.
The APC or AAPC is statistically significantly different from zero (P < .05). Two-sided statistical significance for APC was determined using a t-test and for AAPC using a t-test when the AAPC lay entirely within the last joinpoint segment or a z-test when the AAPC extended beyond the last joinpoint segment.
By racial/ethnic group, overall cancer incidence rates in the most recent 5 years were stable only among white males and decreased among black, API, AI/AN, and Hispanic males (Table 1). Overall cancer incidence rates in the most recent 5 years increased among females in every racial/ethnic group (Table 1). The overall cancer incidence rate was similar among white persons and black persons but higher among black males than white males and higher among white females than black females (Figure 2). The overall cancer incidence rate was higher among males than females in every racial/ethnic group, except API, where the rates were similar.
Figure 2.
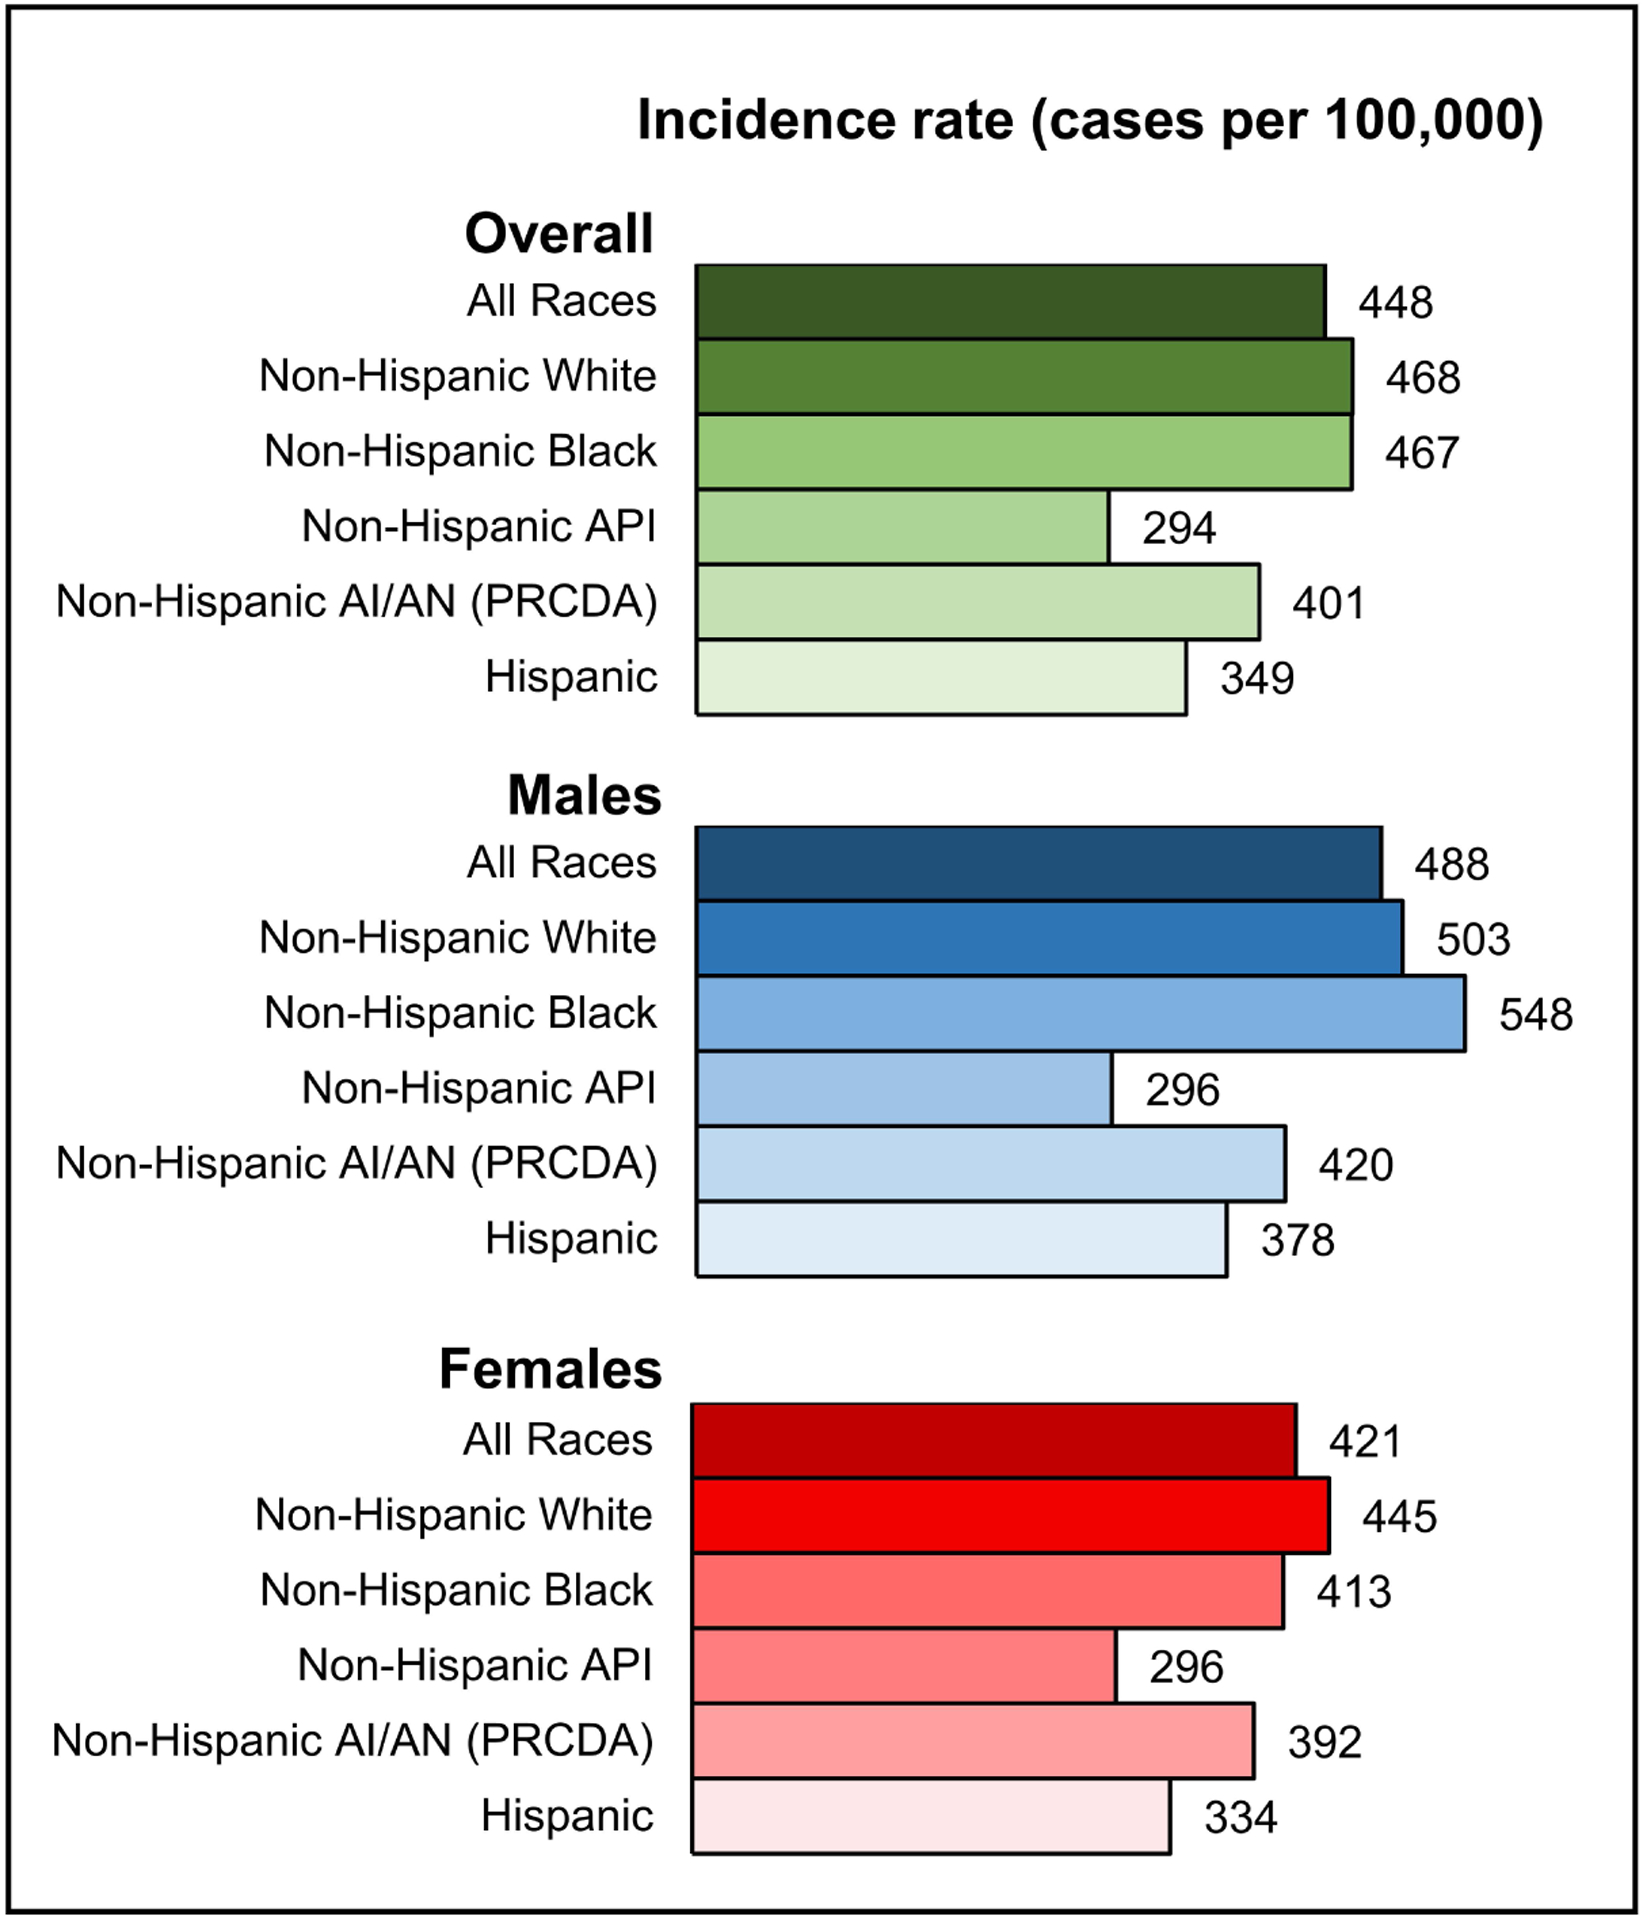
Age-standardized, delay-adjusted overall cancer incidence rates for 2012–2016 among males and females by racial/ethnic group. Racial/ethnic groups are mutually exclusive. Data for non-Hispanic AI/AN are restricted to PRCDA counties. Abbreviations: AI/AN, American Indian/Alaska Native; API, Asian/Pacific Islander; PRCDA, Indian Health Service Purchased/Referred Care Delivery Areas.
The stable trend in overall cancer incidence among males was largely driven by stable trends for 7 of the 17 most common cancers: myeloma, thyroid, leukemia, esophagus, non-Hodgkin lymphoma (NHL), stomach, and prostate (Figure 3A, Table 1). Incidence rates decreased for 5 cancers among males: lung and bronchus (lung; AAPC = −2.6%); larynx (−2.3%); urinary bladder (bladder; −1.6%); colon and rectum (colorectal; −1.1%); and brain and other nervous systems (ONS; −0.3%). However, incidence rates increased for 5 cancers: liver and intrahepatic bile duct (liver; 2.5%); melanoma of the skin (melanoma; 2.2%); kidney and renal pelvis (kidney; 1.5%); oral cavity and pharynx (1.2%); and pancreas (1.1%). Trends for the 3 most common cancers differed by racial/ethnic group: prostate cancer incidence rates decreased among Hispanic males but were stable among white, black, API, and AI/AN males, and lung and colorectal cancer incidence rates decreased among white, black, API, and Hispanic males but were stable among AI/AN males (Table 1).
Figure 3.
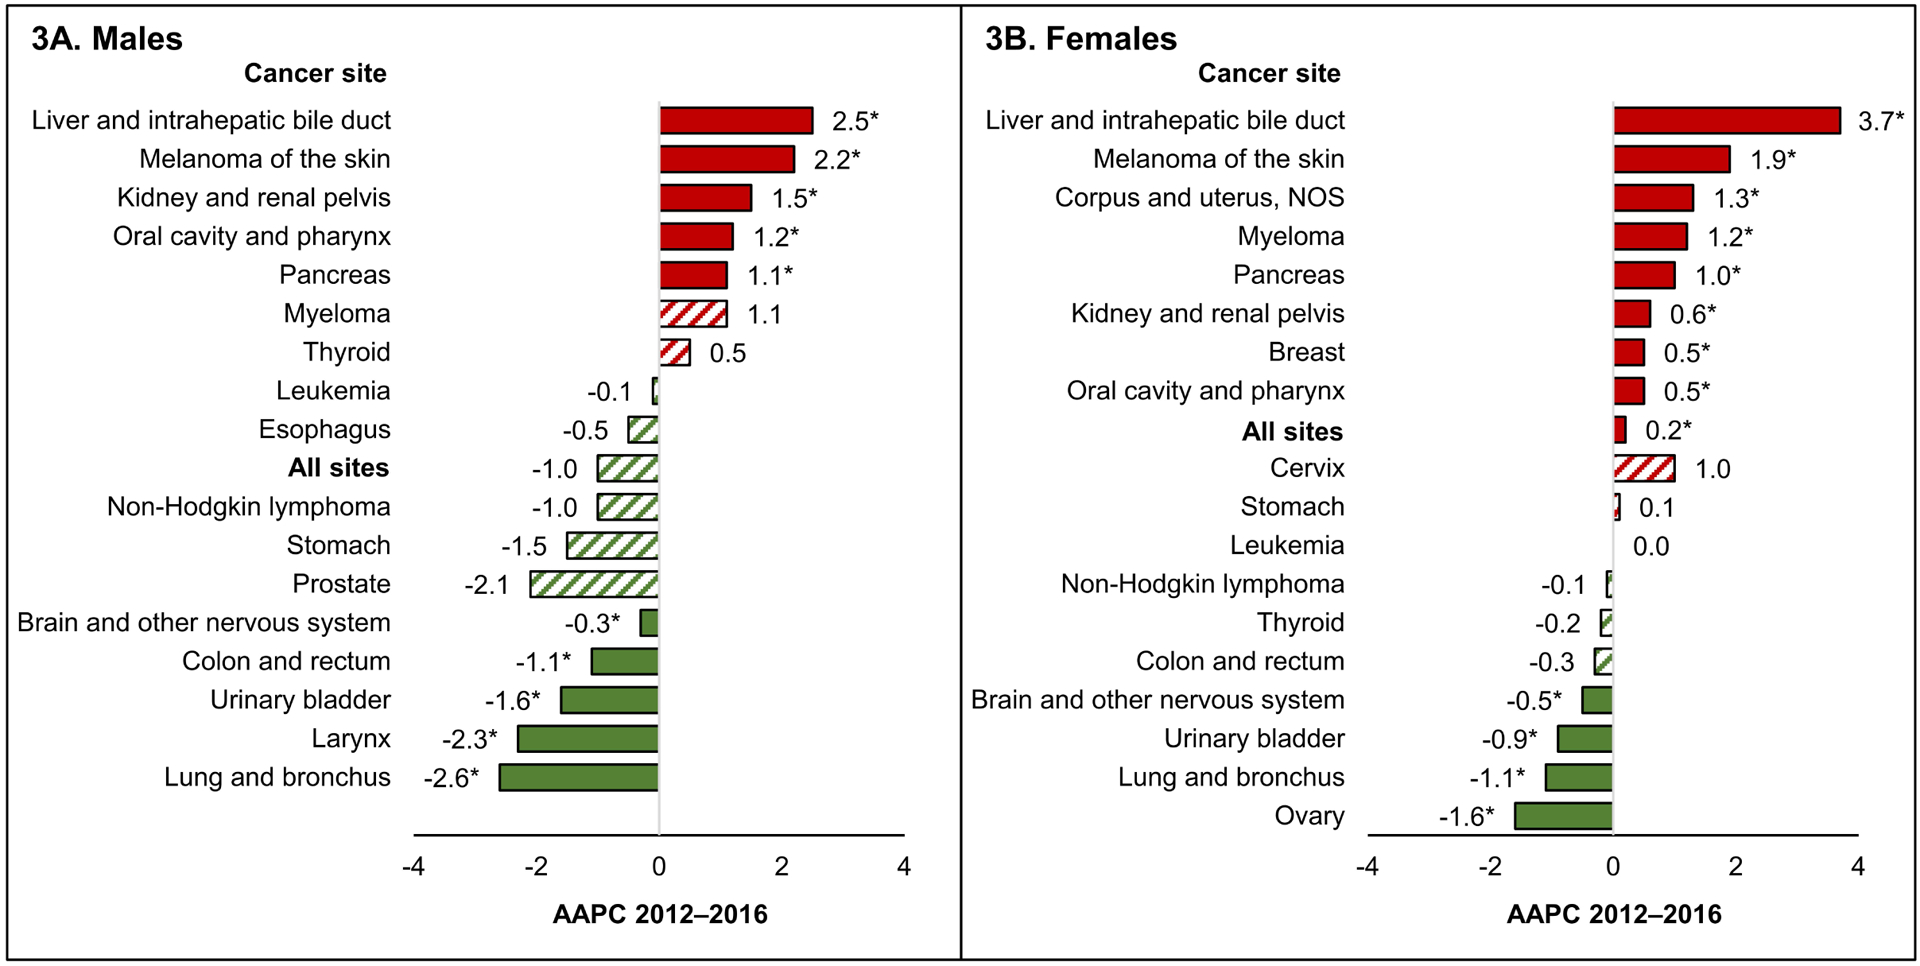
Average annual percent change (AAPC) in age-standardized, delay-adjusted incidence rates for 2012–2016 for all sites and the 17 most common cancers in men and the 18 most common cancers in women, all ages, all races/ethnicities combined, among A) males and B) females. The AAPC was a weighted average of the annual percent change (APCs) over the fixed 5-year interval 2012–2016 using the underlying joinpoint regression model, which allowed up to 3 different APCs, for the 16-year period 2001–2016. AAPCs with an asterisk (*) were statistically significantly different from zero (P<0.05) and are depicted as solid-colored bars; AAPCs with hash marks were not statistically significantly different from zero (stable). Abbreviations: NOS, not otherwise specified.
The slight increase in overall incidence among females was in part because incidence rates increased for 8 of the 18 most common cancers (liver [AAPC = 3.7%], melanoma [1.9%], corpus and uterus, not otherwise specified [uterus, 1.3%], myeloma [1.2%], pancreas [1.0%], kidney [0.6%], breast [0.5%], and oral cavity and pharynx [0.5%]) but decreased for only 4 cancers (ovary [−1.6%], lung [−1.1%], bladder [−0.9%], and brain and ONS [−0.5%]) and were stable for 6 cancers (cervix, stomach, leukemia, NHL, thyroid, and colorectum) (Figure 3B, Table 1). Breast cancer incidence rates increased among females in every racial/ethnic group, while lung cancer incidence rates decreased among white, black, and Hispanic females but were stable among API and AI/AN females. Colorectal cancer incidence rates decreased among white, API, and AI/AN females but were stable among black and Hispanic females (Table 1).
Overall cancer incidence rates in 2012–2016 ranged from 363 to 517 cases per 100,000 persons (Figure 4A). During 2012–2016, cancer incidence rates decreased in 31 states and were stable in 15 states; trends could not be calculated for 4 states, the District of Columbia, or Puerto Rico because data were not available for the entire period (Figure 4B).
Figure 4.
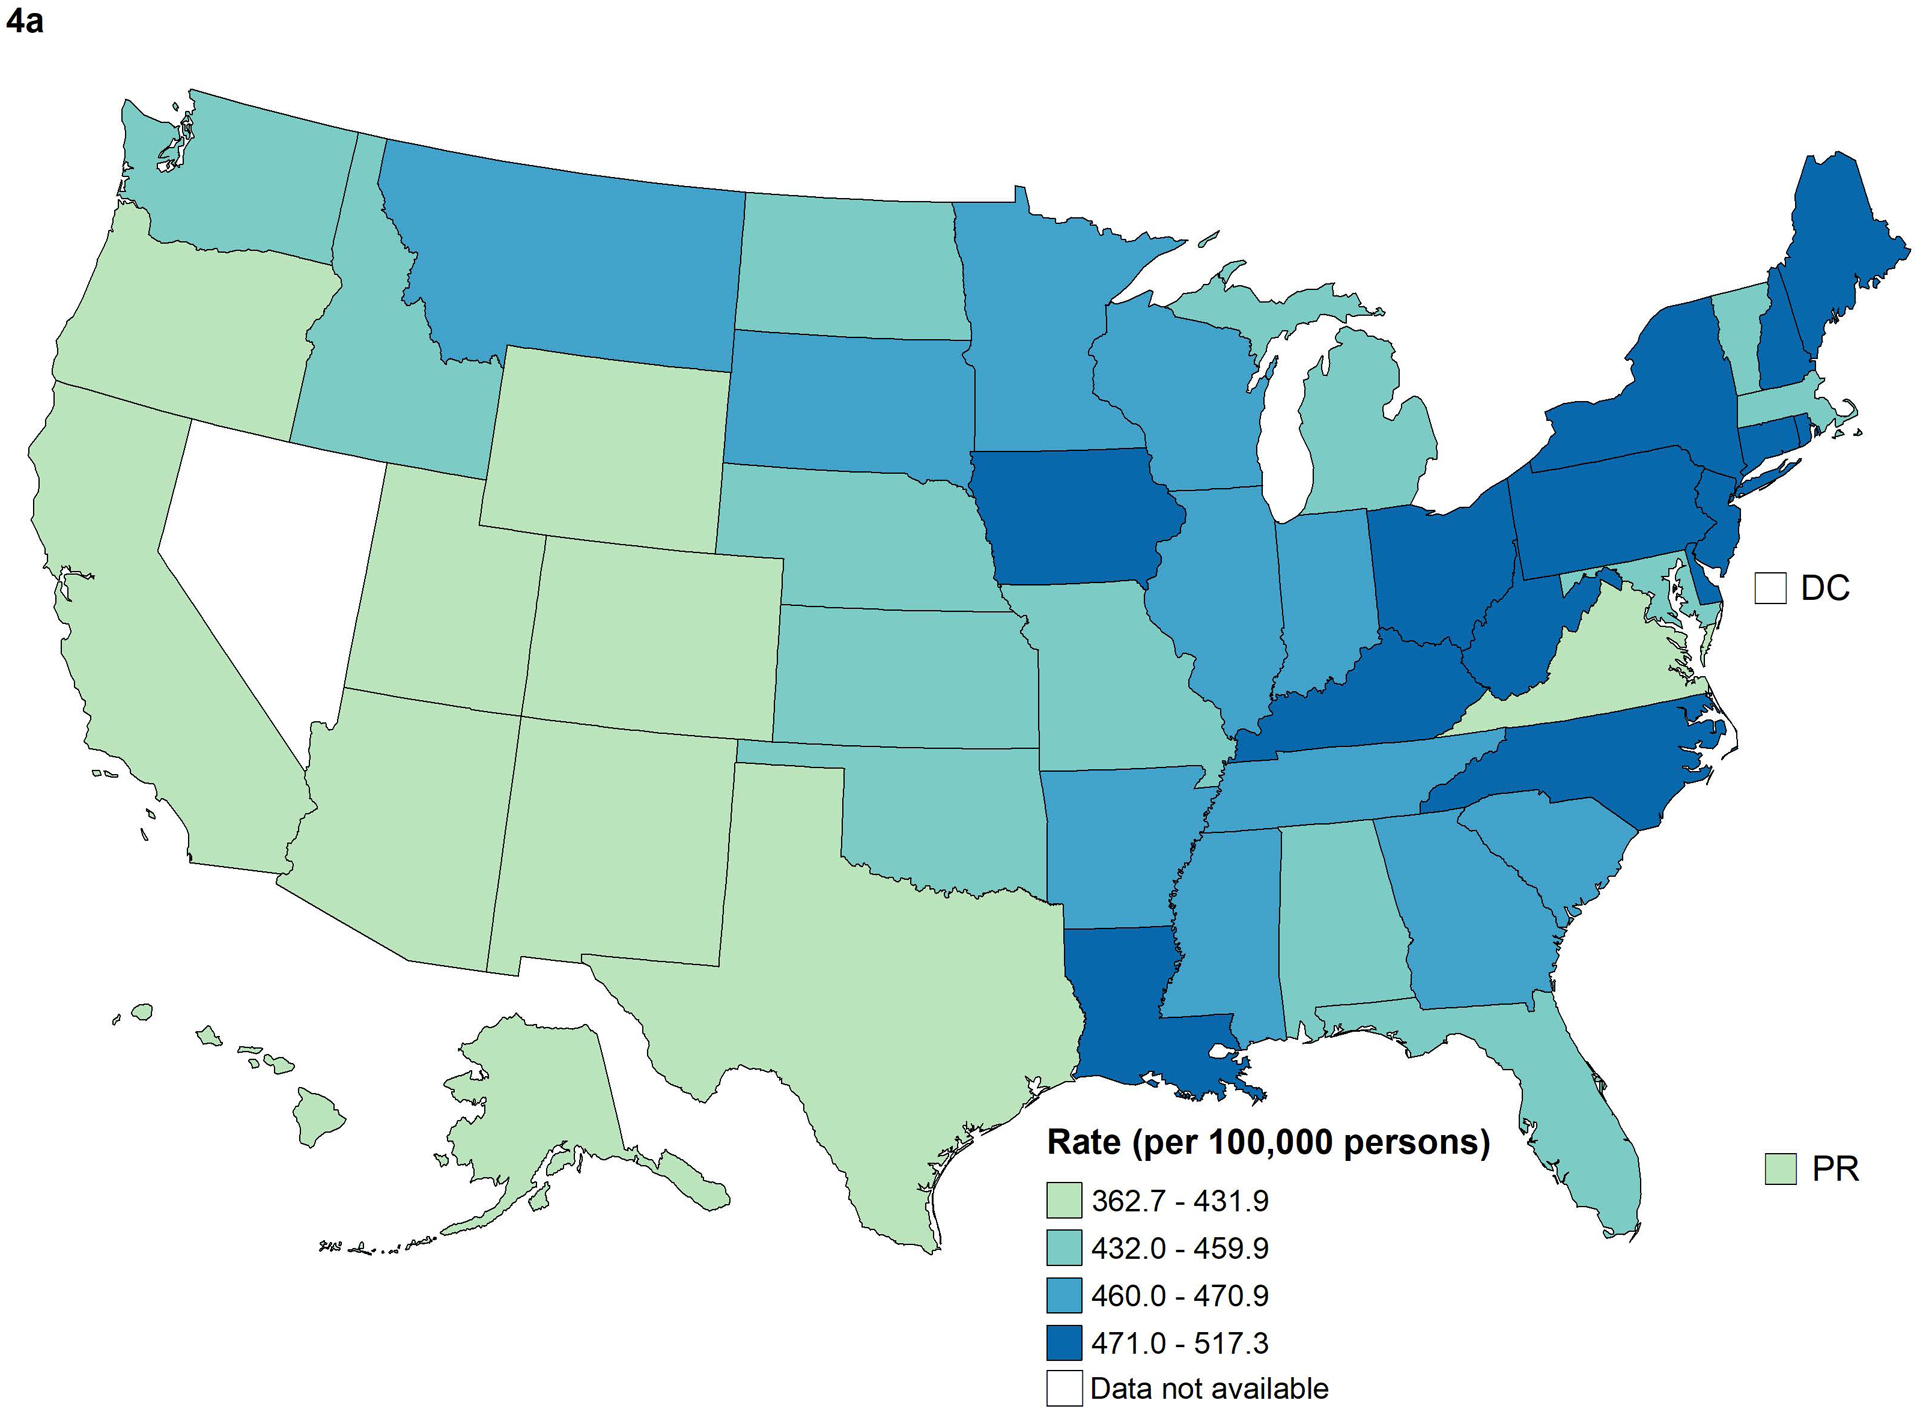
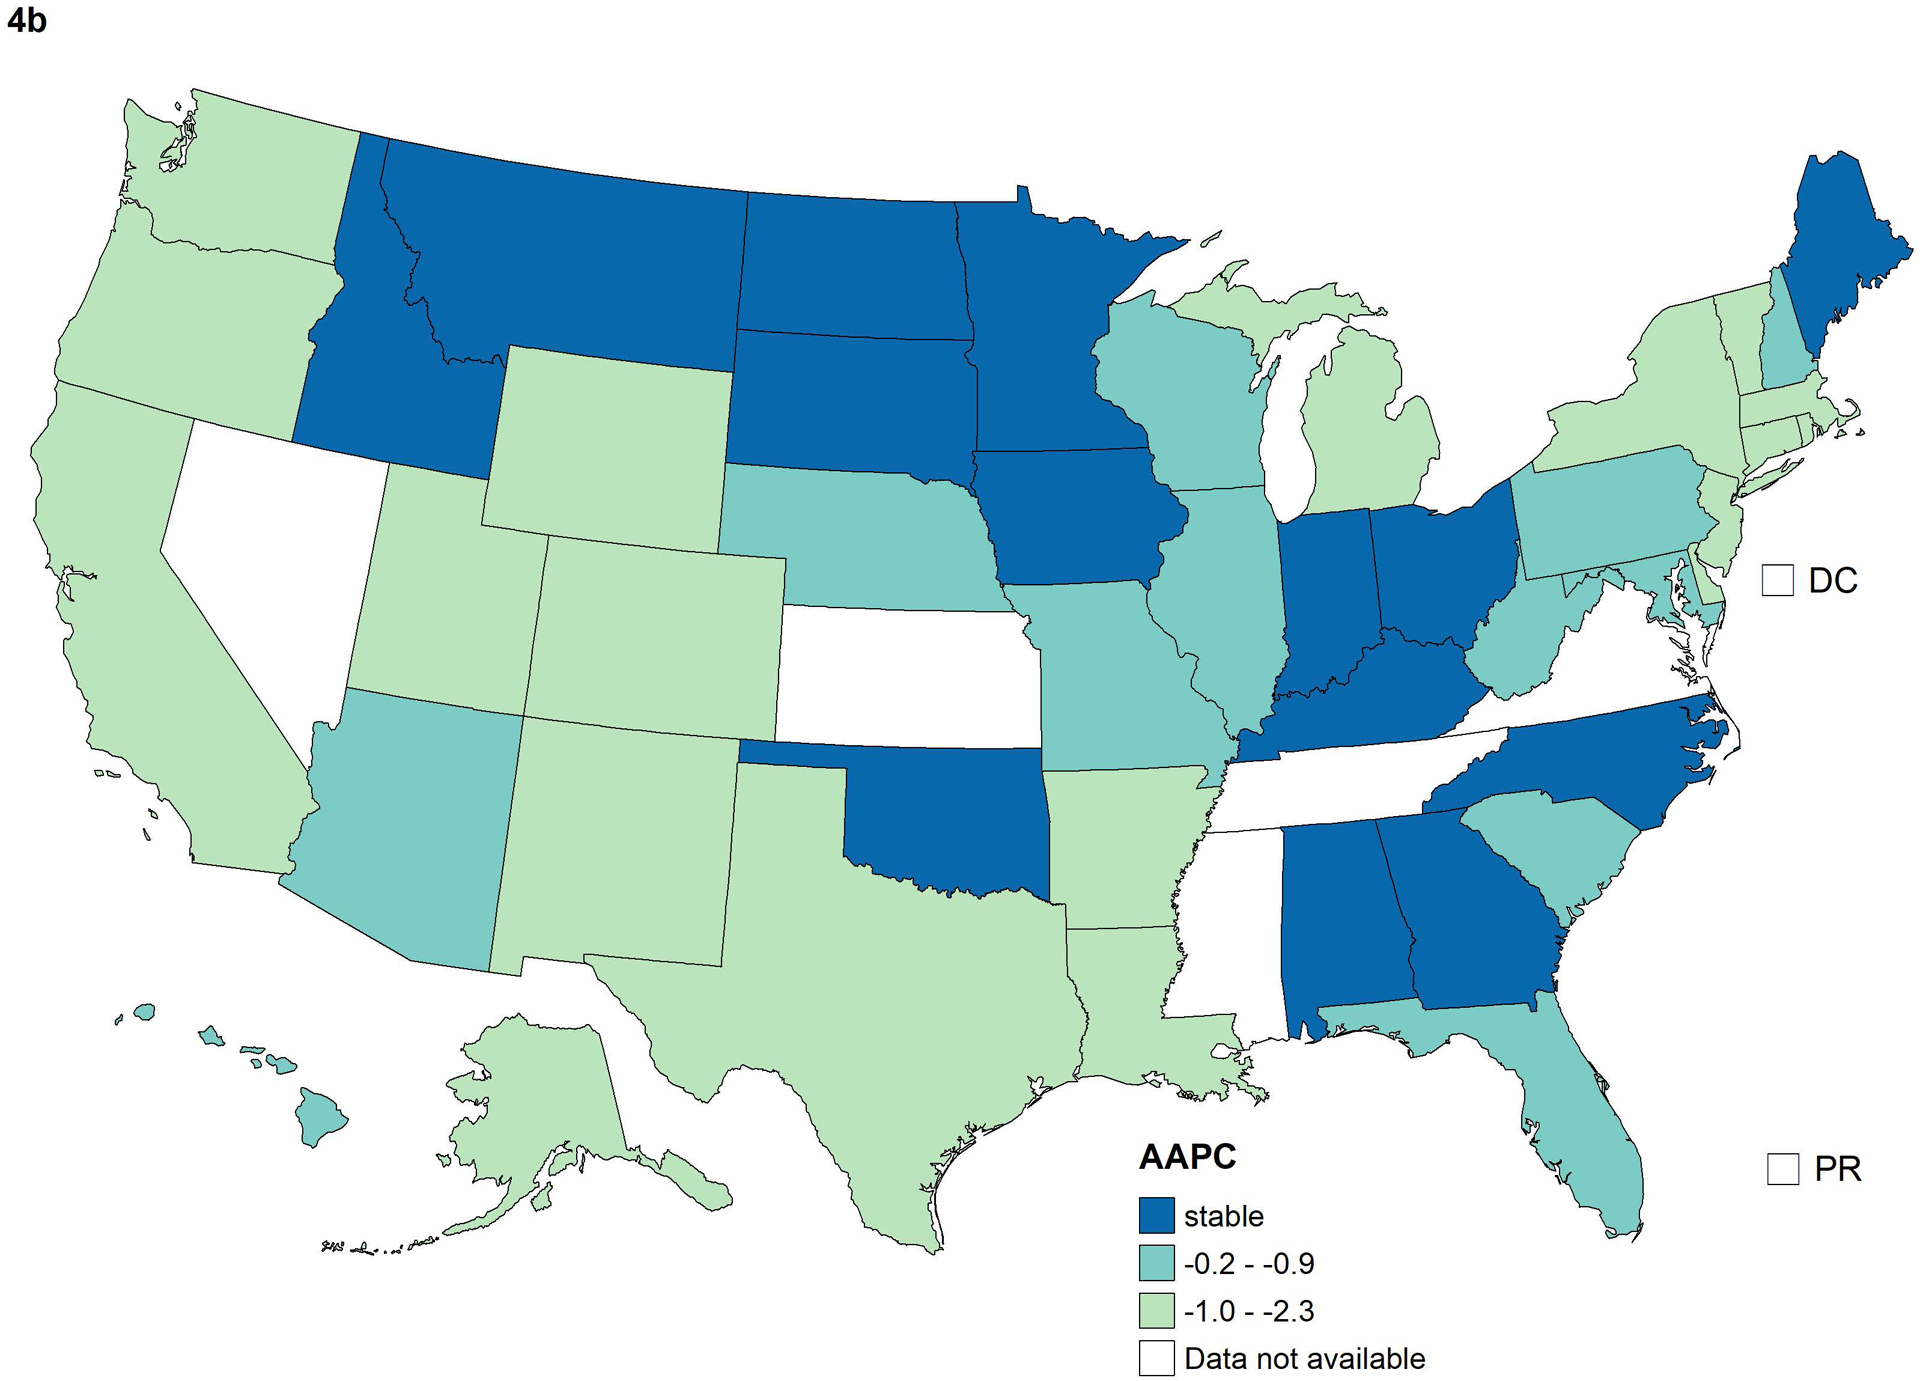
Age-standardized, delay-adjusted overall cancer incidence rates for 2012–2016 (A) and average annual percent change (AAPC) in rates for 2012–2016 (B) by state. The AAPC was a weighted average of the annual percent change (APCs) over the fixed 5-year interval 2012–2016 using the underlying joinpoint regression model, which allowed up to 3 different APCs, for the 16-year period 2001–2016. Stable AAPCs were not statistically significantly different from zero (P<0.05).
Cancer Death Rates and Trends
Overall, cancer death rates decreased 1.5% on average per year during 2001–2017, decreasing more rapidly among males (APC = −1.8%) than among females (APC = −1.4%) (Figure 1). Overall cancer death rates decreased during 2013–2017 in every racial/ethnic group, decreasing the most among black persons (AAPC = −2.0%) and the least among AI/AN persons (AAPC = −0.6%) (Table 3). The overall cancer death rate was highest among black persons, next highest among AI/AN and white persons, and lowest among API persons (Figure 5).
Table 3.
Age-standardized death ratesa and fixed-interval trends (2013–2017)b for the most common causes of cancer death,c by sex and racial/ethnic group,d United Statese
| Sex/cancer site or type | All Races | Non-Hispanic White | Non-Hispanic Black | Non-Hispanic API | Non-Hispanic AI/AN (PRCDA) | Hispanic | |||||||||||||||||||
|---|---|---|---|---|---|---|---|---|---|---|---|---|---|---|---|---|---|---|---|---|---|---|---|---|---|
| Rank | Rate (95% CI) | AAPC (95% CI) | P | Rate (95% CI) | AAPC (95% CI) | P | Rate (95% CI) | AAPC (95% CI) | P | Rate (95% CI) | AAPC (95% CI) | P | Rate (95% CI) | AAPC (95% CI) | Rate (95% CI) | AAPC (95% CI) | P | ||||||||
| All sites | |||||||||||||||||||||||||
| Both sexes | 158.2 (158.0, 158.3) | −1.5 (−1.6, −1.5) | f | <.001 | 162.9 (162.7, 163.1) | −1.4 (−1.4, −1.3) | f | <.001 | 186.4 (185.8, 187.1) | −2.0 (−2.1, −2.0) | f | <.001 | 98.9 (98.3, 99.6) | −1.3 (−1.4, −1.2) | f | <.001 | 166.0 (162.8, 169.3) | −0.6 (−0.9, −0.3) | f | <.001 | 111.8 (111.3, 112.3) | −1.3 (−1.4, −1.2) | f | <.001 | |
| Males | 189.3 (189.0, 189.6) | −1.8 (−1.9, −1.8) | f | <.001 | 193.8 (193.4, 194.1) | −1.6 (−1.7, −1.6) | f | <.001 | 233.2 (232.1, 234.4) | −2.6 (−2.7, −2.6) | f | <.001 | 117.4 (116.2, 118.5) | −1.6 (−1.8, −1.5) | f | <.001 | 200.3 (194.8, 205.8) | −0.5 (−1.0, 0.0) | f | .03 | 135.6 (134.7, 136.5) | −1.6 (−1.7, −1.6) | f | <.001 | |
| Females | 135.5 (135.3, 135.7) | −1.4 (−1.4, −1.4) | f | <.001 | 139.9 (139.6, 140.2) | −1.3 (−1.3, −1.3) | f | <.001 | 157.5 (156.8, 158.3) | −1.6 (−1.6, −1.5) | f | <.001 | 85.7 (84.8, 86.5) | −1.0 (−1.2, −0.9) | f | <.001 | 141.0 (137.1, 144.9) | −0.9 (−1.1, −0.6) | f | <.001 | 95.1 (94.4, 95.7) | −1.0 (−1.1, −0.9) | f | <.001 | |
| Children (ages 0–14 years) | 2.1 (2.0, 2.1) | −1.4 (−1.8, −1.1) | f | <.001 | 2.1 (2.0, 2.2) | −1.4 (−1.8, −1.1) | f | <.001 | 2.1 (2.0, 2.3) | −1.2 (−1.9, −0.6) | f | <.001 | 1.8 (1.6, 2.0) | −1.6 (−3.3, 0.2) | .07 | 2.6 (2.0, 3.4) | —g | 2.1 (2.0, 2.2) | −1.6 (−2.2, −1.1) | f | <.001 | ||||
| AYA (ages 15–39 years) | 8.9 (8.9, 9.0) | −1.0 (−1.2, −0.7) | f | <.001 | 8.9 (8.8, 9.0) | −1.2 (−1.5, −0.9) | f | <.001 | 11.4 (11.2, 11.7) | −1.6 (−1.8, −1.3) | f | <.001 | 6.9 (6.7, 7.2) | −0.8 (−1.3, −0.4) | f | .002 | 11.0 (9.8, 12.4) | −0.5 (−2.2, 1.1) | .50 | 8.1 (7.9, 8.2) | 1.1 (0.6, 1.6) | f | .001 | ||
| Males | |||||||||||||||||||||||||
| Lung and Bronchus | 1 | 49.3 (49.1, 49.4) | −4.8 (−5.4, −4.2) | f | <.001 | 51.8 (51.7, 52.0) | −4.4 (−4.7, −4.1) | f | <.001 | 60.4 (59.8, 61.0) | −5.7 (−6.3, −5.2) | f | <.001 | 29.3 (28.7, 29.9) | −3.0 (−3.4, −2.5) | f | <.001 | 46.5 (43.9, 49.2) | −1.5 (−2.4, −0.7) | f | .002 | 24.1 (23.7, 24.5) | −5.4 (−8.0, −2.6) | f | <.001 |
| Prostate | 2 | 19.1 (19.0, 19.2) | −0.3 (−1.6, 1.0) | .60 | 18.0 (17.9, 18.1) | 0.1 (−1.2, 1.4) | .88 | 38.7 (38.2, 39.2) | −3.9 (−4.2, −3.6) | f | <.001 | 8.6 (8.3, 9.0) | −2.3 (−2.8, −1.8) | f | <.001 | 21.2 (19.3, 23.3) | −1.2 (−2.4, −0.1) | f | .04 | 15.7 (15.4, 16.0) | −0.7 (−2.2, 0.7) | .32 | |||
| Colon and Rectum | 3 | 16.6 (16.5, 16.7) | −2.3 (−2.5, −2.1) | f | <.001 | 16.3 (16.2, 16.4) | −1.8 (−2.3, −1.2) | f | <.001 | 23.8 (23.5, 24.2) | −2.6 (−2.8, −2.4) | f | <.001 | 11.5 (11.1, 11.9) | −2.1 (−2.5, −1.7) | f | <.001 | 23.1 (21.3, 25.0) | 0.2 (−1.0, 1.4) | .77 | 14.1 (13.9, 14.4) | −1.7 (−1.9, −1.5) | f | <.001 | |
| Pancreas | 4 | 12.7 (12.6, 12.7) | 0.3 (0.2, 0.4) | f | <.001 | 13 (12.9, 13.1) | 0.5 (0.4, 0.6) | f | <.001 | 15.3 (15.0, 15.6) | −0.2 (−0.4, 0.0) | .06 | 8.2 (7.9, 8.5) | 0.0 (−0.5, 0.4) | .98 | 11.9 (10.6, 13.3) | 0.0 (−1.6, 1.7) | .95 | 9.3 (9.1, 9.5) | −0.1 (−0.5, 0.4) | .69 | ||||
| Liver and Intrahepatic Bile Duct | 5 | 9.6 (9.6, 9.7) | 0.5 (−0.5, 1.5) | .28 | 8.4 (8.3, 8.4) | 1.0 (0.4, 1.6) | f | .004 | 13.5 (13.3, 13.8) | −0.3 (−1.4, 0.9) | .65 | 13.5 (13.1, 13.9) | −3.7 (−4.9, −2.4) | f | <.001 | 17 (15.5, 18.5) | 2.8 (1.7, 4.0) | f | <.001 | 13.2 (12.9, 13.5) | 1.2 (0.9, 1.6) | f | <.001 | ||
| Leukemia | 6 | 8.6 (8.5, 8.6) | −2.7 (−3.5, −2.0) | f | <.001 | 9.1 (9.0, 9.2) | −2.2 (−2.8, −1.6) | f | <.001 | 7.2 (7.0, 7.4) | −1.8 (−2.2, −1.3) | f | <.001 | 4.8 (4.5, 5.0) | −0.6 (−1.4, 0.3) | .17 | 6.0 (5.1, 7.0) | −0.5 (−2.4, 1.4) | .56 | 5.8 (5.6, 6.0) | −1.0 (−1.5, −0.5) | f | .001 | ||
| Urinary Bladder | 7 | 7.5 (7.4, 7.6) | −1.1 (−2.0, −0.2) | f | .02 | 8.3 (8.2, 8.4) | −0.8 (−1.9, 0.2) | .11 | 5.5 (5.3, 5.6) | −0.3 (−0.8, 0.2) | .27 | 2.8 (2.7, 3.0) | −0.4 (−1.3, 0.6) | .43 | 4.6 (3.8, 5.6) | —g | 3.9 (3.7, 4.1) | −0.7 (−1.4, 0.0) | .06 | ||||||
| Non-Hodgkin Lymphoma | 8 | 7.1 (7.1, 7.2) | −2.0 (−2.1, −1.8) | f | <.001 | 7.5 (7.4, 7.6) | −1.9 (−2.2, −1.7) | f | <.001 | 5.3 (5.1, 5.5) | −1.8 (−2.3, −1.2) | f | <.001 | 4.9 (4.7, 5.2) | −1.4 (−1.9, −0.8) | f | <.001 | 6.3 (5.3, 7.3) | 0.2 (−1.7, 2.1) | .84 | 5.9 (5.7, 6.1) | −1.4 (−1.8, −1.0) | f | <.001 | |
| Esophagus | 9 | 7.0 (6.9, 7.1) | −1.2 (−1.4, −1.0) | f | <.001 | 7.8 (7.8, 7.9) | −0.5 (−0.7, −0.3) | f | <.001 | 5.5 (5.3, 5.6) | −4.8 (−5.2, −4.5) | f | <.001 | 2.8 (2.6, 3.0) | −1.4 (−2.3, −0.5) | f | .006 | 7.1 (6.1, 8.2) | −0.7 (−2.6, 1.2) | .42 | 3.6 (3.5, 3.8) | −1.4 (−2.1, −0.6) | f | .001 | |
| Kidney and Renal Pelvis | 10 | 5.4 (5.4, 5.5) | −2.4 (−3.0, −1.8) | f | <.001 | 5.6 (5.5, 5.7) | −2.3 (−4.2, −0.5) | f | .02 | 5.6 (5.4, 5.8) | −0.9 (−1.3, −0.5) | f | <.001 | 2.6 (2.4, 2.8) | −0.1 (−1.3, 1.1) | .85 | 9.7 (8.5, 10.9) | −0.7 (−2.1, 0.7) | .28 | 5.0 (4.8, 5.1) | −0.8 (−1.4, −0.3) | f | .007 | ||
| Brain and Other Nervous System | 11 | 5.4 (5.3, 5.4) | 0.4 (0.1, 0.8) | f | .01 | 6.1 (6.1, 6.2) | 0.7 (0.4, 1.0) | f | <.001 | 3.3 (3.2, 3.4) | 0.3 (−0.4, 0.9) | .40 | 2.6 (2.5, 2.8) | 0.3 (−0.6, 1.2) | .48 | 3.2 (2.6, 4.0) | 0.7 (−1.7, 3.2) | .53 | 3.5 (3.4, 3.6) | 0.4 (−0.1, 0.9) | .13 | ||||
| Myeloma | 12 | 4.1 (4.1, 4.2) | −0.9 (−1.1, −0.7) | f | <.001 | 3.9 (3.9, 4.0) | −0.9 (−1.1, −0.6) | f | <.001 | 7.7 (7.4, 7.9) | −0.9 (−1.2, −0.6) | f | <.001 | 2.0 (1.9, 2.2) | 0.1 (−0.9, 1.1) | .81 | 4.1 (3.3, 5.0) | −1.6 (−3.3, 0.1) | .06 | 3.4 (3.2, 3.5) | −0.4 (−1.1, 0.3) | .28 | |||
| Stomach | 13 | 4.1 (4.1, 4.1) | −2.5 (−2.7, −2.2) | f | <.001 | 3.2 (3.1, 3.2) | −2.7 (−3.1, −2.2) | f | <.001 | 8.0 (7.8, 8.3) | −3.1 (−3.4, −2.8) | f | <.001 | 6.7 (6.4, 7.0) | −3.6 (−4.0, −3.1) | f | <.001 | 7.6 (6.5, 8.7) | −2.9 (−4.8, −1.0) | f | .005 | 6.4 (6.2, 6.6) | −2.8 (−3.2, −2.4) | f | <.001 |
| Oral Cavity and Pharynx | 14 | 3.9 (3.9, 4.0) | 1.0 (0.5, 1.5) | f | .002 | 4.0 (4.0, 4.1) | 1.4 (0.9, 1.9) | f | <.001 | 4.6 (4.5, 4.8) | −2.9 (−3.5, −2.2) | f | <.001 | 3.1 (3.0, 3.3) | 1.3 (−0.3, 2.9) | .10 | 4.0 (3.3, 4.8) | 0.0 (−2.4, 2.4) | .98 | 2.4 (2.3, 2.5) | 1.2 (−0.7, 3.0) | .20 | |||
| Melanoma of the Skin | 15 | 3.5 (3.5, 3.6) | −6.1 (−7.6, −4.5) | f | <.001 | 4.5 (4.4, 4.5) | −5.7 (−7.2, −4.1) | f | <.001 | 0.4 (0.4, 0.5) | −1.4 (−3.4, 0.6) | .15 | 0.4 (0.3, 0.4) | —g | 1.2 (0.8, 1.7) | —g | 0.9 (0.8, 1.0) | −3.4 (−5.7, −1.1) | f | .009 | |||||
| Non-Melanoma | 16 | 1.7 (1.7, 1.8) | 0.7 (−3.1, 4.6) | .73 | 2.0 (2.0, 2.0) | 1.5 (−2.3, 5.4) | .44 | 0.7 (0.6, 0.8) | −2.7 (−3.8, −1.6) | f | <.001 | 0.4 (0.3, 0.5) | —g | 1.0 (0.7, 1.5) | —g | 0.8 (0.7, 0.9) | 0.6 (−0.7, 2.0) | .34 | |||||||
| Larynx | 17 | 1.7 (1.7, 1.8) | −2.5 (−2.7, −2.3) | f | <.001 | 1.7 (1.6, 1.7) | −2.1 (−2.3, −1.9) | f | <.001 | 3.1 (3.0, 3.3) | −3.6 (−4.0, −3.2) | f | <.001 | 0.6 (0.5, 0.7) | −2.9 (−4.8, −0.9) | f | .007 | 1.9 (1.4, 2.5) | —g | 1.4 (1.3, 1.5) | −4.4 (−6.5, −2.3) | f | .002 | ||
| Soft Tissue including Heart | 18 | 1.5 (1.5, 1.6) | 0.5 (0.3, 0.8) | f | .001 | 1.6 (1.6, 1.6) | 0.6 (0.2, 0.9) | f | .002 | 1.6 (1.5, 1.7) | 0.5 (−0.4, 1.4) | .24 | 1.0 (0.9, 1.1) | 0.5 (−1.4, 2.4) | .58 | 1.7 (1.2, 2.2) | —g | 1.2 (1.1, 1.3) | 1.1 (0.0, 2.1) | f | .04 | ||||
| Bones and Joints | 19 | 0.6 (0.5, 0.6) | 0.4 (−0.1, 0.8) | .08 | 0.6 (0.6, 0.6) | 0.4 (−0.1, 0.9) | .13 | 0.6 (0.5, 0.7) | 0.5 (−0.5, 1.5) | .29 | 0.3 (0.3, 0.4) | 2.4 (0.2, 4.8) | f | .04 | 0.7 (0.4, 1.0) | —g | 0.5 (0.4, 0.5) | 0.0 (−1.5, 1.6) | .97 | ||||||
| Females | |||||||||||||||||||||||||
| Lung and Bronchus | 1 | 33.2 (33.1, 33.3) | −3.7 (−4.3, −3.1) | f | <.001 | 36.8 (36.7, 36.9) | −3.3 (−3.9, −2.7) | f | <.001 | 31.9 (31.6, 32.3) | −4.6 (−5.7, −3.4) | f | <.001 | 16.9 (16.6, 17.3) | −3.7 (−5.9, −1.4) | f | .002 | 32.6 (30.7, 34.5) | −2.2 (−3.2, −1.3) | f | <.001 | 12.6 (12.4, 12.9) | −3.7 (−6.5, −0.9) | f | .01 |
| Breast | 2 | 20.3 (20.2, 20.4) | −1.2 (−1.4, −1.0) | f | <.001 | 20.3 (20.2, 20.4) | −1.1 (−1.4, −0.8) | f | <.001 | 28.4 (28.1, 28.8) | −1.5 (−1.6, −1.4) | f | <.001 | 11.5 (11.2, 11.8) | −0.7 (−1.2, −0.3) | f | .003 | 16.6 (15.2, 17.9) | 3.9 (−2.8, 11.0) | .23 | 14.0 (13.7, 14.2) | −1.1 (−1.4, −0.9) | f | <.001 | |
| Colon and Rectum | 3 | 11.7 (11.7, 11.8) | −1.6 (−2.3, −0.8) | f | .001 | 11.7 (11.7, 11.8) | −1.6 (−2.1, −1.1) | f | <.001 | 15.6 (15.4, 15.9) | −3.1 (−3.3, −2.9) | f | <.001 | 8.1 (7.9, 8.4) | −2.0 (−2.6, −1.5) | f | <.001 | 15 (13.7, 16.3) | −0.6 (−2.0, 0.7) | .34 | 8.7 (8.5, 8.9) | −2.1 (−2.4, −1.9) | f | <.001 | |
| Pancreas | 4 | 9.6 (9.5, 9.6) | 0.2 (0.1, 0.3) | f | .001 | 9.6 (9.5, 9.6) | 0.3 (0.2, 0.5) | f | <.001 | 12.3 (12.1, 12.5) | −0.2 (−0.4, 0.0) | f | .03 | 7.1 (6.8, 7.3) | 0.1 (−0.3, 0.5) | .71 | 8.9 (7.9, 9.9) | 0.3 (−1.4, 2.0) | .70 | 7.8 (7.6, 7.9) | 0.0 (−0.2, 0.3) | .95 | |||
| Ovary | 5 | 6.9 (6.8, 6.9) | −2.3 (−2.5, −2.2) | f | <.001 | 7.3 (7.2, 7.4) | −2.4 (−2.6, −2.2) | f | <.001 | 6.1 (6.0, 6.3) | −1.6 (−2.0, −1.3) | f | <.001 | 4.5 (4.3, 4.6) | −0.9 (−1.4, −0.4) | f | .002 | 7.1 (6.3, 8.0) | −1.1 (−2.3, 0.2) | .10 | 5.1 (5.0, 5.3) | −1.5 (−1.8, −1.1) | f | <.001 | |
| Corpus and Uterus, NOS | 6 | 4.8 (4.8, 4.9) | 2.1 (1.7, 2.4) | f | <.001 | 4.5 (4.4, 4.5) | 1.9 (1.5, 2.4) | f | <.001 | 8.8 (8.6, 9.0) | 2.3 (1.8, 2.9) | f | <.001 | 3.2 (3.0, 3.3) | 2.6 (1.9, 3.4) | f | <.001 | 4.0 (3.4, 4.7) | —g | 4.0 (3.9, 4.1) | 2.6 (2.0, 3.3) | f | <.001 | ||
| Leukemia | 7 | 4.8 (4.8, 4.8) | −1.3 (−1.5, −1.2) | f | <.001 | 5.0 (5.0, 5.1) | −1.2 (−1.4, −1.1) | f | <.001 | 4.4 (4.3, 4.6) | −1.5 (−1.8, −1.1) | f | <.001 | 2.6 (2.5, 2.8) | −4.6 (−7.4, −1.6) | f | .006 | 3.5 (2.9, 4.1) | −2.1 (−4.4, 0.3) | .08 | 3.7 (3.6, 3.9) | −0.8 (−1.2, −0.3) | f | .002 | |
| Non-Hodgkin Lymphoma | 8 | 4.2 (4.2, 4.3) | −2.6 (−2.8, −2.5) | f | <.001 | 4.5 (4.4, 4.5) | −2.2 (−2.8, −1.6) | f | <.001 | 3.3 (3.2, 3.4) | −2.2 (−2.5, −1.8) | f | <.001 | 3.0 (2.8, 3.1) | −2.1 (−2.7, −1.4) | f | <.001 | 3.7 (3.1, 4.4) | −3.4 (−5.3, −1.5) | f | .002 | 3.7 (3.6, 3.8) | −2.0 (−2.6, −1.5) | f | <.001 |
| Liver and Intrahepatic Bile Duct | 9 | 4.0 (3.9, 4.0) | 1.6 (1.0, 2.2) | f | .001 | 3.5 (3.5, 3.5) | 2.2 (2.0, 2.4) | f | <.001 | 4.9 (4.7, 5.0) | 1.8 (1.3, 2.3) | f | <.001 | 5.6 (5.4, 5.8) | −1.3 (−2.1, −0.6) | f | .001 | 8.1 (7.2, 9.1) | 1.0 (−1.1, 3.1) | .32 | 6.0 (5.8, 6.1) | 1.2 (0.8, 1.5) | f | <.001 | |
| Brain and Other Nervous System | 10 | 3.6 (3.6, 3.6) | 0.5 (0.2, 0.8) | f | .003 | 4.1 (4.1, 4.2) | 0.7 (0.3, 1.1) | f | .002 | 2.2 (2.1, 2.3) | 0.4 (−0.3, 1.1) | .21 | 1.9 (1.8, 2.1) | 2.1 (1.0, 3.2) | f | .001 | 2.7 (2.2, 3.3) | —g | 2.6 (2.5, 2.7) | 0.6 (0.1, 1.1) | f | .02 | |||
| Myeloma | 11 | 2.6 (2.6, 2.6) | −1.9 (−3.0, −0.9) | f | .003 | 2.3 (2.3, 2.4) | −1.7 (−2.7, −0.7) | f | .004 | 5.4 (5.3, 5.6) | −1.0 (−1.6, −0.5) | f | .001 | 1.2 (1.1, 1.3) | −1.2 (−2.7, 0.3) | .10 | 3.3 (2.7, 4.0) | −1.1 (−3.9, 1.7) | .41 | 2.2 (2.1, 2.3) | −1.4 (−2.0, −0.8) | f | <.001 | ||
| Kidney and Renal Pelvis | 12 | 2.3 (2.3, 2.3) | −1.4 (−1.6, −1.3) | f | <.001 | 2.4 (2.3, 2.4) | −1.4 (−1.6, −1.2) | f | <.001 | 2.3 (2.2, 2.4) | −1.6 (−2.0, −1.1) | f | <.001 | 1.1 (1.0, 1.2) | −1.0 (−2.1, 0.1) | .06 | 4.0 (3.3, 4.7) | −1.6 (−3.5, 0.3) | .09 | 2.2 (2.1, 2.3) | −0.7 (−1.2, −0.1) | f | .03 | ||
| Cervix Uteri | 13 | 2.3 (2.2, 2.3) | −0.7 (−0.9, −0.4) | f | <.001 | 2.1 (2.0, 2.1) | −0.1 (−0.4, 0.2) | .43 | 3.6 (3.4, 3.7) | −2.4 (−2.8, −2.1) | f | <.001 | 1.7 (1.6, 1.9) | −2.2 (−3.2, −1.1) | f | <.001 | 3.1 (2.6, 3.7) | −1.7 (−3.6, 0.2) | .08 | 2.6 (2.5, 2.7) | −0.2 (−1.8, 1.4) | .75 | |||
| Stomach | 14 | 2.2 (2.2, 2.2) | −1.8 (−2.2, −1.4) | f | <.001 | 1.6 (1.6, 1.6) | −3.0 (−3.2, −2.7) | f | <.001 | 3.7 (3.6, 3.8) | −3.4 (−3.8, −3.1) | f | <.001 | 4.1 (3.9, 4.3) | −3.1 (−3.6, −2.5) | f | <.001 | 4.1 (3.4, 4.8) | −2.9 (−4.7, −1.1) | f | .005 | 4.0 (3.8, 4.1) | −1.9 (−2.4, −1.4) | f | <.001 |
| Urinary Bladder | 15 | 2.1 (2.1, 2.2) | −0.5 (−0.7, −0.4) | f | <.001 | 2.3 (2.2, 2.3) | −0.2 (−0.4, 0.0) | f | .02 | 2.4 (2.3, 2.5) | −1.4 (−1.9, −1.0) | f | <.001 | 0.9 (0.8, 1.0) | −1.0 (−2.1, 0.0) | .06 | 1.9 (1.4, 2.4) | —g | 1.3 (1.2, 1.3) | −0.7 (−1.6, 0.1) | .08 | ||||
| Melanoma of the Skin | 16 | 1.5 (1.4, 1.5) | −6.3 (−8.6, −3.8) | f | <.001 | 1.9 (1.9, 1.9) | −5.9 (−8.5, −3.2) | f | .001 | 0.3 (0.3, 0.3) | −2.2 (−3.7, −0.7) | f | .009 | 0.3 (0.2, 0.3) | −0.4 (−3.3, 2.6) | .77 | 0.5 (0.3, 0.8) | —g | 0.5 (0.5, 0.6) | −1.6 (−2.9, −0.4) | f | .02 | |||
| Esophagus | 17 | 1.4 (1.4, 1.5) | −1.6 (−1.8, −1.4) | f | <.001 | 1.5 (1.5, 1.5) | −0.9 (−1.1, −0.7) | f | <.001 | 1.7 (1.6, 1.8) | −4.3 (−4.8, −3.8) | f | <.001 | 0.6 (0.6, 0.7) | −2.3 (−3.9, −0.7) | f | .008 | 1.4 (1.1, 1.9) | —g | 0.7 (0.7, 0.8) | −2.2 (−3.0, −1.4) | f | <.001 | ||
| Oral Cavity and Pharynx | 18 | 1.3 (1.3, 1.4) | 1.4 (−1.4, 4.3) | .31 | 1.4 (1.4, 1.4) | 2.0 (−0.5, 4.6) | .10 | 1.3 (1.3, 1.4) | −2.1 (−2.8, −1.4) | f | <.001 | 1.1 (1.0, 1.2) | −1.5 (−2.9, −0.2) | f | .03 | 1.2 (0.9, 1.6) | —g | 0.8 (0.7, 0.9) | −0.2 (−1.2, 0.8) | .71 | |||||
| Soft Tissue including Heart | 19 | 1.2 (1.1, 1.2) | 0.2 (0.0, 0.3) | f | .02 | 1.2 (1.1, 1.2) | 0.1 (−0.1, 0.3) | .45 | 1.5 (1.4, 1.6) | 0.8 (0.5, 1.2) | f | <.001 | 0.8 (0.7, 0.9) | 0.8 (−0.7, 2.4) | .26 | 1.1 (0.8, 1.5) | —g | 0.9 (0.9, 1.0) | 0.6 (−0.5, 1.6) | .27 | |||||
| Gallbladder | 20 | 0.7 (0.7, 0.7) | −1.2 (−1.5, −0.8) | f | <.001 | 0.6 (0.6, 0.6) | −1.7 (−2.1, −1.4) | f | <.001 | 1.0 (1.0, 1.1) | 0.0 (−0.8, 0.8) | .94 | 0.8 (0.7, 0.8) | −0.9 (−2.1, 0.4) | .17 | 1.8 (1.4, 2.3) | −2.6 (−4.6, −0.5) | f | .02 | 1.1 (1.1, 1.2) | −1.6 (−2.5, −0.6) | f | .003 | ||
| Children | |||||||||||||||||||||||||
| Brain and other nervous system | 0.7 (0.7, 0.7) | −0.2 (−0.7, 0.2) | .27 | 0.7 (0.7, 0.8) | −0.4 (−1.0, 0.2) | .17 | 0.7 (0.7, 0.8) | 0.5 (−0.9, 1.9) | .48 | 0.5 (0.4, 0.7) | −0.9 (−3.2, 1.4) | .41 | 0.9 (0.6, 1.4) | —g | 0.7 (0.6, 0.7) | 0.2 (−0.6, 0.9) | .66 | ||||||||
| Leukemia | 0.5 (0.5, 0.6) | −2.8 (−3.5, −2.2) | f | <.001 | 0.5 (0.5, 0.5) | −3 (−3.8, −2.3) | f | <.001 | 0.5 (0.4, 0.6) | −2.4 (−3.7, −1.2) | f | .001 | 0.5 (0.4, 0.6) | −3.7 (−5.6, −1.7) | f | .001 | 0.8 (0.5, 1.2) | —g | 0.7 (0.6, 0.7) | −3.3 (−4.4, −2.2) | f | <.001 | |||
| AYA | |||||||||||||||||||||||||
| Female Breast | 2.2 (2.1, 2.3) | 0.6 (−0.8, 2.1) | .36 | 2.0 (2.0, 2.1) | 0.9 (−1.3, 3.0) | .40 | 3.9 (3.7, 4.2) | −2.3 (−2.7, −2.0) | f | <.001 | 1.3 (1.1, 1.5) | −0.7 (−2.7, 1.4) | .49 | 1.6 (1.0, 2.4) | —g | 1.8 (1.7, 1.9) | −0.8 (−2.1, 0.5) | .22 | |||||||
| Brain and other nervous system | 1.0 (0.9, 1.0) | −0.2 (−0.7, 0.3) | .36 | 1.2 (1.2, 1.2) | −0.1 (−0.6, 0.5) | .78 | 0.6 (0.6, 0.7) | 0.4 (−0.8, 1.6) | .51 | 0.6 (0.6, 0.7) | 1.4 (−0.5, 3.3) | .14 | 0.8 (0.5, 1.2) | —g | 0.6 (0.6, 0.7) | 0.8 (−0.2, 1.8) | .12 | ||||||||
| Leukemia | 0.9 (0.9, 1.0) | −2.2 (−2.6, −1.8) | f | <.001 | 0.8 (0.8, 0.8) | −2.9 (−3.5, −2.4) | f | <.001 | 1.0 (0.9, 1.1) | −2.4 (−3.2, −1.5) | f | <.001 | 0.8 (0.7, 0.9) | −1.2 (−2.6, 0.3) | .10 | 1.1 (0.8, 1.5) | —g | 1.3 (1.2, 1.3) | −1.1 (−1.7, −0.5) | f | .002 | ||||
| Colon and rectum | 0.9 (0.8, 0.9) | 0.9 (0.5, 1.3) | f | <.001 | 0.9 (0.9, 0.9) | 1.5 (0.8, 2.2) | f | <.001 | 1.2 (1.1, 1.3) | 0.7 (−0.2, 1.5) | .11 | 0.7 (0.6, 0.8) | −0.3 (−2.2, 1.7) | .78 | 1.4 (1.0, 1.9) | —g | 0.6 (0.6, 0.7) | 1.3 (0.3, 2.3) | f | .01 | |||||
Abbreviations: AAPC, average annual percent change; AI/AN, American Indian/Alaska Native; API, Asian/Pacific Islander; AYA, adolescents and young adults; CI, confidence interval; NOS, not otherwise specified; PRCDA, Indian Health Service Purchased/Referred Care Delivery Area.
Rates are per 100,000 persons and age standardized to the 2000 US standard population (19 age groups - Census P25–1130).
Fixed interval trends are characterized as the average annual percent change (AAPC), the weighted average of the annual percent changes over the fixed interval 2013–2017, using the underlying Joinpoint model (with up to three joinpoints) for the period of 2001–2017. Joinpoint Regression Program, Version 4.7.0.0 February 2019, Statistical Research and Applications Branch,
Cancers are listed in descending rank order of sex-specific, age-adjusted death rates for 2013–2017 for all racial/ethnic groups combined. More than 15 cancers may appear males and females to include the top 15 cancers in each racial/ethnic group.
Racial/ethnic groups are mutually exclusive. Data for non-Hispanic AI/AN are restricted to PRCDA counties.
Based on data from the National Center for Health Statistics public-use data file for the total United States, 2001–2017.
The AAPC is statistically significantly different from zero (P < .05). Two-sided statistical significance for AAPC was determined using a t-test when the AAPC lay entirely within the last joinpoint segment or a z-test when the AAPC extended beyond the last joinpoint segment.
The statistic could not be calculated. The average annual percent change is based on <10 cases for at least 1 year within the time interval.
Figure 5.
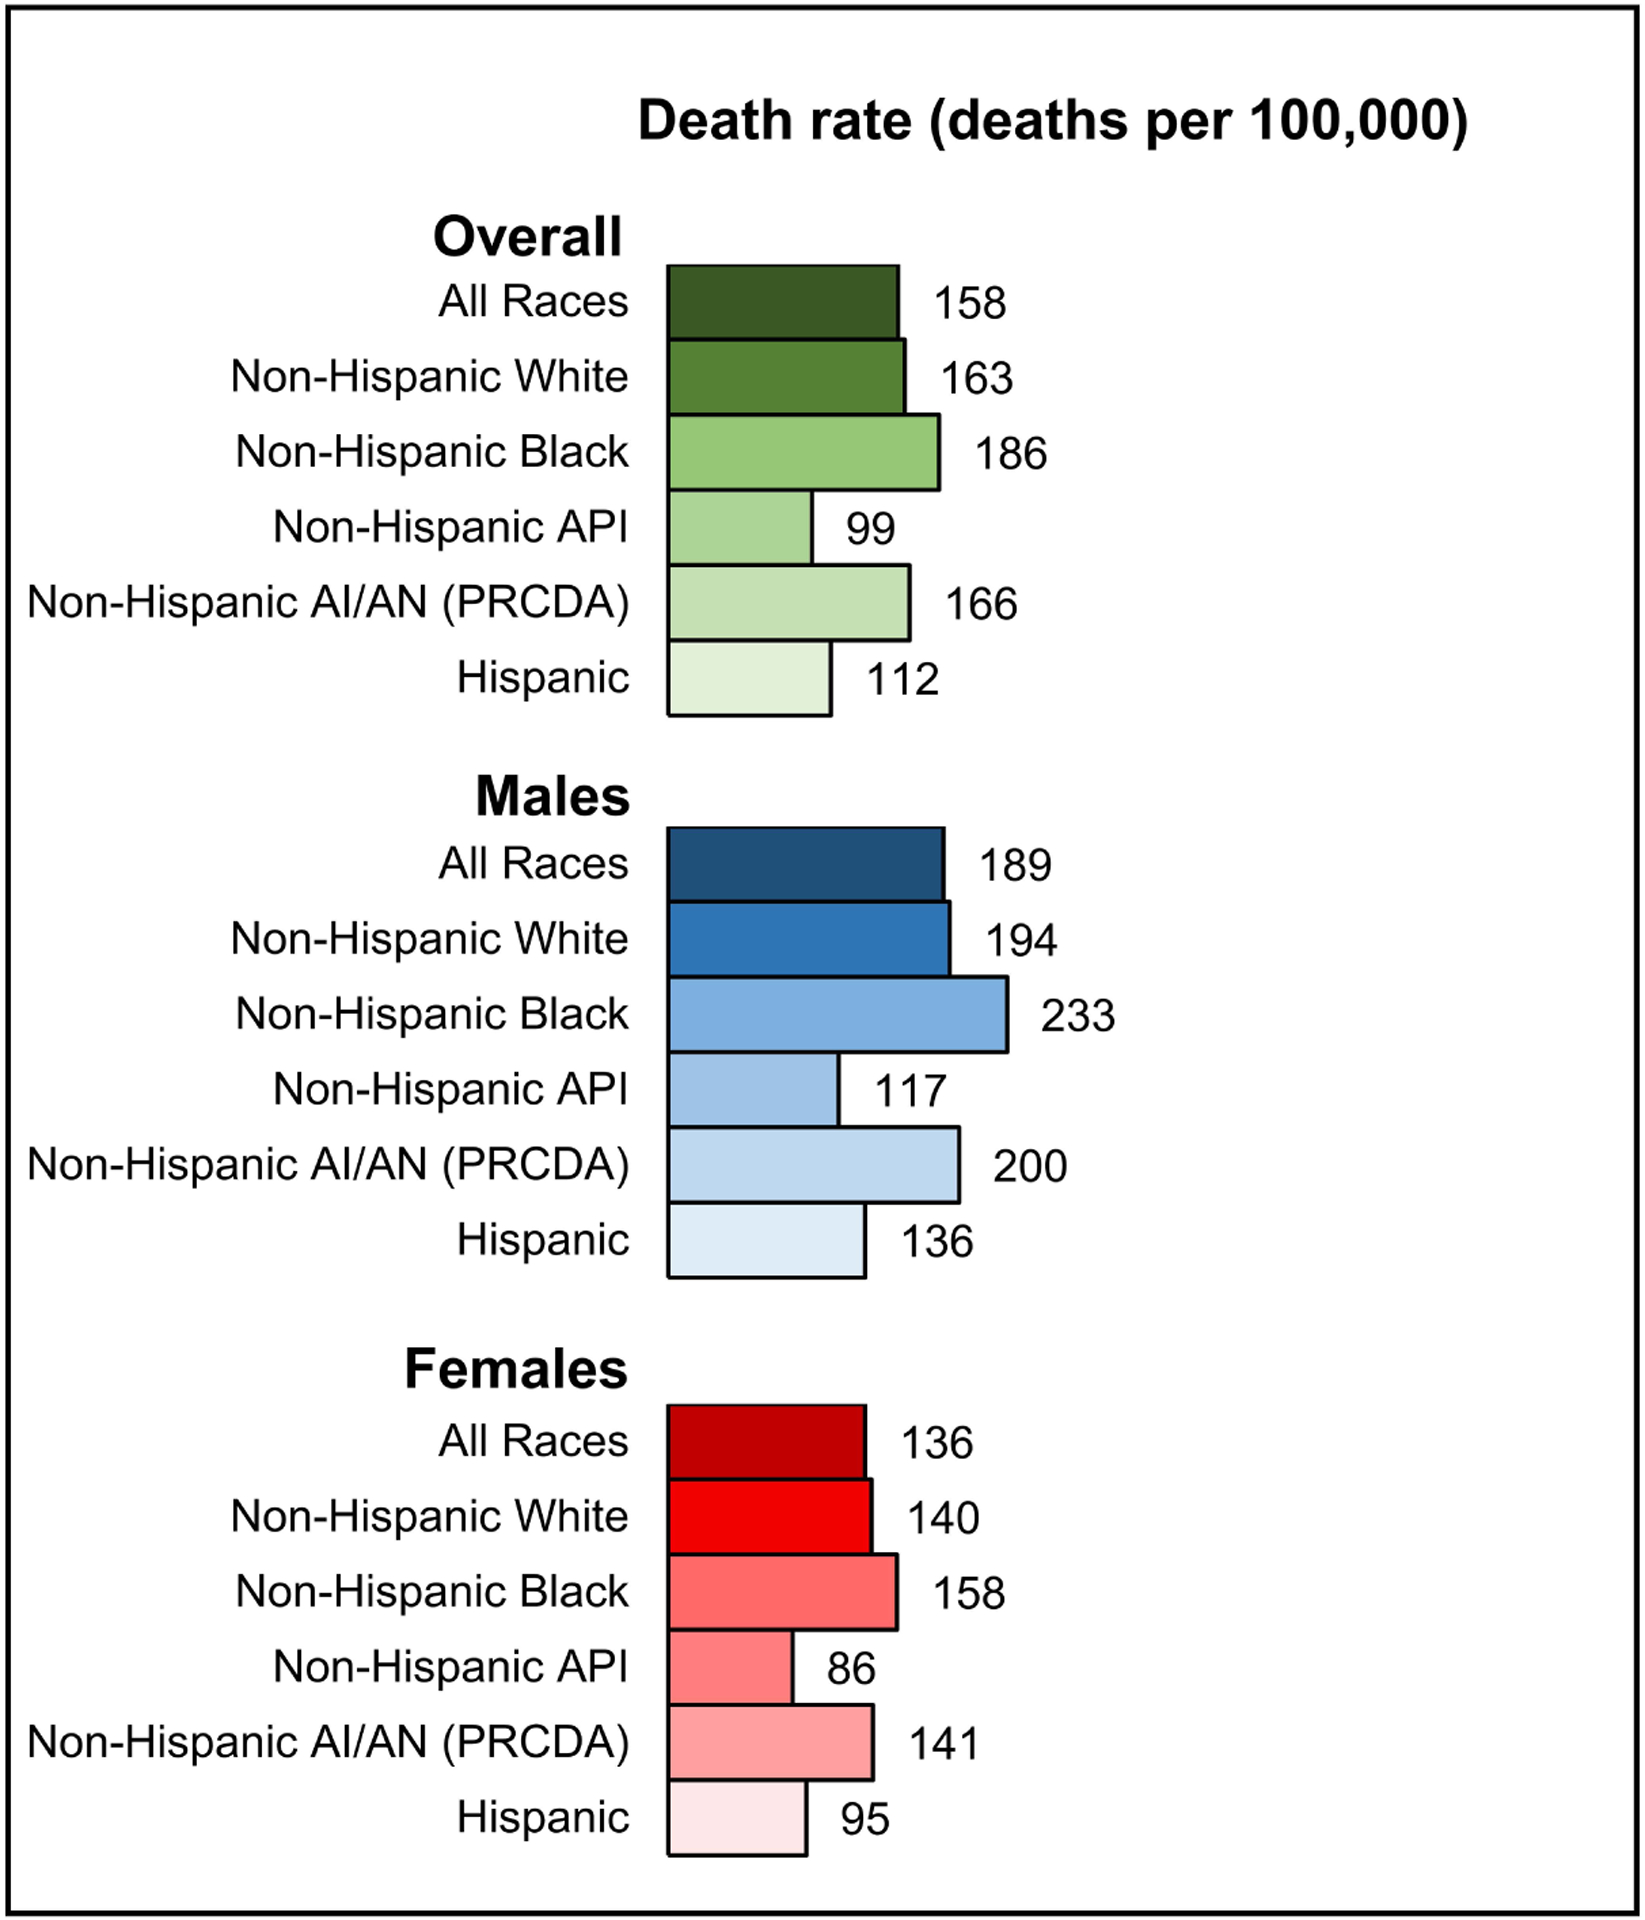
Age-standardized, overall cancer death rates for 2013–2017 among males and females by racial/ethnic group. Racial/ethnic groups are mutually exclusive. Data for non-Hispanic AI/AN are restricted to PRCDA counties. Abbreviations: AI/AN, American Indian/Alaska Native; API, Asian/Pacific Islander; PRCDA, Indian Health Service Purchased/Referred Care Delivery Areas.
During 2013–2017, death rates among males decreased for 11 of the 19 most common cancers, were stable for 4 cancers (including prostate), and increased for 4 cancers (oral cavity and pharynx, soft tissue including heart, brain and ONS, and pancreas) (Figure 6A, Table 3). Death rates among females increased for cancers of the uterus, liver, brain and ONS, soft tissue including heart, and pancreas; rates were stable for oral cavity and pharynx cancer and decreased for 14 of the 20 most common cancers (Figure 6B, Table 3). The largest declines in death rates were observed for melanoma (AAPC = −6.1% among males and −6.3% among females) and lung cancer (−4.8% among males and −3.7% among females) (Figure 6).
Figure 6.
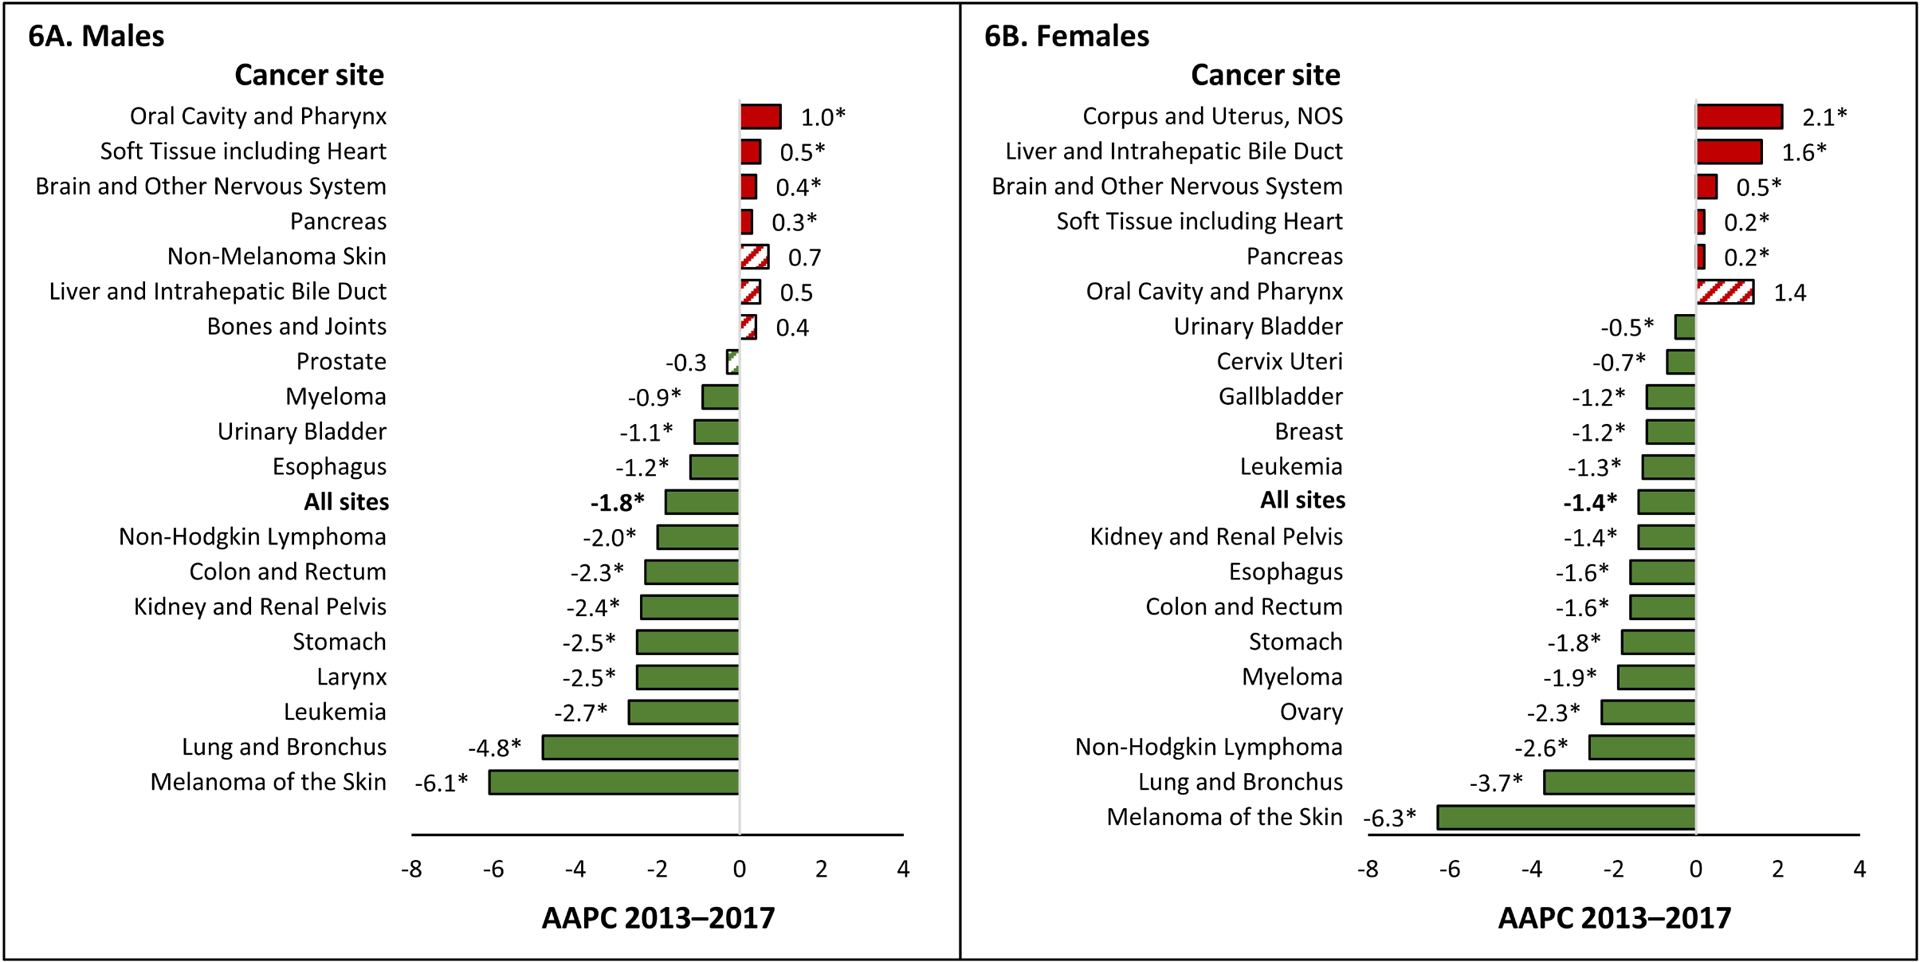
Average annual percent change (AAPC) in age-standardized death rates for 2013–2017 for all sites and the 19 most common cancer deaths in men and the 20 most common cancer deaths in women, all ages, all races/ethnicities combined, among A) males and B) females. The AAPC was a weighted average of the annual percent change (APCs) over the fixed 5-year interval 2013–2017 using the underlying joinpoint regression model, which allowed up to 4 different APCs, for the 17-year period 2001–2017. AAPCs with an asterisk (*) were statistically significantly different from zero (P<0.05) and are depicted as solid-colored bars; AAPCs with hash marks were not statistically significantly different from zero (stable). Abbreviations: NOS, not otherwise specified.
The 3 most common cancer deaths among males were from lung, prostate, and colorectal cancer in most racial/ethnic groups except API males. Among API males, lung cancer was the most common cancer death, followed by cancer of the liver, colorectum, and prostate (Table 3). Lung cancer death rates among males decreased during 2013–2017 in each racial/ethnic group, decreasing the most among black males (AAPC = −5.7%) and Hispanic males (−5.4%). Prostate cancer death rates were stable among white and Hispanic males but decreased among black, API, and AI/AN males. Colorectal cancer death rates were stable among AI/AN males but decreased in all other racial/ethnic groups. Pancreas cancer was the 4th most common cancer death among white and black males, and death rates increased among white males but were stable in other racial/ethnic groups. Liver cancer was the 4th most common cancer death among AI/AN and Hispanic males (and 2nd among API males); death rates increased among white, AI/AN, and Hispanic males, were stable among black males, and decreased among API males.
Among females, the 3 most common cancer deaths were lung, breast, and colorectal, except among Hispanic females in whom breast cancer was the most common and lung cancer was the 2nd (Table 3). Lung cancer death rates among females decreased in every racial/ethnic group, decreasing the most among black females (−4.6%). Breast and colorectal cancer death rates decreased among white, black, API, and Hispanic females but were stable among AI/AN females. Pancreas cancer was the 4th most common cancer death among females in each racial/ethnic group, and death rates increased among white females, decreased among black females, and were stable in other racial/ethnic groups. Uterine cancer death rates increased among white, black, API, and Hispanic females, and could not be calculated among AI/AN females.
Notable changes in trend were observed for melanoma and lung cancer. Melanoma death rates among males were stable during 2009–2014 then decreased 7.6% per year during 2014–2017, and melanoma death rates among females were stable during 2001–2013 then decreased 6.3% per year during 2013–2017 (Table 4). In contrast, incidence rates of melanoma increased 2.2% per year among males and 1.9% per year among females during 2001–2016 (Table 2). Declines in lung cancer death rates accelerated over the time period studied (Table 4). Among males, lung cancer death rates decreased 2.0% per year during 2001–2005, 2.9% during 2005–2012, 4.0% during 2012–2015 and 5.5% during 2015–2017. Among females, lung cancer death rates decreased 0.5% per year during 2001–2007, 2.0% during 2007–2014 and 4.2% during 2014–2017. Lung incidence rates also decreased, but at a slower pace: lung cancer incidence rates among males decreased 2.6% per year during 2007–2016 and 1.1% per year among females during 2006–2016 (Table 2).
Table 4.
Joinpoint trendsa for the most common causes of cancer death,b all races/ethnicities combined by sex and age group, United States,c 2001–2017
| Trand 1 | Trand 2 | Trand 3 | Trand 4 | Fixed Interval 2013–2017 | |||||||||||||||
|---|---|---|---|---|---|---|---|---|---|---|---|---|---|---|---|---|---|---|---|
| Sex/Cancer Site or Type | Years | APC (95% CI) | P | Years | APC (95% CI) | P | Years | APC (95% CI) | P | Years | APC (95% CI) | P | AAPC (95% CI) | P | |||||
| All sites | |||||||||||||||||||
| Both sexes | 2001–2017 | −1.5 (−1.6, −1.5) | e | <.001 | −1.5 (−1.6, −1.5) | e | <.001 | ||||||||||||
| Males | 2001–2017 | −1.8 (−1.9, −1.8) | e | <.001 | −1.8 (−1.9, −1.8) | e | <.001 | ||||||||||||
| Females | 2001–2017 | −1.4 (−1.4, −1.4) | e | <.001 | −1.4 (−1.4, −1.4) | e | <.001 | ||||||||||||
| Children (ages 0–14 years) | 2001–2017 | −1.4 (−1.8, −1.1) | e | <.001 | −1.4 (−1.8, −1.1) | e | <.001 | ||||||||||||
| AYA (ages 15–39 years) | 2001–2005 | −3.0 (−4.0, −1.9) | e | <.001 | 2005–2017 | −1.0 (−1.2, −0.7) | e | <.001 | −1.0 (−1.2, −0.7) | e | <.001 | ||||||||
| Males | |||||||||||||||||||
| Lung and Bronchus | 2001–2005 | −2.0 (−2.3, −1.7) | e | <.001 | 2005–2012 | −2.9 (−3.1, −2.8) | e | <.001 | 2012–2015 | −4.0 (−5.1, −3.0) | e | <.001 | 2015–2017 | −5.5 (−6.6, −4.5) | e | <.001 | −4.8 (−5.4, −4.2) | e | <.001 |
| Prostate | 2001–2013 | −3.5 (−3.7, −3.2) | e | <.001 | 2013–2017 | −0.3 (−1.6, 1.0) | .60 | −0.3 (−1.6, 1.0) | .60 | ||||||||||
| Colon and Rectum | 2001–200 | −3.6 (−4.2, −2.9) | e | <.001 | 2006–2017 | −2.3 (−2.5, −2.1) | e | <.001 | −2.3 (−2.5, −2.1) | e | <.001 | ||||||||
| Pancreas | 2001–201 | 0.3 (0.2, 0.4) | e | <.001 | 0.3 (0.2, 0.4) | e | <.001 | ||||||||||||
| Liver and Intrahepatic Bile Duct | 2001–2013 | 2.7 (2.5, 2.9) | e | <.001 | 2013–2017 | 0.5 (−0.5, 1.5) | .28 | 0.5 (−0.5, 1.5) | .28 | ||||||||||
| Leukemia | 2001–2013 | −1.0 (−1.1, −0.8) | e | <.001 | 2013–2017 | −2.7 (−3.5, −2.0) | e | <.001 | −2.7 (−3.5, −2.0) | e | <.001 | ||||||||
| Urinary Bladder | 2001–2013 | 0.0 (−0.2, 0.2) | .73 | 2013–2017 | −1.1 (−2.0, −0.2) | e | .02 | −1.1 (−2.0, −0.2) | e | .02 | |||||||||
| Non–Hodgkin Lymphoma | 2001–2006 | −3.0 (−3.7, −2.4) | e | <.001 | 2006–2017 | −2.0 (−2.1, −1.8) | e | <.001 | −2.0 (−2.1, −1.8) | e | <.001 | ||||||||
| Esophagus | 2001–2006 | 0.0 (−0.7, 0.7) | .96 | 2006–2017 | −1.2 (−1.4, −1.0) | e | <.001 | −1.2 (−1.4, −1.0) | e | <.001 | |||||||||
| Kidney and Renal Pelvis | 2001–2006 | −1.4 (−1.7, −1.0) | e | <.001 | 2006–2015 | −0.5 (−0.7, −0.3) | e | <.001 | 2015–2017 | −4.3 (−5.7, −3.0) | e | <.001 | −2.4 (−3.0, −1.8) | e | <.001 | ||||
| Brain and Other Nervous System | 2001–2006 | −1.3 (−2.4, −0.1) | e | .03 | 2006–2017 | 0.4 (0.1, 0.8) | e | .01 | 0.4 (0.1, 0.8) | e | .01 | ||||||||
| Myeloma | 2001–2017 | −0.9 (−1.1, −0.7) | e | <.001 | −0.9 (−1.1, −0.7) | e | <.001 | ||||||||||||
| Stomach | 2001–2006 | −3.7 (−4.5, −2.9) | e | <.001 | 2006–2017 | −2.5 (−2.7, −2.2) | e | <.001 | −2.5 (−2.7, −2.2) | e | <.001 | ||||||||
| Oral Cavity and Pharynx | 2001–2009 | −1.4 (−2.0, −0.8) | e | <.001 | 2009–2017 | 1.0 (0.5, 1.5) | e | .002 | 1.0 (0.5, 1.5) | e | .002 | ||||||||
| Melanoma of the Skin | 2001–2009 | 1.0 (0.5, 1.6) | e | .002 | 2009–2014 | −1.4 (−2.8, 0.0) | .06 | 2014–2017 | −7.6 (−9.8, −5.3) | e | <.001 | −6.1 (−7.6, −4.5) | e | <.001 | |||||
| Non–Melanoma Skin | 2001–2004 | −1.4 (−5.6, 3.0) | .46 | 2004–2012 | 1.6 (0.5, 2.7) | e | .01 | 2012–2015 | 4.2 (−2.8, 11.7) | .20 | 2015–2017 | −2.8 (−9.0, 3.9) | .34 | 0.7 (−3.1, 4.6) | .73 | ||||
| Larynx | 2001–2017 | −2.5 (−2.7, −2.3) | e | <.001 | −2.5 (−2.7, −2.3) | e | <.001 | ||||||||||||
| Soft Tissue including Heart | 2001–2017 | 0.5 (0.3, 0.8) | e | .001 | 0.5 (0.3, 0.8) | e | .001 | ||||||||||||
| Bones and Joints | 2001–2017 | 0.4 (−0.1, 0.8) | .08 | 0.4 (−0.1, 0.8) | .08 | ||||||||||||||
| Females | |||||||||||||||||||
| Lung and Bronchus | 2001–2007 | −0.5 (−0.9, −0.2) | e | .004 | 2007–2014 | −2.0 (−2.3, −1.7) | e | <.001 | 2014–2017 | −4.2 (−5.1, −3.3) | e | <.001 | −3.7 (−4.3, −3.1) | e | <.001 | ||||
| Breast | 2001–2003 | −1.6 (−2.2, −0.9) | e | .001 | 2003–2007 | −2.3 (−2.6, −1.9) | e | <.001 | 2007–2013 | −1.6 (−1.8, −1.5) | e | <.001 | 2013–2017 | −1.2 (−1.4, −1.0) | e | <.001 | −1.2 (−1.4, −1.0) | e | <.001 |
| Colon and Rectum | 2001–2012 | −2.9 (−3.1, −2.7) | e | <.001 | 2012–2017 | −1.6 (−2.3, −0.8) | e | .001 | −1.6 (−2.3, −0.8) | e | .001 | ||||||||
| Pancreas | 2001–2017 | 0.2 (0.1, 0.3) | e | .001 | 0.2 (0.1, 0.3) | e | .001 | ||||||||||||
| Ovary | 2001–2005 | −1.1 (−1.9, −0.2) | e | .02 | 2005–2017 | −2.3 (−2.5, −2.2) | e | <.001 | −2.3 (−2.5, −2.2) | e | <.001 | ||||||||
| Corpus and Uterus, NOS | 2001–2008 | 0.1 (−0.4, 0.7) | .58 | 2008–2017 | 2.1 (1.7, 2.4) | e | <.001 | 2.1 (1.7, 2.4) | e | <.001 | |||||||||
| Leukemia | 2001–2017 | −1.3 (−1.5, −1.2) | e | <.001 | −1.3 (−1.5, −1.2) | e | <.001 | ||||||||||||
| Non–Hodgkin Lymphoma | 2001–2005 | −3.6 (−4.5, −2.8) | e | <.001 | 2005–2017 | −2.6 (−2.8, −2.5) | e | <.001 | −2.6 (−2.8, −2.5) | e | <.001 | ||||||||
| Liver and Intrahepatic Bile Duct | 2001–2004 | 2.8 (1.0, 4.5) | e | .008 | 2004–2008 | 0.5 (−1.1, 2.1) | .46 | 2008–2012 | 3.6 (2.1, 5.2) | e | .001 | 2012–2017 | 1.6 (1.0, 2.2) | e | .001 | 1.6 (1.0, 2.2) | e | .001 | |
| Brain and Other Nervous System | 2001–2006 | −1.2 (−2.1, −0.2) | e | .02 | 2006–2017 | 0.5 (0.2, 0.8) | e | .003 | 0.5 (0.2, 0.8) | e | .003 | ||||||||
| Myeloma | 2001–2009 | −2.5 (−3.0, −2.0) | e | <.001 | 2009–2012 | 1.7 (−3.2, 6.8) | .46 | 2012–2017 | −1.9 (−3.0, −0.9) | e | .003 | −1.9 (−3.0, −0.9) | e | .003 | |||||
| Kidney and Renal Pelvis | 2001–2017 | −1.4 (−1.6, −1.3) | e | <.001 | −1.4 (−1.6, −1.3) | e | <.001 | ||||||||||||
| Cervix Uteri | 2001–2004 | −3.0 (−5.1, −0.8) | e | .01 | 2004–2017 | −0.7 (−0.9, −0.4) | e | <.001 | −0.7 (−0.9, −0.4) | e | <.001 | ||||||||
| Stomach | 2001–2008 | −3.0 (−3.5, −2.5) | e | <.001 | 2008–2017 | −1.8 (−2.2, −1.4) | e | <.001 | −1.8 (−2.2, −1.4) | e | <.001 | ||||||||
| Urinary Bladder | 2001–2017 | −0.5 (−0.7, −0.4) | e | <.001 | −0.5 (−0.7, −0.4) | e | <.001 | ||||||||||||
| Melanoma of the Skin | 2001–2013 | −0.4 (−0.9, 0.1) | .08 | 2013–2017 | −6.3 (−8.6, −3.8) | e | <.001 | −6.3 (−8.6, −3.8) | e | <.001 | |||||||||
| Esophagus | 2001–2017 | −1.6 (−1.8, −1.4) | e | <.001 | −1.6 (−1.8, −1.4) | e | <.001 | ||||||||||||
| Oral Cavity and Pharynx | 2001–2013 | −1.4 (−1.9, −0.9) | e | <.001 | 2013–2017 | 1.4 (−1.4, 4.3) | .31 | 1.4 (−1.4, 4.3) | .31 | ||||||||||
| Soft Tissue including Heart | 2001–2017 | 0.2 (0.0, 0.3) | e | .02 | 0.2 (0.0, 0.3) | e | .02 | ||||||||||||
| Gallbladder | 2001–2017 | −1.2 (−1.5, −0.8) | e | <.001 | −1.2 (−1.5, −0.8) | e | <.001 | ||||||||||||
| Children | |||||||||||||||||||
| Brain and other nervous system | 2001–2017 | −0.2 (−0.7, 0.2) | .27 | −0.2 (−0.7, 0.2) | .27 | ||||||||||||||
| Leukemia | 2001–2017 | −2.8 (−3.5, −2.2) | e | <.001 | −2.8 (−3.5, −2.2) | e | <.001 | ||||||||||||
| AYA | |||||||||||||||||||
| Female Breast | 2001–2010 | −3.2 (−4.1, −2.3) | e | <.001 | 2010–2017 | 0.6 (−0.8, 2.1) | .36 | 0.6 (−0.8, 2.1) | .36 | ||||||||||
| Brain and other nervous system | 2001–2017 | −0.2 (−0.7, 0.3) | .36 | −0.2 (−0.7, 0.3) | .36 | ||||||||||||||
| Leukemia | 2001–2017 | −2.2 (−2.6, −1.8) | e | <.001 | −2.2 (−2.6, −1.8) | e | <.001 | ||||||||||||
| Colon and rectum | 2001–2017 | 0.9 (0.5, 1.3) | e | <.001 | 0.9 (0.5, 1.3) | e | <.001 | ||||||||||||
Abbreviations: AAPC, average annual percent change; APC, annual percent change; AYA, adolescents and young adults; CI, confidence interval; NCHS, National Center for Health Statistics; NOS, not otherwise specified.
Joinpoint models with up to three joinpoints are based on rates per 100,000 persons, age standardized to the 2000 US standard population (19 age groups - Census P25–1130). Joinpoint Regression Program, Version 4.7.0.0. February 2019, Statistical Research and Applications Branch, National Cancer Institute.
Cancers are listed in descending rank order of sex-specific, age-adjusted death rates for 2013–2017 for all racial/ethnic groups combined. More than 15 cancers may appear males and females to include the top 15 cancers in each racial/ethnic group.
Based on data from the National Center for Health Statistics public-use data file for the total United States, 2001–2017.
The AAPC is the weighted average of the APCs over the fixed interval 2013–2017 using the underlying Joinpoint model for the period of 2001–2017.
The APC or AAPC is statistically significantly different from zero (P < .05). Two-sided statistical significance for APC was determined using a t-test and for AAPC using a t-test when the AAPC lay entirely within the last joinpoint segment or a z-test when the AAPC extended beyond the last joinpoint segment.
Overall cancer death rates ranged from 125 to 195 deaths per 100,000 standard population (Figure 7A). During 2013–2017, cancer death rates decreased in all states, decreasing 4.3% in Alaska and ≥2% per year in 6 additional states and the District of Columbia (Figure 7B).
Figure 7.
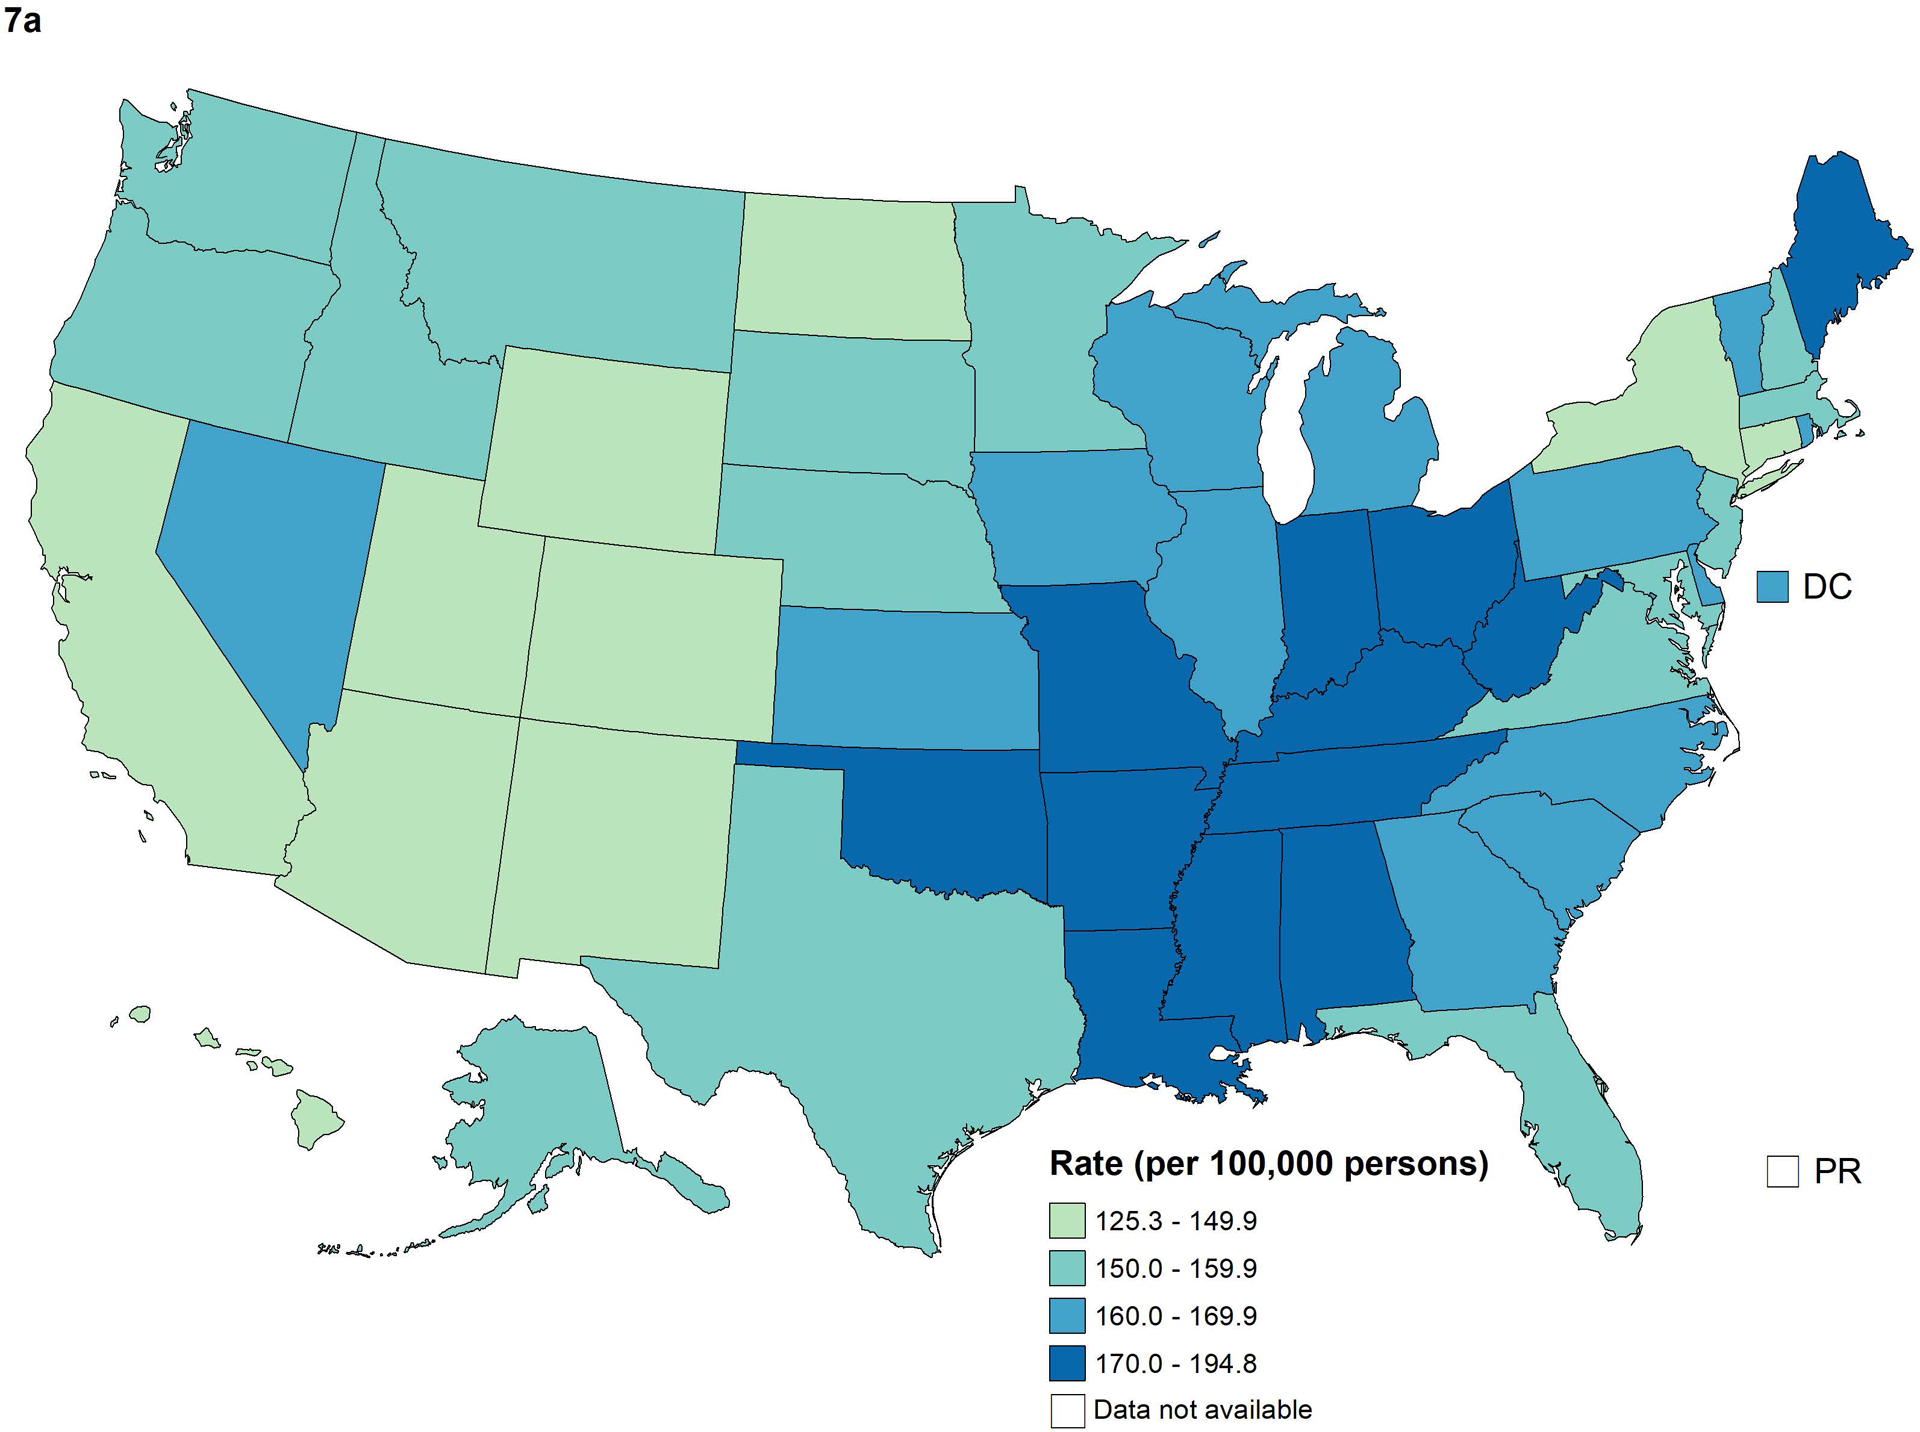
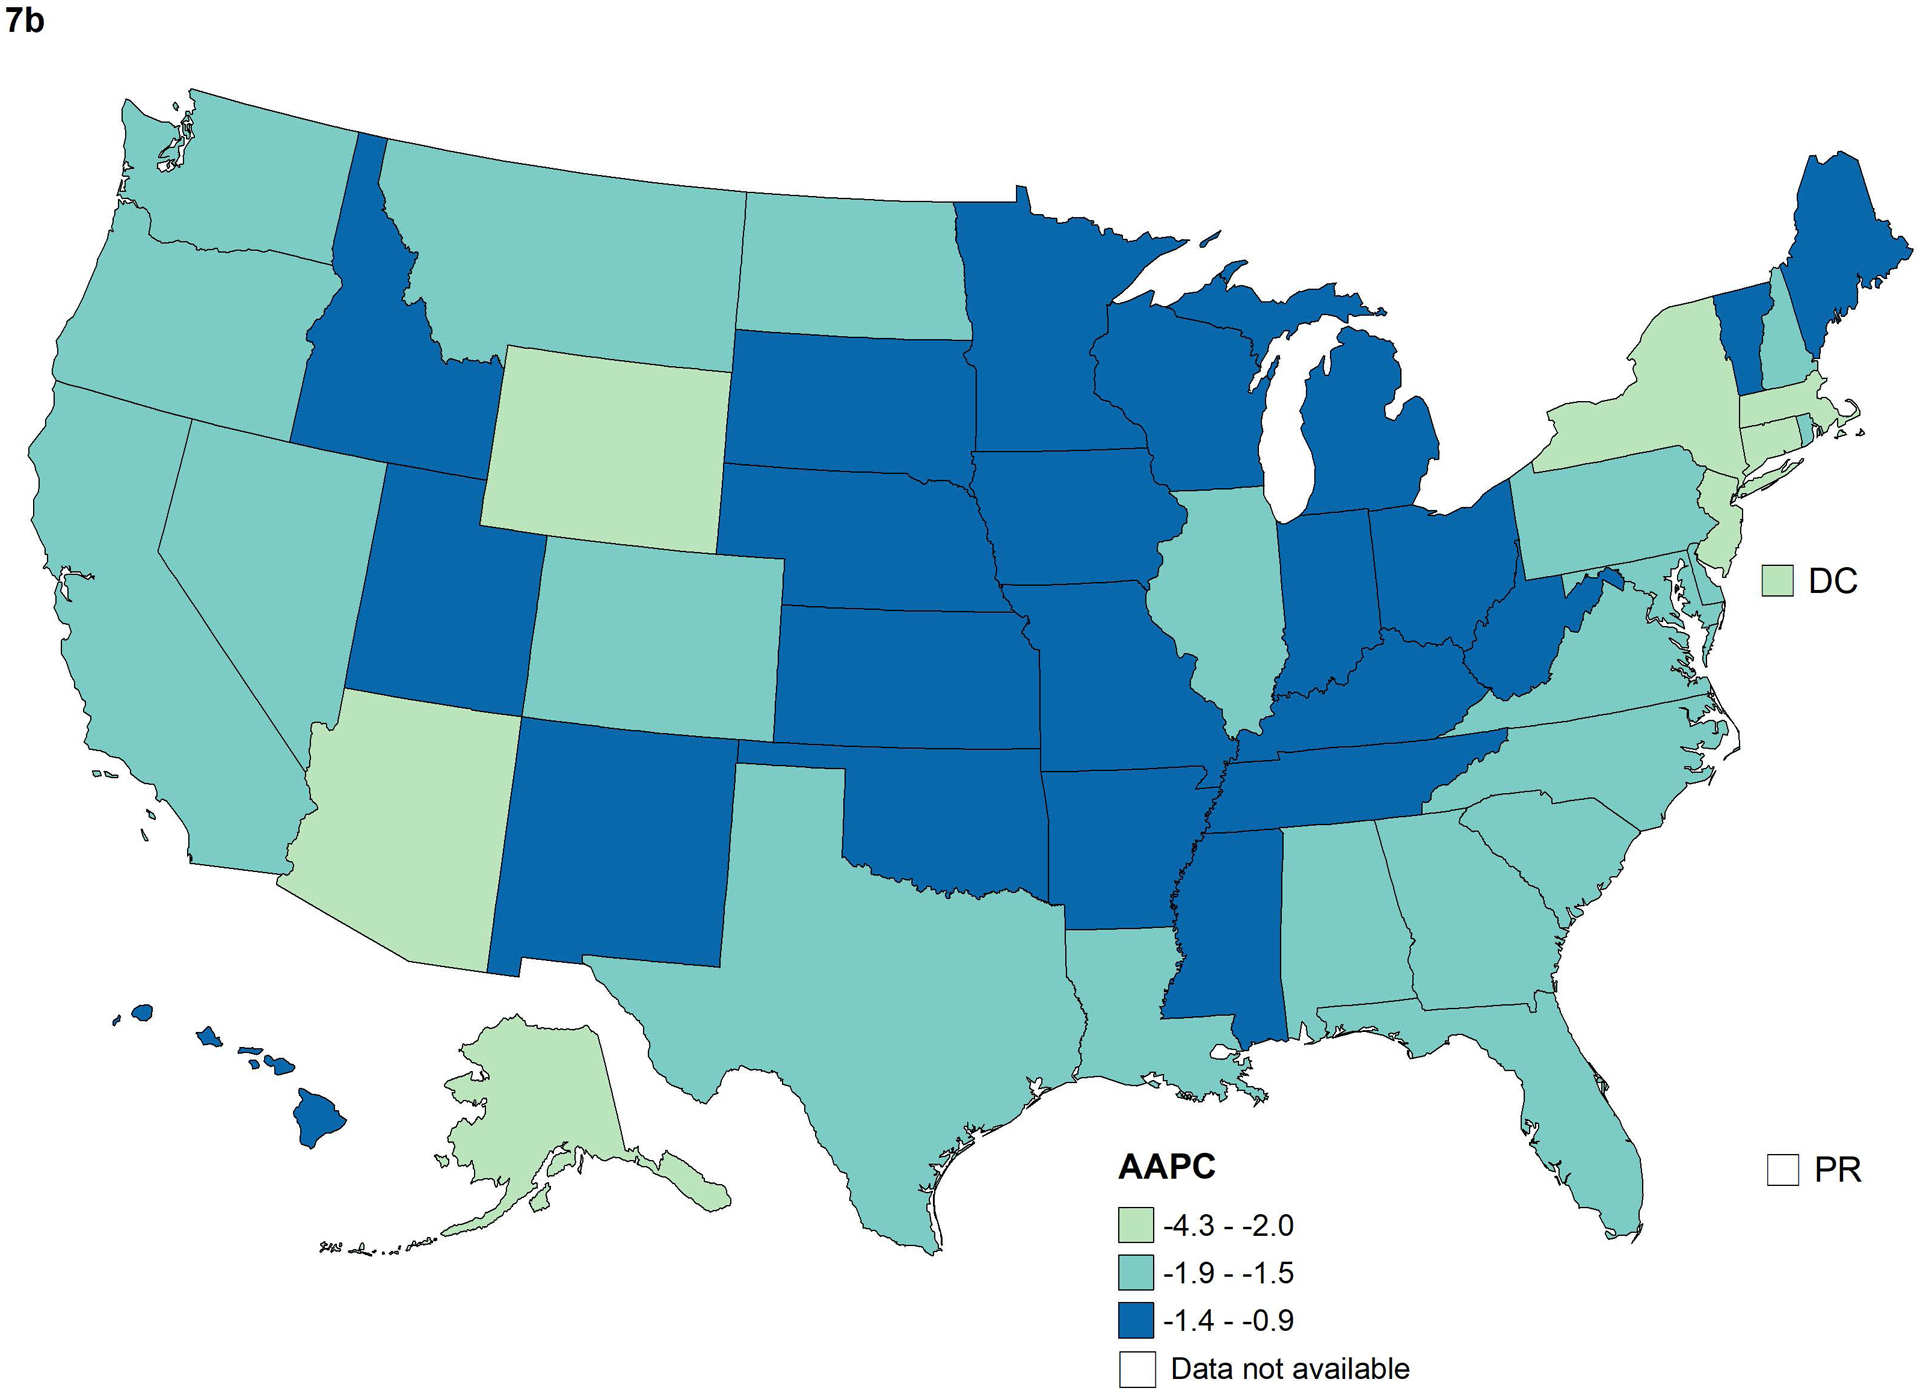
Age-standardized overall cancer death rates for 2013–2017 (A) and average annual percent change (AAPC) in rates for 2013–2017 (B) by state. The AAPC was a weighted average of the annual percent change (APCs) over the fixed 5-year interval 2013–2017 using the underlying joinpoint regression model, which allowed up to 4 different APCs, for the 17-year period 2001–2017. Stable AAPCs were not statistically significantly different from zero (P<0.05).
Cancer Among Children
Among children aged 0–14 years, the incidence rate for all cancer sites combined was 16.8 cases per 100,000 standard population, ranging from 12.4 among AI/AN children to 17.8 among white children (Table 1). Overall cancer incidence rates increased an average of 0.8% per year during 2012–2016 (Table 1). The most common cancer types among children included leukemia, brain and ONS, and lymphoma, with increasing trends for each of these cancers during 2001–2016 (Table 2). Leukemia rates showed the most variability among racial/ethnic groups, ranging from 3.3 cases per 100,000 standard population among black children to 6.2 among Hispanic children. The cancer death rate among children was 2.1 deaths per 100,000 standard population and was highest among AI/AN children (2.6) and lowest among API children (1.8) (Table 3). Overall cancer death rates among children decreased an average of 1.4% per year during 2013–2017. The most common cancer deaths among children were from brain and ONS (0.7 deaths per 100,000) and leukemia (0.5 deaths per 100,000). During 2001–2017, death rates among children for brain and ONS cancer were stable while death rates from leukemia declined 2.8% per year (Table 4).
Cancer Among Adolescents and Young Adults
Among AYA aged 15–39 years, the incidence rate for all cancer sites combined was 75.5 cases per 100,000 standard population, ranging from 54.8 among API AYA to 84.1 among white AYA (Table 1). The most common cancer among AYA was female breast cancer, which was highest among black AYA. Incidence rates of thyroid cancer and testicular cancer among AYA varied by racial/ethnic group and were lowest among black AYA and highest among white AYA. Overall cancer incidence rates among AYA increased an average of 0.9% per year during 2012–2016 (Table 1). Three of the four most common cancer types among AYA (female breast, thyroid, and testis) increased during 2012–2016 but the fourth (lymphoma) decreased. AYA female breast cancer incidence rates were stable during 2001–2010 then increased 1.2% per year during 2010–2016 (Table 2). Increasing trends for AYA thyroid cancer slowed from 5.8% per year during 2001–2010 to 1.7% per year during 2010–2016 (Table 2).
The cancer death rate among AYA was 8.9 deaths per 100,000 standard population and was highest among black AYA (11.4) and AI/AN AYA (11.0) and lowest among API AYA (6.9) (Table 3). The most common cancer deaths among AYA were from female breast (2.2 deaths per 100,000 standard population), brain and ONS (1.0), leukemia (0.9), and colorectal (0.9). Death rates from breast cancer among black AYA (3.9) were nearly twice as high compared to white AYA (2.0) and more than twice as high compared to API (1.3), AI/AN (1.6), and Hispanic AYA (1.8). Declining trends in overall death rates among AYA slowed from −3.0% per year during 2001–2005 to −1.0% per year during 2005–2017 (Table 4). The only notable change in trend in cancer death rates for common sites occurred for AYA female breast cancer, which declined (−3.2% per year) during 2001–2010 and then stabilized during 2010–2017.
DISCUSSION
While overall cancer death rates continued to decline among both males and females, incidence rates leveled off among males and increased slightly among females. These trends reflect population changes in cancer risk factors, screening test use, diagnostic practices, and treatment advances.2 Part 2 of this report showed that Healthy People 2020 objectives were not yet met overall for major cancer risk factors such as excess body weight, excessive alcohol use, and cigarette smoking.2 Historical declines in cigarette smoking have been reflected by declines in incidence of and mortality from several tobacco-related cancers, including lung, larynx, and bladder, which have greatly impacted the overall incidence and death rates.14,15 While the decrease in lung cancer was substantial, it continues to be the leading cause of cancer death, accounting for about a quarter of all cancer deaths. Furthermore, these gains are being offset by increasing incidence trends for cancers related to excess body weight and physical inactivity, including those for female breast, uterus, kidney, liver, and pancreas.16,17
Through early detection of cancer and subsequent timely and effective treatment, the use of cancer screening tests can reduce mortality.18–23 However, the effects on incidence are more complex, because screening can lead to either increases or decreases in the number of diagnosed cases.24 For example, the number of cases may increase through the detection of indolent, slow growing, or inconsequential tumors, or the number of malignant colorectal and cervical cases may decrease when screening tests detect precancerous lesions that are treated before progressing to cancer. Part 2 of this report showed that the current use of recommended screening tests is suboptimal, ranging from <10% for lung cancer to 60% for colorectal cancer, 72% for breast cancer, and 81% for cervical cancer.2,25 Furthermore, breast and cervical cancer screening use has declined.2,25 This report shows that rates of cervical cancer incidence have leveled off after over a decade of sustained declines, which may coincide with declines in screening rates.
For the first time, the Annual Report provided rates and trends for the most common cancers among children and AYA. As noted in last year’s report, cancers among these age groups are of particular significance because many young patients experience long-tern sequelae of their cancer and its treatment, affecting their health and quality of life for the remainder of their lifetimes.1 Reasons for increasing incidence rates for cancer overall and for the most common types among children are largely unknown.26 Factors potentially influencing childhood cancer incidence trends include changes over time in diagnostic technology, disease classification, and registry completeness,26 as well as changes in risk factors, such as increasing maternal age.27 Continued declines in cancer death rates among children likely result from improved treatment. As part of an effort to provide data faster for pediatric cancer research and more quickly identify young patients eligible for clinical trial enrollment, CDC created a cooperative program to help cancer registries improve rapid reporting of pediatric and young adult cases.28 NCI is launching an initiative to enhance data collection for childhood cancers.29
Among AYAs, the increase in female breast cancer incidence rates during 2010–2016 after a period of stability is concerning—particularly since death rates, which had declined during 2001–2010, also began to stabilize in 2010. As noted in last year’s report, opportunities for primary prevention of breast cancer among younger and premenopausal women are limited.1 More detailed studies may help evaluate potential reasons for these adverse trends.
During the most recent 5-year period in this report, colorectal cancer death rates declined among both males and females overall, most likely due, in part, to increases in the utilization of guideline-concordant colorectal cancer screening,30 which rose from 39% in 2000 to 55% in 2008 and continued to increase, but at a slower pace, to 61% in 2015.31 The relatively rapid declines in colorectal cancer incidence rates during 2001–2012 observed in this report correspond with this timeline of increased use of colorectal cancer screening. However, during 2012–2016, colorectal cancer incidence rates stabilized among women and the decline in rates slowed among men, consistent with the slowing pace in colorectal cancer screening use and increasing prevalence of risk factors such as excess body weight, adult weight gain, and diabetes.30 This year’s report observed a continued increase in colorectal cancer death rates among AYA, which has been noted previously.32,33
Excess body weight may have contributed to increasing trends in uterine cancer incidence and death rates.34 This report shows that as death rates from leukemia and non-Hodgkin lymphoma continue to decrease, uterine cancer is now ranked as the 6th most common cause of cancer death among women (slightly higher than leukemia). Excess body weight is also a risk factor for liver cancer.35,36 Liver cancer death rates continued to increase among females overall but stabilized among males, reflecting differing trends by racial/ethnic group. Liver cancer death rates have decreased among API due largely to improvements in hepatitis B virus vaccination coverage and treatment.37 However, prevalent risk factors for liver cancer, including excess body weight, diabetes, non-alcoholic fatty liver disease, alcohol use, and hepatitis C virus infection, may contribute to increases in liver cancer death rates observed in other groups.37 Incident rates for cancers of the oral cavity and pharynx increased among non-Hispanic white men and women and API men. Since tobacco use, a prominent risk factor, has declined, researchers suggest that the increase in this group of cancers may be due to increases in sites associated with human papillomavirus, such as tonsil, base of tongue, and oropharynx.38
Changing trends in prostate cancer incidence and mortality largely reflect changes in the US Preventive Services Task Force (USPSTF) recommendations for prostate-specific antigen (PSA) screening.39,40 In 2008, the USPSTF considered evidence to be insufficient for recommending routine PSA screening in men aged 50–74 years and recommended against PSA screening in men aged ≥ 75 years,41 and, in 2012, subsequently recommended against routine PSA screening in men of any age.42 Subsequent declines in PSA test use have been associated with declines in prostate cancer incidence during 2009–2014.39 Recent stabilization in prostate cancer mortality trends may be related to increasing incidence of distant stage disease since 2008.39,43 The USPSTF issued new prostate cancer screening recommendations in 2018 which recommend that men aged 55–69 years talk with their clinician about the benefits and harms of prostate cancer screening with the PSA test.44
There are some trends in the positive direction. For the first time in decades, incidence rates for thyroid cancer in the most recent 5-year period stabilized among both males and females overall. Increasing trends in thyroid cancer incidence over the past several decades have been attributed in part to increasing use of ultrasound-guided fine needle aspiration biopsy,45 and a slowing of these trends, beginning in 2009, has been attributed to revisions in American Thyroid Association management guidelines for thyroid nodules, which recommended against biopsy of nodules less than 1 cm in the absence of certain high-risk characteristics.46 Recent changes in thyroid cancer guidelines are intended to reduce overdiagnosis and overtreatment of relatively low-risk tumors, which can result in long term decrement in health-related quality of life and financial burden.47,48 While thyroid cancer incidence rates stabilized among males and females of all ages, rates continued to increase among AYA. An analysis of differentiated thyroid cancer incidence among children and AYA found increasing trends for large as well as small tumors.49 Changes in prevalence of several risk factors for thyroid cancer, including low dose radiation exposure50 and excess body weight,51 may contribute to increasing incidence rates in more recent birth cohorts.
Recent rapid declines in death rates from melanoma of the skin, first noted in last year’s report,1 likely have resulted from the introduction of new therapies that have improved survival rates for advanced melanoma.52 New therapies, including targeted and immune checkpoint inhibitors, have increased the median survival for advanced-stage melanoma from approximately 9 months to at least 2 years, based on clinical trials. Early indications of the new therapies’ effect on population-level survival were observed in a study using the SEER-18 database. The study found that 2-year survival among patients diagnosed with metastatic melanoma in the post-targeted era (2011–2014) was 28.3%, a statistically significant improvement over the 23.5% observed in the pre-targeted era (2004–2010).53
Accelerating rates of declines in death rates from lung cancer, the most common cause of cancer death in both men and women, may reflect increases in survival related to improved treatments, improved access to diagnostic and treatment services, and possibly earlier diagnosis due to implementation of low-dose CT screening in high risk populations.54 Selection of individualized lung cancer treatment can be based on characteristics such as stage of disease, histologic features, and presence of treatable oncogenic alterations.55–58
Due to the growth and aging of the U.S. population, the number of cases and deaths for many cancers continue to increase even while the age-standardized incidence and death rates decrease.59,60 For example, during 2001–2017, the number of cancer deaths increased from 553,760 to 599,108, despite death rates decreasing from 196 to 153 deaths per 100,000 persons.7 Similarly, the number of malignant cancers reported increased from 1.4 million in 2001 to 1.7 million in 2016, despite the incidence rate declining 0.6% per year.61 Future trends in cancer incidence and mortality will be impacted by changes in the demographics of the U.S. population, which is projected to be older and more racially and ethnically diverse.62 Tailored approaches for proven evidence-based interventions may help maintain progress in decreasing the cancer burden in the United States.2
Strengths and Limitations
The major strength of this study is the high population coverage of cancer incidence data for the United States and Puerto Rico (99% for incidence rates during 2012–2016 and 92% for incidence trends during 2001–2016). Data from some cancer registries did not meet criteria for data quality or completeness for some years; however, because of the high population coverage, these exclusions likely do not materially impact national trends. Another strength is that this is the first Annual Report that has examined race and ethnicity in mutually exclusive groups. Previous reports categorized race as four non-overlapping groups, regardless of ethnicity, and ethnicity as two non-overlapping groups, regardless of race. Mutually exclusive groups allow more direct comparison between categories. Additionally, this report restricts the analysis of incidence data to cases categorized by the 3rd edition of the ICD-O and so rates and trends may not be comparable to previous reports. Many of this study’s limitations, including potential lack of representativeness of cancer incidence data to the US population, have been described in previous reports.37,63–65 In some instances, this report groups cancers that are anatomically close to each other but may have different etiologies (such as cancers of the oral cavity and pharynx) or cancers at one site with different histologic types (such as small cell and non-small cell lung cancer) or molecular types (such as breast cancer); more detailed examinations of these cancers are beyond the scope of this report.
Conclusions
While overall cancer death rates continue to decline, incidence rates are leveling off among males and increasing slightly among females. These trends reflect population changes in cancer risk factors, screening test use, diagnostic practices, and treatment advances. Many cancers can be prevented or treated effectively if found early. Population-based cancer incidence and mortality data can be used to inform efforts to decrease the cancer burden in the United States and regularly monitor progress towards goals.
ACKNOWLEDGMENTS
We gratefully acknowledge the contributions of the state and regional cancer registry staff and health department personnel for their work in collecting the data used in this report. In addition, we thank Information Management Services, Inc. for assistance in compiling the data used in this report.
FUNDING
This work was supported by the American Cancer Society, the Centers for Disease Control and Prevention, the National Cancer Institute, and the North American Association of Central Cancer Registries.
Footnotes
Publisher's Disclaimer: DISCLAIMERS
The funders had no role in the design of the study; the collection, analysis or interpretation of the data; the writing of the manuscript; or the decision to submit the manuscript for publication. The findings and conclusions in this article are those of the authors and do not necessarily represent the official positions of the authors’ agencies (the American Cancer Society, the Centers for Disease Control and Prevention, the National Cancer Institute, or the North American Association of Central Cancer Registries).
CONFLICT OF INTEREST DISCLOSURES
The authors have no conflicts of interest related to this work to disclose.
REFERENCES
- 1.Ward E, Sherman RL, Henley SJ, et al. Annual report to the nation on the status of cancer, 1999–2015, featuring cancer in men and women ages 20–49. J Natl Cancer Inst 2019. 10.1093/jnci/djz106. [DOI] [PMC free article] [PubMed] [Google Scholar]
- 2.Henley SJ, Thomas CC, Lewis DR, et al. Annual report to the nation on the status of cancer, part 2: Progress toward Healthy People 2020 objectives for 4 common cancers Cancer 2019. [DOI] [PMC free article] [PubMed] [Google Scholar]
- 3.Singh SD, Henley SJ, Ryerson AB. Summary of notifiable noninfectious conditions and disease outbreaks: Surveillance for cancer incidence and mortality - United States, 2011. MMWR Morb Mortal Wkly Rep 2015;62(54):11–51. 10.15585/mmwr.mm6254a3. [DOI] [PubMed] [Google Scholar]
- 4.Sherman RFR, De P, Green D, Hofferkamp J, Johnson C, Kohler B, Charlton M, Hofer B, Hsieh M, Nash S, B Q, eds. Cancer in North America: 2012–2016. Volume one: Combined cancer incidence for the United States, Canada and North America. Springfield, IL: North American Association of Central Cancer Registries, Inc.; 2019. [Google Scholar]
- 5.Fritz A, Percy C, Jack A, et al. , eds. International classification of diseases for oncology. 3rd ed. Geneva, Switzerland: World Health Organization; 2000. [Google Scholar]
- 6.Howlader N, Noone AM, Krapcho M, et al. SEER cancer statistics review 1975–2016. Bethesda, MD: National Cancer Institute; 2019. Available from: https://seer.cancer.gov/csr/1975_2016/. [accessed January 17, 2020] [Google Scholar]
- 7.National Center for Health Statistics. National vital statistics system. 2019. Available from: https://www.cdc.gov/nchs/nvss/deaths.htm. [accessed January 17, 2020]
- 8.National Cancer Institute. Surveillance Epidemiology and End Results Program. Population estimates used in NCI’s SEER*Stat software. 2019. Available from: http://seer.cancer.gov/popdata/methods.html. [accessed January 17, 2020]
- 9.National Vital Statistics System. Bridged-race population estimates—data files and documentation. 2019. Available from: https://www.cdc.gov/nchs/nvss/bridged_race/data_documentation.htm. [accessed January 17, 2020]
- 10.Indian Health Service. Notice of the redesignation of the Service Delivery Area for the Wampanoag Tribe of Gay Head (Aquinnah). Fed Regist 2016;81(67):20388–20395. [Google Scholar]
- 11.National Cancer Institute. SEER*Stat software, version 8.3.5. 2019. Available from: www.seer.cancer.gov/seerstat. [accessed January 17, 2020]
- 12.Clegg LX, Feuer EJ, Midthune DN, Fay MP, Hankey BF. Impact of reporting delay and reporting error on cancer incidence rates and trends. J Natl Cancer Inst 2002;94(20):1537–1545. 10.1093/jnci/94.20.1537. [DOI] [PubMed] [Google Scholar]
- 13.National Cancer Institute. Joinpoint regression program, version 4.7.0.0. 2019. Available from: https://surveillance.cancer.gov/joinpoint/. [accessed January 17, 2020]
- 14.Jemal A, Thun MJ, Ries LAG, et al. Annual report to the nation on the status of cancer, 1975–2005, featuring trends in lung cancer, tobacco use, and tobacco control. J Natl Cancer Inst 2008;100(23):1672–1694. [DOI] [PMC free article] [PubMed] [Google Scholar]
- 15.Henley SJ, Thomas CC, Sharapova SR, et al. Vital signs: Disparities in tobacco-related cancer incidence and mortality - United States, 2004–2013. MMWR Morb Mortal Wkly Rep 2016;65(44):1212–1218. 10.15585/mmwr.mm6544a3. [DOI] [PubMed] [Google Scholar]
- 16.Eheman C, Henley SJ, Ballard-Barbash R, et al. Annual report to the nation on the status of cancer, 1975–2008, featuring cancers associated with excess weight and lack of sufficient physical activity. Cancer 2012;118(9):2338–2366. 10.1002/cncr.27514. [DOI] [PMC free article] [PubMed] [Google Scholar]
- 17.Steele CB, Thomas CC, Henley SJ, et al. Vital signs: Trends in incidence of cancers associated with overweight and obesity - United States, 2005–2014. MMWR Morb Mortal Wkly Rep 2017;66(39):1052–1058. 10.15585/mmwr.mm6639e1. [DOI] [PMC free article] [PubMed] [Google Scholar]
- 18.Moyer VA. Screening for lung cancer: U.S. Preventive Services Task Force recommendation statement. Ann Intern Med 2014;160(5):330–338. 10.7326/m13-2771. [DOI] [PubMed] [Google Scholar]
- 19.Bibbins-Domingo K, Grossman DC, Curry SJ, et al. Screening for colorectal cancer: U.S. Preventive Services Task Force recommendation statement. JAMA 2016;315(23):2564–2575. 10.1001/jama.2016.5989. [DOI] [PubMed] [Google Scholar]
- 20.Siu AL. Screening for breast cancer: U.S. Preventive Services Task Force recommendation statement. Ann Intern Med 2016;164(4):279–296. 10.7326/M15-2886 %J Annals of Internal Medicine. [DOI] [PubMed] [Google Scholar]
- 21.Preventive US Services Task Force. Screening for cervical cancer: U.S. Preventive Services Task Force recommendation statement. JAMA 2018;320(7):674–686. 10.1001/jama.2018.10897 %J JAMA. [DOI] [PubMed] [Google Scholar]
- 22.Smith RA, Andrews KS, Brooks D, et al. Cancer screening in the United States, 2018: A review of current American Cancer Society guidelines and current issues in cancer screening. CA Cancer J Clin 2018:doi: 10.3322/caac.21446. 10.3322/caac.21446. [DOI] [PubMed] [Google Scholar]
- 23.Wolf AMD, Fontham ETH, Church TR, et al. Colorectal cancer screening for average-risk adults: 2018 guideline update from the American Cancer Society. CA Cancer J Clin 2018;68(4):250–281. 10.3322/caac.21457. [DOI] [PubMed] [Google Scholar]
- 24.Welch HG, Kramer BS, Black WC. Epidemiologic signatures in cancer. N Engl J Med 2019;381(14):1378–1386. 10.1056/NEJMsr1905447. [DOI] [PubMed] [Google Scholar]
- 25.Brown ML, Klabunde CN, Cronin KA, White MC, Richardson LC, McNeel TS. Challenges in meeting Healthy People 2020 objectives for cancer-related preventive services, National Health Interview Survey, 2008 and 2010. Prev Chronic Dis 2014;11:E29 10.5888/pcd11.130174. [DOI] [PMC free article] [PubMed] [Google Scholar]
- 26.Siegel DA, King J, Tai E, Buchanan N, Ajani UA, Li J. Cancer incidence rates and trends among children and adolescents in the United States, 2001–2009. Pediatrics 2014;134(4):e945–955. 10.1542/peds.2013-3926. [DOI] [PMC free article] [PubMed] [Google Scholar]
- 27.Kehm RD, Osypuk TL, Poynter JN, Vock DM, Spector LG. Do pregnancy characteristics contribute to rising childhood cancer incidence rates in the United States? Pediatr Blood Cancer 2018;65(3). 10.1002/pbc.26888. [DOI] [PMC free article] [PubMed] [Google Scholar]
- 28.Puckett M, Neri A, Rohan E, et al. Evaluating early case capture of pediatric cancers in seven central cancer registries in the United States, 2013. Public Health Rep 2016;131(1):126–136. 10.1177/003335491613100119. [DOI] [PMC free article] [PubMed] [Google Scholar]
- 29.National Cancer Institute. Childhood cancer data initiative. 2019. Available from: https://www.cancer.gov/research/areas/childhood/childhood-cancer-data-initiative. [accessed January 17, 2020]
- 30.Edwards BK, Ward E, Kohler BA, et al. Annual report to the nation on the status of cancer, 1975–2006, featuring colorectal cancer trends and impact of interventions (risk factors, screening, and treatment) to reduce future rates. Cancer 2010;116(3):544–573. [DOI] [PMC free article] [PubMed] [Google Scholar]
- 31.de Moor JS, Cohen RA, Shapiro JA, et al. Colorectal cancer screening in the United States: Trends from 2008 to 2015 and variation by health insurance coverage. Prev Med 2018;112:199–206. 10.1016/j.ypmed.2018.05.001. [DOI] [PMC free article] [PubMed] [Google Scholar]
- 32.Siegel RL, Medhanie GA, Fedewa SA, Jemal A. State variation in early-onset colorectal cancer in the United States, 1995–2015. J Natl Cancer Inst 2019. 10.1093/jnci/djz098. [DOI] [PMC free article] [PubMed] [Google Scholar]
- 33.Siegel RL, Miller KD, Jemal A. Colorectal cancer mortality rates in adults aged 20 to 54 years in the United States, 1970–2014. JAMA 2017;318(6):572–574. 10.1001/jama.2017.7630. [DOI] [PMC free article] [PubMed] [Google Scholar]
- 34.Henley SJ, Miller JW, Dowling NF, Benard VB, Richardson LC. Uterine cancer incidence and mortality - United States, 1999–2016. MMWR Morb Mortal Wkly Rep 2018;67(48):1333–1338. 10.15585/mmwr.mm6748a1. [DOI] [PMC free article] [PubMed] [Google Scholar]
- 35.Lauby-Secretan B, Scoccianti C, Loomis D, Grosse Y, Bianchini F, Straif K. Body fatness and cancer--viewpoint of the IARC working group. N Engl J Med 2016;375(8):794–798. 10.1056/NEJMsr1606602. [DOI] [PMC free article] [PubMed] [Google Scholar]
- 36.World Cancer Research Fund / American Institute for Cancer Research. Diet, nutrition, physical activity and cancer: A global perspective. Continuous update project expert report 2018. 2018.
- 37.Ryerson AB, Eheman CR, Altekruse SF, et al. Annual report to the nation on the status of cancer, 1975–2012, featuring the increasing incidence of liver cancer. Cancer 2016;122(9):1312–1337. 10.1002/cncr.29936. [DOI] [PMC free article] [PubMed] [Google Scholar]
- 38.Sturgis EM, Cinciripini PM. Trends in head and neck cancer incidence in relation to smoking prevalence: An emerging epidemic of human papillomavirus-associated cancers? Cancer 2007;110(7):1429–1435. 10.1002/cncr.22963. [DOI] [PubMed] [Google Scholar]
- 39.Negoita S, Feuer EJ, Mariotto A, et al. Annual report to the nation on the status of cancer, part II: Recent changes in prostate cancer trends and disease characteristics. Cancer 2018;124(13):2801–2814. 10.1002/cncr.31549. [DOI] [PMC free article] [PubMed] [Google Scholar]
- 40.Jemal A, Fedewa SA, Ma J, et al. Prostate cancer incidence and PSA testing patterns in relation to USPSTF screening recommendations. JAMA 2015;314(19):2054–2061. 10.1001/jama.2015.14905. [DOI] [PubMed] [Google Scholar]
- 41.Preventive US Services Task Force. Screening for prostate cancer: U.S. Preventive Services Task Force recommendation statement. Ann Intern Med 2008;149(3):185–191. 10.7326/0003-4819-149-3-200808050-00008. [DOI] [PubMed] [Google Scholar]
- 42.Moyer VA. Screening for prostate cancer: U.S. Preventive Services Task Force Recommendation statement. Ann Intern Med 2012;157(2):120–134. 10.7326/0003-4819-157-2-201207170-00459. [DOI] [PubMed] [Google Scholar]
- 43.Li J, Siegel DA, King JB. Stage-specific incidence rates and trends of prostate cancer by age, race, and ethnicity, United States, 2004–2014. Ann Epidemiol 2018;28(5):328–330. 10.1016/j.annepidem.2018.03.001. [DOI] [PMC free article] [PubMed] [Google Scholar]
- 44.Grossman DC, Curry SJ, Owens DK, et al. Screening for prostate cancer: U.S. Preventive Services Task Force recommendation statement. JAMA 2018;319(18):1901–1913. 10.1001/jama.2018.3710. [DOI] [PubMed] [Google Scholar]
- 45.Davies L, Morris LG, Haymart M, et al. American Association of Clinical Endocrinologists and American College of Endocrinology disease state clinical review: The increasing incidence of thyroid cancer. Endocr Pract 2015;21(6):686–696. 10.4158/ep14466.Dscr. [DOI] [PMC free article] [PubMed] [Google Scholar]
- 46.Cooper DS, Doherty GM, Haugen BR, et al. Revised American Thyroid Association management guidelines for patients with thyroid nodules and differentiated thyroid cancer. Thyroid 2009;19(11):1167–1214. 10.1089/thy.2009.0110. [DOI] [PubMed] [Google Scholar]
- 47.Goswami S, Peipert BJ, Mongelli MN, et al. Clinical factors associated with worse quality-of-life scores in United States thyroid cancer survivors. Surgery 2019;166(1):69–74. 10.1016/j.surg.2019.01.034. [DOI] [PubMed] [Google Scholar]
- 48.Lubitz CC, Kong CY, McMahon PM, et al. Annual financial impact of well-differentiated thyroid cancer care in the United States. Cancer 2014;120(9):1345–1352. 10.1002/cncr.28562. [DOI] [PMC free article] [PubMed] [Google Scholar]
- 49.Vergamini LB, Frazier AL, Abrantes FL, Ribeiro KB, Rodriguez-Galindo C. Increase in the incidence of differentiated thyroid carcinoma in children, adolescents, and young adults: A population-based study. J Pediatr 2014;164(6):1481–1485. 10.1016/j.jpeds.2014.01.059. [DOI] [PubMed] [Google Scholar]
- 50.Lubin JH, Adams MJ, Shore R, et al. Thyroid cancer following childhood low-dose radiation exposure: A pooled analysis of nine cohorts. J Clin Endocrinol Metab 2017;102(7):2575–2583. 10.1210/jc.2016-3529. [DOI] [PMC free article] [PubMed] [Google Scholar]
- 51.Ma J, Huang M, Wang L, Ye W, Tong Y, Wang H. Obesity and risk of thyroid cancer: Evidence from a meta-analysis of 21 observational studies. Med Sci Monit 2015;21:283–291. 10.12659/msm.892035. [DOI] [PMC free article] [PubMed] [Google Scholar]
- 52.Luke JJ, Flaherty KT, Ribas A, Long GV. Targeted agents and immunotherapies: Optimizing outcomes in melanoma. Nat Rev Clin Oncol 2017;14(8):463–482. 10.1038/nrclinonc.2017.43. [DOI] [PubMed] [Google Scholar]
- 53.Uprety D, Bista A, Chennamadhavuni A, et al. Survival trends among patients with metastatic melanoma in the pretargeted and the post-targeted era: A US population-based study. Melanoma Res 2018;28(1):56–60. 10.1097/cmr.0000000000000394. [DOI] [PubMed] [Google Scholar]
- 54.Schabath MB, Cote ML. Cancer progress and priorities: Lung cancer. Cancer Epidemiol Biomarkers Prev 2019;28(10):1563–1579. 10.1158/1055-9965.Epi-19-0221. [DOI] [PMC free article] [PubMed] [Google Scholar]
- 55.National Comprehensive Cancer Network. NCCN clinical practice guidelines in oncology: Non-small cell lung cancer. Version 2.2020. 2019. Available from: https://www.nccn.org/professionals/physician_gls/pdf/nscl.pdf. [accessed January 17, 2020] [DOI] [PubMed]
- 56.National Comprehensive Cancer Network. NCCN clinical practice guidelines in oncology: Small cell lung cancer. Version 2.2020. 2019. Available from: https://www.nccn.org/professionals/physician_gls/pdf/sclc.pdf. [accessed January 17, 2020] [DOI] [PubMed]
- 57.Reck M, Rabe KF. Precision diagnosis and treatment for advanced non–small-cell lung cancer. 2017;377(9):849–861. 10.1056/NEJMra1703413. [DOI] [PubMed] [Google Scholar]
- 58.Johnson DH, Schiller JH, Bunn PA Jr, . Recent clinical advances in lung cancer management. J Clin Oncol 2014;32(10):973–982. 10.1200/jco.2013.53.1228. [DOI] [PubMed] [Google Scholar]
- 59.Weir HK, Thompson TD, Soman A, Moller B, Leadbetter S. The past, present, and future of cancer incidence in the United States: 1975 through 2020. Cancer 2015;121(11):1827–1837. 10.1002/cncr.29258. [DOI] [PMC free article] [PubMed] [Google Scholar]
- 60.Weir HK, Anderson RN, Coleman King SM, et al. Heart disease and cancer deaths - trends and projections in the United States, 1969–2020. Prev Chronic Dis 2016;13:E157 10.5888/pcd13.160211. [DOI] [PMC free article] [PubMed] [Google Scholar]
- 61.U.S. Cancer Statistics Working Group. U.S. Cancer Statistics data visualizations tool, based on November 2018 submission data (1999–2016). 2019. Available from: www.cdc.gov/cancer/dataviz. [accessed January 17, 2020]
- 62.Colby SL, Ortman JM. Projections of the size and composition of the U.S. population: 2014 to 2060. Washington, DC: U.S. Census Bureau; 2015. [Google Scholar]
- 63.Kohler BA, Ward E, McCarthy BJ, et al. Annual report to the nation on the status of cancer, 1975–2007, featuring tumors of the brain and other nervous system. J Natl Cancer Inst 2011;103(9):714–736. 10.1093/jnci/djr077. [DOI] [PMC free article] [PubMed] [Google Scholar]
- 64.Jemal A, Ward EM, Johnson CJ, et al. Annual report to the nation on the status of cancer, 1975–2014, featuring survival. J Natl Cancer Inst 2017;109(9). 10.1093/jnci/djx030. [DOI] [PMC free article] [PubMed] [Google Scholar]
- 65.Cronin KA, Lake AJ, Scott S, et al. Annual report to the nation on the status of cancer, part I: National cancer statistics. Cancer 2018;124(13):2785–2800. 10.1002/cncr.31551. [DOI] [PMC free article] [PubMed] [Google Scholar]