

Abstract
Long non-coding RNAs (lncRNAs) play an important role in gene regulation and are increasingly being recognized as crucial mediators of disease pathogenesis. However, the vast majority of published transcriptome datasets lack high-quality lncRNA profiles compared to protein-coding genes (PCGs). Here we propose a framework to harnesses the correlative expression patterns between lncRNA and PCGs to impute unknown lncRNA profiles. The lncRNA expression imputation (LEXI) framework enables characterization of lncRNA transcriptome of samples lacking any lncRNA data using only their PCG profiles. We compare various machine learning and missing value imputation algorithms to implement LEXI and demonstrate the feasibility of this approach to impute lncRNA transcriptome of normal and cancer tissues. Additionally, we determine the factors that influence imputation accuracy and provide guidelines for implementing this approach.
Keywords: lncRNA, expression, machine learning, imputation, TCGA, GTEX
Introduction
Long non-coding RNAs (lncRNAs) are a diverse, tissue-specific class of transcripts that do not encode proteins and are greater than 200 nucleotides in length [1]. Like protein-coding genes (PCGs), lncRNAs respond to diverse transcriptional stimuli, are transcribed by RNA polymerase II, and undergo similar post-transcriptional processing including splicing and polyadenylation [2, 3]. At the molecular level, lncRNAs regulate gene expression via diverse mechanisms, such as signal, decoy, scaffold, guide and enhancer RNAs [4]. It is increasingly evident that aberrantly expressed lncRNAs have functional relevance in diseases like cancer, acting as oncogenes or tumor suppressors, and may serve as diagnostic biomarkers and therapeutic targets [5]. While the importance of studying patterns of lncRNA expression in cancer and other phenotypes is evident, we lack a comprehensive representation of the lncRNA transcriptome for most phenotypes, partly due to lower abundance of lncRNA transcripts per cell compared to PCGs [6, 7]. For example, archived clinical samples are often available as formalin-fixed paraffin-embedded tissues, offering advantages in handling and storage, but suffer from diminished RNA quality and average expression levels compared to fresh samples [8]. Thus, the method selected for sample handling and processing can result in loss of low-abundance lncRNAs. Moreover, the vast majority of the microarray expression datasets provide inadequate coverage of lncRNAs, in addition to offering narrow dynamic detection range compared to RNAseq [9]. Consequently, the amount of high-quality lncRNA data available to study their functional role for various phenotypes is lacking.
To overcome these challenges, we propose a framework that leverages correlations between PCGs and lncRNAs to impute the lncRNA transcriptome of uncharacterized samples. Our objective is to impute the lncRNA transcriptome of uncharacterized samples using only their PCG data, which is conceptually different from imputing missing values in a gene expression matrix where algorithms replace missing values by calculating the local (gene-specific) or global (complete matrix) similarity structure of the data [10]. We evaluate the feasibility of LEXI using cross-validation (CV) analysis of cancer cell lines, normal human tissues from the Genotype-Tissue Expression project (GTEX), and human cancer tissues from the Cancer Genome Atlas (TCGA) [11–13]. To demonstrate the practical utility and flexibility of LEXI, we compare and contrast imputed lncRNA expression between different technologies (RNAseq versus microarray) and across different sample types, both in vitro and in vivo. We further compare the measured and imputed expression levels of cancer-associated lncRNAs, HOTAIR & MALAT1 between normal and tumor samples, and recover literature-supported associations between the LEXI-derived lncRNA expression profiles and the cancer phenotype. Interestingly, these associations were not recovered in the measured RNAseq data. Our analysis demonstrates it is indeed possible to accurately impute lncRNA transcriptome using PCGs and provides a guideline for applying this method to user-supplied datasets.
Results
We analyzed the expression patterns of lncRNAs in Genentech Cell Line Screening Initiative (gCSI) dataset and observed that most lncRNAs were highly correlated with a small number of PCGs (Figure 1A). We observed that lncRNA biotype, like antisense versus long intergenic, was not associated with the proportion of highly correlated lncRNA-PCG pairs [analysis of variance (ANOVA) P = 0.3] (Figure 1B). Therefore, we hypothesized that these correlative patterns could be harnessed in a framework that only required PCGs to impute all lncRNA profiles.
Figure 1.

Expression redundancy and LEXI outline. (A) The left panel is a histogram of correlation coefficients for expression levels of all lncRNA-PCG pairs in the gCSI dataset. The dashed lines indicate the thresholds used to define highly correlated lncRNA-PCG pairs (1st, 99th percentiles). The right panel shows the distribution of lncRNAs (Y-axis) based on the number of highly correlated PCGs (X-axis). (B) Boxplots showing the relationship between the numbers of highly correlated lncRNA-PCG pairs with lncRNA biotypes. The widths of the boxes were scaled according to the number of lncRNA in each biotype category. (C) The LEXI framework. Step 1 involves pre-processing of the training PCG and lncRNA dataset. Step 2 selects an informative subset of PCGs for a given lncRNA. Step 3 performs in-sample CV analysis on training dataset to acquire imputation accuracy measurements. Step 4 involves imputing lncRNA expression in the uncharacterized sample or test dataset with measured PCG but missing lncRNA profiles.
LncRNA transcriptome can be accurately imputed using PCGs
The lncRNA expression imputation (LEXI) framework is outlined in Figure 1C. We compared the performance of five algorithms in the LEXI framework using CV analysis of the gCSI dataset (see details in Methods). For this analysis, we analyzed lncRNAs that were expressed in at least 75% of the cell lines to avoid empty CV partitions. We set a threshold of 100 PCGs as training features based on simulations comparing gain in accuracy with increasing number of PCGs (Supplementary Figure 1A). The CV analysis revealed high imputation accuracies determined as Pearson’s correlation coefficient (PCC) with Random Forests (PCC = 0.911), Elastic Nets (PCC = 0.946) and least absolute shrinkage and selection operator (LASSO) (PCC = 0.948) (Figure 2A). These methods performed significantly better than both k-Nearest Neighbor (k-NN) (PCC = 0.755) and Principal Components Regression (PCR) methods (PCC 0.297–0.564) (each comparison, P < 2 × 10⁻¹⁶), which are frequently used for missing value imputation (Figure 2A). However, imputations using k-NN and PCR were significantly faster than the other three methods (P < 2 × 10⁻¹⁶) (Figure 2B), indicating improved imputation accuracies were associated with high computation costs. The performance of Random Forests was similar to both Elastic Nets (P = 0.998) and LASSO (P = 0.851), however 2.6% of Elastic Nets and 2.3% LASSO PCCs were less than 0.25, while none for Random Forests, suggesting that the less rigid assumptions made by the Random Forests model were beneficial in certain instances. Therefore, we selected Random Forests for all subsequent implementations of LEXI, given the high imputation accuracies comparable to Elastic Nets and LASSO, but only requiring half the computation time. Importantly, only 1 out of 733 Random Forest imputed versus measured PCC was non-significant [false discovery rate (FDR) < 0.05]. This analysis also confirmed our hypothesis that is indeed possible to accurately impute the expression of lncRNAs using just PCGs.
Figure 2.

Comparison of imputation algorithms. (A) Boxplots showing the distribution of PCC comparing imputed versus measured lncRNA expression levels from CV analysis of the gCSI dataset. Each individual point represents PCC between imputed and measured expression levels of an lncRNA. PCR indicates principal components regression, with the number of principal components used as training features indicated in brackets. (B) Boxplots showing CPU usage time (in seconds) required for each method. The indicated times include the time required for CV following candidate informative gene selection for k-NN and Random Forests, and parameter tuning for Elastic Nets and LASSO.
Imputation of lncRNA transcriptome in normal and pan-cancer tissue samples
The analysis with gCSI dataset demonstrated the ability of accurate IncRNA expression imputation in cancer cell lines and provided with a framework that could be applied to additional datasets. We next applied LEXI to an integrated pan-cancer (PANCAN) RNAseq dataset comprised of over 11000 human tissue samples from TCGA project. In addition, we analyzed more than 8500 normal human tissue samples from the GTEX project [12]. Due to lack of lncRNAs expressed in 75% samples in the PANCAN dataset, we performed CV analysis on all lncRNAs with an expression variance greater than zero. We performed the GTEX analysis with lncRNAs that were expressed in at least 75% of all samples. In the PANCAN analysis, we obtained a median PCC of 0.71, while GTEX yielded a median PCC of 0.75 (Figure 3A and B). Further, 70.5% of PANCAN and 97.7% of GTEX lncRNA imputations were statistically significant (FDR < 0.05), requiring 1.9 s and 1.7 s of average computation times, respectively (Figure 3A and B).
Figure 3.

Performance of LEXI in additional datasets. Boxplot panels showing performance metrics (PCC, −log10 of p-value, RMSE and time in seconds) associated with CV analysis of (A) PANCAN and (B) GTEX datasets. The PANCAN CV analyses were performed for all lncRNAs with a variance greater than zero while the GTEX analyses were performed with lncRNAs expressed in at least 75% of the GTEX samples.
Imputing lncRNA transcriptome of independent cell line and tissue datasets
At its core, the LEXI framework could enable imputation of lncRNA expression profiles of datasets where lncRNA data is missing or not detected due to limitations of the assay used for transcriptome profiling. Here, we applied LEXI to impute lncRNA transcriptome of two independent datasets (PANCAN, Genomics of Drug Sensitivity in Cancer (GDSC)) using models generated using the gCSI dataset. In this analysis, the gCSI models were utilized to impute lncRNA transcriptome using PCG profiles from both RNAseq (PANCAN) and microarray (GDSC) datasets, to demonstrate the cross-platform application of the method. Given the observed association between the number of cell lines expressing a given lncRNA and imputation performance, we contrasted the performance of LEXI in imputing well-expressed lncRNAs (expressed in ≥75% of gCSI cell lines) versus all lncRNAs.
In the PANCAN analysis, we obtained a median PCC = 0.325 across all 773 lncRNAs, compared to a PCC = 0.603 for the 108 lncRNAs that were expressed in ≥75% cells (Figure 4A). In this analysis, 96% of the PCCs for all lncRNAs were statistically significant (FDR < 0.05), while 100% PCCs were significant in the subset of lncRNA expressed in ≥75% gCSI samples. We observed similar performance in the GDSC microarray analysis, with a median PCC = 0.415 across all 8680 lncRNAs and a PCC = 0.592 for the 733 lncRNAs expressed in ≥75% cell lines, with 88.4% and 100% significant PCCs, respectively in each subset (Figure 4B). This analysis demonstrated that lncRNA transcriptome could be imputed for independent PCG expression datasets, regardless of PCG profiling method used to generate the datasets.
Figure 4.

Applying LEXI to impute lncRNA profile of independent datasets. Boxplot panels show performance metrics (PCC, −log10 of P-value and time in second) of lncRNA transcriptome imputation in A. PANCAN (RNAseq for PCG profiling) and B. GDSC (microarray for PCG profiling) datasets using models generated in gCSI cell line dataset (RNAseq for PCG profiling). Panels on the left show performance of models constructed with the subset of lncRNAs expressed in at least 75% of gCSI cell lines, while the right panels show the performance of models constructed with all overlapping lncRNAs.
Determining factors influencing imputation accuracy
We next sought to identify the factors that influenced imputation accuracy across the various CV and prediction analyses (summarized in Table 1). We first analyzed the effects of various factors on CV performance in the gCSI analysis with lncRNAs expressed in at least 75% of the samples. We observed that the lncRNA transcript biotype had a significant influence on imputation accuracy (P = 6.29 × 10⁻¹⁶) (Figure 5A). Additional comparison of individual biotypes showed that antisense lncRNAs were imputed with significantly greater accuracy than long-intergenic RNAs. This observation is especially intriguing, given we did not observe an effect of lncRNA biotype on the number of correlations with PCGs (Figure 1A). Next, we observed that lncRNA transcript lengths (PCC = −0.091, P = 0.013) were weakly associated with imputation accuracy, while expression variance (P = 0.47) were not. However, it is important to note that selection of broadly expressed lncRNAs likely precluded transcripts with very low variance. We also evaluated the effect of the number of samples expressing a given lncRNA (RPKM) and found a significant association with accuracy (P = 3.3 × 10⁻⁵), while the numbers of PCGs highly correlated with a given lncRNA also affected accuracy (P = 7.16 × 10⁻¹⁰) (Supplementary Figure 1B). Intriguingly, the average basal expression levels of the transcripts did not influence accuracy (R2 = 0.001, P = 0.37) (Supplementary Figure 1C). In other words, lncRNAs expressed at low levels could also be imputed accurately, provided a sufficient number of training samples expressed the lncRNA.
Table 1.
Summary of datasets and CV analysis
| Dataset | gCSI | PANCAN | GTEX | |
|---|---|---|---|---|
| Sample size | 675 | 11101 | 8556 | |
| Number of measured lncRNA (variance >0) | 8819 | 773 | 12520 | |
| Biotype distribution | Antisense | 35% | 12% | 16% |
| Long intergenic | 48% | 21% | 21% | |
| Percent of lncRNA measurements (RPKM)a | < 10 | 96.2 | 60.6 | 99.5 |
| ≥ 10 | 3.8 | 39.4 | 0.5 | |
| Median LEXI CV accuracy (PCCb) | 0.91 | 0.71 | 0.75 | |
| Percent significant CVs (FDRc <0.05) | 99.8 | 70.5 | 97.7 |
aRPKM = Reads Per Kilobase of transcript, per Million mapped reads
bPCC = Pearson’s Correlation Coefficient
cFDR = False Discovery Rate
Figure 5.

Factors influencing imputation performance. (A) Boxplots show the effect of lncRNA biotype on the performance of LEXI CV in the gCSI dataset. P-value indicates significance from the ANOVA of CV performance with biotype. (B) Boxplots of simulations showing the effect of increasing number of samples on CV performance in the gCSI dataset. The number of input samples are indicated along X-axis, while the FDR-adjusted CV p-value are shown along the Y-axis. The dashed horizontal grey line indicates significance threshold (FDR < 0.05). (C) Scatter plots show the associations between variance in lncRNA expression or the number of samples expressing a lncRNA with imputation accuracy (PCC) in the PANCAN dataset. The dark red line indicates linear fit while the grey shaded area indicates 95% C.I. (D) Boxplots show the effects of the magnitude of the correlation between lncRNA and informative PCGs used for imputation. The dark red boxes indicate averages for the 7 poor-performance lncRNAs with CV PCC < 0.2 while the dark blue boxes are the averages for 14 high-performance lncRNAs with CV PCC > 0.95. (E) Scatter plot shows an association between accuracy of imputation models generated with or without tissue-type as a variable, on a case-by-case basis. The dark red line indicates linear fit while the grey shaded area indicates 95% C.I.
Since we included all lncRNAs with variance greater than zero in the PANCAN CV analysis, we reevaluated the effect of various factors on imputation performance. In this case, we did observe an association between variance in lncRNA expression levels, along with the number of samples expressing a given lncRNA, and imputation accuracy (P = 2.3 × 10⁻²⁴ and P = 2.3 × 10−42, respectively) (Figure 5C). We next simulated the effects of increasing sample sizes and the number of input training PCG features on imputation accuracy in independent datasets. In this analysis, we observed a marginal (R2 = 0.026), but a significant increase in accuracy with increasing numbers of input samples (P = 0.004). However, this improvement was achieved at the cost of a dramatic increase in computation time (R2 = 0.982, P = 5.8 × 10−283) (Supplementary Figure 2A). On the other hand, increasing the number of input candidate PCGs resulted in improvement of accuracy (R2 = 0.021, P = 0.003), but did not result in an increase in computation time (P = 0.85) (Supplementary Figure 2B).
We next utilized the results from the PANCAN analysis to gain a deeper insight into the reasons why certain lncRNAs were imputed with poor accuracy. In this analysis, we identified the lncRNAs with low imputation accuracy (PCC < 0.2) and compared to those lncRNAs with very high imputation accuracies (PCC > 0.95) (Figure 5D). We found that the strength of correlation between the informative PCGs that were utilized by the imputation model were strong determinants of imputation performance. The average correlation between the top 100 PCGs, ranked by absolute correlation, and lncRNA expression were significantly higher for the well-imputed lncRNAs compared to poorly imputed lncRNAs (P = 5.6 × 10⁻⁸). Similarly, the top-ranked PCG correlated with lncRNA expression was significantly higher for well-imputed lncRNAs (P = 5.2 × 10⁻⁸).
Tissue-specific lncRNAs can be imputed using global models
Considering lncRNAs are expressed in a highly tissue-specific manner compared to PCGs, we tested whether the inclusion of tissue-type as an additional variable in the predictive model could improve accuracy [14]. Therefore, compared the performance of gCSI models that included tissue-type as an additional training feature along with the informative PCGs against the models built with only PCGs. Overall, the inclusion of tissue type did not improve imputation accuracy (P = 0.798) (Supplementary Figure 1D). Similarly, on a case-by-case basis, we found that both models performed at par with each other (R2 = 0.9, P < 1 × 10⁻⁷), suggesting that inclusion of tissue type did not provide additional information that was not already captured in the expression profile of the PCGs (Figure 5E).
In order to further investigate the ability to impute tissue-specific lncRNAs, we identified lncRNAs that were expressed in at least 95% of samples for a given tissue type, but not across 75% of all samples in the gCSI dataset. We included the four tissue types with the largest sample size in this analysis, including lung, lymphoid, breast and colorectal. None of the lung lncRNAs were exclusive from broadly expressed transcripts but eight lymphoid, two breast and two colorectal lncRNA were specifically expressed in these tissues-types. CV analysis for these tissue-specific lncRNAs produced imputation accuracies comparable to other broadly expressed lncRNAs (Table 2). Note that this CV analysis was performed using all samples, and not just the specific tissue, thus highlighting the utility of LEXI without requiring the knowledge of tissue-type.
Table 2.
CV analysis of tissue-specific lncRNA in the gCSI dataset
| Tissue type | Gene ID | PCC a | P-value | RMSE b |
|---|---|---|---|---|
| Lymphoid | ENSG00000224101 | 0.964 | 9.07E-31 | 0.357 |
| Lymphoid | ENSG00000228649 | 0.529 | 7.46E-05 | 0.759 |
| Lymphoid | ENSG00000235560 | 0.759 | 1.17E-08 | 0.668 |
| Lymphoid | ENSG00000236199 | 0.806 | 5.73E-12 | 0.600 |
| Lymphoid | ENSG00000237798 | 0.909 | 3.00E-22 | 0.417 |
| Lymphoid | ENSG00000268001 | 0.835 | 3.88E-17 | 0.545 |
| Lymphoid | ENSG00000267757 | 0.749 | 6.36E-09 | 0.687 |
| Lymphoid | ENSG00000265206 | 0.859 | 1.55E-12 | 0.643 |
| Breast | ENSG00000236883 | 0.961 | 5.43E-27 | 0.273 |
| Breast | ENSG00000257671 | 0.976 | 1.96E-40 | 0.206 |
| Colorectal | ENSG00000254429 | 0.933 | 3.64E-28 | 0.461 |
| Colorectal | ENSG00000233101 | 0.910 | 4.75E-18 | 0.346 |
| Average | 0.849 | 6.22E-06 | 0.497 |
aPCC = Pearson’s Correlation Coefficient
bRMSE = Root Mean Squared Error
Recovering differential expression patterns of oncogenic lncRNA expression in cancer tissues
The ability to accurately profile lncRNAs using RNAseq is a tremendous challenge owing to the much lower abundance of lncRNA transcripts per cell than PCGs [6, 7]. In the PANCAN dataset, we observed that 31.8% of measured lncRNAs across all samples were detected at the lowest expression levels (RPKM = 1), compared only 2.8% of measured PCGs. We tested if LEXI could recapture known lncRNA-phenotype associations observed within measured lncRNA RNAseq data. We further investigated whether additional literature-backed associations could be identified that were missed in measured lncRNA RNAseq data, essentially to demonstrate that LEXI improved the accuracy of lncRNA profiles over measured data. Here we applied LEXI to impute the expression levels of two well-established colorectal cancer-associated lncRNAs, MALAT1 and HOTAIR, in the TCGA colorectal adenocarcinoma dataset, and compared with measured expression patterns. Elevated expression of MALAT1, a highly-conserved, ~8000 nt long, ubiquitously expressed non-coding transcript, is associated with progression and poor prognosis of several cancers including colorectal cancer [15, 16]. HOTAIR is a ~2200 nt long oncogenic lncRNA overexpressed in multiple cancer types and is associated with colorectal cancer progression [17, 18]. Based on the reported associations between MALAT1 and HOTAIR with colorectal cancer in prevalent literature, it is reasonable to expect a differential expression of these lncRNAs in TCGA colorectal cancer cohort. In the TCGA PANCAN dataset, the MALAT1 is highly expressed in all tissue samples (median log2 RPKM = 12.66). None of the 11 000 sample express MALAT1 at an RPKM <10. In contrast, HOTAIR is expressed at very low levels (median log2 RPKM = 2.32) with an RPKM <10 in ~57% of the samples.
We found that measured and imputed MALAT1 expression were strongly correlated (R2 = 0.474, P = 9.23 × 10−93; Spearman’s Rho = 0.665, P < 2.2 × 10⁻¹⁶) in the colorectal cancer dataset (Figure 6A). In the comparison of normal and tumor samples, both measured (fold-change = 1.045, ANOVA P = 0.001), and imputed (fold-change = 1.521, ANOVA P = 6.28 × 10⁻⁵), conforming with the results previously reported in the literature.
Figure 6.

Preservation of differentially expressed cancer lncRNAs. (A) Scatter plots showing an association between standardized measured (RSEM) and imputed MALAT1 expression in TCGA colorectal cancer dataset. Boxplots indicate measured and imputed MALAT1 expression levels within normal and tumor samples. (B) Scatter plots showing an association between measured and imputed HOTAIR expression in TCGA colorectal cancer dataset. Boxplots show a comparison between measured and imputed HOTAIR expression in normal and tumor samples.
In case of HOTAIR, measured and imputed expression profiles were also correlated (R2 = 0.31, P = 2.2 × 10−54; Spearman’s Rho = 0.658, P < 2.2 × 10⁻¹⁶), but HOTAIR was actually not detected in a large proportion of measured samples with non-zero imputed expression (Figure 6B). Since HOTAIR is overexpressed in colorectal cancers, it would be reasonable to expect HOTAIR expression in most tumor samples. Comparing normal versus tumor samples, both measured (fold-change = 3.474, ANOVA P = 0.021) and imputed (fold-change = 30.834, ANOVA P = 4.98 × 10⁻⁸) data clearly reflected the differential expression pattern expected in colorectal cancer tumors.
Subsequently, we compared measured and imputed HOTAIR expression in normal and tumor samples from 20 additional cancer types. We found a significant difference (FDR < 0.05) between measured normal and tumor HOTAIR expression in <10% of the cancers (Supplementary Figure 3A). In contrast, nearly 40% of the imputed normal and tumor expression levels were statistically significant (Supplementary Figure 3B). It may be considered very surprising that imputed lncRNA expression is seemingly outperforming measured expression in re-capitulating a known phenotype. However, the low average abundance of HOTAIR lncRNA transcripts could have hindered recapturing these associations in the RNAseq data.
Implementation
The ability to utilize PCGs to impute lncRNA expression in uncharacterized samples can be a first step toward identifying new associations between lncRNAs and new phenotypes. However, it is important to consider a number of factors to ensure the accurate and reliable performance of our models. We have provided an R-package `LEXI’ available for download from https://osf.io/qdq5k/ [19]. This package functions as a convenient wrapper for performing the CV analyses and imputation steps outlined in Figure 1C using Random Forests.
Naturally, the most important factor in constructing imputation models is the quality of the training data. In terms of sample size, as shown in our simulations (Figure 5B), the majority of imputations were statistically significant when the number of input samples were at least 200. This number could be used as an empirical guideline in determining the suitability of training datasets. As outlined in Table 1, a vast majority of lncRNAs were detected at an RPKM <10 in all three datasets, a threshold that roughly equates to less than one copy of the transcript per cell [20]. At such low expression levels, it is important that reported lncRNA measurements accurately reflect the actual lncRNA expression. While, in most cases, users will not have a control over the quality of the available training data, performing CV analysis prior to imputing lncRNA in test samples will help determine which lncRNAs could be imputed accurately. This can be performed using the lexi_cv function in the package, which requires a training PCG and a training lncRNA dataset.
It is clear that the strength of correlation between the informative PCGs and the candidate lncRNA has a major impact on imputation accuracy. On average, our simulations indicated no significant gain in imputation performances beyond 100–150 input genes at the cost of increased computation time (Supplementary Figure 1A). Therefore, by default, the lexi_cv function calculates and utilizes the top 100 informative PCGs ranked by absolute correlation with the lncRNA. However, the user can modify this threshold, along with optional tuning parameters for Random Forests, to optimize the imputation model.
Once the lncRNAs with good CV accuracy are identified, the lexi function can be used to impute the expression levels of the candidate lncRNAs. This function requires a training PCG and lncRNA dataset along with the test PCG dataset. As mentioned above, the number of candidate informative PCGs along with other Random Forest parameters can be adjusted for the lexi function. By default, both lexi_cv and lexi functions require a minimum of 200 samples in the training dataset and the models can be built only using a common set of PCGs that were measured in both training and test datasets. However, there are no sample size requirements for the test dataset.
Discussion
Long non-coding RNAs are important for cellular gene expression regulation and pathogenesis of several human diseases including cancers, but the profiling of lncRNAs has remained challenging. As shown in this study, the ability to accurately impute lncRNAs transcriptome from PCGs could be a significant step toward improved estimation of lncRNAs expression and would enable the subsequent studies of the biological role of lncRNAs in various phenotypes. We presented an approach that constructs lncRNA imputation models using PCGs as predictive variables. Using RNAseq data of cancer cell lines from the gCSI dataset, human cancer tissue from PANCAN, and human normal tissue from GTEX, we demonstrated that our approach accurately recovers lncRNA profiles in these datasets. Furthermore, prediction models generated using gCSI data successfully imputed lncRNA profiles of PANCAN and GDSC datasets. This analysis also showed that our approach is applicable to cross-platform imputation, which is likely to be encountered in real-world scenarios.
Most existing gene expression imputation methods focus on completing expression matrices by predicting a few missing values per gene within a matrix [10, 21, 22], and have not been designed to impute expression levels of transcripts for all uncharacterized samples. To our knowledge, only one previous method attempted to impute gene expression in uncharacterized samples [23]. This method relied on expression Quantitative Trait Loci (eQTLs) to impute expression using a modified random forest (mixed-model random forest) approach. However, in the CV analysis of GTEx data, only 15% of the genes were imputed with correlation >0.3. Only a small fraction (4%) of the genes, with at least 10 eQTLs, achieved a median imputation correlation of 0.5. No other method has previously attempted to impute complete lncRNA transcriptome of multiple samples utilizing just their PCG profiles. While the current implementation of our method relies solely on PCG expression data, it would be worthwhile evaluating the improvement in performance of the models by integrating genomic data to identify potential lncRNA eQTLs along with PCG expression in future iterations.
Additionally, we evaluated various factors that may affect the accuracy of LEXI. The results from these analyses can serve as guidelines for future lncRNA imputation. We found that lncRNA imputation accuracy was strongly associated with the prevalence of lncRNA expression across samples, thus requiring high-quality training datasets wherein the lncRNA transcript of interest was profiled at sufficient depth. In addition, we found that providing a maximum possible number of candidate PCGs for generating prediction models generally improved accuracy, even though only a limited number of features were included in the actual model. These factors might also be the key for improving the performance of LEXI in future implementations. Clearly, the quality of training datasets is instrumental in determining the accuracy of imputation models. Thus, identifying reliable datasets for training models will be important for improving model performance. One possible workaround to increase the number of samples expressing lncRNAs of interest is to integrate or pool multiple high-quality expression datasets of related phenotypes. This may be a daunting task with a multitude of available approaches and ongoing debates about which methods work best for meta-analysis and batch corrections [24]. Adapting a suitable batch correction approach could also help in consistent recovery of the relationships between PCGs and lncRNAs in both training and test datasets by removing unwanted sources of variation in expression levels [25]. However, this should be performed carefully to ensure biologically relevant variations in expression are not lost in the process. As most current transcriptomic datasets were generated using unstranded poly-A enriched libraries that likely excluded several lncRNAs, future implementations will benefit training datasets with better lncRNA coverage to impute comprehensive lncRNA transcriptomes.
We further discuss a potential application of LEXI to identify differential expression patterns of cancer-related lncRNA. Our method recovered significant expression patterns of both MALAT1 and HOTAIR in TCGA colorectal adenocarcinoma dataset, thus corroborating the evidence in colon cancer literature. In our additional analysis with HOTAIR, we observed differential expression in both measured and imputed profiles of kidney cancer (chromophobe, clear cell, papillary cell carcinoma). Interestingly, an additional nine cancer types exhibited differential HOTAIR expression exclusively in the imputed dataset (Supplementary Figure 3). Indeed, literature-derived evidence support the association observed in the imputed data between HOTAIR and bladder urothelial carcinoma [26], colon adenocarcinoma [18], esophageal carcinoma [27], head & neck carcinoma [28, 29], hepatocellular carcinoma [30], non-small cell lung cancer [31], prostate adenocarcinoma [32] and uterine corpus endometrioid carcinoma [33]. It is not surprising that these associations were not captured in the measured data, at least in part owing to the low abundance of lncRNAs (in this case HOTAIR) in the dataset. Traditional throughput RNAseq aims to profile PCG would be insufficient to capture these low abundant lncRNA expression. Therefore, all literature listed above have utilized quantitative real-time PCR for targeted profiling for HOTAIR. On the other hand, LEXI leverages existing high-quality PCG expression data would allow imputation of lncRNA transcriptome expression with much higher accuracy. We anticipate that LEXI will be used for discovering new phenotypic associations for many key lncRNAs.
A significant number of transcriptomic studies in the past have been performed using microarray platforms that provide excellent insights into PCGs associated with different phenotypes. There are >10,000 microarray series cataloged in the NCBI Gene Expression Omnibus (GEO) database [34] and >47,000 microarray experiments cataloged in the ArrayExpress database [35], reflecting an enormous diversity of diseases and phenotypes. However, the majority of these microarrays datasets did not provide comprehensive coverage of lncRNAs. The application of LEXI can turn these datasets into potential goldmines of lncRNA profiles in order to decipher the role of lncRNA in a variety of phenotypes.
Methods
Datasets and processing
The gCSI dataset contained transcriptomic profiles of 675 cell lines [11]. Human cancer cell line gene RNAseq (RPKM) expression data were obtained from http://www.ebi.ac.uk/arrayexpress/experiments/E-MTAB-2706/. TCGA project gene expression data (version 2015.08.21) were retrieved from http://firebrowse.org/. RNAseq (RSEM) expression data for 31 individual cancer types were downloaded and combined into a unified `PANCAN’ dataset containing 11 101 unique samples.
GTEX RNAseq (RPKM, version V6P) expression data were downloaded from http://www.gtexportal.org/home/datasets. This dataset referred to as `GTEX’ contained data from 8555 normal tissue samples [12]. Genomics of Drug Sensitivity in Cancer (GDSC) cell line microarray data (Affymetrix U219, RMA normalized) were obtained from http://www.cancerrxgene.org/downloads. This dataset referred to as `GDSC’ contained data from 1001 cell lines [36].
PCGs and lncRNAs were re-annotated using the R/Bioconductor package biomaRt based on ENSEMBL biotype classification [37]. We filtered PCGs to retain only those genes with variance greater than zero. lncRNAs were filtered to exclude transcripts <200 nucleotides in length and transcripts with any of the following biotypes: protein coding, snoRNA, snRNA or scaRNA.
Evaluating imputation approaches
We tested popular machine learning and imputation algorithms, including k-NN regression, PCR, LASSO, Elastic Nets and Random Forests for implementation in the LEXI framework. The k-NN algorithm identifies k PCGs with minimum Euclidean distance, D, to the lncRNA of interest, p, in the training dataset. The distance is defined as  , where x represents each PCG. The average of k PCGs can be used to model expression y of the lncRNA,
  , where yi is the ith nearest neighbor in the dataset. We used k-NN regression implemented in the R-package ‘caret’ as a baseline algorithm for comparing the performance of different methods [38].
In its simplest form, the expression of lncRNA, Y, can be modeled using PCG matrix, X, by fitting a linear model of the form , where the residual can be obtained using least squares estimate,
 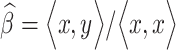 . The PCR approach essentially utilizes a linear combination from M principal components zm = Xvm, where v represents m principal component of the PCG matrix X. The coefficient for the model can then be expressed as
  , where
  .
.
LASSO and Elastic Nets respectively use L1 or a combination of L1 and L2 regularization penalties to fit a generalized linear model [39, 40]. The LASSO coefficient can be expressed in the form 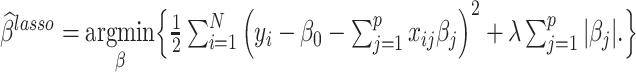
Where, λ is the penalty term or tuning parameter, which is first determined using CV in the training dataset. The penalty term in the case of Elastic Net assumes the general form of  , where 0 ≤ α ≤ 1 (α = 0 is the ridge penalty). In this implementation, we set α = 0.5. LASSO and Elastic Nets were implemented using the R-package ‘glmnet’ [41].
The Random Forest algorithm uses an ensemble of B regression trees constructed using a bootstrapped set of samples and randomly selected PCGs in the training set [42]. The regression equation for a point x can be expressed as 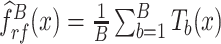 , where T represents a tree grown from the bootstrapped set of samples. This bagging approach averages several noisy but unbiased models, therefore requires less rigid assumptions about data structure. Random Forest was implemented using the R-package ‘randomForest’ [43]. We performed preliminary simulations for Random Forest tuning parameters using the gCSI dataset. Our simulations indicated optimal performance with the default number of variables available for splitting at each node (
 ). While model performances improved steadily with an increasing number of trees from 1 to 10, there were no noticeable changes in performance upon increasing the number of trees beyond 10. Thus, in our implementation, we used a static number of trees conservatively set at 100.
For the benchmark analysis, we used a repeated random sub-sampling approach for CV. We first selected the subset of lncRNAs that were expressed (RPKM ≥1) in at least 75% of the cell lines. For each lncRNA, we obtained a set of informative PCGs or genes with the highest absolute correlation with the lncRNA. This set of informative PCGs was used as input training set for k-NN regression and Random Forests. Since LASSO and Elastic Nets algorithms include a variable selection step, all PCGs were used as input for these two methods. For PCR, we used the first 2, 5, 10 or 15 principal components of the gCSI PCG dataset as predictors. We then randomly split the samples into training (90%) and test (10%) sets to calculate the performance of the algorithms averaged over five repeats. The performance of each method was benchmarked by calculating average PCC, root mean square error (RMSE) and a P-value of the correlation between measured and imputed expression levels of individual lncRNAs. For a detailed description of the metrics used for imputation performance analysis, see [10]. Additionally, we benchmarked computation time for each method on a single core (on a computer with 2.2 GHz Intel Core i7 processor and 16 GB RAM).
Determining factors influencing imputation accuracy
We deliberated the impact of various factors that may influence the imputation accuracy. We used the gCSI dataset to simulate the impact of sample size and number of PCGs, lncRNA transcript biotype, lncRNA transcript length, lncRNA expression variance and tissue type.
The simulations for the number of samples and PCGs used as input were performed on a random subset of 25 lncRNAs expressed (RPKM ≥1) in at least 75% of the samples. The CVs were performed on increasing numbers of samples or increasing numbers of input PCGs on the 25 lncRNAs. The outcome of both simulations was analyzed using linear regression analysis.
We further assessed the effects of transcript biotype, transcript length and variance in lncRNA expression levels on imputation accuracies on CV results from the subset of lncRNAs expressed in at least 75% of the samples. The transcript biotype and length information was retrieved from ENSEMBL using the R package biomaRt [37]. The results were analyzed using ANOVA followed by post-hoc analysis (Tukey’s HSD).
To assess the impact of including tissue type as a variable for constructing a predictive model, we repeated the CV analysis of the lncRNAs by adding tissue type as an additional variable with the informative PCGs subset. The results were analyzed by comparing average CV PCC from expression-derived and expression + tissue-derived prediction models, or case-by-case using linear regression analysis. In addition, we performed a CV analysis of tissue-specific lncRNAs. The tissue specificity of candidate lncRNAs was empirically determined based on expression levels in gCSI dataset. We identified lncRNAs that were expressed in at least 95% of the samples grouped by tissue type. From this list of lncRNAs per tissue, we excluded all those lncRNAs that were also expressed in 75% of the total dataset. For this analysis, we chose lung, lymphoid, breast and colorectal tissues as these are the most common tissue types in the gCSI dataset.
Applying imputation models to secondary datasets
This section describes the main application of the LEXI framework. We trained predictive models on the gCSI dataset and predicted lncRNA expression profiles in two secondary datasets—RNAseq data from PANCAN and microarray data from GDSC. For the GDSC application, we selected the cell lines that overlapped with gCSI. This was done to facilitate comparison of lncRNA expression levels imputed using GDSC microarray PCG profiles with the gCSI RNAseq-measured lncRNA expression levels. The 1st step of LEXI selected a subset of PCGs and lncRNAs that were common between gCSI and the secondary datasets and then standardized each dataset (mean = 0, standard deviation = 1). Next, an informative PCG subset was derived for each lncRNA by selecting the top 100 PCGs ranked by absolute PCCs. A random forest regression model was trained using informative PCGs as predictors and measured lncRNA expression as an outcome. Finally, the model was applied to the test set of PCGs from PANCAN or GDSC to derive the imputed lncRNA expression levels. To assess the accuracy of imputation, we compared the PCC and P-value of correlation test between imputed and measured lncRNA levels, and imputation times in lncRNA subset expressed in 75% of the gCSI cell lines and all lncRNAs.
Examining differentially expressed cancer-associated lncRNAs
We imputed the expression profile of MALAT1 and HOTAIR in TCGA colorectal adenocarcinoma dataset using gCSI as training data, and compared performance using linear regression. To examine whether differential expression status of the lncRNAs was maintained in imputed data, we compared expression levels in solid normal tissue and primary tumors using ANOVA.
We examined the distribution of HOTAIR in an additional 20 TCGA cancer types with solid normal tissue and primary tumor using ANOVA. The remaining cancer types were excluded from the ANOVA analysis if either sample type was missing in the respective dataset (Supplementary Figure 3)
Availability of data
The LEXI package for R, along with instructions for downloading example datasets and use, is available at https://osf.io/qdq5k/ [19]. All datasets used in this study are publicly available and listed under methods.
List of abbreviations
ANOVA: Analysis of Variance
CV: Cross-Validation
eQTL: expression Quantitative Trait Loci
FDR: False Discovery Rate
gCSI: Genentech Cell lines Screening Initiative
GDSC: Genomics of Drug Sensitivity in Cancer
GTEX: Genotype-Tissue Expression
k-NN: k-Nearest Neighbor
LEXI: LncRNA Expression Imputation
LncRNA: Long non-coding RNA
PANCAN: Pan-Cancer
PCC: Pearson’s Correlation Coefficient
PCG: Protein-Coding Gene
PCR: Principal Components Regression
RPKM: Reads Per Kilobase of transcript, per Million mapped reads
TCGA: The Cancer Genome Atlas
Supplementary Material
Aritro Nath has a PhD in Genetics and is a postdoctoral fellow in the Department of Experimental and Clinical Pharmacology at the University of Minnesota. His research interests include bioinformatics and cancer pharmacogenomics.
Paul Geeleher has a Ph.D. in Bioinformatics and is a postdoctoral fellow in the Department of Medicine at the University of Chicago. His research interests include computational biology, cancer genomics and pharmacogenomics.
R. Stephanie Huang is an associate professor in the Department of Experimental and Clinical Pharmacology at the University of Minnesota. Her research interests include bioinformatics and translational pharmacogenomics of anti-cancer agents.
Key Points
LncRNAs are important regulators of gene expression and influence various phenotypes such as cancer.
Unlike protein coding-genes, most currently available public transcriptomic datasets lack comprehensive lncRNA profiles.
We demonstrate machine learning tools can be implemented in a LEXI framework to profile lncRNA using only PCGs in uncharacterized samples.
We show antisense lncRNAs are imputed with higher accuracy than other biotypes, and that tissue types do not influence the ability to impute lncRNA expression.
The LEXI package for R (https://osf.io/qdq5k/) is a convenient tool to implement lncRNA CV analysis and imputation in uncharacterized samples.
Funding
NIH/NCI (grant 1R01CA204856-01A1 and grant R21 CA139278 to R.S.H.), Avon Foundation for Women (to R.S.H.), NIH/NIGMS (grant K08GM089941and grant UO1GM61393 to R.S.H.), Circle of Service Foundation Early Career Investigator award (to R.S.H.) and Chicago Biomedical Consortium (grant PDR-020 to P.G.). The funding agencies did not participate in the design of the study, nor do they have any influence on the collection, analysis, and interpretation of data or in writing the manuscript.
References
- 1. Prensner JR, Chinnaiyan AM. The emergence of lncRNAs in cancer biology. Cancer Discov, 2011;1:391–407. [DOI] [PMC free article] [PubMed] [Google Scholar]
- 2. Guttman M, Amit I, Garber M, et al. Chromatin signature reveals over a thousand highly conserved large non-coding RNAs in mammals. Nature 2009;458:223–227. [DOI] [PMC free article] [PubMed] [Google Scholar]
- 3. Zhou C, Wu Y-L, Chen G, et al. Erlotinib versus chemotherapy as first-line treatment for patients with advanced EGFR mutation-positive non-small-cell lung cancer (OPTIMAL, CTONG-0802): a multicentre, open-label, randomised, phase 3 study. Lancet Oncol 2011;12:735–742. [DOI] [PubMed] [Google Scholar]
- 4. Fang Y, Fullwood MJ. Roles, functions, and mechanisms of long non-coding RNAs in cancer. Genomics Proteomics Bioinformatics 2016;14:42–54. [DOI] [PMC free article] [PubMed] [Google Scholar]
- 5. Huarte M. The emerging role of lncRNAs in cancer. Nat Med 2015;21:1253–1261. [DOI] [PubMed] [Google Scholar]
- 6. Cabili MN, Dunagin MC, McClanahan PD, et al. Localization and abundance analysis of human lncRNAs at single-cell and single-molecule resolution. Genome Biol 2015;16:20. [DOI] [PMC free article] [PubMed] [Google Scholar]
- 7. Ashouri A, Sayin VI, Van den Eynden J, et al. Pan-cancer transcriptomic analysis associates long non-coding RNAs with key mutational driver events. Nat Commun 2016;7:13197. [DOI] [PMC free article] [PubMed] [Google Scholar]
- 8. Lüder Ripoli F, Mohr A, Conradine Hammer S, et al. A comparison of fresh frozen vs. formalin-fixed, paraffin-embedded specimens of canine mammary tumors via branched-DNA assay. Int J Mol Sci 2016;17:724. [DOI] [PMC free article] [PubMed] [Google Scholar]
- 9. Wang Z, Gerstein M, Snyder M. RNA-Seq: a revolutionary tool for transcriptomics. Nat Rev Genet 2009;10:57–63. [DOI] [PMC free article] [PubMed] [Google Scholar]
- 10. Liew AWC, Law NF, Yan H. Missing value imputation for gene expression data: computational techniques to recover missing data from available information. Brief Bioinform 2010;12:498–513. [DOI] [PubMed] [Google Scholar]
- 11. Klijn C, Durinck S, Stawiski EW, et al. A comprehensive transcriptional portrait of human cancer cell lines. Nat Biotechnol 2014;33:306–312. [DOI] [PubMed] [Google Scholar]
- 12. Ardlie KG, Deluca DS, Segre AV, et al. The Genotype-Tissue Expression (GTEx) pilot analysis: multitissue gene regulation in humans. Science 2015;348:648–660. [DOI] [PMC free article] [PubMed] [Google Scholar]
- 13. Chang K, Creighton CJ, Davis C, et al. The Cancer Genome Atlas Pan-Cancer analysis project. Nat Genet 2013;45:1113–1120. [DOI] [PMC free article] [PubMed] [Google Scholar]
- 14. Cabili MN, Trapnell C, Goff L, et al. Integrative annotation of human large intergenic noncoding RNAs reveals global properties and specific subclasses. Genes Dev 2011;25:1915–1927. [DOI] [PMC free article] [PubMed] [Google Scholar]
- 15. Ji P, Diederichs S, Wang W, et al. MALAT-1, a novel noncoding RNA, and thymosin β4 predict metastasis and survival in early-stage non-small cell lung cancer. Oncogene 2003;22:8031–8041. [DOI] [PubMed] [Google Scholar]
- 16. Li Z. MALAT-1: A long non-coding RNA and its important 3′ end functional motif in colorectal cancer metastasis. Int J Oncol 2011;39:169–75. [DOI] [PubMed] [Google Scholar]
- 17. Rinn JL, Kertesz M, Wang JK, et al. Functional demarcation of active and silent chromatin domains in human HOX loci by noncoding RNAs. Cell 2007;129:1311–1323. [DOI] [PMC free article] [PubMed] [Google Scholar]
- 18. Kogo R, Shimamura T, Mimori K, et al. Long noncoding RNA HOTAIR regulates polycomb-dependent chromatin modification and is associated with poor prognosis in colorectal cancers. Cancer Res 2011;71:6320–6326. [DOI] [PubMed] [Google Scholar]
- 19. Nath ALEXI. long non-coding RNA expression imputation. https://osf.io/qdq5k/. [Google Scholar]
- 20. Marinov GK, Williams BA, McCue K, et al. From single-cell to cell-pool transcriptomes: stochasticity in gene expression and RNA splicing. Genome Res 2014;24:496–510. [DOI] [PMC free article] [PubMed] [Google Scholar]
- 21. Troyanskaya O, Cantor M, Sherlock G, et al. Missing value estimation methods for DNA microarrays. Bioinformatics 2001;17:520–525. [DOI] [PubMed] [Google Scholar]
- 22. Hastie T, Tibshirani R, Sherlock G, et al. Imputing missing data for gene expression arrays In: Stanford University Statistics Department Technical report, 1999.
- 23. Wang J, Gamazon Eric R, Pierce Brandon L, et al. Imputing gene expression in uncollected tissues within and beyond GTEx. Am J Hum Genet 2016;98:697–708. [DOI] [PMC free article] [PubMed] [Google Scholar]
- 24. Lazar C, Meganck S, Taminau J, et al. Batch effect removal methods for microarray gene expression data integration: a survey. Brief Bioinform 2013;14:469–490. [DOI] [PubMed] [Google Scholar]
- 25. Risso D, Ngai J, Speed TP, et al. Normalization of RNA-seq data using factor analysis of control genes or samples. Nat Biotechnol 2014;32:896–902. [DOI] [PMC free article] [PubMed] [Google Scholar]
- 26. Yan T-H, Lu S-W, Huang Y-Q, et al. Upregulation of the long noncoding RNA HOTAIR predicts recurrence in stage Ta/T1 bladder cancer. Tumor Biol 2014;35:10249–10257. [DOI] [PubMed] [Google Scholar]
- 27. Aziz SA, Lv X-B, Lian G-Y, et al. Long noncoding RNA HOTAIR is a prognostic marker for esophageal squamous cell carcinoma progression and survival. PLoS One 2013;8:e63516. [DOI] [PMC free article] [PubMed] [Google Scholar]
- 28. Li D, Feng J, Wu T, et al. Long intergenic noncoding RNA HOTAIR is overexpressed and regulates PTEN methylation in laryngeal squamous cell carcinoma. Am J Pathol 2013;182:64–70. [DOI] [PubMed] [Google Scholar]
- 29. Nie Y, Liu X, Qu S, et al. Long non-coding RNAHOTAIRis an independent prognostic marker for nasopharyngeal carcinoma progression and survival. Cancer Sci 2013;104:458–464. [DOI] [PMC free article] [PubMed] [Google Scholar]
- 30. Yang Z, Zhou L, Wu L-M, et al. Overexpression of long non-coding RNA HOTAIR predicts tumor recurrence in hepatocellular carcinoma patients following liver transplantation. Ann Surg Oncol 2011;18:1243–1250. [DOI] [PubMed] [Google Scholar]
- 31. Liu X-h, Z-L L, Sun M, et al. The long non-coding RNA HOTAIR indicates a poor prognosis and promotes metastasis in non-small cell lung cancer. BMC Cancer 2013;13:464. [DOI] [PMC free article] [PubMed] [Google Scholar]
- 32. Zhang A, Zhao Jonathan C, Kim J, et al. LncRNA HOTAIR enhances the androgen-receptor-mediated transcriptional program and drives castration-resistant prostate cancer. Cell Rep 2015;13:209–221. [DOI] [PMC free article] [PubMed] [Google Scholar]
- 33. He X, Bao W, Li X, et al. The long non-coding RNA HOTAIR is upregulated in endometrial carcinoma and correlates with poor prognosis. Int J Mol Med 2014;33:325–332. [DOI] [PubMed] [Google Scholar]
- 34. Barrett T, Wilhite SE, Ledoux P, et al. NCBI GEO: archive for functional genomics data sets—update. Nucleic Acids Res 2012;41:D991–D995. [DOI] [PMC free article] [PubMed] [Google Scholar]
- 35. Kolesnikov N, Hastings E, Keays M, et al. ArrayExpress update—simplifying data submissions. Nucleic Acids Res 2014;43:D1113–D1116. [DOI] [PMC free article] [PubMed] [Google Scholar]
- 36. Iorio F, Knijnenburg Theo A, Vis Daniel J, et al. A landscape of pharmacogenomic interactions in cancer. Cell 2016;166:740–754. [DOI] [PMC free article] [PubMed] [Google Scholar]
- 37. Durinck S, Spellman PT, Birney E, et al. Mapping identifiers for the integration of genomic datasets with the R/Bioconductor package biomaRt. Nat Protoc 2009;4:1184–1191. [DOI] [PMC free article] [PubMed] [Google Scholar]
- 38. Kuhn M. Building predictive models in R using the caret package. J Stat Softw 2008;28:1–26.27774042 [Google Scholar]
- 39. Tibshirani R. Regression shrinkage and selection via the Lasso. J R Stat Soc Ser B Methodol 1996;58:267–288. [Google Scholar]
- 40. Zou H, Hastie T. Regularization and variable selection via the elastic net. J R Stat Soc Ser B Stat Methodol 2005;67:301–320. [Google Scholar]
- 41. Friedman J, Hastie T, Tibshirani R. Regularization paths for generalized linear models via coordinate descent. J Stat Softw 2010;33:1–22. [PMC free article] [PubMed] [Google Scholar]
- 42. Breiman L. Random forests. Mach Learn 2001;45:5–32. [Google Scholar]
- 43. Liaw A, Wiener M. Classification and regression by randomForest. R News 2002;2:18–22. [Google Scholar]
Associated Data
This section collects any data citations, data availability statements, or supplementary materials included in this article.
Supplementary Materials
Data Availability Statement
The LEXI package for R, along with instructions for downloading example datasets and use, is available at https://osf.io/qdq5k/ [19]. All datasets used in this study are publicly available and listed under methods.