

Abstract
Per- and poly-fluorinated alkyl substances (PFASs) are a large group of synthetic surfactant chemicals with widespread uses in food packaging and textile manufacturing and as the main constituent of aqueous film-forming firefighting foams. PFASs are highly persistent in the environment, and human exposures are extensive with these chemicals detectable in the blood of almost all adult Americans. PFASs exhibit a range of toxic effects in preclinical models. In humans, PFAS exposure has been associated with lower birth weights, decreased immune responses, cancer and impaired fertility and elevated circulating cholesterol levels. We have developed a sensitive high-throughput method for quantification of representative PFAS in human serum and plasma for biomonitoring and epidemiological studies of human health effects of PFAS exposure. The method combines robust and reproducible 96-well plate format sample preparation with ultra-performance liquid chromatography–tandem mass spectrometry. The method was developed, validated and used for targeted measurements of eight short-/long-chain PFAS analytes in human serum. Targeted analytes were measured in 50 microliters of sample using mass-labeled internal standards. Mean spiked recoveries (n = 10) of target analytes for three tiers quality control (QC-low, QC-medium, QC-high) samples ranged from 70 to 127% with 2–14% relative standard deviation (RSD). The average spiked recoveries (n = 10) of surrogates were 79–115% with 8–12% RSD for QC-low, 90–123% with 7–12% RSD for QC-medium and 82–114% with 9–15% RSD for QC-high. The limit of detection for the target compounds was 0.05–0.04 ng/mL. The method was used to reveal regional differences in PFAS exposures in Kentucky residents receiving care at the University of Kentucky Hospitals.
Introduction
Exposure to toxic environmental chemicals contributes to inter-individual differences in risk of many non-communicable diseases (1). Robust analytical methods are needed to monitor human exposure to these chemicals for epidemiological and risk assessment studies (2). Per- and poly-fluorinated alkyl substances (PFASs) are man-made surfactant chemicals with extensive uses in food packaging, to make fabrics stain- and water-resistant and in firefighting foams (3). The estimated global annual production of PFAS in 2000 was 4,650 metric tons (4). PFASs are highly persistent in the environment. PFAS exposure in humans is widespread with groundwater contamination from manufacturing and firefighting use, leading to drinking water contamination as one major route of exposure (5). Other exposures may be due to PFAS contamination in foods as a result of soil and groundwater contamination and from food packaging and food exposure to equipment that contains PFAS. Concentrations of PFAS in various environmental systems range from pg/L to mg/L (6,7). Environmental PFAS pose a global health risk with human exposure linked to the physiochemical properties of these compounds, particularly the length of the fluorinated carbon chain (8–11). These chemicals are persistent in the body, so low levels of exposure can lead to significant body burdens over time (12). PFASs are a broad class of chemicals with more than 3,000 individual Chemical Abstract Service (CAS) entries (13). Human exposure to two common PFAS, perfluorooctanoic acid (PFOA) and perfluorooctane sulfonate (PFOS), is common; although manufacturing of these specific PFASs has been discontinued in the USA, they have been supplanted by newer fluoropolymer compounds including those produced by the so-called GenX chemical process. Exposure to these newer compounds has been less well-characterized. As a result of widespread exposures and persistence in the body of exposed individuals, PFOA, PFOS and some other PFAS can be detected in the blood of essentially all adult Americans (14). This exposure is a concern because in in vitro and preclinical studies, PFAS exhibit a range of toxic effects. In humans, PFAS exposures have been associated with changes in hormones, decreased immune responses and risk of developmental disorders, cancer and cardiovascular diseases (15,16). The latter of these is particularly interesting because some studies have observed that elevated circulating levels of certain PFAS are associated with increased circulating levels of cholesterol and triglycerides that are an established risk factor for coronary artery disease (14,16,17). The Environmental Protection Agency (EPA) has published health advisories for PFOA and PFOS in drinking water. Monitoring of PFOA, PFOS and some additional PFAS in drinking water is mandated by many states. The EPA has developed an analytical method (EPA method 537) that has been widely used for measurements of PFOA, PFOS and other PFAS in drinking water (15,18). However, although measurements of PFAS in human biofluids have been reported using adaptations of EPA method 537, the analytical methods have not been standardized and the reported sample preparation methods are often cumbersome, not well suited to analysis of large batches of samples and lack the sensitivity needed to measure these chemicals in small sample volumes (12,19–22). The method described here was developed and validated to enable large-scale, high-throughput sensitive measurements of PFAS in small volumes of human serum and plasma to support biomonitoring and epidemiological studies of exposed populations.
Experimental
Solvents and standard chemicals
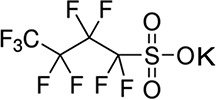
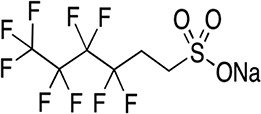
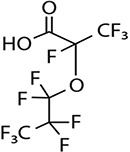
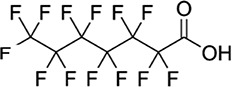
High Performance Liquid Chromatography (HPLC) grade methanol (≥99.9%) and crystalline HPLC grade ammonium acetate (≥98.1) were purchased from Fisher Scientific, USA. Ultra-nanopure water was provided by our laboratory Milli Q water system. Highest grade/purity available of individual target analyte, PFOS (>98%), PFOA (>98%), perfluorononanoic acid (PFNA, >98%), perfluorohexane sulfonate (PFHxS, >98%), perfluoroheptanoic acid (PFHpA, >98%), perfluorobutane sulfonates (PFBS, >98%), hexafluoropropylene oxide dimer acid [2,3,3,3-tetrafluoro-2-(1,1,2,2,3,3,3-heptafluoropropanioc acid) GenX (HFPO-DA, >98%)], sodium 1H, 1H, 2H, 2H-PFHxS (4:2 FTS, >98%), surrogate standards (SS) 13C4–PFOA (PFOAL, >98%), 13C5–PFNA (PFNAL, >98%), 13C4–PFOS (PFOSL, >98%), 13C2–4:2 FTS (FTSL, >98%) and internal standard (IS) 13C4–PFHpA (>98%), were purchased from Wellington Laboratories, Guelph, Ontario, Canada. The structures, molecular formulae, CAS nomenclature molecular weights and structures of these compounds are shown in Table I.
Table I.
Name, CAS Number, Classification, Use, RT, Molecular Structure, Formula and Molar Mass of the Targeted PFAS Compounds
| Analytes/RT (min) | Case number/classification | Use | Molecular structure | Chemical formula/molar mass |
|---|---|---|---|---|
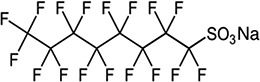
| PFBS/3.51 | 29420-49-3/short-chain | Surfactants | C4F9SO3K/338.19 | |
|
|
||||
| 4:2 FTS/4.75 | Not available/short-chain | Teflon, nonstick surface coatings | C6H4F9SO3Na/350.13 | |
|
|
C6H4F9SO3Na/350.13 | |||
| GenX (HEPO-DA)/5.40 | 13252-13-6/short-chain | Food packaging, paints, cleaning product, etc. | C6HF11O3/330.05 | |
|
|
||||
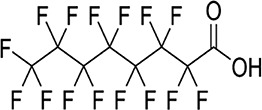
| PFHpA/6.23 | 375-85-9/long-chain | Emulsifiers, wetting agents, commercial surfactants | C7HF13O2/364.06 | |
|
|
||||
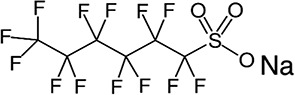
| PFHxS/6.28 | 82382-12-5/long-chain | Electrical wire casing, plumbing thread seal tape, etc. | C6F13SO3Na/422.10 | |
|
|
||||
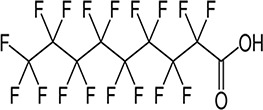
| PFOA/7.22 | 335-67-1/long-chain | Nonstick coating additives | C8HF15O2/414.07 | |
|
|
||||
| PFOS/7.95 | 4021-47-0/long-chain | Nonstick coating additives | C8F17SO3Na/522.11 | |
|
|
||||
| PFNA/7.97 | 375-95-1/long-chain | Fire and chemical resistant agents | C9HF17O2/464.08 | |
|
|
Sample collection and storage
To validate the analytical method, 100 de-identified plasma samples were obtained from the University of Kentucky Center for Clinical and Translational Sciences (CCTS) Biospecimens Core Biobank. Subjects were selected from four different regions of the State of Kentucky. Subjects were males and females ranging in ages from 17 to 80 years. All samples were stored at −80°C prior to extraction. The study was approved by the institutional review board of the Lexington Veterans Affairs Medical Center.
Extraction of human serum/plasma and QC samples
To extract PFAS compounds from human serum/plasma samples, 96-well Impact Protein Precipitation Plate (Phenomenex, CA, USA) were used. An amount of 50 μL of plasma/serum was added to each well of the Impact Protein Precipitation Plate followed by 100 μL of ice-cold methanol. Known concentrations of 13C isotope labeled PFAS compounds (PFOSL, PFOAL, PFNAL and FTSL) were added from stock solutions before extraction in each well of the plate. The plate was then shaken gently for 2 min and then centrifuged at 475 x g for 5 min at 4oC to transfer the extraction solvent into the collection plate. The solvent was collected and evaporated to dryness under stream of nitrogen using a Turbo Vap (Biotage Inc). The dried extract was reconstituted in 300 μL of 20 mM ammonium acetate that contained 3.0 ng/mL of 13C4–PFHpA as IS. Each extraction plate contained reagent blank (R-BLK), IS-blank and three levels of QC samples: QC-low, QC-medium and QC-high. Target analyte concentrations and QC performance of the method were determined using isotope-labeled IS-based calibration curves.
UHPLC-MS/MS analysis
A benchtop binary Shimadzu ultra-performance liquid chromatography (UPLC; model: Nexra X2 LC 30 AD) equipped with Nexra X2-SIL 30 AC autosampler that was interfaced with a Sciex QTRAP mass spectrometer (MS; model: Sciex 6500 plus) was used. The standard injection volume was 5.0 μL. All compounds were separated using a gradient elution of mobile phase containing 20 mM ammonium acetate in pure water (A) and methanol (B) employed with a Waters Atlantis T3 3 μm (50 mm length × 2.1 mm ID) analytical column at a constant flow rate of 0.2 mL/min with setting column oven temperature at 35°C. An 11.51-min gradient with composition of B was started 40% at 0.01 min, 65% at 6 min, 90% at 10 min, 95% at 11.5 min and 40% at 11.51 min. The equilibration time was 2 min. To establish the MS method known concentrations (10–50 ng/mL) of target analytes, SS and IS were infused individually into the ion source of the QTRAP MS at a flow rate of 10 μL/min. All data were collected in negative multiple reaction monitoring (MRM) mode. The quantitation and qualifier ions of the SS, IS and target analytes were chosen based on the highest mass signals and their retention times (RTs) are presented in Table II. Additional instrumental parameters were established using the automatic tuning feature of the instrument held constant in the operation of the MS: Negative ESI mode; ion spray voltage, 4,500 volts; temperature, 300°C; nitrogen gas pressure as curtain (CUR), 30 psi; collision (CAD), low; ion source (GS1), 30 psi; GS2, 30 psi. Data were collected/processed using AB Sciex Analyst software version 1.7/Multiquant version 3.02. Instrument parameters and details of target ions are shown in Table II. Figure 1 shows an extracted ion chromatogram for all of the target compounds monitored in this assay procedure.
Table II.
Parent and Product Ions and MS Ion Source and Instrument Settings for Target Analytes, Surrogates and Internal Standards
| Compounds | Parent ions | DP, volts | Quan ion (m/z) | Quan ion CE, volts | Quan ion CXP, volts | Qual ions (m/z) | Qual ion CE, volts | Qual ion CXP, volts |
|---|---|---|---|---|---|---|---|---|
| Short-chain | ||||||||
| PFBS | 298.814 | −40 | 79.9 | −66 | −35 | 98.9 | −36 | −11 |
| 4.2 FTS | 326.868 | −45 | 306.9 | −28 | −35 | 80.9 | −60 | −35 |
| GenX | 328.882 | −5 | 285 | −6 | −19 | 168.9 | −18 | −19 |
| Long-chain | ||||||||
| PFHpA | 362.914 | −55 | 318.7 | −8 | −9 | 168.7 | −24 | −17 |
| PFHxS | 398.886 | −80 | 79.9 | −72 | −1 | 98.9 | −56 | −7 |
| PFOA | 412.912 | −50 | 368.7 | −14 | −9 | 168.7 | −26 | −9 |
| PFOS | 498.88 | −100 | 79.9 | −98 | −1 | 98.8 | −80 | −17 |
| PFNA | 462.938 | −55 | 418.8 | −16 | −17 | 168.8 | −30 | −9 |
| Surrogates | ||||||||
| FTSL | 328.88 | −35 | 308.9 | −28 | −35 | 79.8 | −80 | −19 |
| PFOAL | 416.946 | −55 | 371.9 | −14 | −15 | 171.7 | −30 | −15 |
| PFOSL | 502.93 | −115 | 79.8 | −92 | −1 | 98.8 | −70 | −17 |
| PFNAL | 467.975 | −55 | 422.8 | −14 | −13 | 218.7 | −24 | −13 |
| IS | ||||||||
| PFHpAL | 366.897 | −60 | 321.7 | −16 | −7 | 171.6 | −24 | −9 |
Operation mode: negative; ion spray voltage, −4,500 volts; temperature, 300°C.
DP indicates declustering potential; CE, collision energy; CXP, collision cell exit potential.
Data acquisition time, 10 min; dwell time, 2 msec; EP, 10 volts; collect delay, 60 sec.
Gasses: CUR, 30 psi; CAD, low; GS1, 30 psi; GS2, 30 psi.
Figure 1.
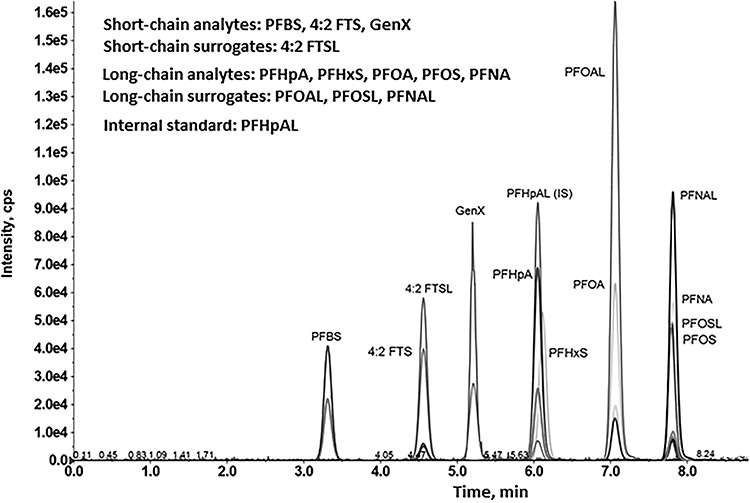
UPLC separation and detection of selected PFAS. Extracted ion chromatogram showing separation and detection of short- and long-chain PFAS-target analytes, surrogates and IS. Details of the UHPLC method and instrument operating parameters are detailed in the Experimental section and summarized in Table II.
Recovery and limit of detection study.
In QC sample preparation, three tiers of QC samples, i.e., QC-low, QC-medium and QC-high, were prepared spiking with three different levels of standard target analytes and SS (Table III). The QC spiking concentrations were within the lowest to the highest calibration points of linear dynamic range (LDR). In the case of limit of detection (LOD) of target analytes, a separate standard sample mixture was prepared at a lower level of calibration level and injected multiple times. LOD was determined based on signal to noise (S/N) ratio of the response of individual target analyte ion and noise immediately preceding and after the peaks using Analyst software S/N calculation protocol.
Table III.
Analytical Performance Linear Dynamic Calibration Range, LODs, QC Recoveries (n = 10), CCV Recoveries (n = 10) of PFAS
| Compounds | LDR, ng/mL | LOD, ng/mL | Spikea1 (ng/mL) | QC-low ±RSD (%) | QC-med a2 ± RSD (%) | QC-high a3 ± RSD (%) |
|---|---|---|---|---|---|---|
| Short-chain | ||||||
| PFBS | 0.2–16.0 | 0.05 | 0.64 | 71.3 ± 5.5 | 86.4 ± 12.0 | 78.2 ± 6.4 |
| GenX | 0.2–16.0 | 0.05 | 0.64 | 72.7 ± 5.6 | 81.8 ± 9.3 | 75.3 ± 6.3 |
| 4.2 FTS | 0.2–16.0 | 0.05 | 0.64 | 70.0 ± 12.2 | 89.0 ± 12.6 | 82.7 ± 7.6 |
| Long-chain | ||||||
| PFHpA | 0.15–12.0 | 0.05 | 0.48 | 72.5 ± 6.8 | 89.2 ± 10.5 | 78.8 ± 6.4 |
| PFHxS | 0.6–48.0 | 0.20 | 1.92 | 75.1 ± 9.3 | 85.3 ± 6.2 | 75.3 ± 3.6 |
| PFOA | 0.1–8.0 | 0.04 | 0.32 | 78.1 ± 10.6 | 88.8 ± 11.3 | 82.5 ± 3.6 |
| PFOS | 0.8–64 | 0.20 | 2.56 | 117.0 ± 10.9 | 127.0 ± 1.7 | 124.6 ± 3.2 |
| PFNA | 0.1–8.0 | 0.04 | 0.32 | 89.0 ± 9.4 | 103.8 ± 13.5 | 84.5 ± 7.6 |
| Surrogates | ||||||
| FTSL | 0.3–24.0 | NM | 1.0 | 78.9 ± 7.9 | 89.9 ± 12.1 | 82.5 ± 15.2 |
| PFOAL | 0.2–16.0 | NM | 0.64 | 82.5 ± 11.3 | 97.4 ± 10.9 | 84.7 ± 10.7 |
| PFOSL | 1.0–80.0 | NM | 3.2 | 115.8 ± 11.6 | 122.6 ± 7.8 | 114.1 ± 9.6 |
| PFNAL | 0.2–16.0 | NM | 0.64 | 87.4 ± 12.3 | 105.1 ± 6.8 | 83.6 ± 8.7 |
LODs were calculated at S/N = ~ 3 to 4 for all compounds.
a1 spiking conc for QC-low, a2 = 4 × QC-low, a3 = 3.75 × QC-med.
aCCV with target analytes, surrogates at mid-conc levels.
QC/quality assurance, calibration curve and calibration verification
Seven-point standard calibration standard samples were prepared containing known concentrations of standards and surrogates. This was accomplished using a mixture of standards and surrogate compounds including isotopic-mass-labeled internal standards. The integrated peak area data obtained were used to generate IS-based linear unweighted regression plots, forced through the origin for each analyte and surrogate. Correlation coefficients (R2) exceeded 0.9991 for all compounds. A separate continuous calibration verification (CCV) sample was prepared with standards and surrogates following the US EPA method 537 procedure, with a concentration at the mid-level calibration point, and injected to check the calibration curves and recovery of surrogates within each sample batch. These CCV standards were analyzed using calibration curves before the beginning analysis of data from each batch of clinical sample extracts. Although EPA-method-537-approved CCV acceptance criteria are 70–130% surrogate recovery (23), in our present study, CCV surrogate recoveries were between 75 and 125%. When CCV surrogate recovery was <70% or >130%, the problem was addressed and the sample batch was reanalyzed. For each sample batch, samples were analyzed in the order of solvent blank, IS-blank, calibration standards, CCV samples, solvent blank, QC samples, sample batch plate extracts, CCV and solvent blank. Before processing the clinical sample data, CCV standards that bracketed the sample extract were verified to conform acceptance with our established criteria. When RT shifting for target analytes/SS/IS or peak shape changes was observed leading to quantification or automatic peak integration/identification issues, then analytical column was replaced and then re-run the calibration levels and reanalyzed the sample samples. In all extracts, the SS and IS were included. Target compounds were not detected in R-BLK and IS-blank.
Results and Discussion
For analysis of PFAS in human serum, we used a reversed-phase UPLC gradient elution procedure with 96-well plate extraction with evaporative pre-concentration, reconstitution prior to sample injection. The instrument was operated in selected ion-monitoring mode and data processed to generate integrated peak areas for the target analytes. Quantification was accomplished using unweighted isotope-mass-labeled-IS calibration plots. QC recovery studies, CCV and control samples including R-BLK and IS-blank were monitored to ensure assay performance was within our established parameters. Control samples were injected into ultra-performance liquid chromatography–tandem mass spectrometry (UPLC-MS/MS) system prior to serum extracts or spiked standards and did not exhibit any carryover or matrix interference that needed to be addressed separately in this investigation. Thus, in this study, the target PFAS compounds detected in serum extracts were therefore assumed to be derived from the human clinical samples. More detailed information associated with method development and analytical methods are described in the preceding sections of this manuscript.
Analytical method performance
The performance of UPLC-MS/MS method was evaluated and validated by evaluating recovery of analytes in the CVV, QC samples, blank (R-BLK) and determination of LODs for the target analytes and surrogates. The QC samples were consisted of QC-low, QC-medium and QC-high. The control R-BLK did not contain targeted PFAS compounds or CCV standards. Table III illustrates the analytical method performance displaying with LDR, LODs, spiking concentrations that provided the three-layer QC samples and CCV and R-BLK recovery data with relative standard deviation (RSD). The average spike recoveries (n = 10) ranged from 70 to 117% with 6–12% RSD for QC-low, 82–127% with 2–14% RSD for QC-medium, 75–125% with 3–8% RSD for QC-high for targeted compounds. The mean spike recoveries of surrogates were in the range of 79–115% with 8–12% RSD for QC-low, 90–123% with 7–12% RSD for QC-medium, 82–114% with 9–15% RSD for QC-high, 79–122% with 8–13% RSD for R-BLK. The spiked concentrations of QC-medium and R-BLK were same. Thus, similar recoveries of surrogates were expected and obtained (Table III). The average CCV recoveries ranged from 80 to 112% with 8–12% RSD for all targeted PFAS analytes and 84–112% with 6–15% RSD for all surrogates. Four surrogates chosen from the targeted analytes list were found an excellent agreement of recoveries between the target analytes and their respective surrogates (Table III). Recently, Harrington and colleagues reported recoveries of target PFAS analytes ranged from 83.7 to 103% with RSD of ≤ 14% and surrogates from 88.1 to 103% with RSD of ≤ 9.0% using a solvent precipitation method, and our recovery studies compared well with their reported values (24). The LODs of the target compounds have been measured at S/N = ~ 3 to 4 against blank/background noise level. The LODs of the most targeted analytes were at 0.05 ng/mL, as low as 0.04 ng/m for PFOA and PFNA. Wu et al. (25) reported that the LODs of PFASs ranged from 0.02 to 0.18 ng/mL that compares well with our LODs, which were between 0.04 and 0.2 ng/mL (Table III). The limit of quantitation was set at three times the LOD. The aforementioned assessments and validation demonstrated that an efficient and reproducible method was developed that could be used for UPLC-MS/MS analysis of human clinical samples with analytical method performance consistent with and, in some cases, exceeding the specifications of EPA method 537.
UPLC-MS/MS detection and identification of PFAS compounds in serum
Human serum samples were processed and collected into 96-well plate before injection into the UPLC-MS/MS system. Target analytes were detected by monitoring the indicated precursor product ion pairs. Figure 1 shows the separation of eight target analytes, four mass-labeled surrogates and one IS. Four surrogates such as FTSL, PFOAL, PFOSL and PFNAL corresponded to their targeted analytes such as 4:2 FTS, PFOA, PFOS and PFNA were eluted from the analytical column at almost similar RT features, as expected (Table I). Other target analytes such as PFHpA and PFHxS were eluted with similar RT at 6.23 and 6.28 min but were discriminated by monitoring quantitative (quan) ion mass signal 318.7 m/z and 79.9 m/z, respectively, using selected ion monitoring (Table II). As a result, calibrations following quantification were performed effectively without any issue. Similarly, PFOS and PFNA were detected by monitoring quan ion 79.9 m/z and 418.8 m/z eluted at 9.95 and 7.97 min, respectively, (Table II). The surrogates and IS structures are not shown in Table I. The RT of target analytes is presented in Table I. The RT of surrogates (not shown in Table I) are FTSL (4.76 min), PFOAL (7.24 min), PFOSL (7.95 min) and PFNAL (7.98 min) and IS (6.24 min).
The PFAS compounds were identified in samples based on the congruence of serum analyte mass spectral features/ion signal intensities and RTs with those observed for authentic standards. When the ratio of quantifier to qualifier ion abundance was within ±20% of the expected value (26,27), the identity of the target compound was considered to be confirmed. Figure 2 shows a typical characteristic mass signals and RT of targeted long-chain PFOA, PFOS and PFNA analytes detected in human clinical serum extract samples. The elution time of PFOA, PFOS and PFNA from extract samples was 7.23, 7.97 and 7.99 min, respectively, that matched extremely well with standard PFOA, PFOS and PFNA compounds whose RTs were 7.22, 7.95 and 7.97 min (Table I and Figure 1).
Figure 2.
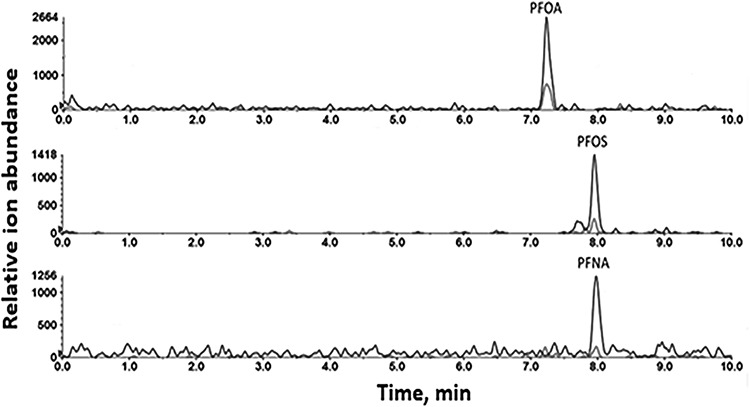
Detection of PFAS in human serum. Extracted ion chromatogram (qualification and quantitation ion pairs) showing detection of PFOA, PFOS and PFNA at typical exposure levels in a representative human plasma sample.
Analysis of human clinical samples.
We employed the aforementioned developed UPLC-MS/MS method to analyze 100 human clinical samples collecting from the CCTS Biospecimens Core Biobank, University of Kentucky Medical College, Lexington, KY, USA. Table IV represents the concentration and frequency of detection of targeted short-/long-chain PFAS compounds in the serum samples. It can be seen that the presence/detection of short-chain PFAS compounds were less than that of the targeted long-chain PFAS analytes for those human clinical serums. The frequency of detection of the targeted PFAS compounds were in the order of PFOA>PFOS>PFHpA>PFNA>PFHxS>PFBS. GenX and 4:2 FTS were not detected in the samples analyzed. The highest concentration of PFOS was 1.3–42.8 ng/mL, and the lowest concentration of PFHpA was 0.1–2.3 ng/mL. These values are broadly consistent with those reported for other human biomonitoring studies including the National Health and Nutrition Examination Survey (25,28). Subjects receiving care at the University of Kentucky Hospitals were selected based on the geographical location of their residence and separated into four different groups (West, Northeast, Southeast and Central). Figure 3 shows PFOA exposure levels in subjects residing in these different regions of the state. PFOA exposure in Kentucky residents may reflect proximity to the Ohio River and contamination of river and groundwater by the Washington Works Facility on the Ohio River in Parkersburg, West Virginia, which was a major site of manufacturing of PFAS including PFOA (29). Supplemental Figures 1–6 show regional differences in serum levels of all of the PFAS monitored in Kentucky residents from the four different regions of the state examined in this study. Statistical analysis of these data revealed significant differences in PFHpA exposure between subjects living in the Southeast of the state and in the other regions examined.
Table IV.
Concentration (ng/mL) of Targeted PFAS Compounds in Human Clinical Serums
| Compounds | Total sample number (100) | PFAS detected in sample number | Conc range (ng/mL) | Average conc (ng/mL) | Median conc (ng/mL) | Literature valuea |
|---|---|---|---|---|---|---|
| Short-chain | ||||||
| PFBS | 100 | 7 | 0.70–2.7 | 1.2 | 0.9 | 0.0–0.49 |
| 4.2 FTS | 100 | NF | NA | NA | NA | NR |
| GenX | 100 | NF | NA | NA | NA | NR |
| Long-chain | ||||||
| PFHpA | 100 | 59 | 0.1–2.3 | 1.1 | 1.0 | 0.0–0.10 |
| PFHxS | 100 | 31 | 0.7–5.1 | 1.7 | 1.4 | 0.14–0.9 |
| PFOA | 100 | 82 | 0.3–6.2 | 1.4 | 1.1 | 5.6–36.3 |
| PFOS | 100 | 61 | 1.3–42.8 | 6.8 | 4.3 | 8.85–99.4 |
| PFNA | 100 | 46 | 0.2–2.3 | 0.9 | 0.8 | 0.92–5.3 |
NF indicates not fund; NA, not applicable; NR, not reported.
aLiterature value from (25).
Figure 3.
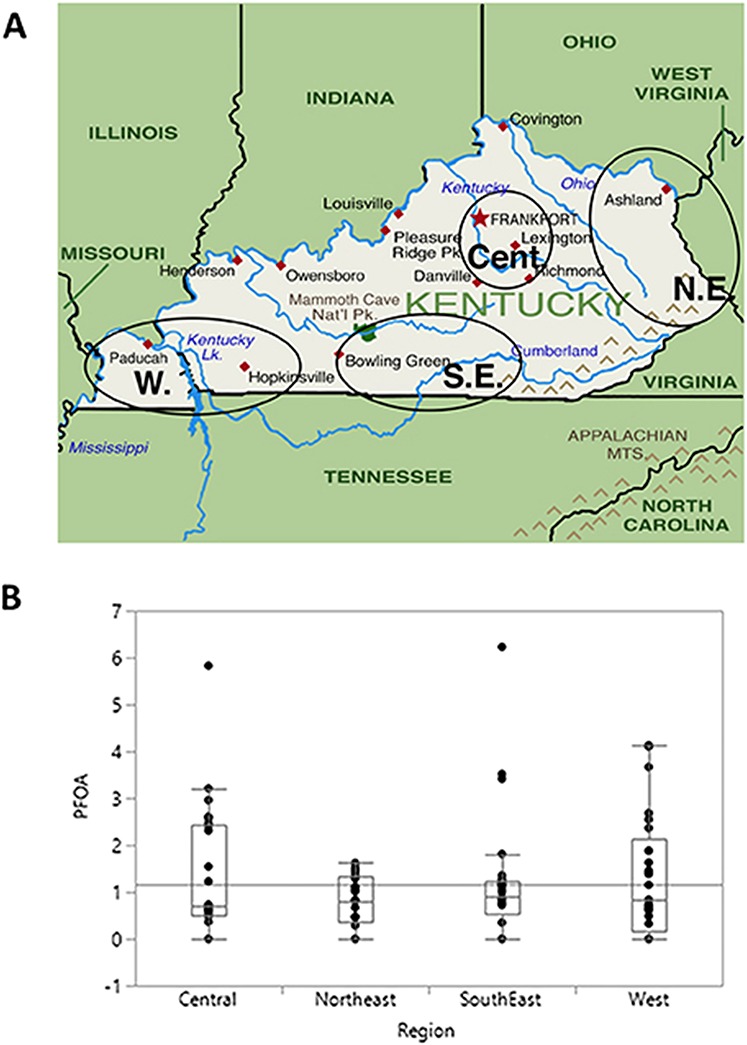
Regional differences in PFOA exposures in Kentucky subjects. PFOA was measured in serum samples from subjects living in the indicated regions of the state of Kentucky. (A) geographical locations of four different group of subjects, (B) PFOA values shown are parts per billion. The median and maximal values, again in parts per billion, for each region were Central: 0.69, 5.83; Northeast: 0.80, 1.60; Southeast: 1.25, 6.23; West: 3.84, 4.13.
Conclusion
A simple, reliable and reproducible reverse-phased UPLC-MS/MS approach with 96-well plate extraction procedure was developed to analyze environmentally persistent PFAS compounds from 50 μL human clinical samples. The method utilizes multiple surrogates and internal standard in all sample extracts, QC samples, recovery study and other analytical assay measurements. MRM profiling of PFAS characterization and quantification was made using mass-labeled IS calibration curves following EPA guidelines. Three layers average spike recoveries of surrogates ranged of 79–115% with 8–12% RSD for QC-low, 90–123% with 7–12% RSD for QC-medium and 82–114% with 9–15% RSD for QC-high. The control reagent blank recovery was 79–122% with 8–13% RSD for R-BLK. The PFOA and PFNA were detected as low as 0.04 ng/mL. This is very suitable for routine human biomonitoring and can be used for large-scale analysis of samples for population and epidemiological studies.
Funding
Supported by grants from NIH/NIEHS (5P30ES026529 and 5P42 P42ES007380) and NIH/NIGMS (5P20GM103527) to A.J.M., from National Institutes of Health/National Institute of Environmental Health Sciences (1K99ES028734) to M.C.P. and from NIH National Center for Advancing Translational Sciences (UL1TR001998).
Acknowledgements
We thank Dr Ken Campbell for providing human samples for this study. This research benefitted from resources at the Lexington Veterans Affairs Medical Center.
References
- 1. Landrigan P.J., Fuller R., Acosta N.J.R., Adeyi O., Arnold R., Basu N.N. et al. (2018) The lancet commission on pollution and health. Lancet, 391, 462–512. [DOI] [PubMed] [Google Scholar]
- 2. Landrigan P.J., Fuller R., Hu H., Caravanos J., Cropper M.L., Hanrahan D. et al. (2018) Pollution and global health—An agenda for prevention. Environmental Health Perspectives, 126, 084501. [DOI] [PMC free article] [PubMed] [Google Scholar]
- 3. Jian J.M., Chen D., Han F.J., Guo Y., Zeng L., Lu X. et al. (2018) A short review on human exposure to and tissue distribution of per- and polyfluoroalkyl substances (PFASs). The Science of the Total Environment, 636, 1058–1069. [DOI] [PubMed] [Google Scholar]
- 4. Prevedouros K., Cousins I.T., Buck R.C., Korzeniowski S.H. (2006) Sources, fate and transport of perfluorocarboxylates. Environmental Science & Technology, 40, 32–44. [DOI] [PubMed] [Google Scholar]
- 5. Pelch K.E., Reade A., Wolffe T.A.M., Kwiatkowski C.F. (2019) PFAS health effects database: Protocol for a systematic evidence map. Environment International, 130, 104851. [DOI] [PubMed] [Google Scholar]
- 6. Boone J.S., Vigo C., Boone T., Byrne C., Ferrario J., Benson R. et al. (2019) Per- and polyfluoroalkyl substances in source and treated drinking waters of the United States. The Science of the Total Environment, 653, 359–369. [DOI] [PMC free article] [PubMed] [Google Scholar]
- 7. Winkens K., Koponen J., Schuster J., Shoeib M., Vestergren R., Berger U. et al. (2017) Perfluoroalkyl acids and their precursors in indoor air sampled in children’s bedrooms. Environmental Pollution (Barking, Essex), 1987, 423–432. [DOI] [PubMed] [Google Scholar]
- 8. Wang Z., Cousins I.T., Scheringer M., Buck R.C., Hungerbuhler K. (2014) Global emission inventories for C4-C14 perfluoroalkyl carboxylic acid (PFCA) homologues from 1951 to 2030, Part I: Production and emissions from quantifiable sources. Environment International, 70, 62–75. [DOI] [PubMed] [Google Scholar]
- 9. Domingo J.L., Jogsten I.E., Eriksson U., Martorell I., Perello G., Nadal M. et al. (2012) Human dietary exposure to perfluoroalkyl substances in Catalonia, Spain. Temporal trend. Food Chemistry, 135, 1575–1582. [DOI] [PubMed] [Google Scholar]
- 10. van Asselt E.D., Rietra R.P., Romkens P.F., van der Fels-Klerx H.J. (2011) Perfluorooctane sulphonate (PFOS) throughout the food production chain. Food Chemistry, 128, 1–6. [DOI] [PubMed] [Google Scholar]
- 11. Buck R.C., Franklin J., Berger U., Conder J.M., Cousins I.T., de Voogt P. et al. (2011) Perfluoroalkyl and polyfluoroalkyl substances in the environment: Terminology, classification, and origins. Integrated Environmental Assessment and Management, 7, 513–541. [DOI] [PMC free article] [PubMed] [Google Scholar]
- 12. Graber J.M., Alexander C., Laumbach R.J., Black K., Strickland P.O., Georgopoulos P.G. et al. (2019) Per and polyfluoroalkyl substances (PFAS) blood levels after contamination of a community water supply and comparison with 2013–2014 NHANES. Journal of Exposure Science & Environmental Epidemiology, 29, 172–182. [DOI] [PMC free article] [PubMed] [Google Scholar]
- 13. Patlewicz G., Richard A.M., Williams A.J., Grulke C.M., Sams R., Lambert J. et al. (2019) A chemical category-based prioritization approach for selecting 75 per- and polyfluoroalkyl substances (PFAS) for tiered toxicity and toxicokinetic testing. Environmental Health Perspectives, 127, 14501. [DOI] [PMC free article] [PubMed] [Google Scholar]
- 14. Dong Z., Wang H., Yu Y.Y., Li Y.B., Naidu R., Liu Y. (2019) Using 2003–2014 U.S. NHANES data to determine the associations between per- and polyfluoroalkyl substances and cholesterol: Trend and implications. Ecotoxicology and Environmental Safety, 173, 461–468. [DOI] [PubMed] [Google Scholar]
- 15. Anderson J.K., Luz A.L., Goodrum P., Durda J. (2019) Perfluorohexanoic acid toxicity, part II: Application of human health toxicity value for risk characterization. Regulatory Toxicology and Pharmacology: RTP, 103, 10–20. [DOI] [PubMed] [Google Scholar]
- 16. Huang M., Jiao J., Zhuang P., Chen X., Wang J., Zhang Y. (2018) Serum polyfluoroalkyl chemicals are associated with risk of cardiovascular diseases in national US population. Environment International, 119, 37–46. [DOI] [PubMed] [Google Scholar]
- 17. Nelson J.W., Hatch E.E., Webster T.F. (2010) Exposure to polyfluoroalkyl chemicals and cholesterol, body weight, and insulin resistance in the general U.S. population. Environmental Health Perspectives, 118, 197–202. [DOI] [PMC free article] [PubMed] [Google Scholar]
- 18. Boston C.M., Banacos N., Heiger-Bernays W. (2019) Per- and polyfluoroalkyl substances: A national priority for safe drinking water. Public Health Reports, (Washington, D.C.: 1974), 33354919826567.134, 112–117. [DOI] [PMC free article] [PubMed] [Google Scholar]
- 19. Gaylord A., Berger K.I., Naidu M., Attina T.M., Gilbert J., Koshy T.T. et al. (2019) Serum perfluoroalkyl substances and lung function in adolescents exposed to the World Trade Center disaster. Environmental Research, 172, 266–272. [DOI] [PMC free article] [PubMed] [Google Scholar]
- 20. Mamsen L.S., Bjorvang R.D., Mucs D., Vinnars M.T., Papadogiannakis N., Lindh C.H. et al. (2019) Concentrations of perfluoroalkyl substances (PFASs) in human embryonic and fetal organs from first, second, and third trimester pregnancies. Environment International, 124, 482–492. [DOI] [PubMed] [Google Scholar]
- 21. Boronow K.E., Brody J.G., Schaider L.A., Peaslee G.F., Havas L., Cohn B.A. (2019) Serum concentrations of PFASs and exposure-related behaviors in African American and non-Hispanic white women. Journal of Exposure Science & Environmental Epidemiology, 29, 206–217. [DOI] [PMC free article] [PubMed] [Google Scholar]
- 22. Shu H., Lindh C.H., Wikstrom S., Bornehag C.G. (2018) Temporal trends and predictors of perfluoroalkyl substances serum levels in Swedish pregnant women in the SELMA study. PLoS One, 13, 1–11. e0209255. [DOI] [PMC free article] [PubMed] [Google Scholar]
- 23. Shoemaker J.A., Boutin B., Grimmett P. (2009) Development of a U.S. EPA drinking water method for the analysis of selected perfluoroalkyl acids by solid-phase extraction and LC-MS-MS. Journal of Chromatographic Science, 47, 3–11. [DOI] [PubMed] [Google Scholar]
- 24. Olsen G.W., Mair D.C., Lange C.C., Harrington L.M., Church T.R., Goldberg C.L. et al. (2017) Per- and polyfluoroalkyl substances (PFAS) in American Red Cross adult blood donors, 2000–2015. Environmental Research, 157, 87–95. [DOI] [PubMed] [Google Scholar]
- 25. Wu M., Sun R., Wang M., Liang H., Ma S., Han T. et al. (2017) Analysis of perfluorinated compounds in human serum from the general population in Shanghai by liquid chromatography-tandem mass spectrometry (LC-MS/MS). Chemosphere, 168, 100–105. [DOI] [PubMed] [Google Scholar]
- 26. Mottaleb M.A., Osemwengie L.I., Islam M.R., Sovocool G.W. (2012) Identification of bound nitro musk-protein adducts in fish liver by gas chromatography-mass spectrometry: Biotransformation, dose-response and toxicokinetics of nitro musk metabolites protein adducts in trout liver as biomarkers of exposure. Aquatic Toxicology, (Amsterdam, Netherlands), 106–107, 164–172. [DOI] [PubMed] [Google Scholar]
- 27. Mottaleb M.A., Stowe C., Johnson D.R., Meziani M.J., Mottaleb M.A. (2016) Pharmaceuticals in grocery market fish fillets by gas chromatography-mass spectrometry. Food Chemistry, 190, 529–536. [DOI] [PubMed] [Google Scholar]
- 28. Calafat A.M., Wong L.Y., Kuklenyik Z., Reidy J.A., Needham L.L. (2007) Polyfluoroalkyl chemicals in the U.S. population: Data from the National Health and Nutrition Examination Survey (NHANES) 2003–2004 and comparisons with NHANES 1999–2000. Environmental Health Perspectives, 115, 1596–1602. [DOI] [PMC free article] [PubMed] [Google Scholar]
- 29. Herrick R.L., Buckholz J., Biro F.M., Calafat A.M., Ye X., Xie C. et al. (2017) Polyfluoroalkyl substance exposure in the mid-Ohio River Valley, 1991–2012. Environmental Pollution (Barking, Essex), 1987, 50–60. [DOI] [PMC free article] [PubMed] [Google Scholar]