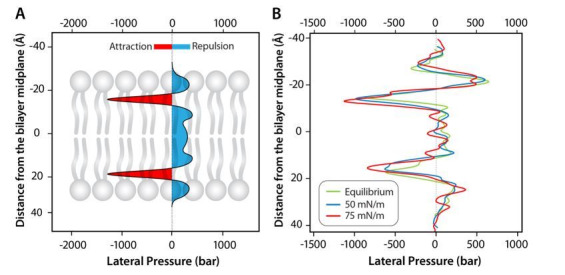
Author response image 1. Difference between the surface tension and overall membrane tension based on the lateral pressure profile of the bilayer.

(A) The area shaded with red shows where regarded as “surface tension”, and blue the repulsive forces at the tail region of the bilayer and between the headgroups. (B) Illustration of how the pressure profile of the lipid bilayer in the presence of an MS channel (MscL) changes at different surface tensions of 50 mN/m and 75 mN/m in an NγPzT ensemble (Adapted from Bavi et al., 2016 (reference 4)). As shown, when the target surface tension is 50 mN/m the pressure profile of the lipid shows little or no change in the presence of the channels. Changes in the pressure profile only start to be noticed at 75 mN/m, particularly at the lipid water interface. In this condition (target surface tension of 75 mN/m; blue line), compared to a non-stressed bilayer (equilibrium; dark green) and based on the area under the pressure profile we estimate a mean membrane tension of 25.5 mN/m has been applied on the membrane, which is about 4x the experimental value required to activate MscS in patch clamp experiments.
