

Summary
The sense of taste allows animals to sample chemicals in the environment prior to ingestion. Of the five basic tastes, sour, the taste of acids, had remained among the most mysterious. Acids are detected by Type III taste receptor cells (TRCs), located in taste buds across the tongue and palate epithelium. The first step in sour taste transduction is believed to be entry of protons into the cell cytosol, which leads to cytosolic acidification and the generation of action potentials. The proton-selective ion channel Otop1 is expressed in Type III TRCs and is a candidate sour receptor. Here, we tested the contribution of Otop1 to taste cell and gustatory nerve responses to acids in mice in which Otop1 was genetically inactivated (Otop1-KO). We first show that Otop1 is required for the inward proton current in Type III TRCs from different parts of the tongue that are otherwise molecularly heterogeneous. We next show that in Type III TRCs from Otop1-KO mice, intracellular pH does not track with extracellular pH and moderately acidic stimuli do not elicit trains of action potentials, as they do in Type III TRCs from wildtype mice. Moreover, gustatory nerve responses in Otop1-KO mice were severely and selectively attenuated for acidic stimuli, including citric acid and HCl. These results establish that the Otop1 proton channel plays an important role in acid detection in the context of the mouse gustatory system, evidence that it is a bona fide sour taste receptor.
Keywords: Taste, gustatory, tongue, sour, lemon, Otop1, Otopetrin, proton channel, taste transduction, sour receptor
eTOC blurb
Otop1 forms a proton channel expressed in taste receptor cells that detect sour stimuli. Teng et al. show that mice in which Otop1 is genetically inactivated have severely diminished cellular and gustatory nerve response to acids, indicating that Otop1 functions as a sour taste receptor.
Graphical Abstract
Introduction
The taste system analyzes soluble chemicals in foods prior to ingestion to maximize the consumption of nutrients and avoid toxins and other noxious agents [1, 2]. In most mammalian species, five basic tastes— bitter, sweet, sour, salty, and umami —are detected by subsets of taste receptor cells (TRCs) on the tongue and palate. These specialized epithelial cells have receptors that respond to each of the five basic tastes. Bitter, sweet, and umami are detected by G protein-coupled receptors that signal through phospholipase C to open the TRPM5 ion channel, leading to membrane depolarization and neurotransmitter release onto activate gustatory nerves [3–5]. Salty taste involves at least two separate signaling mechanisms: Low concentrations of NaCl are detected by the amiloride-sensitive ENaC channels that are present in a unique population of cells [6–8], whereas higher concentrations of salt are detected by a mixed population of cells that are also sensitive to sour and bitter tastes [9–11]. The molecular nature of the receptor mechanisms mediating the detection of high concentrations of salts or of sour taste are still largely unknown. Here we focus on sour taste.
Early experiments showed that mineral and organic acids applied to the tongue elicited an increase in electrical activity in gustatory nerve fibers that innervate taste buds [12] and mapped sensitivities to acids across the tongue by recording from nerves that innervate anterior (chorda tympani) and posterior (glossopharyngeal) taste fields (e.g. in rat [13, 14] or mouse [15, 16]). More recent studies have shown that acids are detected by Type III TRCs, which are found in taste buds throughout the oral cavity, and can be identified by the presence of unique marker proteins, including Gad1 and PKD2L1 [17–23]. Specific ablation of Type III TRCs, through expression of attenuated diphtheria toxin (DTA) in PKD2L1-expressing cells, eliminates chorda tympani nerve responses to sour stimuli [17], confirming the essential role of Type III TRCs in sour taste physiology. However, knockout of the PKD2L1 gene has little effect on cellular or gustatory nerve response to acids, indicating that it is not the primary sour receptor [24, 25].
The first step in sour taste transduction is generally agreed to be an influx of H+ ions into the Type III TRCs, and the subsequent decrease in intracellular pH [26–28]. This reduction in intracellular pH has been proposed to block a resting K+ channel, Kir2.1 [29–31], leading to membrane depolarization. Weak acids, such as acetic acid, can cross cell membranes in the protonated form and acidify the cell cytosol [28, 32]; but strong acids, such as HCl, require transport by specific membrane proteins. Recordings from isolated Type III TRCs show that protons penetrate the plasma membrane through a mechanism that is Zn2+ sensitive and specific to Type III TRCs [33]. From a differential RNAseq screen for membrane protein-encoding genes expressed in Type III TRCs, we identified Otop1 as encoding a proton-selective ion channel that represents a promising candidate for the elusive sour receptor [34].
Here, we test the contribution of Otop1 to sour taste transduction in mice carrying a functional null mutation in their Otop1 gene (KO) mice. In patch clamp recording, pH imaging, and gustatory nerve recording, we find that responses to acid stimuli are moderately to severely attenuated in Otop1-KO mice as compared with the response in wild-type mice. Collectively, these data show that Otop1 is an essential component of a low pH-responsive proton channel and provide evidence that Otop1 functions as an acid sensor in the gustatory system to contribute to sour taste.
Results
Proton currents in taste receptor cells and HEK-293 cells expressing Otop1 have similar properties
To examine the role of Otop1 in taste transduction, we first compared the functional properties of Otop1 expressed in HEK-293 cells and the native proton channels in taste cells. We isolated taste receptor cells from mice in which the PKD2L1 promoter drives expression of yellow fluorescent protein (PKD2L1-YFP mice) [33] identified Type III TRCs based on expression of YFP. Proton currents were evoked by rapidly changing the pH from neutral to acidic using an NMDG-based extracellular solution (to prevent contamination from Na+ permeable channels) [33]. Consistent with previous findings [34], in both Type III TRCs and Otop1-expressing HEK-293 cells, this stimulus evoked an inward current that increased in magnitude as the extracellular pH was lowered (Figure 1A). To quantitatively compare characteristics of the heterologously expressed Otop1 channels and native channels, we measured sensitivity to Zn2+, which blocks proton currents in taste receptor cells [33]. Zn2+ inhibited the proton currents elicited in both Type III TRCs and Otop1-expressing HEK-293 cells (Figure 1B, C). However, the IC50 (0.10 mM) for Type III TRCs was slightly less than the IC50 (0.36 mM) for Otop1-expressing HEK-293 cells, suggesting differences in the presence of auxiliary subunits or in cellular environment between the two cell types. Zn2+ inhibition of the proton current in TRCs is pH-sensitive [35]. We found that the Zn2+ inhibition of the current in Otop1-expressing HEK-293 cells was also pH sensitive with an EC50 of 5.12, which was similar to the EC50 of pH 4.95 detected for currents in the taste cells (Figure 1D). The similarity in functional properties of Otop1 currents and the currents in taste receptor cells suggests that Otop1 constitutes the key component of the channel that carries the proton current in taste receptor cells.
Figure. 1. Heterologously expressed Otop1 and the proton current in Type III TRCs have similar properties.

(A) Inward proton currents elicited in response to lowering the extracellular pH as indicated in patch clamp recordings from HEK-293 cells transfected with Otop1 and isolated Type III TRCs from circumvallate papillae, identified by expression of YFP (Vm = −80 mV). The extracellular solution contained NMDG-Cl to isolate the proton current. (B) Dose-dependent inhibition of the proton currents by Zn2+ (pink bar, concentration indicated in mM) in patch clamp recordings from HEK-293 cells transfected with Otop1 and isolated Type III TRCs (Vm = −80 mV). (C) Averaged data from experiments as in (B) (mean ± SEM, n = 6–11 cells and n = 3–8 cells for HEK-293 and taste cells, respectively. Data were fit with the Hill equation with an IC50 of 266 μM and 73 μM and Hill coefficients of 0.97 and 0.93, for HEK-293 cells and taste cells, respectively. (D) The pH dependence of Zn2+ (1 mM) inhibition of proton currents measured in HEK-293 cell transfected with Otop1 or isolated Type III TRCs (mean ± SEM, n = 7–9 cells and n = 4–7 cells for HEK-293 cells and taste cells, respectively). The data were fit with the Hill equation with IC50s of pH 5.2 and 5.0 and Hill coefficients of 1.49 and 1.47 for HEK-293 cells and taste cells, respectively.
Otop1 is required for proton currents in Type III taste receptor cells
Studies with mice that have the tlt mutation in their Otop1 gene [36], showed that this mutation, which affects trafficking of the channels, strongly attenuates, but does not completely eliminate the proton currents in taste receptor cells [34]. To definitively establish the necessity of Otop1 for proton currents in taste receptor cells and test contributions of the channel to taste signaling in vivo, we used CRISPR [37, 38] to engineer PKD2L1-YFP mice lacking a functional Otop1 gene. We selected a mutant that deleted 38 nucleotides at the N terminus of the protein, producing a frameshift that is predicted to generate a non-functional truncated protein and we refer to the mutant mice as Otop1-KO (Figure 2A–B). Like tlt mice [39], Otop1-KO mice cannot right themselves when challenged on a forced swim test, providing independent confirmation that the mutation correctly targeted the Otop1 gene. The mutation did not affect the number of Type III TRCs or their gross morphology (Figure S1A,B). We also found no change in the magnitude or the kinetics of the voltage-gated Na+ currents in these cells (Figure S1C–E).
Figure 2. Otop1 is required for the proton currents in Type III TRCs.

(A) A deletion of 38 bp in exon 1 of Otop1 was generated that produces a frameshift at the N terminus of the protein, rendering it non-functional. NHEJ: Non-homologous end joining. (B) PCR products in reactions using genomic DNA from wildtype (+/+), heterozygous (+/−), and KO (−/−) animals using primers that span the deletion site. (C) Proton currents measured with whole-cell patch clamp recording from Type III TRCs from circumvallate papillae from either wild-type (WT) mice or Otop1-KO mice. Inset shows diagram of tongue with location of papillae shaded (D) Averaged data (mean ± SEM, n = 5 – 8 cells) and scatterplot showing the magnitude of the proton current at −80 mV from experiments as in (C). (E) Proton currents measured with whole-cell patch clamp recording from Type III TRCs from fungiform papillae from either WT mice or Otop1-KO mice. (F) Averaged data (mean ± SEM, n = 5 – 8 cells) and scatterplot showing the magnitude of the proton current at −80 mV from experiments as in (E).
See also Figures S1–S2.
We isolated Type III taste receptor cells from fungiform papillae and circumvallate papillae that are located in the anterior and posterior regions of the tongue, respectively (Figure 2 C, E). Both regions contribute to sour taste, but vary in taste signaling molecules [6, 18, 40]. We recorded proton currents from the TRCs isolated from Otop1-KO mice and wild-type littermates by changing the solution from neutral pH (7.4) to a moderately acidic pH (pH 6 – pH 5, adjusted with HCl) and measuring the current at −80 mV. Proton currents of similar magnitude were measured from Type III cells isolated from anterior and posterior tongues of wild-type animals (Figure 2 C–F), whereas no currents were elicited from Type III TRCs isolated from the anterior or posterior tongues of Otop1-KO mice (Figure 2 C–F). Notably the small residual proton current observed in the tlt mouse [25] was not present in the TRCs from Otop1-KO mice. Thus, the homozygous mutation of Otop1 completely eliminated the low pH-induced proton current in Type III taste receptor cells from anterior and posterior tongue
Several lines of evidence established that the mutant allele does not generate a proton channel or serve as a dominant negative to inhibit activity of wildtype Otop1 channels. First, we expressed the mutant allele, which we refer to as Otop1_−38, in HEK-293 cells and recorded responses to acid stimuli with patch clamp recording. Otop1_−38-expressing cells generated no detectable proton currents, indicating that any protein encoded by the mutant allele, if expressed, did not produce a functional proton channel (Figure S2A). We also co-expressed WT and Otop1_−38 mRNA in Xenopus oocytes. The magnitude of the proton current was directly proportional to the amount of WT mRNA injected, and there was no discernable inhibitory effect of the mRNA for the mutant allele (Figure S2B). Finally, we measured the magnitude of the proton currents in Type III TRCs cells isolated from heterozygous mice and found that it was approximately half that of the current magnitude measured from cells isolated from wild-type animals (Figure S2C); this is the value expected from a gene dosage effect and is considerably greater than the 75% reduction in the current magnitude that would be expected if the mutation in these dimeric channels exerted a dominant negative. Given the gene dosage effects of the allele, for the remainder of the experiments, we compared wildtype mice with mice homozygous for the mutation.
Cellular responses to acid stimuli are severely attenuated in Type III taste receptor cells from Otop1-KO mice
To determine if Otop1 is required for the cellular responses of Type III TRCs to acidic stimuli, we measured two responses that are indicators of sensory transduction: lowering of intracellular pH and firing of action potentials [23, 28, 33, 35]. To measure dynamic changes in intracellular pH, circumvallate TRCs isolated from wild-type and Otop1-KO animals were loaded with the pH sensitive indicator, pHrodo red, which emits in a wavelength different from that of YFP and thus can be used with the YFP-expressing TRCs. Consistent with the previous findings [28, 33], lowering extracellular pH to 5.0 with HCl elicited a change in intracellular pH in Type III TRCs (YFP+) from wild-type animals, a response not observed in non-fluorescent TRCs (YFP-), which are not Type III TRCs and serve as a control for non-specific leak of protons (Figure 3A). This change in intracellular pH was not observed in Type III TRCs isolated from Otop1-KO mice. Instead, these Otop1-KO cells responded with a slow change in intracellular pH similar to that observed in control cells that did not express YFP (Figure 3B–C). As a control for loading of the fluorescent indicator, we exposed the cells to acetic acid, which at pH 5 is membrane permeable and causes intracellular acidification in all cells (e.g.[41]);. No difference was observed in the response to acetic acid when comparing YFP+ cells from wild-type or Otop1-KO animals (Figure 3A, B, D), indicating that the observed differences in responses to the strong acid between the genotypes were not due to differential loading of the pH indicator. Cellular viability and general excitability were tested in the same cells, which had been loaded with the calcium indicator Fura 2AM. Wild-type and Otop1-KO TRCs responded similarly to high K+ (Figure 3E,F), which opens voltage-gated calcium channels present in these cells [19], indicating that the gene inactivation did not have non-specific effects on cellular physiology, From these experiments, we concluded that Otop1 is required for the rapid intracellular acidification of Type III TRCs in response to strong acid stimuli.
Figure 3. Otop1 is required for the change in intracellular pH in Type III TRCs.

(A,B) Taste receptor cells from circumvallate papillae of wild-type (WT) and Otop1-KO mice were loaded with pHrodo Red and changes in fluorescent emission upon exposure to HCl pH 5.0 or acetic acid (AA) pH 5 was measured from Type III, YFP+ TRC (green) and control, non-fluorescent TRCs (black). Representative data are shown for a single YFP+ TRC and the average of 2 YFP- TRCs. Similar results were obtained in five independent replicates. Pseudo-colored images of fluorescence intensity are shown for the time points indicated by the arrows (i, ii, iii). Acetic acid, which shuttles protons across membranes, served as a positive control. (C) Change in fluorescent emission in response to HCl pH 5.0 for cells of the indicated genotype and cell type from experiments as in (A) and (B). Data from individual cells and the mean ± SEM are shown. Significance determined by two-tailed Student’s T-test. ** p<0.01. (D) Change in fluorescent emission in response to AA pH 5.0 for YFP+ cells of the indicated genotype from experiments as in (A) and (B). (E) Ratiometric calcium imaging in cells loaded with Fura 2 AM. Response to 50 mM KCl in YFP+ TRCs (green) and control, non-fluorescent cells (black) from WT and Otop1-KO mice. (F) Scatter plot of data showing peak response to 50 mM KCl for cells of the genotype and cell type indicated. There was no significant difference in response to 50 mM KCl between genotypes as assessed with two-tailed Student’s T-test.
Type III TRCs, but not other taste receptor cells, respond to changes in extracellular pH by firing action potentials [23, 33, 35], which represents a sensitive readout for sensory transduction. We used cell-attached patch clamp recording to measure action potentials in Type III TRCs isolated from circumvallate papillae of wild-type and Otop1-KO animals. As previously reported [35], wild-type cells exhibited a dose-dependent increase in firing as extracellular pH was lowered from pH 7.4 to a pH between 7.0 and 6.3 (Figure 4A, B). In contrast, Type III TRCs from Otop1-KO mice were completely unresponsive to changes in extracellular pH over this same pH range (Figure 4C, B). Both Otop1-KO and wild-type cells responded to a depolarizing concentration of K+ (25 mM KCl), which served as a control for cell viability and general electrical excitability (Figure 4A, B). For wild-type cells, the firing rates decreased when the pH was lowered below pH 6.0, presumably due to inactivation of voltage-gated Na+ channels (Figure 4C, D). Although the response to mild acidification (solutions as low as pH 6.3) was eliminated in Otop1-KO cells, the cells still responded to more strongly acidic solutions (pH 6.0 and 5.0) with a few action potentials (Figure 4C, D). In WT cells, the response to more strongly acidic solutions was accompanied by an increase in electrical noise, presumably reflecting the opening of either Otop1 or other ion channels; this increase in noise was not observed in the KO cells (Figure 4C). These data show that Otop1 is required for the generation of action potentials by Type III TRCs in response to moderate concentrations of acids.
Figure 4. Electrical responses to low pH stimuli are strongly attenuated in Type III TRCs from Otop1-KO mice.

(A) Action potentials measured using cell-attached patch clamp recording from isolated Type III TRCs from circumvallate papillae of WT or Otop1-KO mice in response to lowering extracellular pH. 25 mM KCl was used as positive control to confirm the viability and excitability of the cells. (B) Firing rates from experiments as in (A) are plotted as a function of pH. Data from individual cells and the mean ± SEM are shown. Significance was determined by Student’s T-test in comparing response of WT and Otop1-KO cells (pH 7.0, p = 0.0061; pH 6.7, p < 0.0001; pH 6.3, p = 0.0005).. (C) Action potentials measured in response to strongly acidic extracellular pH from isolated TRCS from circumvallate papillae of WT and Otop1-KO mice. Inset expansion show the first 2 seconds of the response. (D) Number of action potentials measured in the first 2 seconds in response to acids from experiments as in (C). Data from individual cells and the mean ± SEM are shown. Significance comparisons of WT and Otop1-KO TRCs cells was determined by two-tailed Student’s T-test. (pH 6.7, p = 0.0003; pH 6.0, p < 0.0001; pH 5.0, p = 0.0053).
Gustatory nerve responses to acid stimuli are severely attenuated in Otop1-KO mice
Taste receptor cells communicate with afferent nerve fibers that coalesce to form the chorda tympani nerve, which innervates the front of the tongue, and the glossopharyngeal nerve, which innervates the back and sides of the tongue. We first measured integrated gustatory nerve responses from the chorda tympani in response to a panel of chemicals that represent the basic taste stimuli: bitter (quinine), sweet (saccharin), umami (MSG + IMP), salty (NaCl with or without amiloride), and sour (HCl, acetic acid, and citric acid, each at 10 mM) (Figure 5A). Responses of the chorda tympani to the sour stimuli were severely and significantly attenuated in the Otop1-KO mice compared to the responses in wild-type controls (Figure 5B). Note that The data reach greater significance in the responses to citric acid and HCl, because, at the concentration tested (10 mM each), the response to acetic acid is smaller so the noise in the data exerts a larger effect. As a control, we compared the amiloride-sensitive component of the salt taste response, which is mediated by ENaC channels expressed by a subset of taste receptor cells distinct from those that mediate sour taste [6–8] and found no difference between wild-type and Otop1-KO animals. There was also no significant difference in the responses of wild-type and Otop1-KO animals to any of the other tastants, although we detected a non-significant decrease in the response to the representative bitter stimulus, quinine-HCl.
Figure 5. Gustatory nerve responses to acids are specifically reduced in Otop1-KO mice.

(A) Representative chorda tympani nerve traces from WT (top) and Otop1-KO (bottom) mice. Tastants were applied for 30s, as indicated by the stimulus bars. Responses to acidic stimuli are highlighted in red in the Otop1-KO trace. Solutions were as follows: 100 mM NH4Cl (ammonium chloride), 200 mM NaCl (salt), 200 mM NaCl + 100 μM amiloride (amiloride-insensitive salt), 30 mM saccharin (sweet), 300 mM MSG + 0.5 mM IMP (umami), 10 mM quinine (bitter), 10 mM acetic acid, 10 mM citric acid, and 10 mM HCl (sour). (B) Chorda tympani nerve responses to a panel of taste solutions in both WT (n=4) and Otop1-KO (n=7) mice. Data from individual animals and the mean ± SEM are shown. All responses are normalized to the baseline 2 seconds before the stimulus. Amiloride-sensitive salt taste was calculated as the difference between responses to NaCl with and without amiloride. Corrected p values for comparisons between genotypes were: 100 mM NH4Cl (p = 0.6470); 200 mM NaCl + 100 μM amiloride, (p = 0.1064), amiloride-sensitive salt taste (p = 0.6470); 30 mM saccharin (p = 0.4968); 300 mM MSG + 0.5 mM IMP (p = 0.3902); 10 mM quinine (p = 0.0680); 10 mM acetic acid (p = 0.0306); 10 mM citric acid (p < 0.0001) and 10 mM HCl (p < 0.0001). (C) Glossopharyngeal nerve responses to a panel of taste solutions in both WT (n=5) and Otop1-KO (n=5) mice. Data from individual animals and the mean ± SEM are shown, normalized to the qunine response. Solutions and corrected p values for comparisons between genotypes were as follows: 100 mM NH4Cl (p = 0.0223), 100 mM NaCl (salt) (p = 0.3408), 20 mM saccharin (sweet) (p = 0.6464), 100 mM MSG + 1 mM IMP (umami) (p = 5704), 10 mM acetic acid (p = 0.3457), 10 mM citric acid (p = 0.0043), and 5 mM HCl (p = 0.0035). Error bars denote SEM. Statistical significance was determined by 2-way ANOVA with correction for false discover rate by two-stage step-up method of Bengamini, Krieger and Yekutiel. See also Figure S3.
We also measured integrated nerve responses from the glossopharyngeal nerve to a similar panel of taste stimuli applied to the back of the tongue. Response to two of the acid stimuli, citric acid and HCl, were severely and significantly reduced in Otop1-KO animals, compared with the responses in WT controls. Responses to all non-acid stimuli except ammonium chloride (NH4Cl) were similar between Otop1-KO and WT animals (Figure 5C).
Mice show a natural behavioral aversion to solutions containing high concentrations of mineral or organic acids, which can be measured with a two-bottle taste preference test [24]. However, ablation of Type III TRCs or elimination of signaling between TRCs and nerve fibers has no effect on behavioral avoidance of acids [42, 43]. Because Otop1 functions in Type III TRCs, we did not expect Otop1-KO mice to exhibit any difference from wild-type mice in this behavioral aversion test. Indeed, when we compared Otop1-KO and wild-type littermates on two variants of this test and with two different acidic stimuli, we found no difference between the mice of the two genotypes (Figure S3A). In a 48-hr two-bottle taste preference assay, mice of both genotypes exhibited similar avoidance to HCl over a concentration range of 1 mM to 30 mM (Figure S2A). In a short-access (30 min) two-bottle preference assay, mice of both genotypes reacted similarly to citric acid over a concentration range of 0.05 mM to 3.0 mM (Figure S3B), which includes concentrations that are appetitive to some strains of mice [44]. Thus, Otop1 is not required for innate behavioral aversion to acids.
Discussion
In this study, by combining cellular electrophysiology, intracellular pH imaging, and gustatory nerve recordings, we showed that Otop1 encodes a functional proton channel enriched in Type III TRCs, which is required for sensitive detection of acids by the gustatory system. Using gene-editing technology, we generated an Otop1-null mutant and found that inward proton currents elicited by low pH and the decrease in intracellular pH following acidic stimuli were completely eliminated in Type III TRCs from the Otop1-KO mice. The similarity between heterologously expressed Otop1 currents and the currents elicited in Type III TRCs and the absence of a proton current in the Otop1-KO mice provides strong evidence that Otop1 forms the proton channel within Type III TRCs. Isolated Type III TRCs fire trains of action potentials in response a reduction in extracellular pH (from 7.4 to <7.0); this response was eliminated in Type III TRCs from Otop1-KO mice, demonstrating the necessity of Otop1 for sensory detection of low concentrations of acids. However, Otop1-KO cells still exhibited some sensitivity to high concentrations of acids, suggesting alternative pathways and some functional redundancy in acid sensing. In addition, we found that response of both the chorda tympani and the glossopharyngeal nerves to acids were severely attenuated in Otop-KO mice, consistent with the TRC cellular physiology. Thus, we conclude that Otop1 functions as a sensitive detector of acids in Type III TRCs and is a component of sour taste transduction.
Weak organic acids, such as citric and acetic acid, and strong mineral acids, such as HCl are perceived as sour by humans and avoided at high concentration by mice. Although pH is one determinant of sour intensity, the nature and concentration of the weak acid also plays an important role [45]. For example, citric acid is perceived as more sour than HCl at the same pH. One hypothesis to explain this phenomenon postulates that the shuttling of protons by organic acids, many of which can cross cellular membranes in the protonated form, is sufficient to lower the intracellular pH of the taste receptor cell and drive sensory transduction [27, 46]. An alternative, not mutually exclusive, hypothesis is that organic acids serve as a source of H+, which would otherwise be absorbed by salivary proteins and buffers. These hypotheses are difficult to disambiguate, and existing data to support the shuttling hypothesis has relied on a correlations between intracellular pH and gustatory nerve responses [27]. We found that gustatory nerve responses to both weak organic acids and strong mineral acids are similarly attenuated in the absence of functional proton channels; this is more consistent with the latter hypothesis and suggests that shuttling of protons across cell membranes by organic acids may play a less critical role than previously thought.
Whereas our data showed that Otop1 is an acid sensor in the gustatory system, it also showed that it is not the only one. Although the targeted inactivation of Otop1 completely eliminated proton currents in taste cells from anterior and posterior taste field, responses of chorda tympani and glossopharyngeal nerves to sour stimuli were severely attenuated but not eliminated, regardless of the nature of the sour stimulus (strong acid versus weak acid). Similarly, although responses of isolated TRCs to mildly acidic stimuli (pH 6.0- pH 7.0) were largely eliminated in the Otop1-KO mice, responses to more strongly acidic stimuli (pH 5.0) still occurred (albeit with reduced intensity). The mechanism(s) underlying this retained acid sensitivity is not clear. The inward rectifier K+ channel, Kir2.1, present in Type III TRCs, is inhibited by intracellular acidification [31] but a role in mediating responses to strong acids (HCl) in the absence of Otop1 or other specific transport mechanism to allow protons to cross the cell membrane is not expected. One intriguing possibility is that the remaining response is mediated by another pH-sensitive channels or receptors previously identified in Type III TRCs. For example, a member of the TRP channel family, PKD2L1, has been hypothesized to play a role in sour taste sensation [18, 47, 48]. Although responses to acidic stimuli were mostly unaltered in PKD2L1 KO or PKD2L1/1L3 double KO mice [25], it is possible that the contribution of the channel is unmasked in the Otop1-KO mouse. Another possibility is that the response is mediated by a member of the two-pore domain potassium channel (K2P) family, members of which are sensitive to both extra- and intracellular pH [49]. Several K2P family members are present in TRCs [31, 50].
In addition to the consistent change in the response of the gustatory nerves to the acidic stimuli, we also observed an attenuation of the response to some of the other taste stimuli. Notably, the response of the chorda tympani nerve to the bitter stimulus quinine-HCl was reduced (although the change did not reach statistical significance), and the response of the glossopharyngeal nerve to NH4Cl was significantly attenuated. We do not have clear understanding of the cellular and molecular factors that contribute to these changes in responsivity, however they are consistent with mounting evidence that taste signaling may not strictly conform to a labelled line model [51, 52]. Consistent with our results, sensitivity to acids is often associated with sensitivity to quinine-HCl in single chorda tympani units [16] and taste cells in fungiform papillae they innervate [23]. An effect of the inactivation of Otop on responses of the glossopharyngeal NH4Cl is in keeping with other evidence showing that Type III TRCs in circumvallate papillae mediate a component of the response to salty stimuli [10, 53] and that single units in the glossopharyngeal nerve that respond to acid stimuli, also generally respond to NH4Cl [13]. It is worth noting that NH4Cl exists in equilibrium with NH3 and H+ and, thus it is not hard to imagine that a proton channel could contribute to the ammonium response. Further studies will be needed to determine if Otop1 contributes to bitter or high salt detection, either directly or indirectly.
Our results provide the first evidence for a molecule that is both necessary and sufficient to confer sensitivity to acids in the context of taste signaling. In the fruit fly Drosophila melanogaster, acids are sensed by gustatory neurons [1, 54] and several receptor molecules have been identified that are necessary for their detection: IR76b and IR25a are required for the detection of carboxylic and mineral acids that are attractive and lead to female oviposition [55]. IR76a, IR25a, and IR56d form a receptor involved in behavioral attraction to fatty acids [56], whereas IR7a is required for behavioral aversion to acetic acid [57]. However, functional reconstitution of any of these receptors in a heterologous cell type has not been reported, although IR7a conferred acid responsiveness to sweet-sensing cells within the fruitfly [57]. In contrast, Otop1 is well-established to function as a proton channel in heterologous cells [34]. Moreover, CryoEM studies have revealed the structure of the Otop1 channel [58] allowing an understanding of how proton selectivity is achieved.
In summary, we present several lines of evidence that Otop1 functions as a sensitive acid detector and signal transducer in the gustatory system and, thus, can be considered a sour taste receptor. Sour is one of the more complex of the taste qualities, evoking both attractive and aversive behaviors in humans and mice [44], depending on concentration, context (for example, whether sugar is present), and learning. In mice, acidic solutions are detected by both the somatosensory and gustatory system and avoidance behavior does not require a functioning gustatory system [42, 43]. How the gustatory component of acids is used to guide behavior and food choice in mice remains an open question. Our data also showed, unexpectedly, that gustatory responses to acid stimuli are not completely eliminated in Otop1-KO mice, pointing to the presence of other acid-sensing components. Although our data provide one receptor in this complex sensory modality, the identification of the full complement of receptors and channels that contribute to sour taste transduction remains a goal for the future.
STAR Methods
LEAD CONTACT AND MATERIALS AVAILABILITY
Further information and requests for resources and reagents should be directed to and will be fulfilled by the Lead contact, Emily R. Liman (liman@usc.edu).
Materials Availability Statement
Mouse lines generated in this study are available from the Lead contact, Emily R. Liman (liman@usc.edu) upon request.
Experimental model and subject details
Cell lines
HEK-293 cells (ATCC, CRL-1573) were grown in humidified incubator at 37 °C in 5% CO2 and 95% O2. The cells were cultured in high-glucose DMEM (ThermoFisher, 11995073) containing 10% fetal bovine serum (Life Technology, 16000044), and 50μg/ml gentamicin (Life Technology, 15750060). Cells were passaged every 3 – 4 days, at 1:5 or 1:10 dilutions.
Xenopus laevis oocytes
Xenopus laevis ooctyes were provided by Ecocyte Bioscience. mRNA (0.5ng, 50 nL) was injected into oocytes with a Nanoject II Auto-Nanoliter Injector (Drummond, 3–000-204) and oocytes were incubated in modified barth’s solution (MBS, Ecocyte Bioscience LRE-S-LSG-1006–7) at 18oC for 48 hrs before recording.
Animal strains
All animal procedures were approved by the Institutional Animal Care and Use Committees of either the University of Southern California, the University of Colorado Denver or Harvard Medical School. The mouse strain PKD2L1-YFP is a BAC transgenic line in which the promoter of Pkd2l1 drives expression of YFP as previously described [33]. The Otop1-KO mouse was generated in the USC/Norris Cancer Center Transgenic/Knockout Rodent Core at the University of Southern California through gene-editing of the PKD2L1-YFP strain (in a B6/D2 background). Health status of animals was monitored daily and only healthy animals were used in experiments. Animals used in experiments were not involved in previous experiments or exposed to any drugs. Mice used in all experiments comprised both male and females. For taste cell recordings, mice aged 6 – 12 weeks were used as previously described [33]. For nerve recordings, mice aged 12–36 weeks were used. For behavioral testing, mice aged 12–24 weeks were used. Wild-type controls were littermates of the Otop-KO mice used, or were from the strain (PKD2L1-YFP) from which the Otop1-KO strain was derived. There was no noticeable difference between the two, and unless otherwise indicated, both were used in the experiments.
Method details
CRISPR-cas9 mediated generation of Otop1-KO (Otop1em1Lmn) mice
To generate a null allele, guide sequence targeting the N-terminus of the protein (CGCCGGGGACCGGAAGCTTG) was selected and checked for potential off-target sites using https://www.pnabio.com/support/gRNATool.htm and http://crispr.mit.edu. Guide sequence was cloned into pX330 vector (Addgene), which included tracrRNA sequence. In vitro transcription with T7 MEGA ShortScript kit (Thermo Fisher Scientific) was performed, using PCR product of T7-sgRNA from pX330 vector, to generate sgRNA. The efficacy of sgRNA was tested with in vitro Cas9 digestion. sgRNA (100 ng/μL), plus Cas9 mRNA (200 ng/μL, TriLink) or Cas9 protein (100 ng/μL, PNABio) were injected into zygotes of PKD2L1-YFP transgenic and B6D2F1 mice. The F1 mice were genotyped by subcloning and sequencing fragments of genomic DNA around the predicted cut site. An animal carrying a deletion of 38 bp on exon 1, starting at nucleotide 120 of the coding sequence of Otop1, was selected for breeding. Genotyping of the progeny was performed with following primers: Whole exon 1: GGAGCCAGGAGCAACGTGC (Forward), CTGCTCAGAGTCTCCGCCAGC (Reverse); WT-specific allele: TGGAGGAGAGCAGGATCTGAGG (Forward), AGTCTCCGCCAGCTTCTGCG (Reverse); Mutant (−38)-specific allele: TGGAGGAGAGCAGGATCTGAGG (Forward), GTCTCCGCCAGCTTCTGGA (Reverse). Note that the knockout phenotype could not be verified by immunocytochemistry due to the poor quality of available antibodies. Additional attempts to generate antibodies also failed. The validation of the knockout phenotype therefore relies on the following observations: (1) behavioral effect on vestibular system as assayed with a forced swim test and (2) confirmation that 38 bp at the N terminus of the protein was eliminated. Note that if the original initiating methionine is used, the deletion is expected to generate a truncated protein of 173 amino acids (containing the first 40 amino acids of Otop1) while If an internal methionine is used, a nonfunctional protein lacking the first two transmembrane domains would be generated.
Taste cell isolation
Taste cells were isolated from adult mice (6 – 12 weeks) as previously described [5, 33]. Briefly, an enzyme mix consisting of Tyrode’s solution supplemented with 1mg/ml elastase (Worthington Biochemical), and 2.5 mg/ml Dispase II (Sigma Aldrich), was injected between the epithelium and muscle of isolated tongue, which was then incubated in Tyrode’s solution bubbled with 95% O2 / 5% CO2 for 20 minutes. The epithelium was then peeled off from the tongue. For circumvallate papillae, a small piece of the epithelium containing the papillae was trimmed and incubated in the enzyme mix for another 15 minutes at room temperature. For fungiform papillae, the epithelium was pinned inside out in a small chamber filled and was incubated in Ca2+-free Tyrode’s for 5 minutes. Then the Ca2+-free solution was disposed and the chamber was refilled with regular Tyrode’s solution and the taste buds were suctioned out with a fire-polished wide-bore capillary. For both preparations, single cells were isolated by further trituation in Tyrodes’s solution with fire-polishted Pasteur pipettes and were used in the following 4 – 6 h.
Transfection of HEK-293 cells
HEK-293 cells were transfected in 35mm petri dishes, with about 600ng DNA and 2μl TransIT-LT1 transfection reagent (Mirus Bio Corporation) following manufacturer’s protocol. Specifically, mOtop1 was co-transfected with GFP with a ratio of 5:1 into HEK-293 cells. The cells were lifted using Trypsin-EDTA 24h after transfection and plated onto a coverslip for patch clamp recordings.
Patch clamp electrophysiology
Whole-cell patch clamp recording was performed as previously described [33]. Briefly, recordings were made with an Axonpatch 200B or 700B amplifier, digitized with a DIgidata 1322a 16-bit data acquisition system, acquired with pClamp 8.2 and analyzed with Clampfit 8.2 (Molecular devices). Records were sampled at 5 kHz and filtered at 1 kHz. Patch pipettes with resistance of 2 – 4 MΩ were fabricated from borosilicate glass and only recordings in which a gigaohm seal was achieved were used in the analysis. For most of the experiments, the membrane potential was held at −80 mV.
Cell-attached recordings on TRCs were performed as previously described [35]. In brief, Type III TRCs, were selected for cell attached recordings that had a typical flask-shape morphology, intact apical processes and presence of YFP expression. For quantitation, the firing rate of action potentials was measured during the 6 s following application of stimuli unless otherwise stated. As a control, we tested overall electrical excitability of the TRCs by applying an extracellular solution containing 25 mM K+.
Patch clamp electrophysiology solutions
Tyrode’s solution contained 145 mM NaCl, 5 mM KCl, 1 mM MgCl2, 2 mM CaCl2, 20mM D-Glucose, 10mM HEPES (pH 7.4 with NaOH). For control experiements measuring exitability of TRCs, 25 mM NaCl was replaced by equimolar concentration of KCl. Standard pipette solution contained 120 mM Cs-aspartate, 15 mM CsCl, 2 mM Mg-ATP, 5 mM EGTA, 2.4 mM CaCl2 (100 nM free Ca2+), and 10 mM HEPES (pH 7.3 with CsOH; 290 mosm). Standard NMDG-based extracellular solutions contained 160 mM NMDG-Cl, 2mM CaCl2, and either 10 mM HEPES (for pH 7.4), 10 mM MES (for pH 6 – 5.5), or 10 mM HomoPIPES (for pH 5 – 4.5), pH adjusted with HCl. Proton currents were measured with NMDG-based extracellular solutions. Voltage-gated Na+ currents were measured in Tyrode’s solution. For cell- attached recordings, the pipette contained Tyrode’s solution, and the extracellular solutions contained Tyrodes solution in which HEPES was replaced the appropriate buffer (as above) and the pH was adjusted as indicated in the figure. For control experiements measuring exitability of TRCs, 25 mM NaCl in Tyrode’s solutions was replaced by equimolar concentration of KCl.
Xenopus oocyte electrophysiology
Two-electrode voltage clamp (TEVC) was performed as previously described [34]. The borosilicate glass pipette was pulled with P-97 Flaming/Brown type micropipette puller and its resistance was within the range of 1–5 MΩ. The current was measured with GeneClamp 500 amplifier (Axon). Solution exchange was executed by gravity driven perfusion. The membrane potential was held at −20 mV, and voltage ramps were applied every second from −80 mV to +20 mV (1V/s). For all recordings, oocytes were pre-incubated for 5–10 minutes in 100 μM 4,4’-Diisothiocyano2,2’-stilbenedisulfonic acid (DIDS) to block endogenous Ca2+ -activated chloride channels (TMEM16A) that are activated by solutions of low pH [60] before the application of acids.
Oocyte electrophysiology solutions
For measuring the current change in response to a change in pHo, Na+ -free solutions were used, containing (in mM): 100 NMethyl-D-glucamine (NMDG), 2 KCl, 1.8 CaCl2, 2 MgCl2, buffered with either 10 mM HEPES 7.4 or with 2-(N-morpholino)ethanesulfonic acid (MES, 10 mM) for pH 4.5 and 5.5. pH was adjusted with HCl.
Ca2+ and pH imaging for isolated taste cells
Ca2+ and pH imaging were performed as previously described [33, 34], with some modifications. In brief, isolated taste cells were plated on poly-D-lysine coated coverslips at room temperature. After 30 minutes, cells were loaded with the intracellular pH indicator pHrodo Red AM and calcium indicator Fura-2 AM, using PowerLoad concentrate according to the manufacturer’s instructions (Thermo Fisher). YFP-expressing taste cells were identified using a U-MNIBA2 GFP filter cube (Olympus).. pHrodo Red fluorescence intensity for each cell was measured in response to pH 5.0 solutions buffered with Homo-PIPES (145 mM NaCl, 5 mM KCl, 10 mM Homo-PIPES, 2 mM CaCl2, 1 mM MgCl2, 20 mM D-glucose) or with acetic acid (145 mM NaCl, 5 mM KCl, 10 mM acetic acid, 2 mM CaCl2, 1 mM MgCl2, 20 mM D-glucose). pHrodo Red was excited with 560 nm light and emission at 630 nm was detected using a U-N31004 Texas Red/Cy3.5 filter cube (Chroma Technologies), while Fura-2 AM was excited by with light of 340 nm and 380 nm and emission at 510 nm was detected with U-N71000aV2 FURA2 WM filter (Olympus). Images were acquired on a Hamamatsu digital CCD camera attached to an Olympus IX71 microscope using Simple PCI software. The pHrodo Red fluorescence intensity of each cell was normalized to its baseline fluorescence in pH 7.4 solution (F0) before the first acid application to give F/F0.
Immunohistochemistry (Related to Figure S1A)
Circumvallate (CV) taste tissue was dissected and incubated in 4% paraformaldehyde for 30 min at room temperature. The tissue was cryo-protected in 30% sucrose-PBS at 4 °C overnight, embedded in OCT compound, frozen at −80 °C, and sectioned at 14 μm. Sections of CV were permeabilized with 0.1% Triton X-100 in PBS for 10 min, blocked with BlockAid (Thermo Fisher Scientific) plus 0.1% Triton X-100 for 1 hour, incubated with primary antibodies at room temperature for 1 hour, secondary antibodies at room temperature for 1 hour, and mounted with ProLong® Gold Antifade Mountant with DAPI or ProLong® Diamond Antifade Mountant (Thermo Fisher Scientific). Primary antibodies used were chicken anti-GFP (1:1000, GFP-1020, Aves Labs), and guinea pig anti-TRPM5 [5] (1:500). Secondary antibodies were goat anti-chicken conjugated with Alexa Fluor 488 and goat anti-guinea pig conjugated with Alexa Fluor 405 (1:500, Thermo Fisher Scientific). Images were acquired with an Olympus Flouview 1000 confocal microscope.
Chorda tympani nerve recordings
Mice used for nerve recordings were anesthetized with urethane at 2g/kg (Sigma, U2500) and stabilized with a custom-made head holder. A tracheotomy was performed to allow the animal to breathe during the experiment. The chorda tympani nerve was approached from ventrally, severed near the tympanic bulla, and placed on a platinum-iridium wire electrode. A reference electrode was inserted into nearby muscle tissue. Nerve responses were elicited by applying taste solutions to the anterior tongue with a motorized pump (Mini-pump, variable flow; Fisher Scientific). Taste solutions included the following: NH4Cl 100mM (Fisher Scientific, A661), NaCl 200mM (Sigma, P4504), amiloride 100μM (Sigma, A-7410), saccharin 30mM (Sigma, S-1002), L-Glutamic acid monosodium salt hydrate (MSG) 300mM (SIGMA, G1626), inosine 5’-monophosphate (IMP) 0.5mM (Sigma, I-4625), quinine hydrochloride dihydrate 10mM (Sigma, Q1125), acetic acid 10mM (Fisher Scientific, BP2401) citric acid 10mM (Sigma, C0759), and HCl 10mM (Sigma, 258148). To measure the amiloride-insensitive portion of the chorda tympani NaCl response, amiloride was applied to the tongue for 10s before applying a NaCl + amiloride solution. To potentiate the effect of the umami stimulus MSG, IMP and MSG were applied in a single solution. Stimuli were applied for 20s, followed by 40s of water (ddH20) rinse. Nerve responses were amplified (P511; Grass Instruments), integrated over a time constant of 0.5s, and recorded with Acknowledge software (Biopac). To compare responses between different mice, integrated responses to each tastant were averaged for 20 s and normalized to the baseline, which was averaged for 5 s prior to each taste stimulus, as we have done previously [61].
Glossopharyngeal nerve recordings
Mice were anesthetized with urethane (Sigma, U2500) and placed on a heating pad to maintain body temperature. Anesthetized mice were held in supine position to expose ventral neck for skin incision. A small opening was made on the trachea to insert a plastic tube for unobstructed breathing. Hypoglossal nerve was transected bilaterally to minimize movement artifacts. Muscles and surrounding tissues were retracted to expose glossopharyngeal nerve. The nerve was cut near petrosal ganglion and placed on a hooked platinum-iridium wire electrode (767700, A-M Systems). A reference electrode was placed in nearby muscle. Halocarbon oil (Sigma, H8898) was applied on exposed nerve surface to prevent desiccation. Taste solutions were delivered to the posterior tongue through a plastic tube (PE60, Braintree Scientific) placed about 8mm into the oral cavity. Continuous flow of solutions (either taste stimuli or ddH2O) through the oral cavity was maintained at about 5ml/min under gravity flow. Taste solutions used for glossopharyngeal nerve recordings are: Saccharin 20mM (Sigma, 8.17042), L-Glutamic acid monosodium salt hydrate (MSG) 100mM (Sigma, G5889), inosine 5’-monophosphate (IMP) 1mM (Sigma, PHR1475), quinine hydrochloride dihydrate (QHCl) 0.3mM (Sigma, 1596807), NH4Cl 100mM (Sigma, 11209), NaCl 100mM (Sigma, S1679), acetic acid 10mM (Sigma, AX0073), citric acid 10mM (Sigma, 27109), and HCl 5mM (Sigma, 109057). Stimuli were applied for 20s, followed by at least 80s of post-stimulus ddH2O rinse. Nerve responses were detected using a Grass P511 amplifier, integrated using a custom-made RC integrator circuit (time constant=1.0s) and recorded with AcqKnowledge software. The recordings were analyzed in Matlab (MathWorks) using custom scripts. Size of taste response was calculated by subtracting area of 20s pre-stimulus baseline from area under the curve of 20s stimulus duration. Taste responses were normalized to the first 0.3mM QHCl response for comparison between mice
Two-bottle taste preference (related to Figure S3)
Two-bottle taste preference test were performed using methods similar to what has been described [62] except that chow was distributed on the floor of the cage to reduce side preferences. Drinking tubes were made of plastic serological pipettes that contained a spout at one end and a rubber stopper at the top. Mice were initially conditioned to drink from both tubes which were filled with dH2O for two days to ensure that they showed no sided-preference. For tests with acid solutions, one of the drinking tubes was filled with dH20 and the other tube contained dH2O in which the acid was added, with testing done in ascending order of concentration. Fluid consumption was measured by weighing the tubes.
To test the relative preference of HCl solutions to water, mice were presented with an HCl containing tube (1 – 30 mM) and another drinking tube containing dH2O. The location of these two tubes was exchanged 24 hours after the experiment began. The fluid consumptions in 0 – 24 h and 24 – 48 h from each tube were measured and averaged. The preference was calculated as the ratio of the averaged HCl solution intake to the averaged total fluid intake.
To test the relative preference of citric acid solution to water, mice were water deprived 16 hours before the experiment. On the experiment day, the mice were given a 30-minute presentation of citric acid solution and dH2O, then a 6-hour interval without water, and another 30-minute presentation of the solutions and water with locations exchanged. The fluid consumption of CA solutions and water were measured in each 30 minutes time window and averaged. The preference was then calculated as the ratio of the averaged CA solution intake to the averaged total fluid intake.
Quantification and statistical analysis
All data are presented as mean ± SEM unless otherwise noted. Statistical analysis (ANOVA or student’s t-test) were performed using Graphpad Prism (Graphpad Software Inc). Sample sizes in the present study are similar to those reported in the literature for similar studies. Representative data shown in the figures acquired with PClamp was in some cases decimated 10-fold before exporting into the graphics programs Origin (Microcal) and Coreldraw (Corel).
Data and code availability
Data are available from the Lead contact upon reasonable request.
Supplementary Material
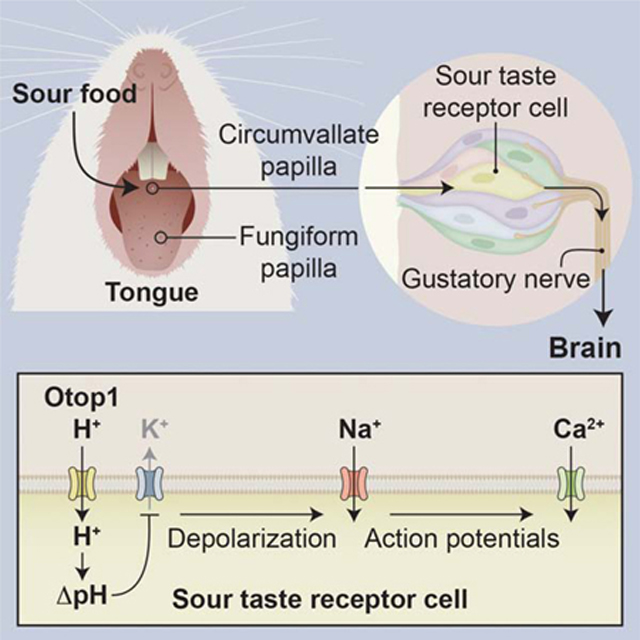
Figure 6. A model for sour taste transduction.

Left panel: Illustration showing the morphology of the taste bud in which a subset of taste receptors cells (pink) have Otop1 proton channels. Taste stimuli reach the taste cells through an apically located taste pore. Right panel: Illustration showing the sequence of events during transduction of acidic (sour) taste stimuli. In response to acid stimuli, H+ enters through Otop1 channels, leading to a lowering of intracellular pH, which blocks KIR2.1 inward rectifier K+ channels. The ensuing depolarization (ΔVm) opens voltage-gated Na+ channels and generates a train of action potentials (AP). Actions potentials open voltage-gated Ca2+ channels leading to neurotransmitter (NT) release onto afferent nerve fibers.
KEY RESOURCES TABLE
| REAGENT or RESOURCE | SOURCE | IDENTIFIER |
|---|---|---|
| Antibodies | ||
| Chicken anti-GFP | Aves Labs | Cat# GFP-1020 |
| Guinea pig anti-TRPM5 | [5] | N/A |
| Chemicals, Peptides, and Recombinant Proteins | ||
| Elastase | Worthington Biochemical | Cat# LS002290 |
| Dispase II | Sigma | Cat# D4693 |
| TransIT-LT1 transfection reagent | Mirus Bio Corporation | Cat# MIR2300 |
| Urethane | Sigam | Cat# U2500 |
| Saccharin | Sigma | Cat# 8.17042 |
| L-Glutamic acid monosodium salt hydrate (MSG) | Sigma | Cat# G5889 |
| inosine 5’-monophosphate (IMP) | Sigma | Cat# PHR1475 |
| quinine hydrochloride dihydrate (QHCl) | Sigma | Cat# 1596807 |
| amiloride | Sigma | Cat# A-7410 |
| Acetic acid | Sigma | Cat# Ax0073 |
| Citric acid | Sigma | Cat# 27109 |
| HCl | Sigma | Cat# 109057 |
| DIDS | Fisher Scientific | Cat# 45–235-0 |
| Fura, AM, cell permeant | ThermoFisher | Cat# F1221 |
| pHrodo red AM intracellular pH indicator | ThermoFisher | Cat# P35372 |
| Experimental Models: Cell Lines | ||
| HEK-293 cells | ATCC | Cat# CRL-1573 |
| Experimental Models: Organisms/Strains | ||
| Xenopus laevis oocytes | Ecocyte Bioscience | RRID:SCR_014773 |
| PKD2L1-YFP, Otop1em1Lmn | This paper | N/A |
| PKD2L1-YFP transgenic mice | [33] | N/A |
| Oligonucleotides | ||
| sgRNA for CRISPR-Cas9 mediated Otop1-KO mouse: CGCCGGGGACCGGAAGCTTG | This Paper | N/A |
| Whole exon 1 genotyping forward: GGAGCCAGGAGCAACGTGC | IDT | N/A |
| Whole exon 1 genotyping reverse: CTGCTCAGAGTCTCCGCCAGC | IDT | N/A |
| WT-specific allele genotyping forward: TGGAGGAGAGCAGGATCTGAGG | IDT | N/A |
| WT-specific allele genotyping reverse: AGTCTCCGCCAGCTTCTGCG | IDT | N/A |
| Mutant (−38)-specific allele genotyping forward: TGGAGGAGAGCAGGATCTGAGG | IDT | N/A |
| Mutant (−38)-specific allele genotyping reverse: GTCTCCGCCAGCTTCTGGA | IDT | N/A |
| Recombinant DNA | ||
| pGEMHE vector | [59] | N/A |
| pcDNA3.1_Otop1 | [34] | N/A |
| pX330-U6-Chimeric_BB-CBh-hSpCas9 | Addgene | Cat# 42230 |
| Software and Algorithms | ||
| pClamp and clampfit | Molecular devices | RRID:SCR_011323 |
| GraphPad Prism 7 or 8 | GraphPad | RRID:SCR_002798 |
| Origin | OriginLab corporation | RRID:SCR_002815 |
| Matlab | Mathworks | RRID:SCR_001622 |
| AcqKnowledge Software | BIOPAC | RRID:SCR_014279 |
| CorelDraw | Corel | RRID:SCR_014235 |
| SimplePCI | HCImage | https://hcimage.com/simple-pci-legacy/ |
Highlights.
Genetic inactivation of Otop1 in mice eliminates proton currents in taste cells
Otop1-KO mice have severely attenuated cellular responses to acids
Otop1-KO mice have severely attenuated gustatory nerve responses to acids
Otop1 is a sour taste receptor
Acknowledgments
We thank Aurelie Vandenbeuch for training N.R.J in GL recording, Josh Kaplan for performing oocyte electrophysiology, Nancy Wu and the USC/Norris Cancer Center Transgenic/Knockout Rodent Core for generation of the mouse knockout lines, Daniel Artiga for performing mouse behavior experiments, Brendon Chou and Kyndal Schade for expert assistance managing mouse colonies and Tom Finger, Don Arnold and all members of the Liman and Kinnamon labs for helpful discussions. Nancy Gough and Heather McDonald (BioSerendipity) provided expert editorial support and generated artwork used in the graphical abstract. This work was supported by NIH grants R01 DC013741 to E.R.L, R01 DC012555 to S.C.K., F31 DC015700 to C.W. N.R.J. was supported by DP1 AT009497 and the Howard Hughes Medical Institute.
Footnotes
Declaration of Interests
The authors declare no competing interests.
Publisher's Disclaimer: This is a PDF file of an unedited manuscript that has been accepted for publication. As a service to our customers we are providing this early version of the manuscript. The manuscript will undergo copyediting, typesetting, and review of the resulting proof before it is published in its final form. Please note that during the production process errors may be discovered which could affect the content, and all legal disclaimers that apply to the journal pertain.
References
- 1.Liman ER, Zhang YV, and Montell C (2014). Peripheral coding of taste. Neuron 81, 984–1000. [DOI] [PMC free article] [PubMed] [Google Scholar]
- 2.Roper SD, and Chaudhari N (2017). Taste buds: cells, signals and synapses. Nat Rev Neurosci 18, 485–497. [DOI] [PMC free article] [PubMed] [Google Scholar]
- 3.Margolskee RF (2002). Molecular mechanisms of bitter and sweet taste transduction. J Biol Chem 277, 1–4. [DOI] [PubMed] [Google Scholar]
- 4.Chandrashekar J, Hoon MA, Ryba NJ, and Zuker CS (2006). The receptors and cells for mammalian taste. Nature 444, 288–294. [DOI] [PubMed] [Google Scholar]
- 5.Zhang Z, Zhao Z, Margolskee R, and Liman E (2007). The transduction channel TRPM5 is gated by intracellular calcium in taste cells. J Neurosci 27, 5777–5786. [DOI] [PMC free article] [PubMed] [Google Scholar]
- 6.Kretz O, Barbry P, Bock R, and Lindemann B (1999). Differential expression of RNA and protein of the three pore-forming subunits of the amiloride-sensitive epithelial sodium channel in taste buds of the rat. J Histochem Cytochem 47, 51–64. [DOI] [PubMed] [Google Scholar]
- 7.Vandenbeuch A, Clapp TR, and Kinnamon SC (2008). Amiloride-sensitive channels in type I fungiform taste cells in mouse. BMC Neurosci 9, 1. [DOI] [PMC free article] [PubMed] [Google Scholar]
- 8.Chandrashekar J, Kuhn C, Oka Y, Yarmolinsky DA, Hummler E, Ryba NJ, and Zuker CS (2010). The cells and peripheral representation of sodium taste in mice. Nature 464, 297–301. [DOI] [PMC free article] [PubMed] [Google Scholar]
- 9.Oka Y, Butnaru M, von Buchholtz L, Ryba NJ, and Zuker CS (2013). High salt recruits aversive taste pathways. Nature 494, 472–475. [DOI] [PMC free article] [PubMed] [Google Scholar]
- 10.Lewandowski BC, Sukumaran SK, Margolskee RF, and Bachmanov AA (2016). Amiloride-Insensitive Salt Taste Is Mediated by Two Populations of Type III Taste Cells with Distinct Transduction Mechanisms. J Neurosci 36, 1942–1953. [DOI] [PMC free article] [PubMed] [Google Scholar]
- 11.Roebber JK, Roper SD, and Chaudhari N (2019). The role of the anion in salt (NaCl) detection by mouse taste buds. J Neurosci. [DOI] [PMC free article] [PubMed] [Google Scholar]
- 12.Pfaffmann C (1955). Gustatory nerve impulses in rat, cat and rabbit. J Neurophysiol 18, 429–440. [DOI] [PubMed] [Google Scholar]
- 13.Frank ME (1991). Taste-responsive neurons of the glossopharyngeal nerve of the rat. J Neurophysiol 65, 1452–1463. [DOI] [PubMed] [Google Scholar]
- 14.Frank ME, Contreras RJ, and Hettinger TP (1983). Nerve fibers sensitive to ionic taste stimuli in chorda tympani of the rat. J Neurophysiol 50, 941–960. [DOI] [PubMed] [Google Scholar]
- 15.Ninomiya Y, Tonosaki K, and Funakoshi M (1982). Gustatory neural response in the mouse. Brain Res 244, 370–373. [DOI] [PubMed] [Google Scholar]
- 16.Frank ME, and Blizard DA (1999). Chorda tympani responses in two inbred strains of mice with different taste preferences. Physiol Behav 67, 287–297. [DOI] [PubMed] [Google Scholar]
- 17.Huang AL, Chen X, Hoon MA, Chandrashekar J, Guo W, Trankner D, Ryba NJ, and Zuker CS (2006). The cells and logic for mammalian sour taste detection. Nature 442, 934–938. [DOI] [PMC free article] [PubMed] [Google Scholar]
- 18.Ishimaru Y, Inada H, Kubota M, Zhuang H, Tominaga M, and Matsunami H (2006). Transient receptor potential family members PKD1L3 and PKD2L1 form a candidate sour taste receptor. Proc Natl Acad Sci U S A 103, 12569–12574. [DOI] [PMC free article] [PubMed] [Google Scholar]
- 19.Clapp TR, Medler KF, Damak S, Margolskee RF, and Kinnamon SC (2006). Mouse taste cells with G protein-coupled taste receptors lack voltage-gated calcium channels and SNAP-25. BMC Biol 4, 7. [DOI] [PMC free article] [PubMed] [Google Scholar]
- 20.DeFazio RA, Dvoryanchikov G, Maruyama Y, Kim JW, Pereira E, Roper SD, and Chaudhari N (2006). Separate populations of receptor cells and presynaptic cells in mouse taste buds. J Neurosci 26, 3971–3980. [DOI] [PMC free article] [PubMed] [Google Scholar]
- 21.Huang YA, Maruyama Y, Stimac R, and Roper SD (2008). Presynaptic (Type III) cells in mouse taste buds sense sour (acid) taste. J Physiol 586, 2903–2912. [DOI] [PMC free article] [PubMed] [Google Scholar]
- 22.Kataoka S, Yang R, Ishimaru Y, Matsunami H, Sevigny J, Kinnamon JC, and Finger TE (2008). The candidate sour taste receptor, PKD2L1, is expressed by type III taste cells in the mouse. Chem Senses 33, 243–254. [DOI] [PMC free article] [PubMed] [Google Scholar]
- 23.Yoshida R, Miyauchi A, Yasuo T, Jyotaki M, Murata Y, Yasumatsu K, Shigemura N, Yanagawa Y, Obata K, Ueno H, et al. (2009). Discrimination of taste qualities among mouse fungiform taste bud cells. J Physiol 587, 4425–4439. [DOI] [PMC free article] [PubMed] [Google Scholar]
- 24.Nelson TM, Lopezjimenez ND, Tessarollo L, Inoue M, Bachmanov AA, and Sullivan SL (2010). Taste function in mice with a targeted mutation of the pkd1l3 gene. Chem Senses 35, 565–577. [DOI] [PMC free article] [PubMed] [Google Scholar]
- 25.Horio N, Yoshida R, Yasumatsu K, Yanagawa Y, Ishimaru Y, Matsunami H, and Ninomiya Y (2011). Sour taste responses in mice lacking PKD channels. PLoS One 6, e20007. [DOI] [PMC free article] [PubMed] [Google Scholar]
- 26.Stewart RE, Lyall V, Feldman GM, Heck GL, and DeSimone JA (1998). Acid-induced responses in hamster chorda tympani and intracellular pH tracking by taste receptor cells. Am J Physiol 275, C227–238. [DOI] [PubMed] [Google Scholar]
- 27.Lyall V, Alam RI, Phan DQ, Ereso GL, Phan TH, Malik SA, Montrose MH, Chu S, Heck GL, Feldman GM, et al. (2001). Decrease in rat taste receptor cell intracellular pH is the proximate stimulus in sour taste transduction. Am J Physiol Cell Physiol 281, C1005–1013. [DOI] [PubMed] [Google Scholar]
- 28.Richter TA, Caicedo A, and Roper SD (2003). Sour taste stimuli evoke Ca2+ and pH responses in mouse taste cells. J Physiol 547, 475–483. [DOI] [PMC free article] [PubMed] [Google Scholar]
- 29.Lin W, Burks CA, Hansen DR, Kinnamon SC, and Gilbertson TA (2004). Taste receptor cells express pH-sensitive leak K+ channels. J Neurophysiol 92, 2909–2919. [DOI] [PubMed] [Google Scholar]
- 30.Kinnamon SC, Dionne VE, and Beam KG (1988). Apical localization of K+ channels in taste cells provides the basis for sour taste transduction. Proc Natl Acad Sci U S A 85, 7023–7027. [DOI] [PMC free article] [PubMed] [Google Scholar]
- 31.Ye W, Chang RB, Bushman JD, Tu YH, Mulhall EM, Wilson CE, Cooper AJ, Chick WS, Hill-Eubanks DC, Nelson MT, et al. (2016). The K+ channel KIR2.1 functions in tandem with proton influx to mediate sour taste transduction. Proc Natl Acad Sci U S A 113, E229–238. [DOI] [PMC free article] [PubMed] [Google Scholar]
- 32.DeSimone JA, Lyall V, Heck GL, and Feldman GM (2001). Acid detection by taste receptor cells. Respir Physiol 129, 231–245. [DOI] [PubMed] [Google Scholar]
- 33.Chang RB, Waters H, and Liman ER (2010). A proton current drives action potentials in genetically identified sour taste cells. Proc Natl Acad Sci U S A 107, 22320–22325. [DOI] [PMC free article] [PubMed] [Google Scholar]
- 34.Tu YH, Cooper AJ, Teng B, Chang RB, Artiga DJ, Turner HN, Mulhall EM, Ye W, Smith AD, and Liman ER (2018). An evolutionarily conserved gene family encodes proton-selective ion channels. Science 359, 1047–1050. [DOI] [PMC free article] [PubMed] [Google Scholar]
- 35.Bushman JD, Ye W, and Liman ER (2015). A proton current associated with sour taste: distribution and functional properties. FASEB J 29, 3014–3026. [DOI] [PMC free article] [PubMed] [Google Scholar]
- 36.Kim E, Hyrc KL, Speck J, Salles FT, Lundberg YW, Goldberg MP, Kachar B, Warchol ME, and Ornitz DM (2011). Missense mutations in Otopetrin 1 affect subcellular localization and inhibition of purinergic signaling in vestibular supporting cells. Mol Cell Neurosci 46, 655–661. [DOI] [PMC free article] [PubMed] [Google Scholar]
- 37.Jinek M, Chylinski K, Fonfara I, Hauer M, Doudna JA, and Charpentier E (2012). A programmable dual-RNA-guided DNA endonuclease in adaptive bacterial immunity. Science 337, 816–821. [DOI] [PMC free article] [PubMed] [Google Scholar]
- 38.Cong L, and Zhang F (2015). Genome engineering using CRISPR-Cas9 system. Methods Mol Biol 1239, 197–217. [DOI] [PubMed] [Google Scholar]
- 39.Ornitz DM, Bohne BA, Thalmann I, Harding GW, and Thalmann R (1998). Otoconial agenesis in tilted mutant mice. Hear Res 122, 60–70. [DOI] [PubMed] [Google Scholar]
- 40.Wilson CE, Finger TE, and Kinnamon SC (2017). Type III Cells in Anterior Taste Fields Are More Immunohistochemically Diverse Than Those of Posterior Taste Fields in Mice. Chem Senses 42, 759–767. [DOI] [PMC free article] [PubMed] [Google Scholar]
- 41.Wang YY, Chang RB, Allgood SD, Silver WL, and Liman ER (2011). A TRPA1-dependent mechanism for the pungent sensation of weak acids. J Gen Physiol 137, 493–505. [DOI] [PMC free article] [PubMed] [Google Scholar]
- 42.Finger TE, Danilova V, Barrows J, Bartel DL, Vigers AJ, Stone L, Hellekant G, and Kinnamon SC (2005). ATP signaling is crucial for communication from taste buds to gustatory nerves. Science 310, 1495–1499. [DOI] [PubMed] [Google Scholar]
- 43.Zocchi D, Wennemuth G, and Oka Y (2017). The cellular mechanism for water detection in the mammalian taste system. Nat Neurosci 20, 927–933. [DOI] [PubMed] [Google Scholar]
- 44.Bachmanov AA, Tordoff MG, and Beauchamp GK (1996). Ethanol consumption and taste preferences in C57BL/6ByJ and 129/J mice. Alcohol Clin Exp Res 20, 201–206. [DOI] [PMC free article] [PubMed] [Google Scholar]
- 45.Harvey RB (1920). The relation between the total acidity, the concentration of the hydrogen ion, and the taste of acid solutions. Journal of the American Chemical Society 42, 712–714. [Google Scholar]
- 46.Roper SD (2007). Signal transduction and information processing in mammalian taste buds. Pflugers Arch 454, 759–776. [DOI] [PMC free article] [PubMed] [Google Scholar]
- 47.Inada H, Kawabata F, Ishimaru Y, Fushiki T, Matsunami H, and Tominaga M (2008). Off-response property of an acid-activated cation channel complex PKD1L3-PKD2L1. EMBO Rep 9, 690–697. [DOI] [PMC free article] [PubMed] [Google Scholar]
- 48.Kawaguchi H, Yamanaka A, Uchida K, Shibasaki K, Sokabe T, Maruyama Y, Yanagawa Y, Murakami S, and Tominaga M (2010). Activation of polycystic kidney disease-2-like 1 (PKD2L1)-PKD1L3 complex by acid in mouse taste cells. J Biol Chem 285, 17277–17281. [DOI] [PMC free article] [PubMed] [Google Scholar]
- 49.Holzer P (2009). Acid-sensitive ion channels and receptors. Handb Exp Pharmacol, 283–332. [DOI] [PMC free article] [PubMed] [Google Scholar]
- 50.Richter TA, Dvoryanchikov GA, Chaudhari N, and Roper SD (2004). Acid-sensitive two-pore domain potassium (K2P) channels in mouse taste buds. J Neurophysiol 92, 1928–1936. [DOI] [PubMed] [Google Scholar]
- 51.Wu A, Dvoryanchikov G, Pereira E, Chaudhari N, and Roper SD (2015). Breadth of tuning in taste afferent neurons varies with stimulus strength. Nat Commun 6, 8171. [DOI] [PMC free article] [PubMed] [Google Scholar]
- 52.Ohla K, Yoshida R, Roper SD, Di Lorenzo PM, Victor JD, Boughter JD, Fletcher M, Katz DB, and Chaudhari N (2019). Recognizing Taste: Coding Patterns Along the Neural Axis in Mammals. Chem Senses 44, 237–247. [DOI] [PMC free article] [PubMed] [Google Scholar]
- 53.Oka Y, Butnaru M, von Buchholtz L, Ryba NJ, and Zuker CS High salt recruits aversive taste pathways. Nature 494, 472–475. [DOI] [PMC free article] [PubMed] [Google Scholar]
- 54.Charlu S, Wisotsky Z, Medina A, and Dahanukar A (2013). Acid sensing by sweet and bitter taste neurons in Drosophila melanogaster. Nat Commun 4, 2042. [DOI] [PMC free article] [PubMed] [Google Scholar]
- 55.Chen Y, and Amrein H (2017). Ionotropic Receptors Mediate Drosophila Oviposition Preference through Sour Gustatory Receptor Neurons. Curr Biol 27, 2741–2750 e2744. [DOI] [PMC free article] [PubMed] [Google Scholar]
- 56.Ahn JE, Chen Y, and Amrein H (2017). Molecular basis of fatty acid taste in Drosophila. Elife 6. [DOI] [PMC free article] [PubMed] [Google Scholar]
- 57.Rimal S, Sang J, Poudel S, Thakur D, Montell C, and Lee Y (2019). Mechanism of Acetic Acid Gustatory Repulsion in Drosophila. Cell Rep 26, 1432–1442 e1434. [DOI] [PMC free article] [PubMed] [Google Scholar]
- 58.Saotome K, Teng B, Tsui CCA, Lee WH, Tu YH, Kaplan JP, Sansom MSP, Liman ER, and Ward AB (2019). Structures of the otopetrin proton channels Otop1 and Otop3. Nat Struct Mol Biol 26, 518–525. [DOI] [PMC free article] [PubMed] [Google Scholar]
- 59.Liman ER, Tytgat J, and Hess P (1992). Subunit stoichiometry of a mammalian K+ channel determined by construction of multimeric cDNAs. Neuron 9, 861–871. [DOI] [PubMed] [Google Scholar]
- 60.Faria D, Rock JR, Romao AM, Schweda F, Bandulik S, Witzgall R, Schlatter E, Heitzmann D, Pavenstadt H, Herrmann E, et al. (2014). The calcium-activated chloride channel Anoctamin 1 contributes to the regulation of renal function. Kidney Int 85, 1369–1381. [DOI] [PubMed] [Google Scholar]
- 61.Larson ED, Vandenbeuch A, Voigt A, Meyerhof W, Kinnamon SC, and Finger TE (2015). The Role of 5-HT3 Receptors in Signaling from Taste Buds to Nerves. J Neurosci 35, 15984–15995. [DOI] [PMC free article] [PubMed] [Google Scholar]
- 62.Bachmanov AA, Reed DR, Beauchamp GK, and Tordoff MG (2002). Food intake, water intake, and drinking spout side preference of 28 mouse strains. Behav Genet 32, 435–443. [DOI] [PMC free article] [PubMed] [Google Scholar]
Associated Data
This section collects any data citations, data availability statements, or supplementary materials included in this article.
Supplementary Materials
Data Availability Statement
Data are available from the Lead contact upon reasonable request.