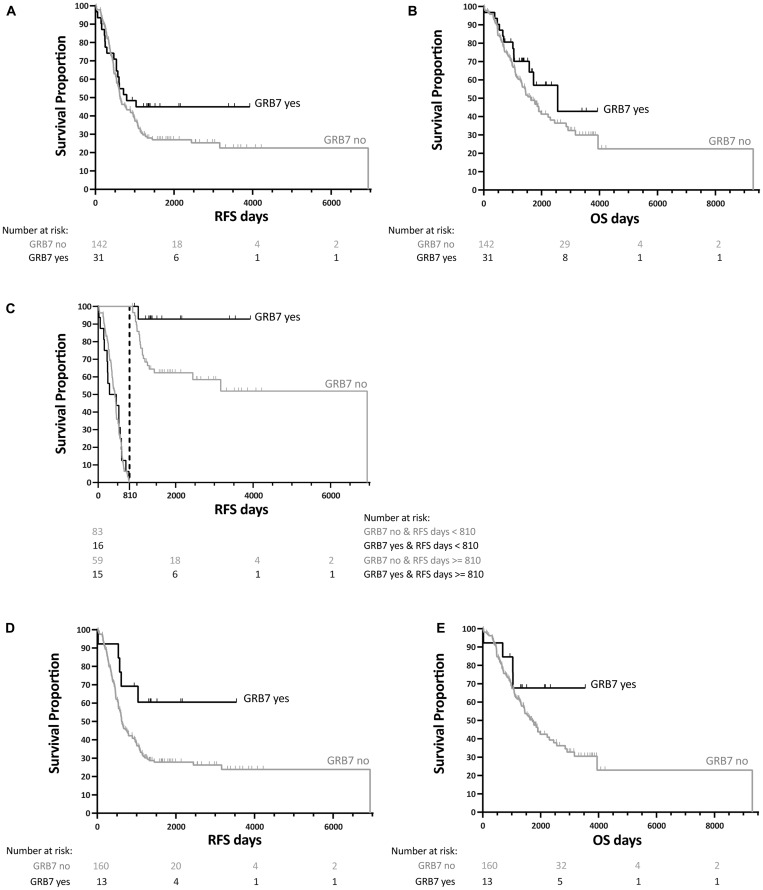
Figure 5. Kaplan-Meier survival analysis for GRB7 membrane-associated staining from 173 patients with ovarian cancer.
(A) Recurrence Free Survival (RFS) and (B) Overall Survival (OS) curves for each patient showing GRB7 membrane-associated expression shown as yes (black curve)/no (gray curve) for each patient). (C) Landmark analysis for RFS (shown in (A) using 810 days (27 months) as the cut off mark (dotted lined). (D) RFS and (E) OS curves for patients with at least two out of three tissue cores with GRB7 membrane-associated expression (black curve) vs. one or no GRB7 membrane-associated expression (gray curve). All survival curves were generated after dichotomization of GRB7 membrane-associated expression (black curves, “GRB7 yes”) or no GRB7 membrane-associated expression (gray curve, “GRB7 no”), obtained by IHC. p-values were calculated by log-rank tests.

