Abstract
Engineered repeat proteins have proven to be a fertile ground for studying the competition between folding, misfolding and transient aggregation of tethered protein domains. We examine the interplay between folding and inter-domain interactions of engineered FiP35 WW domain repeat proteins with n = 1 through 5 repeats. We characterize protein expression, thermal and guanidium melts, as well as laser T-jump kinetics. All experimental data is fitted by a global fitting model with two states per domain (U, N), plus a third state M to account for non-native states due to domain interactions present in all but the monomer. A detailed structural model is provided by coarse-grained simulated annealing using the AWSEM Hamiltonian. Tethered FiP35 WW domains with n=2 and 3 domains are just slightly less stable than the monomer. The n=4 oligomer is yet less stable, its expression yield is much lower than the monomer’s, and depends on the purification tag used. The n=5 plasmid did not express at all, indicating the sudden onset of aggregation past n=4. Thus, tethered FiP35 has a critical nucleus size for inter-domain aggregation of n ≈ 4. According to our simulations, misfolded structures become increasingly prevalent as one proceeds from monomer to pentamer, with extended inter-domain beta sheets appearing first, then multi-sheet ‘intramolecular amyloid’ structures, and finally novel motifs containing alpha helices. We discuss the implications of our results for oligomeric aggregate formation and structure, transient aggregation of proteins whilst folding, as well as for protein evolution that starts with repeat proteins.
1. Introduction
An important question in protein dynamics is how proteins manage to fold in the presence of many other biomolecules with which they could interact instead inside the cell.1 For example, it has been discussed extensively how proteins can transiently aggregate during their folding process, thus mimicking the existence of monomeric folding intermediates.2
Repeat proteins are particularly interesting subjects for studying the interplay between folding and aggregation.3 The proximity of tethered domains with identical or near-identical folds enhances protein-protein interactions.4,5 It was shown by Borgia et al. for immunoglobulin-like oligomeric repeats that identical neighbors transiently misfold more readily than neighbors of lower sequence identity.6,7 Thus evolutionary pressure reduces sequence similarity between adjacent repeat domains, and many natural repeat proteins contain folds that do not interact too strongly. Such sequences can also be engineered: the energy landscape of some ankyrin repeat proteins, especially of consensus8 sequences, enables parallel folding of the domains.9 We showed in our study of identical tethered repeats of protein U1A that increasing the number of repeat units increases transient aggregation relative to folding, until a well-defined nucleus for oligomeric aggregate formation is reached.10,11 Javadi and Main observed similar frustration when increasing repeat number of the helical tetratricopeptide from 2 to 10,12 and the energy landscape model can explain such frustration.13,14 There is also structural information about misfolded states of repeat proteins. For example, immunoglobulin-like repeats15 can form long-lived domain-swapped structure, and transient ‘intramolecular amyloids’ as previously postulated for lambda repressor fragment experimentally16 and for other proteins computationally.17 The computational study by Tian and Best18 rationalizes domains-swapping as a late-stage process during (mis)folding.
Although there may be evolutionary pressure against repeat proteins due to inter-domain aggregation, in addition to titin,6 IκB,5 and other ankyrins,9,19 repeats occur for many other natural proteins.20 For example, tandem repeats of WW domains improve cell regulation. Schueler-Furman and co-workers published a detailed overview on how WW tandem repeat modules facilitate fine-tuning of regulation inside cells.21 Possible ways include: 1) Repeat domains contribute to an overall increase in binding affinity. 2) One domain assists the binding of another (chaperone effect) 3) Adjacent WW domains can change the dynamics and stability of the neighboring domain. The vital role in cellular regulation of the family of tandem repeat WW domains provides additional motivation to investigate such a system in mechanistic detail.
Here we study the competition between folding and transient (or permanent) aggregation of engineered WW domain oligomers, with n = 1–5 domains tethered by short serine-glycine sequences. We chose “GS linkers” because they have been well characterized, are highly soluble, and allow monomers to interact.22 Experimentally, we study how increasing numbers of repeats affect expression levels, secondary structure, and transient misfolding. We find that at n = 4, misfolded oligomers strongly compete with native folding, and that n = 5 represents a hard limit for expression under our experimental conditions. The results are well-modeled by a global fit to a domain-state model. We complement the experiments and domain-state model with coarse-grained simulated annealing simulations to obtain structural information about the misfolded oligomers. A variety of interesting structures emerges, from individual misfolded domains, to chimeric misfolds (where two proteins intermingle), to entirely new beta-sheet structures, and finally even to alpha-helical structures that bear no resemblance to the original domains making up the oligomer.
2. Methods
2.1. Protein sample preparation
We studied monomer to pentamer repeat sequences of FiP35 WW domain, each domain unit being separated by a 10-residue glycine-serine flexible linker. The leader (after cutting the hexa-histidine tag), monomer and linker sequences are
HM + KLPPGWEKRMSRDGRVYYFNHITNASQFERPSG + GGSGGSGGSG
Table S1 in the Supplementary Information section 1 shows the full sequences. The dimer through tetramer were cloned into pDream (GenScript) and expressed in BL21 (DE3)-RIPL E. coli (Agilent) cells. The constructs were purified on a Ni-NTA column using the His-tag via the same protocol previously used for His-tagged U1A oligomers.11
For comparison, the monomer and tetramer were also expressed as fusion proteins with a Glutathione-S-transferase (GST) tag and a thrombin cleavage site for purification as described previously.23 A non-dimerizing GST tag (Genscript) was used, although residual interactions may persist. The fusion protein was captured and purified from the cell extract on an immobilized glutathione resin according to manufacturer’s guidelines (GenScript): The protein was eluted by 10 mM glutathione in 50 mM Tris-HCl pH 8.0 and followed by dialysis in 10 mM sodium phosphate buffer. The purification tag was cleaved by overnight incubation with biotinylated thrombin (EMD Millipore). Thrombin was removed by incubation with streptavidin-agarose resin (EMD Millipore) according to manufacturer’s protocol. The monomer was purified from cleaved GST via an ultrafiltration cell with 10 kDa cutoff membrane (Millipore). Due to comparable size of GST and QFiP35, their separation was performed by passing the cleaved protein solution through a gravity column with immobilized glutathione resin.
The presence of a single tryptophan on the first β-strand (loop or hairpin 1) of each WW domain enabled monitoring of folding via fluorescence. The pentamer could not be expressed in sufficient yield for experiments.
2.2. Temperature unfolding thermodynamics
Fluorescence spectroscopy was carried out using a JASCO fluorescence spectrophotometer FP-8300 equipped with programmable temperature control and excitation and emission slit widths at 5 nm wavelength resolution. Temperature denaturation of all constructs was measured by exciting tryptophan fluorescence at 280 nm and measuring the fluorescence wavelength shift. The tryptophan fluorescence peak red-shifts as the sidechain is exposed to a more polar solvent environment. We analyze wavelength shift because it is less dependent on quantum yield or concentration than fluorescence intensity. For each fluorescence emission spectrum, the average wavelength was calculated by equation (1) where I is intensity and λ wavelength:24
| (1) |
The average wavelength tracks the fluorescence peak wavelength as long as the same wavelength range is used consistently, but provides higher signal-to-noise ratio because it utilizes the full fluorescence spectrum, rather than just fitting a few points near the peak of the spectrum. The same wavelength range of 290 to 450 nm was used in all calculations to obtain consistent results. Temperature cycling of 40 μM protein solution from 20 °C to 90 °C and back, with or without GuHCl, produced very similar results as 1 μM solutions, recovering within ca. 3 nm. Thus there is inter-domain aggregation at 90 °C, but no concentration-dependent intermolecular aggregation up to 40 μM.
Circular dichroism was measured using a JASCO spectrophotometer with Peltier temperature control (JASCO Inc, Easton MD). All spectra were recorded from 250 – 200 nm at a scan rate of 50 nm/min with 1 nm resolution and are an average of 5 accumulations. We used a 1 mm path length quartz cuvette and, unless otherwise noted, at a protein concentration of 10 µM.
All thermal denaturation signals S(T) in absence of denaturant were fitted to a two-state model for temperature denaturation
| (2a) |
| (2b) |
to obtain the denaturation midpoints with respect to temperature (Tm). Different values of gT and Tm are obtained at different denaturant concentrations, and this is reflected in the global fit described in section 2.5.
2.3. Temperature jump kinetics
Laser temperature jumps were carried out using a Surelite Q-switched Nd:YAG laser (Continuum Inc., Santa Clara, CA), with details of the instrument mentioned elsewhere25,26. The jump size was 5–6 °C. The exact size of the jump was calibrated by comparing the fluorescence decays f of tryptophan (300 µM solution) after the jump with the corresponding decay at an equilibrium temperature several degrees higher. Fluorescence decays were excited at 280 nm by a tripled, mode-locked Ti:sapphire laser every 12.5 ns for a total of 1 ms. The temperature jump was set to occur 153.75 µs after the oscilloscope was triggered to start data collection. The sampling frequency was 10 Giga-samples per second. Thus, each fluorescence decay was sampled at 100 picosecond intervals, or 125 times before the next decay was excited. The signal was usually 50–60 mV. Sample concentration was 40 µM for all of the proteins. At this concentration the thermal denaturation was reversible.
2.4. Kinetics analysis
Kinetics data were analyzed using MATLAB (Mathworks Inc., Natick, MA) and IGOR Pro (Wavemetrics Inc., Lake Oswego, OR). A fluorescence decay f(t) was collected every 12.5 ns. 100 of these were binned into intervals of 1.25 µs. Thus, the protein kinetics could be followed with 1.25 µs time resolution. We assumed a two-state kinetic model, which fitted the data within uncertainty. The decays f(t) were fitted to a linear combination of the decay f1 averaged between 153.75 and 28.75 µs before the T-jump, and the decay f2 averaged over the final 125 µs of data collection, where the protein had equilibrated: f(t) = a1(t) f1 + a2(t) f2. The relative lifetime shift as a function of time is χ(t) = a1(t)/[a1(t) + a2(t)], irrespective of how a1 and a2 are normalized. The χ(t) traces were fitted using the domain-state model described next.
2.5. Global fitting model with a misfolded state representing domain interaction
Unlike U1A, which is prone to aggregation at > 1 μM protein concentration,11 WW domain monomer MFiP35 is a fast folder that can be studied at >100 μM concentration. In addition to its native state N and unfolded state U, WW domain has only very short-lived (μs) on-pathway intermediates (one or the other hairpin folded).27 Therefore domain interactions are weak, and we hypothesize that they can be accounted for by an additive free energy model with an extra state “M” added to represent non-native structure caused by domain interactions.
Our goal was to build a minimalist kinetic network model that can fit all measured equilibrium (temperature+denaturant) melts and kinetics data for all n-mers simultaneously. Each n-mer is modeled at the level of states for each individual domain. For example, the tetramer QFiP35 is represented as “XXXX”. At a minimum, each domain “X” can attain one of the two forms: N (native) and U (unfolded). For all proteins except the monomer (Figure 1 left), when domains interact a third state M accounts for misfolded states due to domain interaction. The model does not explicitly treat which domains are interacting to put a domain in state M. Inter-domain interaction is judged by how well a two-state model (only states N and U for each domain) fits the data compared to the full model (extra state M to account for misfolding due to domain interactions except for the monomer).
Fig. 1:
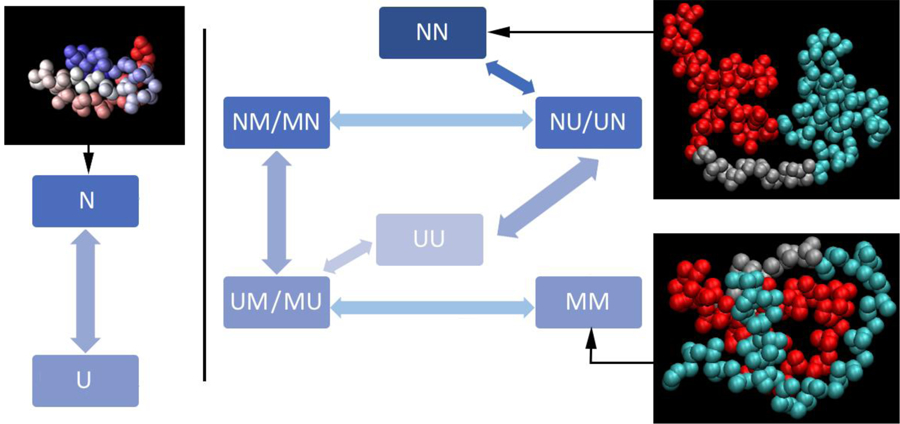
Left: native structure and fitting model for the monomer. Middle and right: global fitting model and structures for the dimer. The allowed interconversions between the various species are shown using arrows. The kinetic model only flips one domain at a time, i.e. the model assumes that there are no simultaneous double transitions. Representative structures of the NN and MM states are from the coarse-grained simulations.
The coupling between domains is thus implicit in pathways involving state M, such as those shown in Figure 1 (middle and right).; i.e., if all the reaction paths were possible, and the model explicitly had coupling between domains, the most probable paths would be the ones shown in Figure 1. Hence, our data fitting model uses population of the state M, instead of explicit interaction terms between N and U, to treat inter-domain interaction and the resulting non-native states. Our coarse-grained annealing simulations (sections 2.6–2.8 and 3.6–3.10), which explicitly contain inter-domain interactions, provide more insight into what a state such as “NMM” actually might look like.
The equilibrium population of each n-mer state as a function of temperature and denaturant concentration was calculated from the additive free energy function
| (3) |
The terms in the free energy equation are defined as follows:
#N, #M and #U equals the number of N, M, and U domains present
Tm is the melting temperature of native domains in absence of denaturant or intermediates
gUN is the thermal free energy derivative (folded domain relative to unfolded domain)
mUN is the corresponding denaturant free energy derivative
gUM is the thermal free energy derivative (misfolded domain relative to unfolded domain)
mUM is the corresponding denaturant free energy derivative
g(0)UM is the free energy of M relative to U at T=Tm and no denaturant
Supplementary Information section 2 provides more details. The global model does not contain an explicit domain-domain interaction term, so the size-dependence of these interactions is included only in the term ~ #M, which scales linearly with #M.
The experimental fluorescence thermal melts did not show two separate step-wise transitions, only shifts of stability that could not be accounted for by only two states per domain. Hence our global model made the simplest assumption consistent with the data: the misfolded state’s fluorescence signal (SM) was assumed to be an average of the folded (SF) and unfolded signals (SU). This is a reasonable assumption: our experimentally observed signal is tryptophan fluorescence, and that residue is most buried in the folded state, least buried in the unfolded state, whereas the coarse-grained annealing simulations (see 2.6) show intermediate solvent exposure of the tryptophan in most of the modeled misfolded states. Picking other intermediate state signals SM affects the precise populations of intermediate states, but not the general conclusions from our model.
Kinetics were similarly modeled by inclusion of two free energy barriers in the global fitting model. In order for the model to mimic the T-jump relaxation experiments, we first equilibrated the system at the initial temperature to obtain relative concentrations of all the species. With those initial concentrations, the temperature was then set to its final value and the kinetic master equation was solved to obtain the time-dependent population relaxation of each n-mer state. Similar types of models have been reported earlier for fitting experimental relaxation kinetics data.23,25,27,28
2.6. Coarse-grained AWSEM simulations
The tethered WW-domains were computationally simulated using the Associative memory, Water mediated, Structure and Energy Model (AWSEM)29. The model predicts structures and helps understand the competition between folding and inter-domain interactions by providing polymeric insights into the formation of contacts according to physico-chemical features of protein residues (sample structures in Figure 1).
AWSEM is a coarse-grained protein model with transferable energy functions that have been optimized to predict tertiary structures of globular proteins. AWSEM has been used in globular protein structure prediction, binding predictions of protein dimers, and amyloid fibril formation, through simulated annealing.13,30–32 The AWSEM potential is a combination of both knowledge-based and physics-based terms. It uses a three-bead per amino-acid coarse-graining (Cα, Cβ, and O atoms) that generates the coordinates of other heavy atoms along a backbone. It includes independent and cooperative hydrogen bonding, water-mediated tertiary interactions, and biasing local structural preferences based on short fragment memories. Although AWSEM lacks atomistic resolutions, this model is sufficient in sampling a wide conformational space involving folding and binding contributing to the folded, the unfolded, or the misfolded states. Our model uses the native state of an individual WW domain as a reference state, and thus conservatively assesses the population of misfolded states.
The total Hamiltonian consists of a backbone term, a potential of mean force, and a fragment memory term:
| (4) |
constrains the backbone chain to physically realistic heteropolymer conformations (see Supplementary Information section 3 for details). The potential of mean force depends on the identities of the interacting residues and contains direct contacts, water-mediated contacts, burial, and hydrogen bonding terms (see Supplementary Information section 3 for details). The and terms do not depend on the knowledge of the native structure and only depend on the sequence of residues; thus, the two terms allow for non-native and long-sequence distance interactions and are responsible for the formation of non-native structure across multiple domains. Model parameters are chosen to minimize misfolding of the WW domain by itself, in accord with experimental observation (see section 3.6).
The fragment memory term is particularly important in the context of single domain folding, as it contains local sequence interactions using the knowledge of the native structure. Memories are sequences with known structures (typically obtained from the protein data bank). The fragment memory potential sums over all memories m from short sequences, and all pairs of atoms (not residues) i and j such that the atoms have a sequence separation, having the form
| (5) |
where rij and are the distances between atoms i and j of the simulated structure and of the memory structure, respectively. In this study, we use a single memory, which is the folded experimental structure of the isolated FiP35 WW domain (PDB ID: 2F21)33. The well width σIJ =λσ|I-J|0.15, and we fixed λσ = 0.2 Å in all simulations. Unlike Gō or structure-based models34, only acts less than 10 residues apart within the monomer, affecting mainly secondary structure. The other non-backbone terms act both locally and in long-sequence distances, affecting tertiary and interdomain structure also. A more detailed description of the AWSEM Hamiltonian terms can be found in refs. 29,35,36 or at http://awsem-md.org/index.html.
The fragment memory terms contain a scaling parameter λFM in eq. (5) adjusting the interaction strength. λFM allows us to tune the aggregation propensity relative to the folding propensity. In this study, we use three different values of λFM to compare folding vs. aggregation of the tethered domains as bias towards the folded crystal structure is decreased (λFM = 0.4 kJ/mole, Model I), or increased (λFM =1.2 kJ/mole, Model III) compared to the standard value (λFM = 0.8 kJ/mole, Model II). All other parameters were kept at default settings.29 The full set of AWSEM parameters used is shown in Supplementary Information (Supplementary Information section 4).
To further correct the secondary structure bias, we used the Protein Secondary Structure Prediction server JPRED37, which provides information to adjust terms in.38 Details are in Supplementary Information section 3, and secondary structure prediction is shown in Supplementary Information section 4.
2.7. System preparation and simulated annealing protocol
We built the single memory configuration using atomic coordinates provided in the WW-domain of the human FiP mutant crystal structure with PDB ID: 2F21. We matched the sequences of the WW-domain oligomers used in the experiments (Table S1 in Supplementary Information). Each individual domain in the oligomers used the single memory of the monomer, and linkers joining domains were not influenced by the fragment memory term.
We performed all simulations in the canonical ensemble (NVT) using the Nosé-Hoover thermostat implemented using the LAMMPS molecular dynamics software.39 To predict the structures, we performed annealing simulations starting from a linear extended peptide structure at a temperature of 650 K, and slow cooled over 10 million time-steps to 300 K (where a time-step is approximately 5 fs). Initial velocities were chosen randomly from a Boltzmann distribution with the average squared velocity equal to 3kBT/m, where kB is the Boltzmann constant, m is the mass, and the temperature T is set equal to 650 K. The simulated annealing was repeated 40 times for each oligomer and the three λFM values (Models I, II, and III). The temperature range was chosen to be approximately 150 K above and below the folding temperature of the monomer.
2.8. Order Parameters
The fraction of native contacts of domain d ranges from 0 to 1, with a higher value corresponding to greater similarity to the native structure, which in this case is the monomer WW-domain crystal structure. It is defined as
| (6) |
where N is the number of residues in a single domain, , and are the distances between Cα atoms i and j of the simulated structure in domain d and of the single memory structure, respectively.
The misfolding parameter measures the degree of misfolding of domain d (where larger values positive mean more misfolding, and 0 means folded). It has the form:
| (7) |
where Θ(x) is the Heaviside step function, ξ1 = 6.0 Å and ξ2 = 0.75 are distance and folding thresholds, k is the index of the domain interface from domain d. The set is defined as the set of residues i in domain d and the set of residues j in domain k, and rij is the distance between Cα atoms i and j. The left term in brackets in the order parameter quantifies the amount of interfacial contact (meaning shared contacts between domains), while the Heaviside function at the end of the equation prevents from counting complete folded structures as misfolded, even if a domain shares a large interfacial contact. Then to calculate the probability that at least µ domains out of n domains in an oligomer are misfolded, we first find the probability that domain i misfolds by counting the number of annealed structures that have a value of greater than N/2, where N is the number of residues in a single domain:
| (8) |
Therefore,
| (9) |
where, otherwise Pm=0. The total number of Cβ to Cβ contacts per domain is defined as:
| (10) |
Here τCβ is the sum of all possible pairs of Cα atoms i and j that are closer than the cut-off distance ξ1, divided by the number of domains in the oligomer, n.
As a final order parameter, the total number of Trp contacts per domain is defined as:
| (11) |
τW is the sum of all possible pairs of tryptophan “i” and other residues “j” closer than the cut-off distance ξ1.
3. Results
3.1. Decrease in expression yield from monomer to pentamer
One sign that an oligomer is prone to aggregation or self-aggregation is a decrease in expression yield of the protein. Other possibilities include protein toxicity (WW domain is well-tolerated in E. coli), protein length (the constructs are well below the 100 kDa length where we usually encounter expression problems for large fluorescent-labeled proteins), or increased degradation. We observed repeatedly (3–6 repeats) that as oligomer size was increased, the expression yield decreased.
The expression yield of the monomer was in the range of 8–12 mg per three-liter expression volume. The dimer also had a 8–12 mg yield range. The trimer had yield in the 5–7 mg range, slightly lower than monomer or dimer. The tetramer construct with a His tag yielded only 3–5 mg of protein, significantly lower. The tetramer solution also turned turbid as fractions were collected on the FPLC, which was not observed for the other proteins. For the tetramer, the purification tag had an important influence on expression yield. The tetramer using a GST tag23 had minimal expression, although both versions of QFiP35, when characterized by MALDI (see Supplementary Information section 5) had a clear peak at 17.76 kDa for the cleaved QFiP35. The pentamer could not be expressed with measurable yield.
3.2. Changes in CD signal from monomer to tetramer
The circular dichroism (CD) spectrum of proteins with His- or GST-tag removed confirms the expression trend. MFiP35 had a tryptophan chiral peak at 225 nm with mean residue ellipticity ~2000 deg dmol−1 cm−2, similar to previous literature reports (e.g. Figure 6 in ref. 40). Interestingly, the dimer and trimer show an even more intense peak, despite normalization to mean residue ellipticity in Figure 2. The environment of the Trp backbone must be even more chiral in these constructs than in the monomer, indicating some domain interactions even for well-folded and relatively high expressing oligomeric repeats (see also fluorescence results below). QFiP35 with a His tag again shows a smaller ellipticity, and QFiP expressed with GST and then cleaved shows no significant peak in the CD spectrum between 210 and 260 nm. Each expression was repeated at least three times and similar results were obtained. The monomer showed no signal difference, whether expressed with His-tag or GST.
Fig. 6.
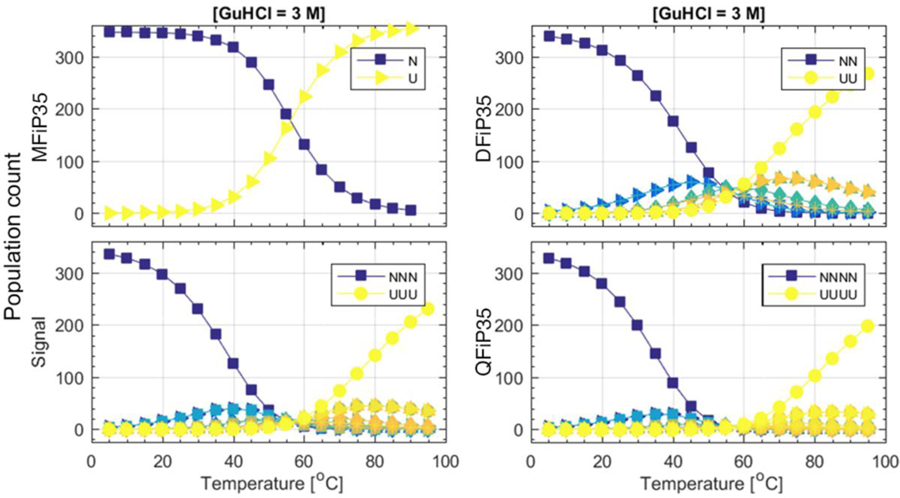
Global fitting model population examples: As temperature increases at 3 M GuHCl, population of the fully native monomer (dark blue, N) decays and the unfolded monomer U builds up; there is no misfolded aggregate state for the monomer. For dimer through tetramer, non-native aggregate states containing 1 or more “M” (light blue, green, orange) build up, as does the fully unfolded state UU or UUUU (yellow). For a full plot of all n-mers and all GuHCl concentrations see Supplementary Information section 7.
Fig. 2.
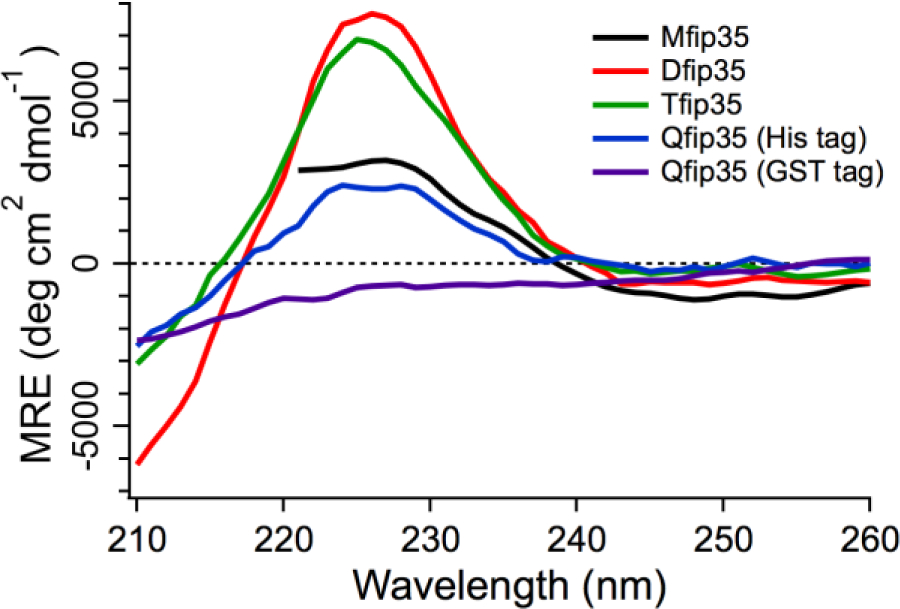
Comparison of QFiP35 (tetramer) expressed and purified using GST and His tag using circular dichroism at 25 °C. The typical 227 nm peak for the WW domain is present in QFiP35 (His tag) protein but not in the spectra obtained for QFiP35 (GST tag).
Clearly the tetramer is very sensitive to its local folding environment in E. coli during expression (His tag vs. GST tag), and folding is not successful with the GST tag. We surmise that the nascent QFiP35 chain during translation interacts with hydrophobic patches on the GST surface and misfolds, or that weak association of GST tags brings FiP35 repeats into proximity, whereas the His tag has no such effect in the bacterial cells used for protein expression.
3.3. Decrease of thermal stability from monomer to tetramer
The thermal stability of the tethered n-mer constructs was measured by probing the only tryptophan (present in the hairpin 1 in each monomer WW Domain) over a temperature range of 5–90 °C by tryptophan fluorescence spectroscopy. The thermal melts were performed with varying concentrations of guanidine hydrochloride (0, 1, 2, 3 M) to obtain the melting temperature (Tm) with better accuracy by having more folded and unfolded baselines sampled for the global fit of all fluorescence data of all oligomers.
We make the following two observations in Figure 3. Fig. 3A–D shows a small decrease of the average Trp fluorescence wavelength (347 to 343 nm) in the native state as n goes from 1 to 4. This indicates a less polar environment of the tryptophan, consistent with some domain interaction reducing the tryptophan solvent exposure. Figure 3E directly compares the stability of all four constructs in 2 M GuHCl. The comparison is made at 2 M GuHCl because all but MFiP35 have reasonably complete native and denatured baselines at that denaturant concentration. MFiP35 denaturation does not reach the unfolded baseline (Tm ≥ 68 °C for a fit of eq. (2) to that trace); it is the most stable protein. DFiP35 and TFiP35 do reach the unfolded baseline (Tm = 63±1 °C), and show a slightly earlier onset of denaturation than the monomer. QFiP35 (His tag) is slightly less stable (Tm = 61±1 °C) than dimer and trimer. The decrease in stability is also supported by the global fitting model described further below. Thermal melts detected by CD yield melting temperatures about 4 °C lower than tryptophan fluorescence detection for MFiP35 though QFiP35 (His tag).
Fig. 3.
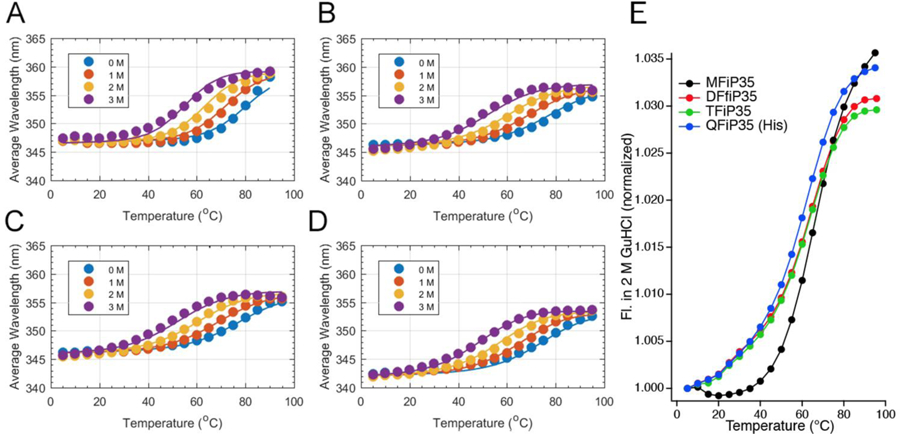
Global fitting (A-D) of the thermal melts at different GuHCl concentrations and comparison at 2 M GuHCl (E). (A) MFiP35; (B) DFiP35; (C) TFiP(35); (D) QFiP35 expressed with a His tag. The curves are from the global multi-domain model fit of all thermodynamic and kinetic data of all n-mers, assuming three states per domain. (E) Comparison of the data at 2 M GuHCl, with connected data points to guide the eye Tm changes M>D,T>Q.
The difference between QFiP35 expressed with His and GST tags is seen in thermal melts, monitored in Figure 4 by tryptophan fluorescence wavelength shift (eq. (1)). Sigmoidal melts were fitted to the linear free energy model in eq. (2). In both proteins, Trp fluorescence starts at ~342 nm at low temperature, indicating partly buried Trp residues. Thermal denaturation of QFiP35 purified with the His tag shows a regular decrease of stability as GuHCl is added and unfolding to a solvent exposed state with an average wavelength of ~352 nm. In contrast, the GST-purified construct shows more erratic curves and sometimes even a wavelength decrease at high temperature. We believe the wavelength decrease indicates onset of inter-domain aggregation (tryptophans are re-introduced to a less polar environment at high temperature).
Fig. 4.
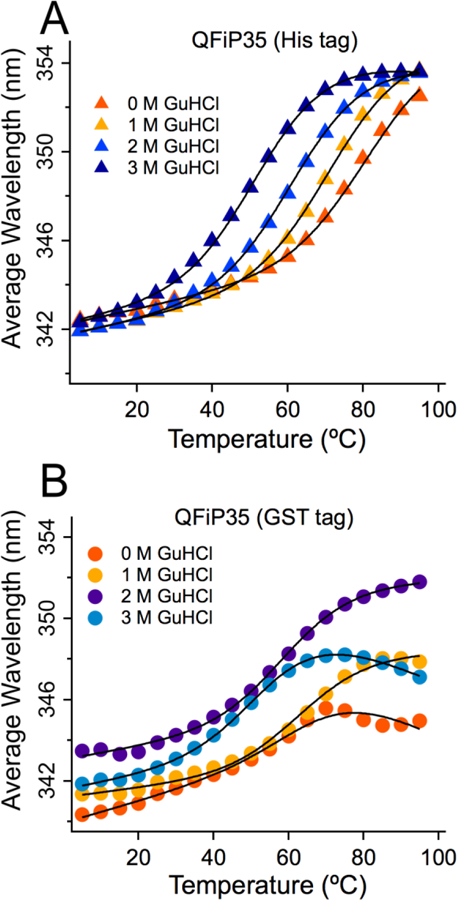
Comparison of average Trp fluorescence wavelength vs. temperature plot for (A) QFiP35 (His tag, curves are global fit from Figure 2) and (B) QFiP35 (GST tag, curves are individual sigmoid fits to eq. 2). Melting temperature is higher and more regular sigmoid denaturation curves are obtained in the case of His-tag purification. Addition of GuHCl shifts the folded baseline in the GST-tagged protein.
3.4. T-jumps kinetics as a function of T, [GuHCl] and n
In order to determine the unfolding relaxation kinetics, we conducted temperature jump experiments on all the tethered constructs except QFiP35 with GST tag. The jumps were conducted near and below the melting temperature using our ultrafast laser temperature jump setup described in the Methods section. The kinetics experiments were also measured at different temperatures and GuHCl concentrations for each n-mer (Figure 5 and Figures S6a–c in Supplementary Information section 6).
Fig. 5.
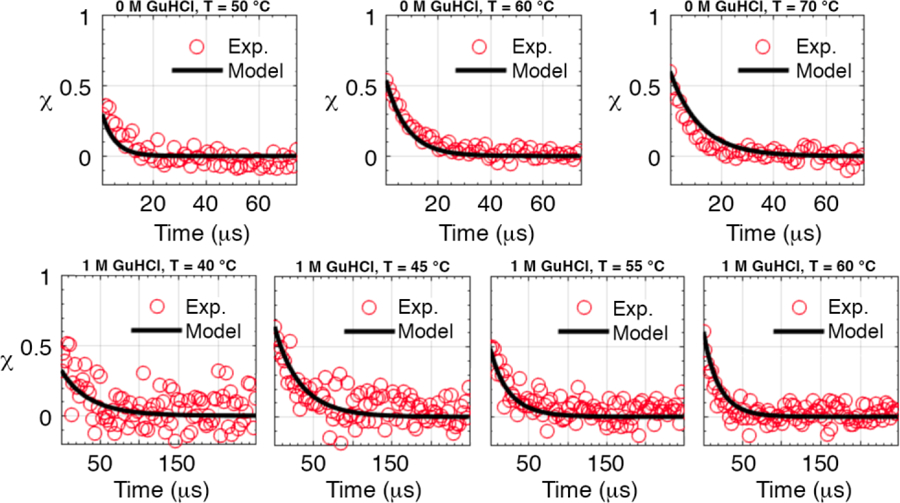
Representative plots for temperature jump relaxation kinetics. χ(t) vs. time traces are fitted using the global fitting model for the monomer MFiP35 (top) and tetramer QFiP35 with histidine tag purification (bottom). The other proteins are shown in Supplementary Information section 6 in Figures S6a–b. The black curves are from a global fit of all thermodynamic and kinetic data of all n-mers simultaneously.
3.5. Global fitting model
The thermal/GuHCl denaturation and T-jump kinetics data for all proteins with n=1–4 was fitted simultaneously using the model described in the section 2.5. Briefly, the model assumes that each protein can be represented as a chain “X” through “XXXX” for the monomer through tetramer,9 where “X” stands for one of three states: N (native), U (unfolded) and M. The state M accounts for non-native structure of individual domains due to inter-domain interactions in the dimer through tetramer, not to be confused with short-lived two-stranded on-pathway intermediates that have been observed during WW monomer folding. Only direct interconversion between N and U, and U and M one step at a time was allowed (i.e. M is treated as “off pathway”). We also fitted an analogous model with only two states per domain, N and U, to assess the extent of domain interaction modeled by state M. The monomer can only access states N and U in both models.
The resulting network of states is described by 12 (8) thermodynamic parameters for three (two) states per domain (Table 1), as defined in Methods. The kinetic parameters include two activation free energies Gϯ for the N to U and M to U reactions. (See also Supplementary Information section 2 for more details.)
Table 1:
Global fitted parameters. The global fit incorporates all fluorescence-detected thermal melts and kinetics of all oligomers simultaneously. One standard deviation errors are shown in parentheses. Supplementary Information section 2 discusses each parameter in detail: One effective melting temperature, five thermal and denaturant linear free energy parameters, four fluorescence baseline parameters, and two activation free energy parameters. The parameters for state M are missing in the fit with only two states per domain, which has a much worse error (χ2).
| Parameters | 3 states per domain model | 2 states per domain model |
|---|---|---|
| Tm (°C) | 82.4 (0.5) | 82.0 (0.6) |
| g(0)UM (J/mol−1) | 213 (100) | - |
| gUN (J mol−1 K−1) | 377 (15) | 290 (12) |
| gUM (J mol−1 K−1) | 163 (20) | - |
| mUN (J/mol−1 molar−1) | 3145(200) | 2060 (138) |
| mUM (J/mol−1 molar−1) | 1140 (300) | - |
| bU | 358.7 (0.2) | 358.1 (0.3) |
| aU | −0.03 (0.02) | −0.10 (0.02) |
| bF | 347.1 (0.2) | 346.4 (0.3) |
| aF | 0.011 (0.001) | 0.008 (0.005) |
| GϯNU (J/mol−1)* | 18500 (8000) | 19900 (1300) |
| GϯMU (J/mol−1)* | 2600 (fixed) | - |
| Avg. χ2 (thermo)** | 1.7 | 23 |
| Avg. χ2 (kinetics)** | 1.5 | 3.1 |
GϯNU and GϯMU are barrier height going from folded to unfolded or intermediate to unfolded form
16 thermal melts with 288 data points total and 30 kinetic decays each with 674 data points
Both the three-state and two-state models could globally fit all 46 denaturation and kinetic traces of all tethered oligomers n=1–4 simultaneously, as shown in Figures 3 and 5, and SI Figures S6a–h. The fitted model parameter values are shown in Table 1 for both global fits. It is evident by comparing Figures 3, 5 and S6a–b (three states per domain) with Figures S6c–g (two states per domain) that the state M, which accounts for domain interactions, is required for a satisfactory global fit of all data. The χ2 of the global fit with three states per domain is 13 times smaller for equilibrium melts, and less than half for kinetics data, relative to the global fit with just two states per domain. This trend is also observed if state “M” is excluded for the monomer, which has no experimental off-pathway intermediates.
Thermodynamic melts fitted to an effective Tm of ~84 °C for the monomer, with a single N and U baseline per monomer across the entire thermal melt data set (see Figure 3). The kinetic data was globally fitted with a ~17 kJ/mol−1 NU barrier and a smaller fixed UM barrier (as shown in Figure 5 and Supplementary Information section 7).
From the global fit we can extract the population of each state. Figure 6 illustrates the buildup and decay of all states as a function of temperature and GuHCl concentration. Fig. S7 shows the full data set. As expected, the fully native oligomer concentration decreases upon increased temperature or addition of denaturant. For longer oligomers, the fully native population decays more quickly in favor of oligomers containing some domains in the “M” state. The concentrations of all species can be recreated using Table 1 and the free energy formula eq. (3), showing that longer oligomeric tethered constructs have a higher propensity for occupying state M at high temperature. Our assumption that the fluorescence signature of monomers in state M is half-way between N and U, if relaxed, of course leads to different populations of misfolded states, but the general picture remains the same as shown in Figure 6. Although the model fit is quantitative, the populations in Fig. 6 should be taken only as a qualitative indicator.
3.6. Behavior of the monomer in the coarse-grained model
To provide more detailed structural information, we used AWSEM to perform simulated annealing starting with unfolded structures at 650 K and gradually reduced the temperature to 300 K to sample increasingly folded structures. We first looked at the WW monomer. Figure 7 compares the simulated annealing trajectories for the three Models with (Model I), 0.8 kJ/mole (Model II) and 1.2 kJ/mole (Model III). As discussed in Methods, defines the strength of the fragment memory Hamiltonian, with large values favoring folding over domain interactions. As increases, the WW-domain collapses and folds earlier and at higher temperature. At, only a single β-hairpin is formed (see an example in Figure 8B.). At, all three β-strands form, but sidechains are not quite natively packed yet. At, the protein is folded. Model I does not fold sufficiently well to be consistent with experiment, whereas Model II and III completely fold, consistent with fully native structure of the monomer. We favor Model II because it has less weighting on the fragment memory interactions (smaller value of) than Model III, thus achieving complete folding of the monomer without over-weighting native interactions.
Fig. 7.
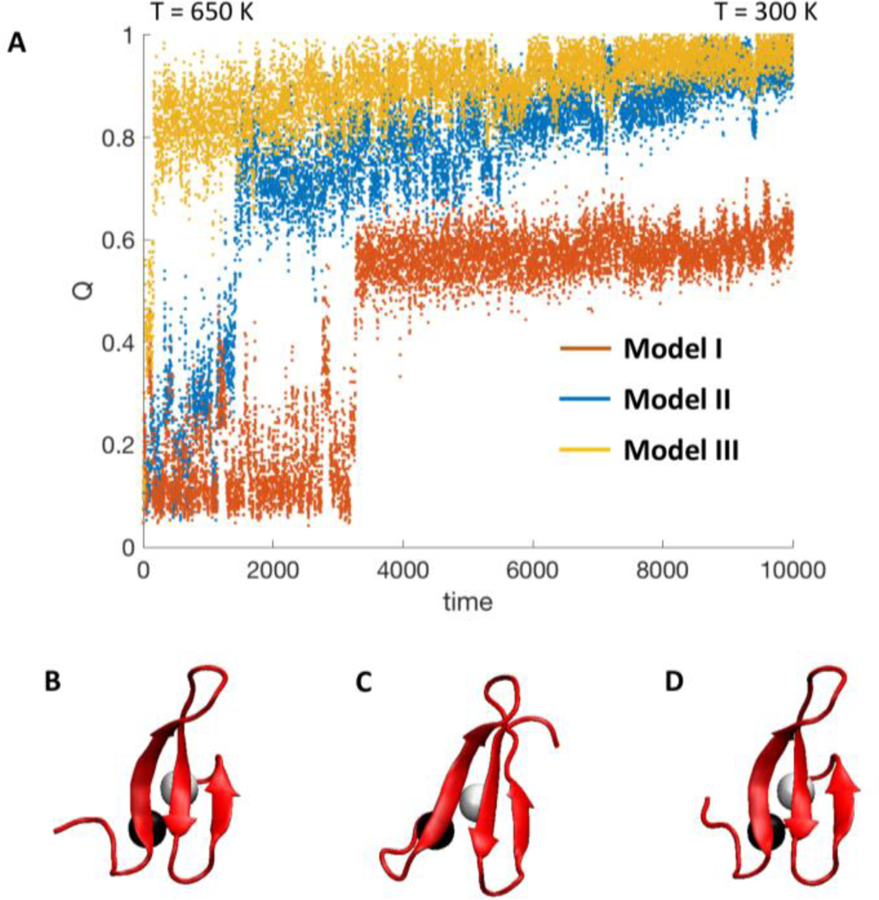
(a) Simulated annealing trajectories with respect to fraction of native contacts Q for WW-domain monomer for model I, II, and III. Trajectories start at 650 K and are gradually cooled to 300 K. Time is represented in units of 103 timesteps. Below the trajectory are the annealed monomer structures, from left to right: Q = 0.72 for model I (b), Q = 0.95 for model II (c), and Q = 1.0 for model III (d). The black and white beads are the Cβ atoms of Trp 8 and Tyr 20, respectively.
Fig. 8. Gallery of oligomers.
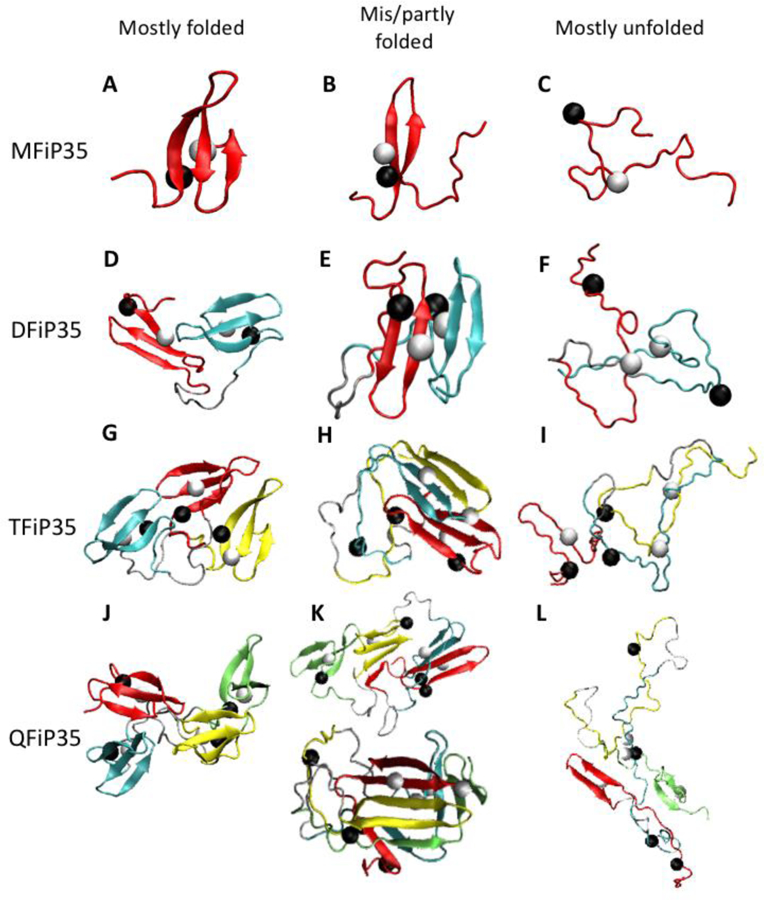
Examples of predicted WW-domain monomer, dimer, trimer, and tetramer structures (from top to bottom) with varying amounts of folding/misfolding of domains. The domains are colored red-cyan-yellow-green from the N-terminus, and linkers are gray. The black and white beads are the Cβ atoms of Trp 8 (or 51, 94, 137) and Tyr 20 (or 63, 109, 152), respectively. Oligomers states corresponding roughly to the discrete global fitting model for the experimental data: (A) N, (B) M, (C) U, (D) NN, (E) MM, (F) UU, (G) NNN, (H) NMM, (I) UUU, (J) NNNN, (K) NNMM and MMMM, (L) UUUU.
3.7. Coarse-grained simulations and structural interpretation of the data
Simulations were next performed on tethered repeat proteins to get a higher resolution picture of the type of misfolded structures that may form. In agreement with experiment, simulation revealed that as the number of domains increases, the probability of misfolding increases. A gallery of monomers and oligomers with varying degrees of folding/misfolding from simulated annealing is shown in Figure 8, and annealing results are shown in Supplementary Information section 8. As the number of domains increases (MFiP35 to QFiP35), the folding of the individual domains competed less effectively with inter-domain interactions. A common feature of the misfolded structures is that one β-strand unfolds, and the remaining two β-strands from separate domains come together to make a larger β-sheet (e.g. structures 8E and 8H). This misfolding mechanism is clearly seen in the annealing trajectory of a trimer (Fig. S8b). The tetramer exhibited an additional type of misfolding (structure 8K) by forming chimeric β-sheets with domain-swapped structures. Thermodynamically, the non-fragment memory terms of the Hamiltonian in eq. (4), primarily the Ramachandran term, (see SI eq. (S5)), the β-strand hydrogen bonding term, (see SI eq. (S6)), and parallel-antiparallel cooperative hydrogen bonding term, (see SI eq. (S7)), are responsible the formation of the β-sheets across multiple domains.
3.8. Misfolding propensity increases with oligomer size
The experimental expression yield trends are supported by coarse-grained simulations of the tethered systems. Figure 9 shows the probabilities for μ or more domains in the n-mer to misfold, or, for models I, II, and III. The scaling factor controls the bias towards the monomer native structure, with smaller values leading to more interaction among domains. For smaller (model I), is driven towards 1 for smaller repeat proteins. The probability of misfolding of at least one domain is >0.5 for the tetramer in model II, which fits well with the observed intracellular environmental sensitivity of the tetramer as seen by decrease in yield and sensitivity to the type of purification tag being attached. Model II shows no significant effect on monomer and dimer, consistent with the onset of lower melting temperature for the trimer in the thermal melts performed on the tethered proteins (Table 1). Even in model III, which has the strongest domain folding propensity, the tetramer has at least one domain misfolded with a probability of 0.3.
Fig. 9.
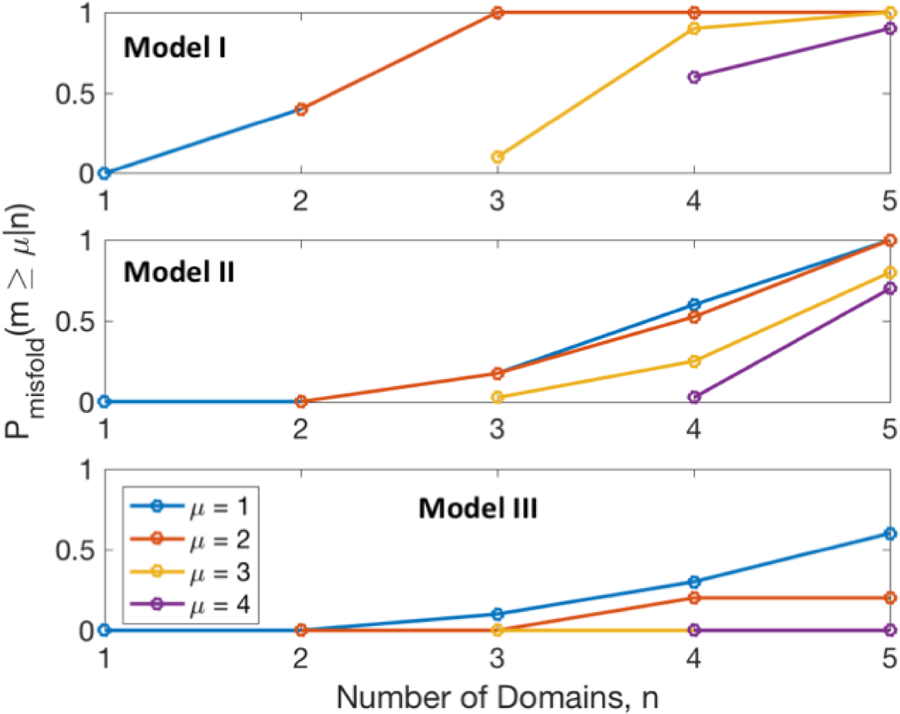
Probability of misfolding μ or more domains, given the size of the n-mer from n = 1 to 4. Models I, II, and III are shown from top to bottom. Probabilities are calculated from structure predictions of simulated annealing runs.
With increasing number of domains, the probability of misfolding increases due to increased competition of inter-domain interactions with folding, shifting equilibrium towards misfolded states. Another possible reason is that because not all the β-strands form at the same time, misfolding can occur when β-sheets of neighboring domains interact and become kinetically trapped beyond the time scale of the experiments. The gallery of n-mers in Figure 8 is consistent with both scenarios, although we favor the equilibrium scenario for two reasons: in the model, extensive simulated annealing was applied; and in the global fitting model (Figure 6), equilibrium is achieved while accurately fitting the experimental data. Furthermore, the strong coupling between domains reflected by increasing with n (Figure 9) and the mis/partly folded structures in Figure 8 validate the global fitting model assumptions (section 2.5) and fitting results (section 3.5). It is reasonable for state M to represent non-native structure of a domain due to domain interactions, rather than an isolated misfolded state of WW domain.
3.9. Order parameters track Trp fluorescence, stability and misfolding
Figure 10 presents the averages of three order parameters with respect to number of domains for models I, II, III. The number of contacts made by tryptophan (Figure 10C) can be correlated with the fluorescence spectroscopy, since fewer contacts imply more solvent exposure and red-shifted fluorescence. The number of Trp contacts is highest for the monomer signifying a stable native structure. This is also verified with the change in energy per domain (Figure 10A), which shows the monomer as the most stable compared to the other oligomers. Figure 10B shows that more Cβ contacts form as the number of domains increases, signifying an increase in hydrogen bonding between β stands of different domains. This increase in Cβ contacts can be visualized as an increase in chimeric β-sheets seen in Figure 8E, H and K. This analysis is consistent with the experimental results obtained by CD and fluorescence spectroscopy.
Fig. 10.
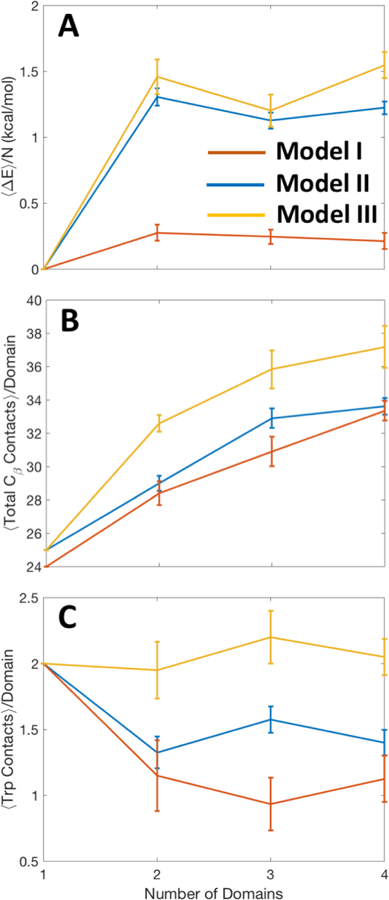
(a) Energy change (from monomer) per residue vs. number of tethered domains. (b) Total number of Cβ to Cβ contacts per domain vs. number of domains. (c) Number of Trp contacts per domain vs. number of domains, for model I in orange, model II in blue, and model III in yellow.
3.10. Local backbone geometry remains conserved while global configuration depends on n
The CD spectra in Figure 2 vary in intensity, but generally have the same shape, indicating similar local backbone configurations. Figure 11 plots Φ and Ψ Ramachandran angle probabilities for the different n-mers. Even though there is a clear change in the structures globally as more domains are added (Figure 8), the local secondary structure landscape is preserved in Figure 11. As expected from the high amount of β-sheet formation (either within a single domain or across multiple), the most probably angles are those that are prone to form β-sheets. The Ramachandran histogram also populates angles that have a high propensity of forming α-helices even though none of the proposed structures (n = 1 to 4), in Figure 7 or 8, contain an α-helix.
Fig. 11.
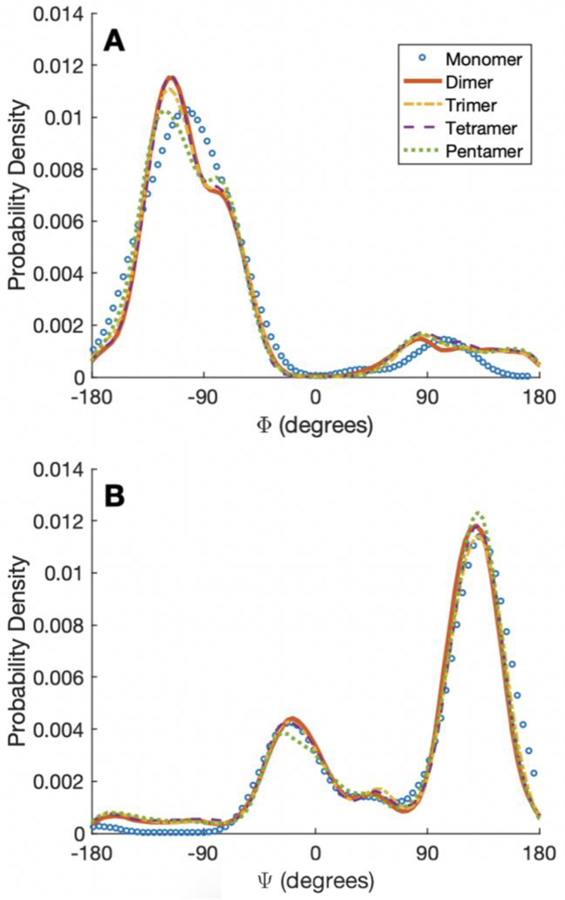
Probability density of (a) Φ and (b) Ψ angles for monomer, dimer, trimer, tetramer, and pentamer for model II.
However, the angles with helical tendencies lead to an actual α-helix only in the coarse-grained simulated annealing of the pentamer (n = 5) in Figure 12, which could not be expressed in experiments. The pentamer forms a new type of misfolded structure compared to the ones seen in Figure 8 for n=2–4: an α-helix containing a Trp residue in the second domain, which is surrounded by β-sheets, emerges in ~20% of predicted pentamer structures. This suggests that the extra domains stabilize an α-helix formed by residues with Ψ angles that are in the range. The extra domains provide more tertiary contacts allowing for side-chains to align correctly into an α-helix from an already twisted β-strand.
Fig. 12.
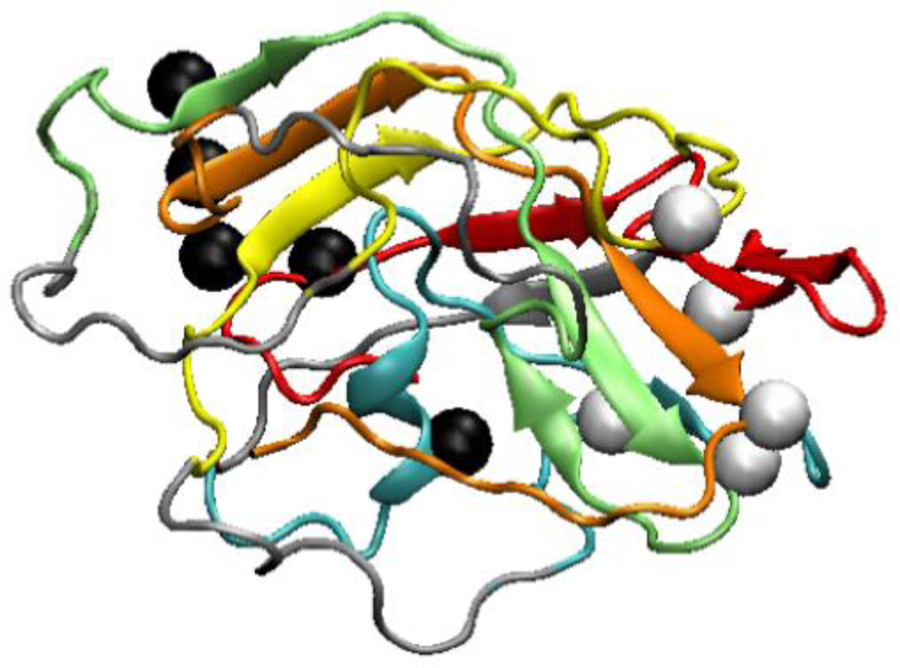
Example of a predicted WW-domain pentamer structure with all domains misfolded. Domains are colored, and linkers are gray. The order of the colors starting from N-terminus is red, cyan, yellow, green, orange. The black and white beads are the Cβ atoms of Trp (8, 51, 94, 137, 180) and Tyr (20, 63, 109, 152, 195), respectively. An α-helix containing a Trp residue appears in the cyan domain.
Additionally, the pentamer has a probability very close to 1 of at least one domain being misfolded, and 0.6 even for the conservative model III (Figure 9). The lack of pentamer expression again suggests that Model II represents a fairly accurate balance between fragment memory and inter-domain interactions.
4. Discussion
Natural and engineered repeat proteins have provided many insights to relate folding, misfolding and function. Evolution for folding, which does not favor repeats with similar sequences adjacent in a multi-domain protein,6,7,15 goes hand-in-hand with evolution for function, which sometimes favors multiple domains of similar structure.21,41 Ankyrin domains42,43 and TPR motifs44 in particular have shown how nearly identical folds can co-exist with the right balance of sequence similarity. These results have been complemented by studies on consensus repeat sequences,8,45 which have shown evidence of a highly parallel, but not completely homogeneous, folding process capable of generating stable native states.3,9,46
Our results for repeats of sequence-identical WW domains show that above n=3, a critical number of repeats is reached: individual domains are destabilized and likely to form non-native states. While the stability of dimer and trimer is at most slightly smaller than that of the monomer, the tetramer is noticeably less stable thermodynamically and sensitive to the purification tag used, whereas the pentamer cannot be expressed in significant quantities, presumably due to domain interactions that lead to misfolding. Thus, 2 to 3 identical repeat domains lead to a stable native WW repeat protein, but more identical domains in series foster misfolding. The observation that consensus ankyrin sequences (α-helical secondary structure) can form longer repeat folds than WW domain (β-sheet secondary structure) indicates that certain folds and sequences have substantially lower propensity for misfolding than others when tethered together. This may be the reason why WW domains are mainly observed as tandem repeats in nature,21 whereas natural ankyrins can contain many additional repeats.47
Transient aggregates have been proposed as a step during the folding of many non-repeat proteins, masquerading as folding intermediates. For example, the RNA-binding protein U1A forms such transient aggregates.2 We have shown that when U1A is tethered into a repeat protein, transient aggregation is enhanced and leads to irreversible (on the time scale of the experiments) aggregation when too many repeats are tethered together.47 U1A is a very aggregation-prone protein, and we found that the size of its irreversible aggregation nucleus is only n=2.10 WW domain is not prone to aggregation (as evidenced by facile NMR structures obtained at mM concentration).33 Here we find that the size of the FiP35 irreversible aggregation nucleus lies at n = 4. Thus, if a range of n ≈ 2 to 4 is likely for the aggregation nuclei of most proteins; oligomeric aggregates may be formed rather easily. The ‘intramolecular amyloids’ we observe when repeats interact (e.g. Figure 8H) may be examples of what oligomeric aggregates in non-tethered proteins look like. Indeed, it has been shown for protein U1A that addition of an Alzheimer sequence increases transient aggregation and allows stable dimers to form.48
The WW tetramer highlights how protein folding can be sensitive to the environment, in tandem with current in-cell folding experiments.49,50 The type of purification tag used for WW tetramer (histidine vs. GST) determines whether a native-like or a non-native secondary structure is recovered. Thus, the local environment is critical for the folding of the tetramer. In-cell experiments have shown that proteins can be stabilized or destabilized in the cellular environment, depending on protein surface electrostatics,51 or the organelle environment.52,53 While these effects are small, they can be critical in regulating signaling and other protein-protein interactions, which are often weak (on the order of a few kJ/mole).1 Such sticking or ‘quinary structure’ of proteins,54–56 of which only the tip of the iceberg has been characterized,57,58 may well account for the large majority of in-cell protein-protein or protein-nucleic acid interactions.
Repeat proteins may assist in the evolution of new folds.59–62 Our structural simulations of identical repeats highlight one possible path towards the evolution of more complex protein folds. For example the tetramer (Figures 8K) forms larger-stranded beta sheets by combining strands from different domains. Since the WW-domain monomer contains three beta-strands with strong curvature (seen in Figure 7), the beta-strands that form the disordered loops in the oligomers are prone to form helices. Such loops could evolve to form helical structure (Figure 11), yielding a protein whose beta sheets have large contact order63 because they are separated by other secondary structure elements (loops, helices). The latter is a very common structural motif. Indeed, longer repeats can form entirely novel structures, such as the one shown in Figure 12. Although the pentamer has many disordered regions, the combination of beta sheets and an alpha helix showed up in ~20% of simulated structures. If the loops were optimized by shortening, or mutated to favor additional alpha helices, Figure 12 would represent a compact alpha/beta fold. Although not the subject of this paper, it would be interesting to take a sequence that forms simulated compact misfolded structure such as in Figure 12, truncate the loops or increase their helix propensity, and see if improved expression and a well-defined tertiary structure could be obtained.
Supplementary Material
Acknowledgements
We thank Dr. Nicholas P. Schafer for the helpful discussions. K.D. and M.G. were supported by NIH grant R01 GM093318. A.G.G was supported by a training fellowship on the Houston Area Molecular Biophysics Program (T32 GM008280). M.S.C. and A.G.G. were funded by the National Science Foundation (MCB-1412532, PHY-1427654, OAC-1531814), and thank computing resources from the Center for Advanced Computing and Data Systems at UH.
Footnotes
Electronic Supplementary Information (ESI) available. The PDF file contains 8 sections with additional figures, formulas and parameter lists for the manuscript.
References
- 1.Wirth AJ and Gruebele M, BioEssays, 2013, 35, 984–993. [DOI] [PubMed] [Google Scholar]
- 2.Silow M and Oliveberg M, Proc. Natl. Acad. Sci, 1997, 94, 6084–6086. [DOI] [PMC free article] [PubMed] [Google Scholar]
- 3.Ferreiro DU, Cervantes CF, Truhlar SME, Cho SS, Wolynes PG and Komives EA, J. Mol. Biol, 2007, 365, 1201–1216. [DOI] [PMC free article] [PubMed] [Google Scholar]
- 4.Zweifel ME and Barrick D, Biochemistry, 2001, 40, 14357–14367. [DOI] [PubMed] [Google Scholar]
- 5.Croy CH, Bergqvist S, Huxford T, Ghosh G and Komives EA, Protein Sci, 2004, 13, 1767–77. [DOI] [PMC free article] [PubMed] [Google Scholar]
- 6.Borgia MB, Borgia A, Best RB, Steward A, Nettels D, Wunderlich B, Schuler B and Clarke J, Nature, 2011, 474, 662. [DOI] [PMC free article] [PubMed] [Google Scholar]
- 7.Wright CF, Teichmann SA, Clarke J and Dobson CM, Nature, 2005, 438, 878. [DOI] [PubMed] [Google Scholar]
- 8.Main ERG, Jackson SE and Regan L, Curr. Opin. Struct. Biol, 2003, 13, 482–489. [DOI] [PubMed] [Google Scholar]
- 9.Aksel T and Barrick D, Biophys. J, 2014, 107, 220–232. [DOI] [PMC free article] [PubMed] [Google Scholar]
- 10.Liu F and Gruebele M, J. Phys. Chem. Lett, 2010, 1, 16–19. [Google Scholar]
- 11.Yang WY and Gruebele M, Biophys. J, 2006, 90, 2930–2937. [DOI] [PMC free article] [PubMed] [Google Scholar]
- 12.Javadi Y and Main ERG, Proc. Natl. Acad. Sci, 2009, 106, 17383–17388. [DOI] [PMC free article] [PubMed] [Google Scholar]
- 13.Zheng W, Schafer NP and Wolynes PG, Proc. Natl. Acad. Sci, 2013, 110, 1680–1685. [DOI] [PMC free article] [PubMed] [Google Scholar]
- 14.Ferreiro DU, Komives EA and Wolynes PG, Q. Rev. Biophys, 2014, 47, 285–363. [DOI] [PMC free article] [PubMed] [Google Scholar]
- 15.Borgia A, Kemplen KR, Borgia MB, Soranno A, Shammas S, Wunderlich B, Nettels D, Best RB, Clarke J and Schuler B, Nat. Commun, 2015, 6, 8861. [DOI] [PMC free article] [PubMed] [Google Scholar]
- 16.Prigozhin MB and Gruebele M, J. Am. Chem. Soc, 2011, 133, 19338–19341. [DOI] [PMC free article] [PubMed] [Google Scholar]
- 17.Weber JK, Jack RL, Schwantes CR and Pande VS, Biophys. J, 2014, 107, 974–82. [DOI] [PMC free article] [PubMed] [Google Scholar]
- 18.Tian P and Best RB, PLoS Comput. Biol, 2016, 12, e1004933. [DOI] [PMC free article] [PubMed] [Google Scholar]
- 19.Faccin M, Bruscolini P and Pelizzola A, J. Chem. Phys, 2011, 134, 075102. [DOI] [PubMed] [Google Scholar]
- 20.Kajander T, Cortajarena AL, Main ERG, Mochrie SGJ and Regan L, J. Am. Chem. Soc, 2005, 127, 10188–10190. [DOI] [PubMed] [Google Scholar]
- 21.Dodson EJ, Fishbain-Yoskovitz V, Rotem-Bamberger S and Schueler-Furman O, Exp. Biol. Med, 2015, 240, 351–360. [DOI] [PMC free article] [PubMed] [Google Scholar]
- 22.Chen X, Zaro JL and Shen W-C, Adv. Drug Deliv. Rev, 2013, 65, 1357–1369. [DOI] [PMC free article] [PubMed] [Google Scholar]
- 23.Liu F, Nakaema M and Gruebele M, J. Chem. Phys, 2009, 131, 0–9. [DOI] [PubMed] [Google Scholar]
- 24.Henry ER, Best RB and Eaton WA, Proc. Natl. Acad. Sci, 2013, 110, 17880–17885. [DOI] [PMC free article] [PubMed] [Google Scholar]
- 25.Ervin J, Sabelko J and Gruebele M, J. Photochem. Photobiol, 2000, B54, 1–15. [DOI] [PubMed] [Google Scholar]
- 26.Ballew RM, Sabelko J, Reiner C and Gruebele M, Rev. Sci. Instrum, 1996, 67, 3694–3699. [Google Scholar]
- 27.Wirth AJ, Liu Y, Prigozhin MB and Schulten K, J. Am. Chem. Soc, 2015, 137, 7152–7159. [DOI] [PMC free article] [PubMed] [Google Scholar]
- 28.Dobson CM, in Seminars in Cell and Developmental Biology, 2004, vol. 15, pp. 3–16. [DOI] [PubMed] [Google Scholar]
- 29.Davtyan A, Schafer NP, Zheng W, Clementi C, Wolynes PG and Papoian GA, J. Phys. Chem. B, 2012, 116, 8494–8503. [DOI] [PMC free article] [PubMed] [Google Scholar]
- 30.Zheng W, Schafer NP, Davtyan A, Papoian GA and Wolynes PG, Proc. Natl. Acad. Sci, 2012, 109, 19244–19249. [DOI] [PMC free article] [PubMed] [Google Scholar]
- 31.Zheng W, Schafer NP and Wolynes PG, Proc. Natl. Acad. Sci, 2013, 110, 20515–20520. [DOI] [PMC free article] [PubMed] [Google Scholar]
- 32.Chen M and Wolynes PG, Proc. Natl. Acad. Sci, 2017, 114, 4406–4411. [DOI] [PMC free article] [PubMed] [Google Scholar]
- 33.Jäger M, Zhang Y, Bieschke J, Nguyen H, Dendle M, Bowman ME, Noel JP, Gruebele M and Kelly JW, Proc. Natl. Acad. Sci. U. S. A, 2006, 103, 10648–53. [DOI] [PMC free article] [PubMed] [Google Scholar]
- 34.Clementi C, Nymeyer H and Onuchic JN, J. Mol. Biol, 2000, 298, 937–953. [DOI] [PubMed] [Google Scholar]
- 35.Schafer NP, Kim BL, Zheng W and Wolynes PG, Isr. J. Chem, 2014, 54, 1311–1337. [DOI] [PMC free article] [PubMed] [Google Scholar]
- 36.Papoian GA, Coarse-grained Modeling of Biomolecules, CRC Press, 2017. [Google Scholar]
- 37.Cuff JA, Clamp ME, Siddiqui AS, Finlay M and Barton GJ, Bioinformatics, 1998, 14, 892–893. [DOI] [PubMed] [Google Scholar]
- 38.Truong HH, Kim BL, Schafer NP and Wolynes PG, J. Chem. Phys, 2013, 139, 121908. [DOI] [PMC free article] [PubMed] [Google Scholar]
- 39.Plimpton S, J. Comput. Phys, 1995, 117, 1–19. [Google Scholar]
- 40.Koepf EK, Petrassi HM, Sudol M and Kelly JW, Protein Sci, 1999, 8, 841–853. [DOI] [PMC free article] [PubMed] [Google Scholar]
- 41.Michaely P and Bennett V, J. Biol. Chem, 1993, 268, 22703–22709. [PubMed] [Google Scholar]
- 42.Binz HK, Stumpp MT, Forrer P, Amstutz P and Plückthun A, J. Mol. Biol, 2003, 332, 489–503. [DOI] [PubMed] [Google Scholar]
- 43.Ferreiro DU, Cho SS, Komives EA and Wolynes PG, J. Mol. Biol, 2005, 354, 679–692. [DOI] [PubMed] [Google Scholar]
- 44.Magliery TJ and Regan L, J. Mol. Biol, 2004, 343, 731–45. [DOI] [PubMed] [Google Scholar]
- 45.Tripp KW and Barrick D, J. Mol. Biol, 2007, 365, 1187–200. [DOI] [PMC free article] [PubMed] [Google Scholar]
- 46.Rowling PJE, Sivertsson EM, Perez-Riba A, Main ERG and Itzhaki LS, Biochem. Soc. Trans, 2015, 43, 881–888. [DOI] [PubMed] [Google Scholar]
- 47.Jacobs MD and Harrison SC, Cell, 1998, 95, 749–758. [DOI] [PubMed] [Google Scholar]
- 48.Otzen DE, Miron S, Akke M and Oliveberg M, Biochemistry, 2004, 43, 12964–12978. [DOI] [PubMed] [Google Scholar]
- 49.Danielsson J, Mu X, Lang L, Wang H, Binolfi A, Theillet F-X, Bekei B, Logan DT, Selenko P, Wennerström H and Oliveberg M, Proc. Natl. Acad. Sci. U. S. A, 2015, 112, 12402–7. [DOI] [PMC free article] [PubMed] [Google Scholar]
- 50.Guzman I, Gelman H, Tai J and Gruebele M, J. Mol. Biol, 2014, 426, 11–20. [DOI] [PMC free article] [PubMed] [Google Scholar]
- 51.Danielsson J, Mu X, Lang L, Wang H, Binolfi A, Theillet F-X, Bekei B, Logan DT, Selenko P, Wennerström H and Oliveberg M, Proc. Natl. Acad. Sci, 2015, 112, 12402–12407. [DOI] [PMC free article] [PubMed] [Google Scholar]
- 52.Tai J, Dave K, Hahn V, Guzman I and Gruebele M, FEBS Lett, 2016, 590, 1409–1416. [DOI] [PubMed] [Google Scholar]
- 53.Dhar A, Girdhar K, Singh D, Gelman H, Ebbinghaus S and Gruebele M, Biophys. J, 2011, 101, 421–30. [DOI] [PMC free article] [PubMed] [Google Scholar]
- 54.McConkey EH, Proc. Natl. Acad. Sci. U. S. A, 1982, 79, 3236–40. [DOI] [PMC free article] [PubMed] [Google Scholar]
- 55.Hingorani KS and Gierasch LM, Curr. Opin. Struct. Biol, 2014, 24, 81–90. [DOI] [PMC free article] [PubMed] [Google Scholar]
- 56.Gnutt D and Ebbinghaus S, Biol. Chem, 2016, 397, 37–44. [DOI] [PubMed] [Google Scholar]
- 57.Sukenik S, Ren P and Gruebele M, Proc. Natl. Acad. Sci. U. S. A, 2017, 114, 6776–6781. [DOI] [PMC free article] [PubMed] [Google Scholar]
- 58.Vélot C, Mixon MB, Teige M and Srere PA, Biochemistry, 1997, 36, 14271–14276. [DOI] [PubMed] [Google Scholar]
- 59.Söding J and Lupas AN, BioEssays, 2003, 25, 837–846. [DOI] [PubMed] [Google Scholar]
- 60.Orengo CA, Sillitoe I, Reeves G and Pearl FMG, J. Struct. Biol, 2001, 134, 145–165. [DOI] [PubMed] [Google Scholar]
- 61.Andrade MA, Perez-Iratxeta C and Ponting CP, J. Struct. Biol, 2001, 134, 117–131. [DOI] [PubMed] [Google Scholar]
- 62.Björklund AK, Ekman D, Light S, Frey-Skött J and Elofsson A, J. Mol. Biol, 2005, 353, 911–23. [DOI] [PubMed] [Google Scholar]
- 63.Plaxco KW, Simons KT and Baker D, J. Mol. Biol, 1998, 277, 985–994. [DOI] [PubMed] [Google Scholar]
Associated Data
This section collects any data citations, data availability statements, or supplementary materials included in this article.


