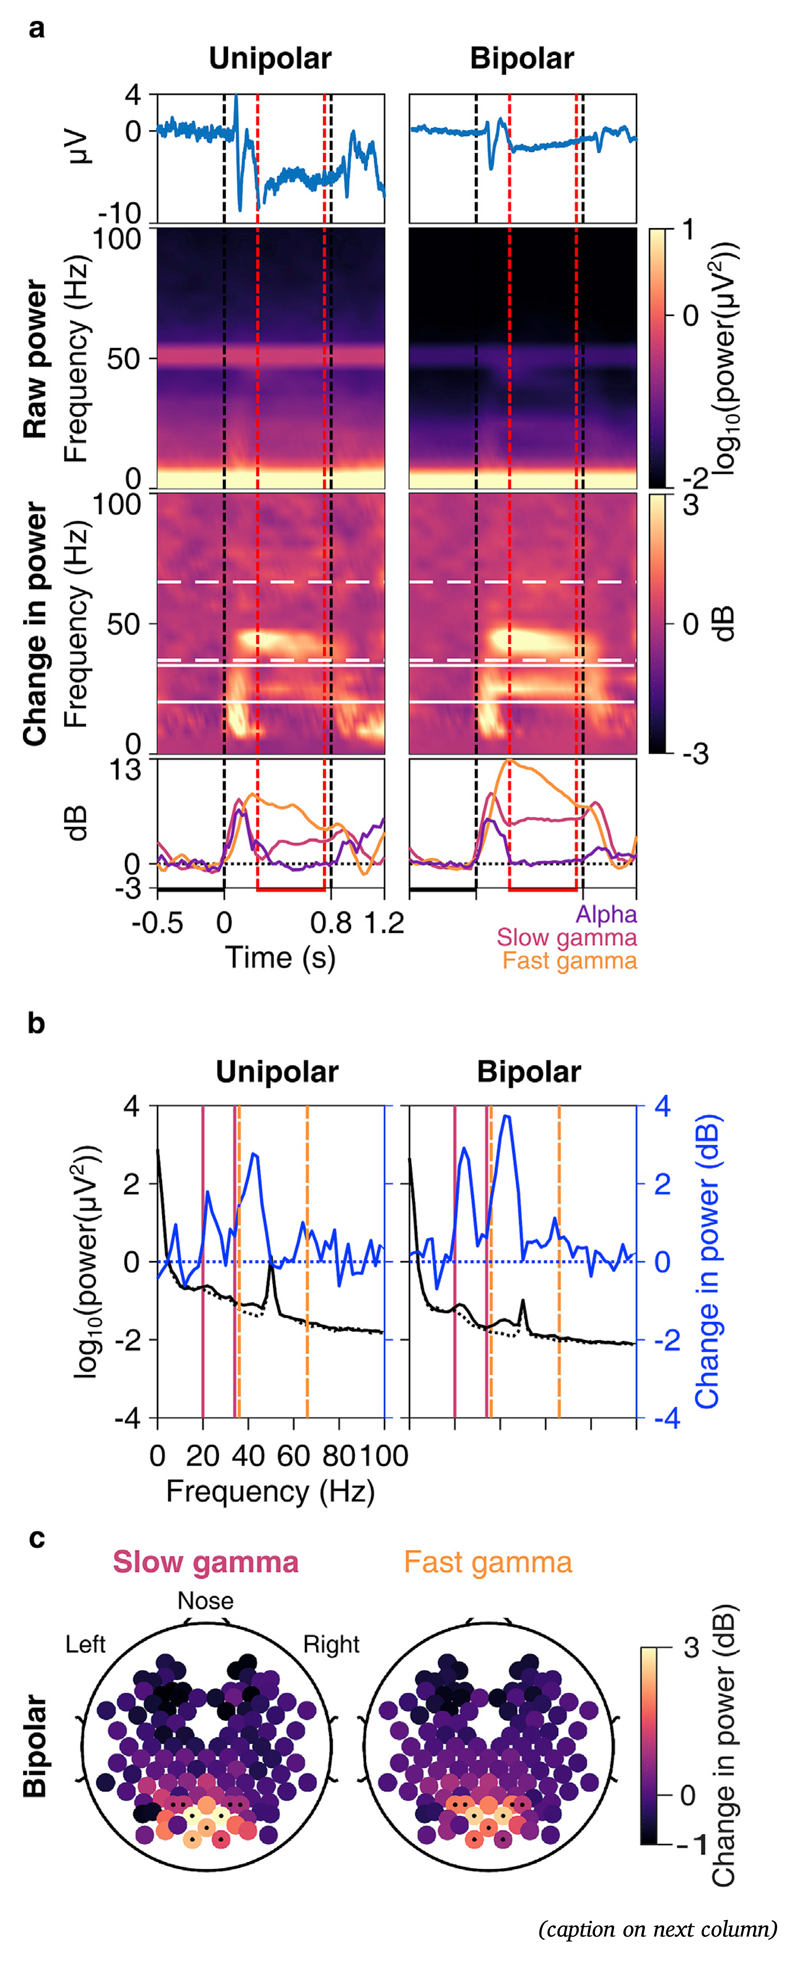
Fig. 1. Slow and fast gamma in an example elderly subject.
a) Trialaveraged EEG trace (1st row, blue); time-frequency spectrograms of raw power (2nd row) and change in power from baseline (3rd row); and change in power with time (4th row) in alpha (8–12 Hz, violet), slow (20–34 Hz, pink) and fast gamma (36–66 Hz, orange) bands averaged across 10 unipolar (left column) and 9 bipolar (right column) electrodes. Vertical dashed lines represent actual stimulus duration (0–0.8 s, black) and period used for analysis within stimulus duration (0.25–0.75 s, red). Horizontal lines represent baseline (-0.5-0 s, black) and stimulus (0.25–0.75 s, red) analysis periods. White lines in spectrograms represent slow (solid) and fast (dashed) gamma frequency ranges. b) Right ordinate shows raw power spectral densities (PSDs, black traces) vs frequency in baseline (dotted) and stimulus (solid) periods averaged across 10 unipolar electrodes (left column) and 9 bipolar (right column) electrodes; left ordinate shows the same for change in PSD (in dB, solid blue trace) in stimulus period from baseline. Solid pink lines and dashed orange lines represent slow and fast gamma bands respectively. c) Scalp maps showing 112 bipolar electrodes (represented as disks). Color of each disk represents change in slow (left) and fast (right) gamma power. 9 electrodes used in 1a and 1b (right column) are marked with dots.

