

Abstract
Objective:
Although some people with mild cognitive impairment may not suffer from dementia lifelong, about 5% of them will progress to dementia within one year in community settings. However, a general tool for predicting the risk of cognitive impairment was not adequately studied among older adults.
Design:
Prospective cohort study.
Setting:
Community-living, older adults from 22 provinces in China.
Participants:
We included 10,066 older adults aged 65 and above (mean age, 83.2±11.1 years), without cognitive impairment at baseline in the 2002–2008 cohort and 9354 older adults (mean age, 83.5±10.8 years) in the 2008–2014 cohort of the Chinese Longitudinal Healthy Longevity Survey.
Methods:
We measured cognitive function using the Chinese version of the Mini-Mental State Examination (MMSE). Demographic, medical, and lifestyle information was used to develop the nomogram via a Lasso selection procedure using a Cox proportional hazards regression model. We validated the nomogram internally with 2000 bootstrap resamples and externally in a later cohort. The predictive accuracy and discriminative ability of the nomogram were measured by area-under-the-curves (AUCs) and calibration curves, respectively.
Results:
Eight factors were identified with which to construct the nomogram: age, baseline MMSE, activities of daily living and instrumental activities of daily living score, chewing ability, visual function, history of stroke, watching TV or listening to the radio, and growing flowers or raising pets. The AUCs for internal and external validation were 0.891 and 0.867, respectively, for predicting incident cognitive impairment. The calibration curves showed good consistency between nomogram-based predictions and observations.
Conclusion and Implications:
The nomogram-based prediction yielded consistent results in two separate large cohorts. This feasible prognostic nomogram constructed using readily ascertained information may assist public health practitioners or physicians to provide preventive interventions of cognitive impairment.
Keywords: Cognitive impairment, nomogram, prediction model, older adults, Chinese
Summary
A nomogram for assessing future risk of cognitive impairment was developed and validated with good performance via readily ascertained information including age, baseline MMSE, stroke, and other five modifiable variables.
Introduction
Cognitive impairment, ranging from mild cognitive impairment to dementia, is a major public health problem all over the world.1,2 Modest declines in cognitive function are reported in some in younger adults but cognitive function rapidly worsens in the sixth decade of age and thereafter throughout the remaining adult lifespan.1,2 The disease burden of cognitive impairment in China is dramatically growing with the aging population; by the end of 2019 in China, 176 million people were aged 65 and above, consisting of 12.6% of the Chinese population.4 However, drug therapy for cognitive impairment, dementia, or Alzheimer’s disease remains relatively inefficient.5,6 Therefore, it is important to inform older adults about their future risk of cognitive impairment and provide individualized advice on interventions.7
Previous studies focused little on predicting cognitive impairment in cognitively healthy older adults. A risk nomogram based on age, family history of dementia, and memory has been explored to calculate relative risk (RR) rather than predict the incidence of cognitive impairment;8 another study focused on the prediction of two-year risk of 390 patients with Parkinson’s disease without external validation;8 other studies mainly concentrated on the risk prediction of dementia or Alzheimer’s disease using personal demographic information, disease, and lifestyle factors.9–13 Genetic information (APOE-ε4), brain magnetic resonance imaging (MRI), fasting plasma glucose (FPG), cerebrospinal fluid (CSF) biomarkers, and HbA1c provide modest predictive power for cognitive impairment or dementia as measured by the concordance index (C-index) or area-under-the-curve (AUC).9–13 However, collection and examination of these predictors are difficult among older adults: models constructed with these predictors would not be easily applied in general populations; most of the previous studies have limited sample size, especially lack for the oldest old; thus, models developed in these populations may not work well for older adults, who are more likely to progress to cognitive impairment. Therefore, the goal of this study is to provide a feasible and easy to deploy tool for predicting the six-year risk of cognitive impairment among older adults aged 65 and above.
Methods
Study participants
Two separate and independent cohorts of the Chinese Longitudinal Healthy Longevity Survey (CLHLS) were analyzed. The CLHLS was conducted face-to-face using internationally compatible questionnaires, was the first national longitudinal survey on determinants of healthy aging and has the largest sample of the oldest-old individuals in China. The baseline survey and the follow-up surveys at a three-year interval were conducted in a randomly selected half of the counties and cities in 22 of China’s 31 provinces; more information about this prospective cohort has been provided elsewhere.15,16 Briefly, all centenarians were invited to be interviewed, two nearby nonagenarians, two octogenarians, and approximately three older adults aged 65–79 of pre-designated age and sex were randomly chosen to be interviewed in conjunction with every two centenarians, which ensured comparable numbers of randomly selected male and female younger elders aged 65 years and above. Overall, we identified 16,064 participants investigated at the 2002 baseline who were potential candidates for the cohort used to develop the predictive algorithm. Of these, we excluded 44 individuals younger than 65 years, 4338 who suffered from cognitive impairment, 1501 who were lost-to-follow-up before the first follow-up survey, and 115 with missing values of key variables, leaving 10,066 older adults aged 65 and above in the final cohort used for developing the predictive algorithm (Appendix 1 Figure A1). Similarly, we identified 16,954 participants investigated at the 2008 baseline in the external validation cohort. Of these, we excluded 7600 participants through the same criteria (described above), leaving 9354 older adults aged 65 and above in the cohort used to validate the predictive algorithm (Appendix 1 Figure A2). The biomedical ethics committee of XX University approved the study (IRB00001052–13074), all participants or their proxy respondents provided written informed consent.
Assessment of cognitive impairment
Cognitive function was assessed for all participants at the baseline survey by trained public health practitioners from local centers for disease control and prevention using the traditional Chinese version of the Mini-Mental State Examination (MMSE), which has been widely used as a screening test for cognitive impairment in epidemiological studies and proven to be applicable to China.17,18 The MMSE is usually used to screen populations for cognitive impairment, track changes in cognitive function over time, and oftentimes to assess the effects of interventions on cognitive function. It shows high specificity and sensitivity in defining dementia and is recognized as a relatively perfect tool to detect cognitive impairment, especially among those with advanced age who are not able to go through complex clinical diagnostic testing.19 The Chinese version of the MMSE addressed the following aspects of cognitive functioning: orientation to time, orientation to place, three object registration, calculation, word recall, naming, repeating, comprehension, three-step tasks, sentence construction, and copying figures. It has been tested for reliability and validity in China and adaptation to China’s cultural and socioeconomic characteristics.20 The MMSE scores range from 0 to 30; a higher score represents a better cognitive function. It has been proven rational to use education-based cutoff points to determine cognitive function among Chinese.20,21 Therefore, we defined cognitive impairment as follows: for participants without formal education, an MMSE score <18 was considered cognitive impairment; for participants with one to six years of education, an MMSE score <21 was considered cognitive impairment; for participants with more than six years of education, an MMSE score <25 was considered cognitive impairment; not meeting these criteria was considered as not cognitive impairment. As described above, individuals meeting criteria for cognitive impairment at baseline were excluded from this analysis. Cognitive function was reassessed by the MMSE in the later follow-up surveys to serve as the standard for determining whether incident cognitive impairment had occurred during two three-year follow-up intervals.
Candidate predictors
Information about demographics and lifestyle were acquired through a structured face to face questionnaire by trained public health practitioners from local centers for disease control and prevention. History of diseases was ascertained using self-reported questionnaire. Blood pressure was measured by trained internists with at least three years of work experience using a mercury sphygmomanometer. The following were defined continuous variables: age, systolic pressure (SBP), body mass index (BMI), years of education, activities of daily living (ADL) and instrumental activities of daily living (ADL) score, baseline MMSE, daily amount and duration of smoking, daily dose and duration of drinking. ADL and IADL score ranges from 14 to 42 with 14 activities considered overall, including: six ADLs -- dressing, feeding, bathing, continence, toileting and indoor transfer;22 and eight IADLs -- going outside to visit neighbors, shopping, preparing meals, doing laundry, walking 2 kilometer, lifting a 5-kilogram weight, doing 3 squats, and taking public transport. For each activity, 1 point was assigned if the participant could easily finish it successfully without any assistance; 2 points were assigned if the participant could finish it successfully with difficulty or with assistance in specific part; 3 points were assigned if the participant could only finish it successfully with assistance in more than one part, or was unable to finish it (Detailed scoring rubric was provided in Appendix 1 Table A1). The total score of ADLs and IADLs was calculated for analysis.
Other variables were categorized as follows: sex was defined as male or female; race was defined as the Han nationality or minority; occupation was defined as farmer or other; marital status was defined as married if the participant was currently married and living with a spouse, formerly married if the participant was separated or divorced from a spouse, widowed, or single if the participant was never married; residence was defined as urban or rural; living arrangement was defined as alone, with family members or in a nursing home; self-reported heart disease, history of stroke, diabetes mellitus, and respiratory disease were defined as yes or no; chewing ability, visual function, and dietary diversity were defined as good or poor (more than 20 teeth or use of artificial teeth were defined as having good chewing ability);23 self-reported frequencies of food consumption, including vegetables, fruits, legumes and soy products, meat, eggs, fish, and tea were defined as never, sometimes, and often; leisure activities including reading books or newspapers, playing cards or mahjong, watching TV or listening to the radio, attending social activities, growing flowers or raising pets, and personal outdoor activities were defined as never, sometimes, or often. All interactions between age and other predictors were also considered.
Statistical analysis
We used complete datasets for model development and validation because less than 0.3% of all key variables were missing values. We computed person-years of follow-up from the investigation date of the baseline survey until either cognitive impairment, death, or the end of follow-up (September 1, 2008 for the development cohort, September 1, 2014 for the validation cohort), whichever came first. Results are presented as mean ± standard deviation (SD) or median (interquartile range, IQR) for continuous variables, and number (percentage) for categorical variables.
To address the potential bias, participants who were lost-to-follow-up at the first follow-up survey were excluded. All participants in the development cohort were used for model establishment. Multivariable time-to-event analysis was performed using Cox proportional hazards regression model. Continuous variables were additionally explored for their potential non-linear association with the risk of cognitive impairment using restricted cubic splines. Variables in the final model were obtained using a Lasso selection procedure, which incorporates different penalties for different coefficients to retain the most important variables. Lasso is useful for preventing model overfitting and model misspecification.24,25 The nomogram was constructed using variables included in the final model. A score was assigned to each predicting variable in the nomogram such that total points could be easily ascertained to estimate the probability of cognitive impairment. The estimated risk for the predictors was presented through the hazard ratio (HR).
In accordance with the validation rule described in the transparent reporting of a multivariable prediction model for individual prognosis or diagnosis (TRIPOD) statement,26 the nomogram was subjected to 2000 bootstrap resampling for internal validation of the development cohort; external validation was performed using a separate independent CLHLS cohort from 2008 to 2014. Discrimination was tested using AUC. The value of the AUC ranges from 0.5 to 1; a value of 0.5 indicates no ability to discriminate and a value of 1.0 indicates perfect separation.27 The calibration was examined using a calibration curve derived by the regression analysis to test the consistency of predicted probabilities and observed frequencies. In detail, we ordered all participants by the value of predicted risk probabilities, and then divided them into ten sample-balanced subgroup; the predicted probabilities and observed frequencies of each group were combined to draw the calibration curve.
To evaluate the efficacy of our nomogram, we applied different thresholds of predicted risk to calculate in the validation cohort the corresponding sensitivity, specificity, positive predictive value (PPV), negative predictive value (NPV), counts of true positive, false positive, true negative and false negative. In detail, all participants were arranged in decreasing order according to their nomogram predicted risk of cognitive impairment. We selected thresholds corresponding to the top 1%, 3%, 5%, 10%, 20%, 30%, 40%, 50%, and 60% of older adults with highest risk to assess the performance of classification.
To evaluate the net benefits of the nomogram, we performed a decision curve analysis in the validation cohort.28,29 This method assesses the benefits of correctly detecting people who will have cognitive impairment compared with the harms from a false positive classification (which could lead to unnecessary interventions). Net benefits were computed across a range of thresholds of risk probabilities to compare with alternative strategies of “intervention in all participants” and “intervention in none”.
All statistical analyses were performed using R 3.6.2 for Windows (R Foundation for Statistical Computing, Vienna, Austria) with the “rms”, “Hmisc”, “glmnet”, “survival”, “survivalROC” and “ggplot2” packages.
Results
Baseline Characteristics
Table 1 displays the baseline characteristics of the development and validation cohorts. In the development cohort, we included 10,066 older adults with a mean age of 83.2±11.1, ranging from 65 to 114 years. Median follow-up time was 4.7 years (IQR 2.4–6.1). The average baseline MMSE was 26.8± 3.2 points, and summed ADL and IADL score was 18.7± 6.1 points. Overall 53.8% (5412) had good chewing ability, 79.1% (7959) had good visual function, 4.7% (478) had history of stroke, 47.4% (4768) often watch TV or listen to the radio, 10.1% (1013) often grow flowers or raise pets.
Table 1.
Baseline characteristics of older adults aged 65 years of age and above without cognitive impairment at study entry in development and validation cohorts.
| Characteristics | Development cohort (n=10,066) |
Validation cohort (n=9354) |
|---|---|---|
| Age (y) | ||
| Mean (SD) | 83.2 (11.1) | 83.5 (10.8) |
| Age group | ||
| 65–79 | 3972 (39.5) | 3481 (37.2) |
| 80–89 | 3001 (29.8) | 2817 (30.1) |
| 90–99 | 1939 (19.3) | 2130 (22.8) |
| ≥100 | 1154 (11.5) | 926 (9.9) |
| Baseline MMSE (points) | ||
| Mean (SD) | 26.8 (3.2) | 26.8 (3.3) |
| ADL and IADL score (points) | ||
| Mean (SD) | 18.7 (6.10) | 17.9 (5.52) |
| Chewing ability | ||
| Good | 5412 (53.8) | 5177 (55.3) |
| Poor | 4654 (46.2) | 4177 (44.7) |
| Visual function | ||
| Good | 7959 (79.1) | 6861 (73.3) |
| Poor | 2107 (20.9) | 2493 (26.7) |
| History of stroke | ||
| No | 9588 (95.3) | 8856 (94.7) |
| Yes | 478 (4.7) | 498 (5.3) |
| Watching TV or listening to the radio | ||
| Never | 2782 (27.6) | 2047 (21.9) |
| Sometimes | 2516 (25.0) | 2019 (21.6) |
| Often | 4768 (47.4) | 5288 (56.5) |
| Growing flowers or raising pets | ||
| Never | 8314 (82.6) | 7898 (84.4) |
| Sometimes | 739 (7.3) | 544 (5.8) |
| Often | 1013 (10.1) | 912 (9.7) |
| Median follow-up duration (IQR; years) | 4.7(2.4–6.1) | 4.8(2.6–5.8) |
Abbreviations: MMSE= the Mini-Mental Status Examination; ADL = activities of daily living; IADL = instrumental activities of daily living; IQR = interquartile range. Values are presented as numbers (percentages) of participants unless stated otherwise.
In the validation cohort, we included 9354 older adults with a mean age of 83.5±10.8, ranging from 65 to 116 years. The distribution of characteristics was similar to the development cohort. Detailed information is provided in Table 1.
Incidence of cognitive impairment
Appendix 1 Table A2 displays the incidence of cognitive impairment stratified by age and sex. In the development cohort, 18.2% (1828) of participants suffered from cognitive impairment during a total follow-up time of 41,645 person-years. In the validation cohort, 20.7% (1932) participants suffered from cognitive impairment during a total follow-up time of 38,039 person-years. The cognitive impairment incidence tended to be higher among females and older adults in both cohorts.
Predictor variables
Appendix 1 Table A3 displays the HR (95% confidence interval [CI]) for cognitive impairment in different subgroups. Eight predictor variables were included in the final model, including age, baseline MMSE, ADL and IADL score, chewing ability, visual function, history of stroke, watching TV or listening to the radio, and growing flowers or raising pets. As shown in the nomogram (Figure 1), age served as the most important predictor for cognitive impairment. Age had a non-linear relationship with predicted risk probability of cognitive impairment, which appeared to increase at a slower rate among older adults with advanced age, especially those after 90 years old (Appendix 1 Figure A3; Figure 1). Interactions between age and other predictors were not observed.
Figure 1. Nomogram for predicting the six-year cognitive impairment probability.

The scores corresponding to each characteristic are listed on the top. To determine the six-year probability of cognitive impairment, compute the sum of scores for each characteristic and locate this sum on the “Total Points” axis, then read the corresponding probability from the lowest line.
Abbreviations: ADL= activities of daily living; IADL = instrumental activities of daily living; MMSE= the Mini-Mental Status Examination.
Nomogram for predicting cognitive impairment
Figure 1 displays the nomogram established based on regression analysis. The nomogram illustrates that age made the biggest contribution to the prediction of incident cognitive impairment, followed by the ADL and IADL score, and baseline MMSE. A score was assigned on the point scale for each subtype within these variables. By counting the total score and locating it on the total points scale, we could easily draw a straight line down to determine the estimated probability of cognitive impairment over six years. For instance, an age of 85 was allocated 55 points; the ADL and IADL score of 30 was allocated 18 points; baseline MMSE score of 24 was allocated 11 points; with history of stroke was allocated 9 points; poor chewing ability was allocated 4 points; poor visual function was allocated 7 points; never watching TV or listening to the radio was allocated 7 points; never growing flowers or raising pets were allocated 12 points. In this example, a total point of 123 is achieved by an older adult aged 85 with the characteristics listed above corresponds to a six-year risk probability of cognitive impairment of about 53.8%.
Besides, we also developed a risk calculation tool using Excel spreadsheets on the basis of nomogram, via which future risks of cognitive impairment can be easily accertained by imputing personal information required. Appendix 2.
Discrimination and calibration of the nomogram
The performance of the nomogram was evaluated by AUC. The AUCs for internal and external validation were 0.891 and 0.867, respectively (Figure 3). These results indicate a good and highly consistent performance of the nomogram for predicting a six-year risk of cognitive impairment among older adults without cognitive impairment at baseline. Overall, the AUC was higher among females, indicating that the model performed better among females than males. However, this model had poor performance in different age groups as age served as the most important predictors (Appendix 1 Table A4; Figure 1). We recalculated the AUCs excluding age; this led to a decline in the AUCs to 0.821 for the development cohort and 0.781 for the external validation cohort.
Figure 3. ROC curves for development and validation cohort.

The ROC curves were illustrated in red and blue for the development and validation cohort on the basis of nomogram-predicted probability of cognitive impairment over six years.
Abbreviations: ROC= receiver operating characteristic curve; AUC= area-under-the-curve.
Figure 2 depicts the calibration curves for internal development (A) and external validation (B). The plot showed good agreement between the predicted and observed six-year probability of cognitive impairment.
Figure 2. The internal (A) and external (B) calibration curves of the nomogram.
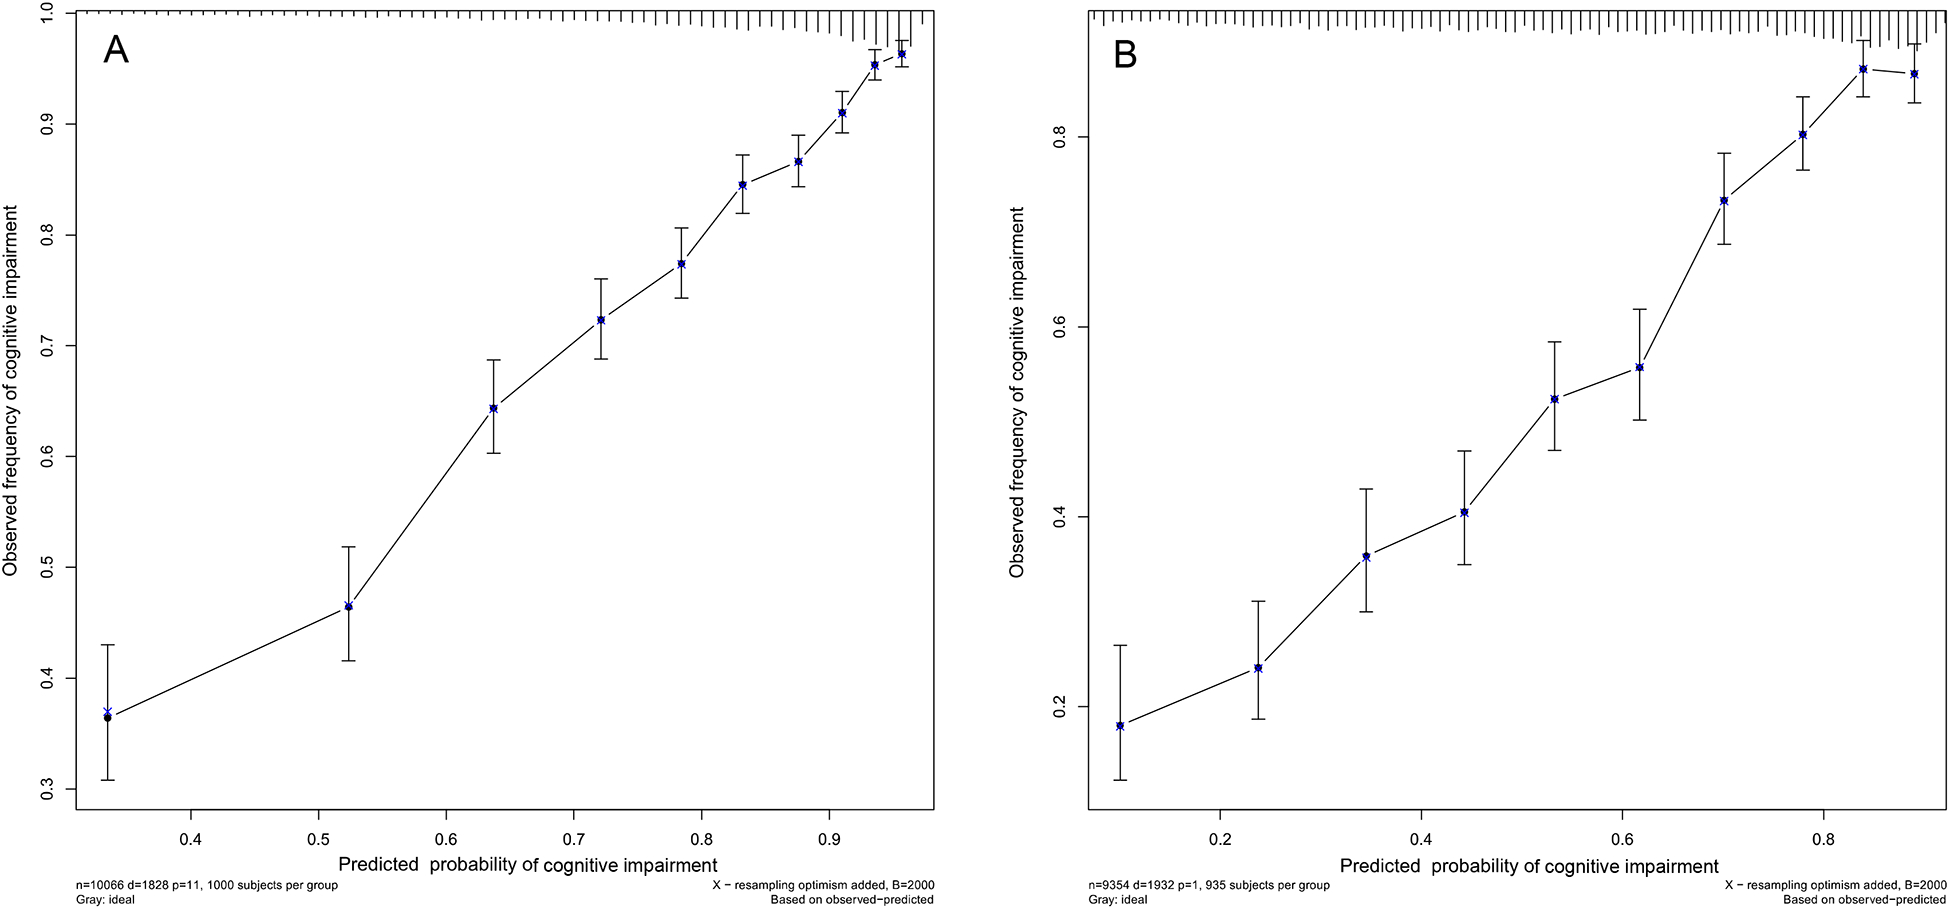
Nomogram-predicted probability and observed frequency over six years for cognitive impairment among participants without cognitive impairment at baseline were plotted in the x- and y-axis, respectively. The gray line indicates the ideal plot for the calibration curve, where the nomogram-predicted probabilities perfectly match the observed probabilities in all subgroups.
Sensitivity and specificity
Table 2 displays the sensitivity, specificity, PPV, NPV, counts of true positive, false positive, true negative and false negative at select thresholds of the top 1%, 3%, 5%, 10%, 20%, 30%, 40%, 50%, and 60% of older adults with highest risk in the validation cohort. The corresponding risk threshold of cognitive impairment for a cut-off at the top 5% was 89.6%, for the top 10% was 82.1%, and for the top 60% was 34.6%. With a risk threshold of 34.6% to identify the 60% of participants with the highest risk of cognitive impairment over six years, the sensitivity was 96.0%, specificity was 60.8%, positive predictive value was 38.9%, and negative predictive value was 98.3%.
Table 2.
Sensitivity, specificity, PPV and NPV for cognitive impairment at different thresholds of predicted risk of cognitive impairment over six years in the validation cohort.
| Threshold | Risk threshold (%) | Sensitivity (%) | Specificity (%) | PPV (%) | NPV (%) | True positive (count) | False positive (count) | True negative (count) | False negative (count) |
|---|---|---|---|---|---|---|---|---|---|
| Top 1% | 95.9 | 2.4 | 99.8 | 79.66 | 79.7 | 47 | 12 | 7410 | 1885 |
| Top 3% | 92.5 | 6.7 | 99.2 | 67.7 | 80.3 | 130 | 62 | 7360 | 1802 |
| Top 5% | 89.6 | 11.2 | 98.6 | 68.0 | 81.0 | 217 | 102 | 7320 | 1715 |
| Top 10% | 82.1 | 23 | 97.6 | 71.1 | 82.96 | 445 | 181 | 7241 | 1487 |
| Top 20% | 71.5 | 42 | 92.7 | 60.1 | 86.0 | 811 | 539 | 6883 | 1121 |
| Top 30% | 61.8 | 60 | 87.4 | 55.3 | 89.4 | 1159 | 936 | 6486 | 773 |
| Top 40% | 52.2 | 75.4 | 80.5 | 50.17 | 92.6 | 1457 | 1447 | 5975 | 475 |
| Top 50% | 43.5 | 85.9 | 70.8 | 43.4 | 95.1 | 1659 | 2165 | 5257 | 273 |
| Top 60% | 34.6 | 96 | 60.8 | 38.9 | 98.3 | 1854 | 2907 | 4515 | 78 |
Abbreviations: PPV= positive predictive value; NPV= negative predictive value.
Decision curve analysis
The net benefit curves for cognitive impairment over six years shows that the predictive nomogram had higher net benefit than strategies based on considering either no participants or all participants for intervention at risk thresholds up to approximately 70% (Appendix 1 Figure A4).
Discussion
To the best of our knowledge, this is the first study using easily accessible personal information to predict the risk of cognitive impairment among Chinese older adults aged 65 and above. We used data from the CLHLS study, which is a nationally representative prospective cohort scattered over 806 counties in 23 provinces around China, enabling us to provide a general tool to predict the risk of cognitive impairment for Chinese older adults. The restricted cubic spline was explored to better explain the non-linear correlation between age and cognitive impairment.30,31 In this prospective cohort of 10,066 older adults without cognitive impairment at baseline, we developed and validated an easy-to-use nomogram-illustrated model that proved to be robust for predicting six-year incident cognitive impairment among Chinese older adults. The nomogram includes an extensive set of personal risk factors that are easy to ascertain. Thus, the nomogram may be feasible for use by medical practitioners to inform the future risk of cognitive impairment at six years for older adults. In addition, the results of the nomogram might be used to guide preventive interventions; for instance, older adults may maintain better cognitive function via watching TV or listening to the radio, growing flowers or raising pets, and undergoing treatment to maintain ADL or IADL independence, good chewing ability, and good visual function.
Validation of the nomogram is essential to avoid overfitting of the model and to determine its generalizability.32 In our study, a 2000 bootstrap resampling strategy was used for internal validation and a separate cohort of CLHLS from 2008 to 2014 was used for external validation; both efforts provided validation that the nomogram as a feasible tool with good performance with respect to discrimination and calibration. A good discriminative ability was demonstrated by AUC of 0.891 for the internal development and 0.867 for the external validation cohorts. These values are comparable to previous studies based on easily accessible personal information with C-indices or AUCs from 0.66 to 0.78 for predicting dementia or Alzheimer’s disease, and up to around 0.86 with CSF, genetic and imaging information.1,9–13,33 Calibration plots in our study showed good agreement between predicted and actual observed risk in ten subgroups, which further verified the repeatability and reliability of the nomogram.
The major risk factors we identified are generally consistent with previous studies. Age, ADL and IADL score, baseline MMSE, and growing flowers or raising pets are the most important predictors for cognitive impairment. We observed a negative quadratic relationship between age and cognitive impairment (Appendix 1 Table A3 and Appendix 1 Figure A3), indicating that the risk is higher among older adults with advanced age.3,30,34 However, the risk magnitude of cognitive impairment tends to increase at a slower rate especially among those older than 90 years old who were more likely to be examples of successful aging, which may support cognitive reserve35,36. Inability to perform daily activities (ADL or IADLs) has been found to be closely related to cognitive impairment.37,38 Chewing ability, which declined with age, may influence the intake of food and increase the risk of cognitive impairment.39 In this study, growing flowers or raising pets rather than reading books or newspapers was found to be strongly associated with lower risk of cognitive impairment; in general, participants in this study were poorly-educated with limited reading ability, as reported in previous studies using CLHLS data, and therefore unlikely to have engaged in activities like the reading of books.40
This study also has some limitations. First, cognitive impairment was assessed in three-year intervals, which may cause bias as cognitive function may decrease largely within three years if any adverse event happened. Second, participants with older age may suffer from a higher risk of mortality leading to more missing cognitive function data for these individuals that may shrink the risk prediction. Third, data related to other potential risk factors like the apolipoprotein APOE ε4 allele, FPG, CSF, HbA1c, and vitamin use are not included in our study, but the nomogram provided relatively good performance in predicting six-year risk of cognitive impairment. Fourth, there may be a limitation in using the nomogram in developed countries where older adults have been well-educated. Finally, the nomogram was not subjected to an external validation in other studies due to the lack of research data including MMSE in populations with similar age structure. However, we used a 2000 bootstrap resampling strategy for internal validation and a separate independent cohort of the CLHLS for external validation. We showed that the nomogram has good performance in terms of discrimination (AUC 0.891 and 0.867, respectively) and calibration for predicting incident cognitive impairment in older adults.
Conclusions and Implications
In summary, the nomogram herein developed can be deployed as an easy-to-use and general tool for assessing the risk of cognitive impairment over six years. Through this nomogram, people can estimate the risk of cognitive impairment for older adults aged 65 and above. Public health practitioners can use it to evaluate future risk of cognitive impairment in later surveys. Physicians may also use it as an instructional tool for preventive interventions to potentially maintain better cognitive function in the clinic. For instance, older adults may maintain better cognitive function via watching TV or listening to the radio, growing flowers or raising pets, and undergoing treatment to maintain ADL or IADL independence, good chewing ability, and good visual function. However, whether it is applicable to other countries remains to be validated by future studies.
Supplementary Material
Funding:
This work was jointly supported by the National Natural Sciences Foundation of China (grant numbers 71490732, 81273160, and 81573247); National Institute on Aging (grant number 2P01AG031719); United Nations Fund for Population Activities, and Claude D. Pepper Older Americans Independence Centers grant (grant number 5P30 AG028716 from NIA to VBK).
Footnotes
Publisher's Disclaimer: This is a PDF file of an article that has undergone enhancements after acceptance, such as the addition of a cover page and metadata, and formatting for readability, but it is not yet the definitive version of record. This version will undergo additional copyediting, typesetting and review before it is published in its final form, but we are providing this version to give early visibility of the article. Please note that, during the production process, errors may be discovered which could affect the content, and all legal disclaimers that apply to the journal pertain.
Conflicts of Interest: The authors have disclosed no conflicts of interest.
References:
- 1.Schrag A, Siddiqui UF, Anastasiou Z, et al. Clinical variables and biomarkers in prediction of cognitive impairment in patients with newly diagnosed Parkinson’s disease: a cohort study. Lancet Neurol 2017;16:66–75. [DOI] [PMC free article] [PubMed] [Google Scholar]
- 2.Espeland MA, Carmichael O, Yasar S, et al. Sex-related differences in the prevalence of cognitive impairment among overweight and obese adults with type 2 diabetes. Alzheimers Dement 2018;14:1184–1192. [DOI] [PMC free article] [PubMed] [Google Scholar]
- 3.Salthouse TA. Trajectories of normal cognitive aging. Psychol Aging 2019;34:17–24. [DOI] [PMC free article] [PubMed] [Google Scholar]
- 4.National Bureau of Statistics of China. Statistical Communique of the People’s Republic of China Statistical Communique of the People’s Republic of China on the 2019 National Economic and Social Development [online]. Available at: http://www.stats.gov.cn/tjsj/zxfb/202002/t20200228_1728913.html. Accessed March 20, 2020.
- 5.Vauzour D, Camprubi-Robles M, Miquel-Kergoat S, et al. Nutrition for the ageing brain: Towards evidence for an optimal diet. Ageing Res Rev 2017;35:222–240. [DOI] [PubMed] [Google Scholar]
- 6.Cummings JL, Morstorf T, Zhong K. Alzheimer’s disease drug-development pipeline: few candidates, frequent failures. Alzheimers Res Ther 2014;6:37. [DOI] [PMC free article] [PubMed] [Google Scholar]
- 7.Livingston G, Sommerlad A, Orgeta V, et al. Dementia prevention, intervention, and care. Lancet 2017;390:2673–2734. [DOI] [PubMed] [Google Scholar]
- 8.Locke DEC, Ivnik RJ, Cha RH, et al. Age, family history, and memory and future risk for cognitive impairment. J Clin Exp Neuropsyc 2008;31:111–116. [DOI] [PMC free article] [PubMed] [Google Scholar]
- 9.Song X, Mitnitski A, Rockwood K. Nontraditional risk factors combine to predict Alzheimer disease and dementia. Neurology 2011;77:227–234. [DOI] [PMC free article] [PubMed] [Google Scholar]
- 10.Exalto LG, Biessels GJ, Karter AJ, et al. Risk score for prediction of 10 year dementia risk in individuals with type 2 diabetes: a cohort study. Lancet Diabetes Endo 2013;1:183–190. [DOI] [PMC free article] [PubMed] [Google Scholar]
- 11.Li J, Ogrodnik M, Devine S, et al. Practical risk score for 5-, 10-, and 20-year prediction of dementia in elderly persons: Framingham Heart Study. Alzheimers Dement 2018;14:35–42. [DOI] [PMC free article] [PubMed] [Google Scholar]
- 12.Licher S, Leening MJG, Yilmaz P, et al. Development and validation of a dementia risk prediction model in the general population: an analysis of three longitudinal studies. Am J Psychiat 2018:2011–2018. [DOI] [PubMed] [Google Scholar]
- 13.Downer B, Kumar A, Veeranki SP, Mehta HB, Raji M, Markides KS. Mexican-American dementia nomogram: development of a dementia risk index for Mexican-American older adults. J Am Geriatr Soc 2016;64:e265–e269. [DOI] [PMC free article] [PubMed] [Google Scholar]
- 14.Li CI, Li TC, Liu CS, et al. Risk score prediction model for dementia in patients with type 2 diabetes. Eur J Neurol 2018;25:976–983. [DOI] [PubMed] [Google Scholar]
- 15.Yin Z, Shi X, Kraus VB, et al. Gender-dependent association of body mass index and waist circumference with disability in the Chinese oldest old. Obesity 2014;22:1918–1925. [DOI] [PMC free article] [PubMed] [Google Scholar]
- 16.Zeng Y. Toward deeper research and better policy for healthy aging-using the unique data of Chinese Longitudinal Healthy Longevity Survey. China Economic Journal 2012;5:131–149. [DOI] [PMC free article] [PubMed] [Google Scholar]
- 17.Tombaugh TN, McIntyre NJ. The Mini-Mental State Examination: a comprehensive review. J Am Geriatr Soc 1992;40:922–935. [DOI] [PubMed] [Google Scholar]
- 18.Katzman R, Zhang MY, Ouang Ya-Qu, et al. A Chinese version of the Mini-Mental State Examination; impact of illiteracy in a Shanghai dementia survey. J Clin Epidemiol 1988;41:971–978. [DOI] [PubMed] [Google Scholar]
- 19.Pezzotti P, Scalmana S, Mastromattei A, Di Lallo D, Progetto AWG, The PAWG. The accuracy of the MMSE in detecting cognitive impairment when administered by general practitioners: a prospective observational study. Bmc Fam Pract 2008;9:29. [DOI] [PMC free article] [PubMed] [Google Scholar]
- 20.Cui GH, Yao YH, Xu RF, Chen SD, Cheng Q. Cognitive impairment using education-based cutoff points for CMMSE scores in elderly Chinese people of agricultural and rural Shanghai China. Acta Neurol Scand 2011;124:361–367. [DOI] [PubMed] [Google Scholar]
- 21.Zhang MYKR, Salmon D, Jin H, et al. The prevalence of dementia and Alzheimer’s disease in Shanghai, China: impact of age, gender, and education. Ann Neurol 1990;27:428–437. [DOI] [PubMed] [Google Scholar]
- 22.Yang M, Ding X, Dong B. The Measurement of Disability in the Elderly: A Systematic Review of Self-Reported Questionnaires. J Am Med Dir Assoc 2014;15:150–151. [DOI] [PubMed] [Google Scholar]
- 23.Naka O, Anastassiadou V, Pissiotis A. Association between functional tooth units and chewing ability in older adults: a systematic review. Gerodontology 2014;31:166–177. [DOI] [PubMed] [Google Scholar]
- 24.Tibshirani R. Regression shrinkage and selection via the lasso: a retrospective. J R Stat Soc B 2011;73:273–282. [Google Scholar]
- 25.Pavlou M, Ambler G, Seaman SR, et al. How to develop a more accurate risk prediction model when there are few events. BMJ 2015; 351:h3868. [DOI] [PMC free article] [PubMed] [Google Scholar]
- 26.Collins GS, Reitsma JB, Altman DG, Moons K. Transparent reporting of a multivariable prediction model for individual prognosis or diagnosis (TRIPOD): the TRIPOD Statement. Bmc Med 2015;13:1. [DOI] [PMC free article] [PubMed] [Google Scholar]
- 27.Kamarudin AN, Cox T, Kolamunnage-Dona R. Time-dependent ROC curve analysis in medical research: current methods and applications. Bmc Med Res Methodol 2017;17:53. [DOI] [PMC free article] [PubMed] [Google Scholar]
- 28.Fitzgerald M, Saville BR, Lewis RJ. Decision Curve Analysis. JAMA 2015;313:409–410. [DOI] [PubMed] [Google Scholar]
- 29.Hippisley-Cox J, Coupland C. Development and validation of QMortality risk prediction algorithm to estimate short term risk of death and assess frailty: cohort study. BMJ 2017:j4208. [DOI] [PMC free article] [PubMed] [Google Scholar]
- 30.Verhaeghen PSTA. Meta-analyses of age-cognition relations in adulthood: estimates of linear and nonlinear age effects and structural models. Psychol Bull 1997;122:231–249. [DOI] [PubMed] [Google Scholar]
- 31.Marrie RA, Dawson NV, Garland A. Quantile regression and restricted cubic splines are useful for exploring relationships between continuous variables. J Clin Epidemiol 2009;62:511–517. [DOI] [PubMed] [Google Scholar]
- 32.Iasonos A, Schrag D, Raj GV, Panageas KS. How to build and interpret a nomogram for cancer prognosis. J Clin Oncol 2008;26:1364–1370. [DOI] [PubMed] [Google Scholar]
- 33.Jessen F, Wiese B, Bickel H, et al. Prediction of dementia in primary care patients. Plos One 2011;6: e16852. [DOI] [PMC free article] [PubMed] [Google Scholar]
- 34.Seshadri S, Beiser A, Au R, et al. Operationalizing diagnostic criteria for Alzheimer’s disease and other age-related cognitive impairment—Part 2. Alzheimers Dement 2011;7:35–52. [DOI] [PMC free article] [PubMed] [Google Scholar]
- 35.Depp C, Vahia IV, Jeste D. Successful aging: focus on cognitive and emotional health. Annu Rev Clin Psychol 2010;6:527–550. [DOI] [PubMed] [Google Scholar]
- 36.van Boxtel MPJ, Speckens AE. Mindfulness, cognitive function and ‘successful ageing’. Tijdschr Gerontol Geriatr 2014;45:137–143. [DOI] [PubMed] [Google Scholar]
- 37.Kuo H, Leveille SG, Yu Y, Milberg WP. Cognitive function, habitual gait speed, and late-life disability in the National Health and Nutrition Examination Survey (NHANES) 1999–2002. Gerontology 2007;53:102–110. [DOI] [PMC free article] [PubMed] [Google Scholar]
- 38.Di Carlo A, Baldereschi M, Lamassa M, et al. Daily function as predictor of dementia in cognitive impairment, no dementia (CIND) and mild cognitive impairment (MCI): an 8-year follow-up in the ILSA Study. J Alzheimers Dis 2016;53:505–515. [DOI] [PubMed] [Google Scholar]
- 39.Lexomboon D, Trulsson M, Wårdh I, Parker MG. Chewing ability and tooth loss: association with cognitive impairment in an elderly population study. J Am Geriatr Soc 2012;60:1951–1956. [DOI] [PubMed] [Google Scholar]
- 40.Zhu X, Qiu C, Zeng Y, Li J. Leisure activities, education, and cognitive impairment in Chinese older adults: a population-based longitudinal study. Int Psychogeriatr 2017;29:727–739. [DOI] [PMC free article] [PubMed] [Google Scholar]
Associated Data
This section collects any data citations, data availability statements, or supplementary materials included in this article.