

Abstract
Organ size and shape are precisely regulated to ensure proper function. The four sepals in each Arabidopsis thaliana flower must maintain the same size throughout their growth to enclose and protect the developing bud. Here we show that DEVELOPMENT RELATED MYB-LIKE1 (DRMY1) is required for both timing of organ initiation and proper growth, leading to robust sepal size in Arabidopsis. Within each drmy1 flower, the initiation of some sepals is variably delayed. Late-initiating sepals in drmy1 mutants remain smaller throughout development resulting in variability in sepal size. DRMY1 focuses the spatiotemporal signaling patterns of the plant hormones auxin and cytokinin, which jointly control the timing of sepal initiation. Our findings demonstrate that timing of organ initiation together with growth and maturation contribute to robust organ size.
Development is remarkably reproducible, generally producing the same organ with invariant size, shape, structure, and function in each individual. For example, mouse brains vary in size by only about 5%1, and Arabidopsis floral organs are strikingly uniform2. Defects in organ size control mechanisms contribute to many human diseases including hypertrophy and cancer3,4. Uniformity of fruit size is an important criterion for packaging and shipping fruit to market5. In this context, robustness is the ability to form organs reproducibly despite perturbations, such as stochasticity at the molecular and cellular level as well as environmental fluctuations6. Robustness has fascinated biologists since Waddington brought the issue to prominence in 19427. One proposed scenario for achieving organ size robustness is that organs can sense their size and compensate through adjusting their maturation time until the organ has reached the correct size8. For example, in Drosophila, damaged or abnormally growing imaginal disks activate the expression of Drosophila insulin-like peptide8 (DILP8), which delays metamorphosis and thus allows damaged disks to reach the correct size9,10. These compensatory mechanisms can mask early-stage defects. In other cases, robustness is crucial throughout organ growth. For instance, in Arabidopsis thaliana, all four sepals of the flower must maintain equal size throughout development to keep the bud closed and protect the developing reproductive organs11. Likewise in humans, two arms must maintain equal length from infancy to adulthood so that we can pick up and carry objects12. In such cases, delaying maturation to compensate for early size defects is not effective, and how robustness is achieved is still poorly understood.
Sepals, the outermost floral organs, are a good model system for investigating the mechanisms of organ size robustness throughout development because individual plants can produce more than 50 invariant flowers. This allows statistical assessment of organ size uniformity within a single organism that cannot be achieved in most model systems. Sepals arise from floral meristems (FM, stem cells that give rise to floral organs), which initiate from the periphery of the inflorescence meristem (IM, stem cells at the tip of the plant that give rise to the flowers; Fig. 1a). On the flank of Arabidopsis thaliana floral meristems, four sepals initiate and rapidly grow to cover that flower. The four growing sepals in a flower must maintain the same size and shape to enclose and protect developing reproductive organs throughout growth before the flower blooms11; thus, continuous robustness of size and shape is required for sepal function (Fig. 1a). We established a nomenclature for the four sepals in a flower. The sepal closest to the IM is the inner sepal, while the sepal opposite, farthest from the IM, is the outer sepal. The two sepals on the sides are lateral sepals (Fig. 1a). Here we consider the hypothesis that sepals can achieve robustness throughout their development by synchronization of initiation and maturation. This synchronization hypothesis predicts that early defects in the timing of initiation would cause cascading defects in organ size because late initiating organs would not have as much time to grow before the organs mature synchronously.
Fig. 1. Mutations in the DRMY1 gene lead to increased variation in sepal size and shape.

a, Anatomical diagrams. Floral meristems (FM) emerge from the inflorescence meristem (IM). Four sepals (S) initiate evenly from the periphery of the floral meristem. The inner sepal is closest to the IM, the outer sepal farthest from the IM, and the lateral sepals on the sides. Note that throughout development, the sizes of sepals are always similar. The four sepals are the outermost floral organs surrounding the petals, stamens, and carpels in the mature flower as shown with top view and side view.
b, Wild-type (WT) and vos2 (drmy1–2) flowers as closed buds (stage 12, left) and after blooming (stage 15, right). Orange arrows: smaller sepals within each vos2 (drmy1–2) flower. Scale bars:1 mm. n = 10 flowers for each stage and genotype.
c, The sepal area distribution is wider for the vos2 (drmy1–2) mutant compared to WT. Area variability was quantified by the coefficient of quartile variation (CQV) and was significantly higher in vos2 (one-sided permutation test ***: p-value < 0.0001). The average area of vos2 sepals was significantly lower than wild type (one-sided permutation test ***: p-value < 0.0001). The boxes extend from the lower to upper quartile values of the data, with a line at the median. The whiskers extend past 1.5 of the interquartile range. n = 400 for both WT and vos2 (drmy1–2) 10th to 25th flowers along the main branch. Outer, inner, and lateral sepals were pooled together.
d, Coefficients of variation (CV) calculated for the areas of the four sepals in each single flower. Sequential flowers along the main branch of the stem (flower number on the x-axis) were measured at stage 14. Three replicates are included for both WT (blue) and vos2 (drmy1–2, red) mutants, and original individual sample curves can be found in Source Data. The average CV of the 3 replicates are presented as thick blue and red lines with the SD as partially translucent background.
e, vos2 (drmy1–2) mutants also exhibit higher variation in inner and lateral sepal shape. Superimposed outlines of stage 14 sepals from WT and vos2 (drmy1–2) mutants were normalized by sepal area. The black outline is the median. n = 60 sepals for both WT and vos2 (drmy1–2).
f, Gene model for the DRMY1 gene (AT1G58220). Orange box indicates the location of the MYB domain. A G to A point mutation was identified at an exon and intron junction in the vos2 (drmy1–2) mutant (wild-type sequence top, drmy1–2 sequence bottom, intron in lower case, exon in upper case). drmy1–1 was reported with a T-DNA insertion in the first intron.
g, Expression pattern of pDRMY1::3XVENUS-N7 (white). The expression of nuclear localized VENUS driven by the DRMY1 promoter was observed in young stage flowers, especially the peripheral zones. Cell walls were stained with propidium iodide (PI, red). Scale bar: 20 μm. n = 3 inflorescences.
h, Scanning electron micrographs show that the sepal size variability phenotype can be observed at early stages (stage 5) and remains visible through late stages. Red arrowhead: delayed sepal initiation at stage 5; Red arrows: smaller sepals within the drmy1–2 flower; Scale bar at top panel: 30μm; Scale bar at bottom panel: 200 μm. n = 2 flowers.
Results
Mutations in DRMY1 cause variability in sepal size.
Robustness mechanisms can be identified by screening for mutants with increased variability13,14. Accordingly, we screened for mutants exhibiting variable sizes or shapes of the sepals, thus disrupting robustness14. Our previous analysis of the variable organ size and shape1 (vos1) mutant revealed that highly variable cell growth is averaged in time and space to create robust organs and that synchrony of sepal maturation contributes to size robustness14. From that mutant screen, we also isolated the variable organ size and shape2 (vos2) mutant which had sepals of different sizes within the same flower. Consequently, vos2 sepals failed to form a complete barrier to protect the inner reproductive organs (Fig. 1b). To exclude the possibility that the variability arose from the altered sepal number, we counted the number of sepals produced in vos2 flowers and found that it was largely unaffected, with 4 sepals present in >92% (164/177) of vos2 flowers compared to 100% (207/207) of wild-type flowers (Extended Data Fig. 1a). Next, we quantified the size distribution of mature sepals from many mutant plants, in flowers with 4 sepals. We found that vos2 mutant sepals had increased variability in area and reduced average area compared to wild type, especially for inner and lateral sepals (Fig. 1c and Extended Data Fig. 1e). We further assayed individual flowers developing sequentially along the main branch of a single plant and found that the area of the four sepals in each vos2 flower consistently exhibited higher coefficients of variation (CV) and smaller averages in sepal area than wild type (Fig. 1d and Extended Data Fig. 1b). Additionally, the shapes of vos2 inner and lateral mutant sepals were more variable than wild-type sepals, after normalizing for area (Fig. 1e and Extended Data Fig. 1c). The defect is not restricted to sepals, as vos2 petal areas are also more variable than wild type (Extended Data Fig. 1f). VOS2 is required for robustness of floral organ size and shape.
Map-based cloning of vos2 identified a G to A point mutation in a splice acceptor site of the gene (AT1G58220) encoding the MYB domain protein DEVELOPMENT RELATED MYB LIKE 1 (DRMY1; Fig. 1f). This point mutation caused altered splicing resulting in premature stop codons (Extended Data Fig. 2a), as well as a dramatic decrease of DRMY1 transcript level (Extended Data Fig. 2b). A T-DNA insertion allele, drmy1–1, was recently reported as broadly affecting cell expansion15. Thus, we renamed vos2 as drmy1–2. To verify that mutations in DRMY1 caused the variable sepal size and shape phenotype, we observed that the drmy1–1 T-DNA insertion allele also exhibited sepal size variability and that drmy1–1 and drmy1–2 alleles failed to complement, indicating they were alleles of the same gene (Extended Data Fig. 2c–f). Furthermore, expression of DRMY1 under its endogenous promoter rescued the sepal variability phenotypes (20/21 rescued in T1), confirming the role of DRMY1 in regulating sepal robustness (Extended Data Fig. 2g).
To determine when DRMY1 functions in sepal robustness, we examined reporters for DRMY1 expression. The DRMY1-mCitrine fusion protein (pDRMY1::DRMY1-mCitrine) rescued the drmy1–2 mutant phenotypes (21/23 rescued in T1), indicating that the fusion protein is functional (Extended Data Fig. 2h). The DRMY1 reporters were expressed broadly within young flowers, floral meristems and inflorescence meristems (Fig. 1g, and Extended Data Fig. 2i, j). The DRMY1 transcriptional reporter had somewhat higher expression within the periphery of developing floral and inflorescence meristems, hinting that DRMY1 might function in organ initiation.
Sepal primordium initiation is variably delayed in drmy1–2 mutants.
Since DRMY1 reporters were expressed before and during sepal primordium initiation, we used scanning electron microscopy to determine the stage at which the defect in sepal size robustness was first visible in drmy1–2 mutants. Sepal variability in drmy1–2 arose during initiation and was visible throughout flower development (Fig. 1h). In wild type, the four sepals were the first organ primordia to initiate at the periphery of the floral meristem. At the same stage in drmy1–2, the flowers exhibited a normal-looking outer sepal. However, the inner and lateral sepal primordia were often absent or appeared smaller than wild type, suggesting that their initiation was delayed (Fig. 1h). As mentioned above, >92% of drmy1–2 flowers had four sepals at maturity. This was consistent with a delay rather than a block of sepal initiation.
To determine how much the timing of sepal initiation is actually delayed in the drmy1–2 mutant, we live imaged wild-type and drmy1–2 flowers throughout the initiation of sepal primordia (Fig. 2a, b, and Supplementary Video 1 and 2). We defined the bulging of sepal primordia out from the floral meristem as the morphological initiation event, which we detected by observing the Gaussian curvature of the meristem surface. A clear band of positive curvature (red in the heat map) at the flank of the floral meristem indicated the initiation of the sepal (Fig. 2c, d). The initiation of the outer sepal occurred first, and was set as the starting point, followed by the inner and then lateral sepals. For wild type, the time intervals between the initiation of outer and inner sepals were always around 6 hours (Fig. 2a, c, and e). Within 12 hours after the initiation of the outer sepal, the two lateral sepals initiated (Fig. 2a, c, and f). The sepal primordia then grew rapidly to cover the floral meristem by 30 hours (Fig. 2a).
Fig. 2. Sepal initiation is variably delayed in the drmy1–2 mutant.

a,b, Live imaging of sepal initiation in wild type (a) and drmy1–2 (b). Plasma membrane marker (p35S::mCitrine-RCI2A) is shown in greyscale. The small bulge-out is defined as sepal initiation. Blue arrowheads in WT and red arrowheads drmy1–2 indicate initiated sepals. Scale bars: 25 μm. n = 15 for WT and n = 18 for drmy1–2.
c,d, Gaussian curvature heatmap detecting changes in curvature associated with initiation for the live imaging sequences shown in a and b. The red color represents the dome shape while the blue color represents the saddle shape. Thus, a strong red band at the periphery (white arrowheads) reveals initiated sepals. Scale bars: 25 μm.
e, Histogram showing the time interval between the initiation of the outer sepal and the inner sepal in each flower. n = 12 for WT flowers and 17 for drmy1–2 flowers. Note WT inner sepals initiate robustly 6 hours after the outer sepals, while the time is variable and generally longer in drmy1–2.
f, Histogram showing the time interval between the initiation of the outer sepal and the lateral sepals for each flower. n = 12 for WT flowers and 17 for drmy1–2 flowers. Note WT inner sepals initiate robustly 12 hours after the outer sepals, while the time is variable and generally longer in drmy1–2.
g, Atomic Force Microscopy measurement of cell wall stiffness (elastic modulus) for centers of inflorescence meristems (IM), centers of floral meristems (FM), and peripheries of floral meristems where sepal primordia emerge (SP; highlighted with black dotted boxes) of WT and the drmy1–2 mutants. In the heatmap of apparent elastic modulus shown here, red indicates stiffer and blue indicates softer. (n = 11) Scale bars: 10 μm.
In contrast, for the drmy1–2 mutant, the time intervals for the initiation of inner and lateral sepals were elongated and more variable (Fig. 2b, and d–f). In drmy1–2, the inner sepals initiated anywhere from 6 to 36 hours after the outer sepals (Fig. 2e). Likewise, the lateral drmy1–2 sepals initiated from 12 to 30 hours after the outer sepal (Fig. 2f). Initiation of the lateral sepals occasionally occurred before the initiation of the inner sepal in drmy1–2 flowers. Frequently, two sepal primordia appeared to form instead of one at the inner position of drmy1–2 flowers (e.g. highlighted with red arrowheads in Fig. 2b). However, further live imaging revealed that most of these fused to form a single sepal with two tips, resulting in the four sepals finally observed in drmy1–2 flowers (Extended Data Fig. 1d). In addition, it took much more time for drmy1–2 sepal primordia to cover the whole floral meristem (Supplementary Video 2).
We performed our analysis relative to the initiation of the outer sepal because our hypothesis is that the delay in sepal initiation of inner and lateral sepals relative to the outer sepal accounts for their smaller sizes through flower development. To test whether there was also a delay in drmy1–2 outer sepal initiation we measured the flower radius before and at outer sepal initiation and saw no change in drmy1–2 versus wild type (Extended Data Fig. 3a). We speculate that some positional aspect of being close to the cryptic bract or some other remnant of floral meristem development causes outer sepal initiation to be more robust. Thus, initiation of the outer sepal is a reasonable marker for staging.
Stiffer cell walls in drmy1–2 mutants correlate with delayed sepal initiation.
DRMY1 encodes a MYB domain protein, and most MYB domain proteins function as transcription factors16. To identify the biological processes that are regulated by DRMY1 to promote robust timing of sepal primordium initiation, we performed an RNA-seq experiment comparing inflorescences and flowers of drmy1–2 mutants to wild type. Gene ontology (GO) term analysis of the differentially expressed genes revealed an enrichment of biological processes including “cell wall modification”, “response to hormone stimulus” and “cellular metabolic process” (Extended Data Fig. 3e, f; Supplementary Data 1). Plant cell walls become softer through cell wall modification during primordium initiation to allow outgrowth. Genetically stiffening the cell wall is sufficient to block the initiation of organ primordia17,18. Our RNA-seq data suggested that cell wall stiffness might be changed in drmy1–2 mutants due to altered cell wall modifications. To determine whether the delayed organ initiation in drmy1–2 might result from a stiffer cell wall, we first used Atomic Force Microscopy (AFM) to quantify the cell wall stiffness of sepal primordia, floral meristems, and inflorescence meristems. For all three, the cell wall was significantly stiffer in the drmy1–2 mutant (higher average apparent elastic modulus; Fig. 2g, and Extended Data Fig. 3b), consistent with the delay of primordium initiation. We also used osmotic treatment to assess cell wall stiffness by quantifying the shrinkage of cell walls when internal turgor pressure was decreased. Osmotic treatment of wild-type and drmy1–2 developing sepals further confirmed that cell walls were stiffer in the drmy1–2 mutant (Extended Data Fig. 3c, d). Our data is consistent with the model that stiffer cell walls in drmy1–2 led to delayed sepal initiation, and consequently higher sepal size variability.
Variably delayed initiation disrupts sepal size robustness throughout development.
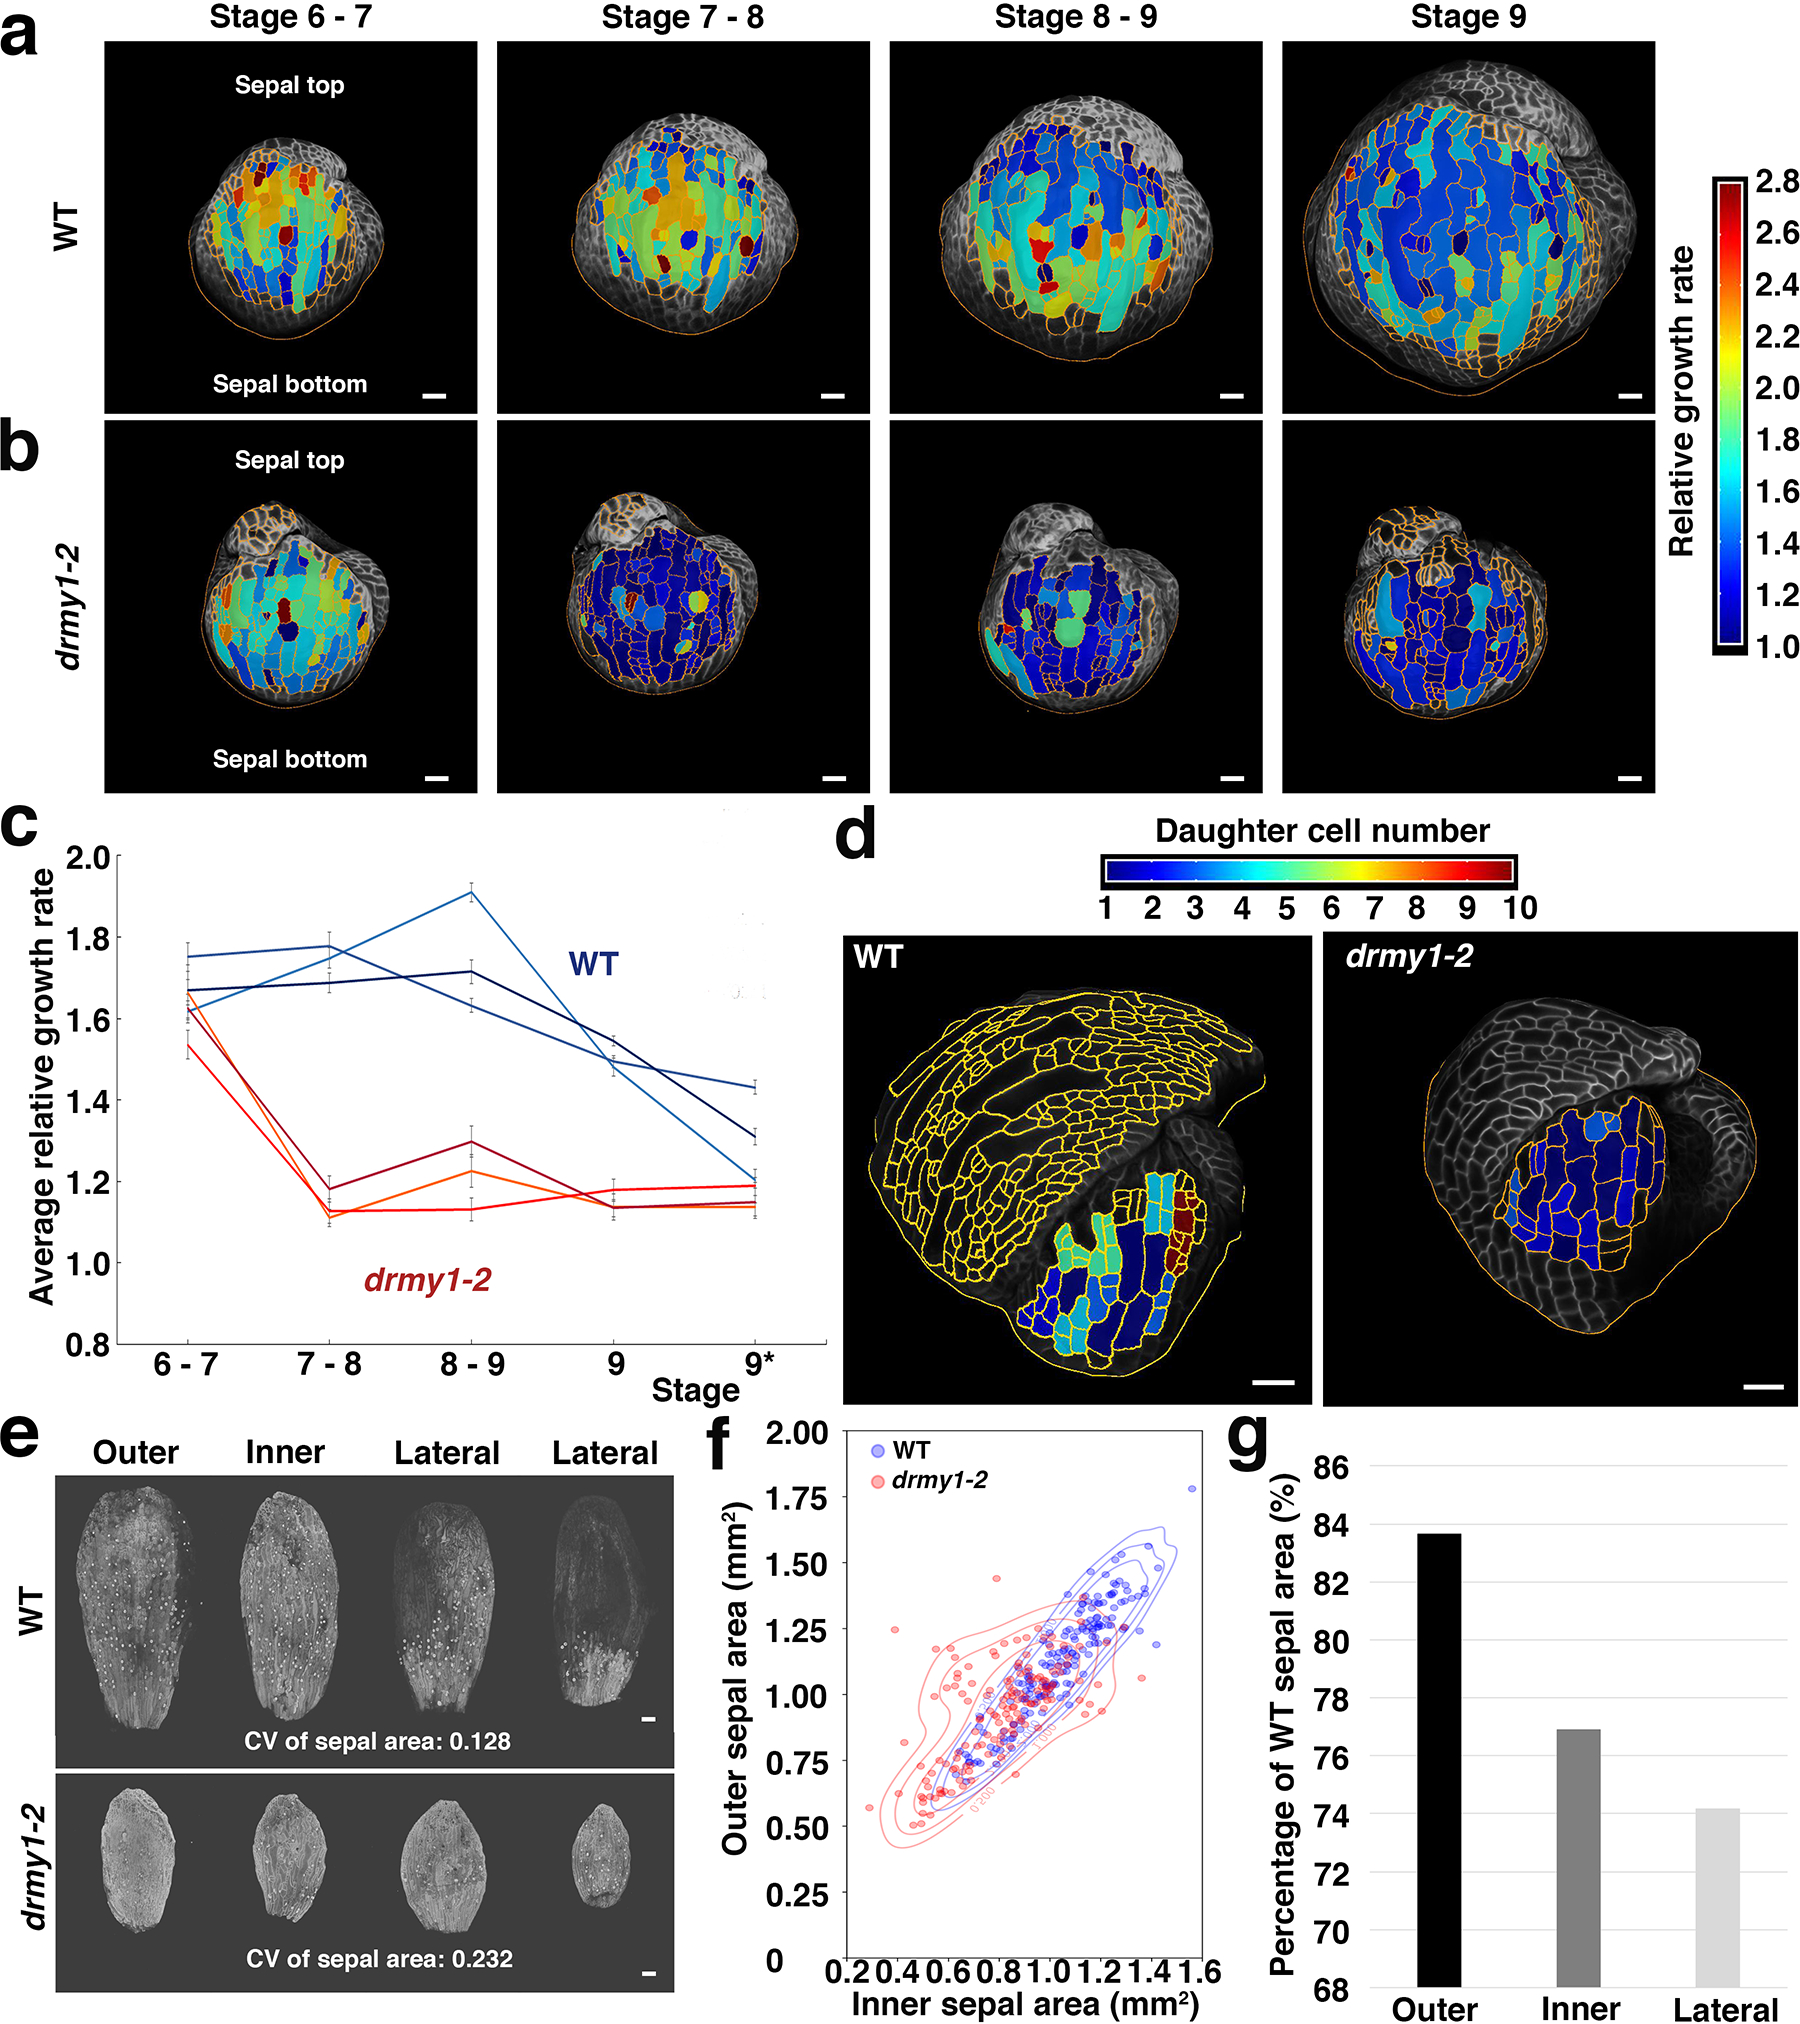
To test whether delayed sepal initiation decreases sepal size throughout flower development, we live imaged sepals from their initiation throughout their development over 11 days (Fig. 3a, b and Extended Data Fig. 3e). In wild type, after robust initiation, the sepals maintained equivalent sizes so that flowers remained closed throughout development (Fig. 3a). At the end of our live imaging series, sepal sizes were nearly equivalent (Extended Data Fig. 4e). In contrast, in drmy1–2 flowers, sepals with delayed initiation remained smaller than other sepals throughout development, so that flowers remained open throughout development (Fig. 3b). At the end of our live imaging series, these sepals had variable sizes (Extended Data Fig. 4e). At maturity in vivo, wild-type outer sepals are slightly larger than inner sepals, which in turn are slightly larger than lateral sepals corresponding with their timing and order of initiation (Fig. 3f). In wild type, outer and inner sepal sizes are correlated, whereas in drmy1–2 the correlation is weakened presumably by the delayed and variable initiation (Extended Data Fig. 4f). Furthermore, the drmy1–2 inner and lateral sepals had a more severe decrease in size relative to wild type than outer sepals, correlating with their delayed initiation (Extended Data Fig. 4g). These results indicate that precisely timed initiation is crucial for robustness in organ size, consistent with the synchronization hypothesis. Our results imply that late initiating sepals cannot catch up because they have less time to grow, resulting in variable sepal size.
Fig. 3. Sepals with delayed initiation in drmy1–2 mutants remain smaller throughout development.

a,b, Live imaging of WT (a) and the drmy1–2 mutant (b) flowers every 24 hours. The closed flower indicates robust sepal size in WT while the drmy1–2 flower remains open due to variable sepal size. n = 3; Inset: the top view of the flowers for the first two time points. Arrows: inner sepals; Scale bars: 100 μm; Scale bars in insets: 20 μm.
c,d, 12-hour early stage (from stage 4 to stage 6) cellular growth heatmap for both WT (c) and drmy1–2 (d) outer (left) and lateral (center) sepals. The sepal cellular growth rate was quantified from live imaging of sepals immediately following initiation. For the heatmap, red indicates high relative growth rate while blue indicates low relative growth rate. Relative growth rate is defined as final cell size divided by initial cell size. Segmented cells are outlined in dashed yellow and superimposed on the meshed surface where the cell plasma membrane images are projected (greyscale). n = 3 biological replicates (flowers) that all show similar trends. Scale bars: 20 μm.
e, Average cell growth rate curves of these early stage outer and lateral sepals for both WT and drmy1–2. Error bars: standard errors of the mean. n = 3 biological replicates (flowers) that all show similar trends. This graph shows the quantification of one flower.
f, The sepal area distribution for outer, inner and lateral sepals. The boxes extend from the lower to upper quartile values of the data and the whiskers extend past 1.5 of the interquartile range. Small dots for each box indicate the outliers. Sepals from different flowers were pooled together. n = 48 for both WT and drmy1–2 10th to 25th flowers along the main branch. Two-tailed Student’s t test * p-value < 0.05 (p-value for the mean of sepal area, WT versus drmy1–2 outer sepal: 1.62E-12; WT versus drmy1–2 inner sepal: 3.70E-13; WT versus drmy1–2 lateral sepal: 3.41E-39).
Initiation is the primary cause of variability in drmy1–2 mutants.
We asked whether subsequent sepal growth contributes to variability in drmy1–2 sepal size. We tracked cells and their resultant daughters in sepals after initiation, enabling us to measure cell growth and division rates. In both outer and lateral sepals, drmy1–2 cellular growth was somewhat slower than wild type (Fig. 3c–e and Extended Data Fig. 3a–c). Cell division was reduced in the drmy1–2 sepals (Extended Data Fig. 3d). These results indicate that drmy1 sepals also exhibit growth defects. However, in both drmy1–2 and wild type, the lateral sepal growth was faster than the outer sepal growth, which means the growth differences are slightly decreasing size variability instead of promoting it (Fig. 3c–e).
Previously, we have shown that spatiotemporal averaging of variable cell growth results in sepal size and shape robustness and that this process is disrupted in vos114. Spatiotemporal averaging occurred normally in the drmy1–2 mutant during early stage growth, indicating that the loss of robustness was due to distinct mechanisms (Extended Data Fig. 5). Thus, we conclude the variability in the timing of sepal primordium initiation in drmy1–2 is the major source of variability in sepal size throughout development.
Weak and diffuse auxin responses in drmy1–2 mutants correlate with delayed sepal initiation.
We next investigated how DRMY1 regulates the timing of sepal initiation. In the flower, auxin induces cell wall loosening, promoting cell expansion and allowing the primordium to emerge19. Before the primordium initiates or bulges, the first sign of the incipient primordium is a localized region of auxin signaling created by the polarized transport of auxin20–23. We examined the auxin response reporter pDR5rev::3XVENUS-N7 (DR5)20,24. In wild-type floral meristems, we found that the positions of incipient sepal primordia were marked by the expression of DR5 before primordium initiation occurs (Fig. 4a). Consistent with the variably delayed primordium initiation in drmy1–2, expression of the DR5 auxin response reporter was weaker and more diffuse in drmy1–2 mutants (Fig. 4a and Extended Data Fig. 6a, quantified in Fig. 4c). Weaker and more diffuse DR5 fitted with higher stiffness and slower growth in drmy1-2 mutants. Still, sepal primordia emerged from regions of auxin signaling in drmy1–2 mutants. Positions where auxin signaling reaches high enough levels to initiate primordia are determined by the polar localization of the auxin efflux carrier PINFORMED1 (PIN1)20,23. PIN1 protein continued to polarize in drmy1–2 inflorescence meristems and early flowers, so the more diffuse auxin response could not be easily explained by a loss of PIN1 polarity (Extended Data Fig. 6c, d). Consistent with a decrease in auxin signaling, drmy1–2 mutant plants exhibited a number of additional phenotypes associated with auxin signaling mutants: enhanced bushiness of the plant, shorter plant stature25, smaller root meristem26, shorter roots and fewer lateral roots27 (Extended Data Fig. 6e–g). Together these data suggest auxin signaling/response is reduced and more diffuse in drmy1–2 mutants, correlating with delayed sepal primordium initiation.
Fig. 4. Focused auxin and cytokinin signaling are required for robust sepal initiation.

a, Expression of the auxin response reporter DR5 (DR5::3XVENUS-N7, white) accumulates at the four incipient sepal initiation positions in WT. DR5 expression is lower and more diffuse in the drmy1–2 mutant. p35S::mCherry-RCI2A: red, plasma membrane; Scale bars: 10 μm. n = 10 flowers.
b, Expression of the cytokinin response reporter TCS (pTCS::GFP, grey) accumulates at the four incipient sepal initiation positions in WT. TCS expression is enhanced and more diffuse in the drmy1–2 mutant. Chlorophyll auto-fluorescence: red; Scale bars: 10 μm. n = 10 flowers.
c, Quantification of DR5 signal in WT (blue) and drmy1–2 (red) in stage 2 flowers when no sepals have initiated yet. Signal was quantified radially for the 360 degrees of the approximately circular flower meristem. The top-left region between the outer sepal and the lateral sepal was defined as angle 0. Angles increased in the counterclockwise direction and normalized signal values within bins of the size of 1° are plotted. n = 10 for both WT and drmy1–2, and original individual sample curves can be found in Source Data. The average signal intensity of the 10 replicates are presented as thick blue and red lines with the SD as partially translucent background. Note that four clear peaks of DR5 signal are present in WT. In drmy1–2, the outer sepal peak is evident, although weaker, and the remainder of the flower signal is relatively low without evident clusters.
d, Quantification of TCS signals in WT (blue) and drmy1–2 (red) flowers at stage 2 when no sepals have initiated yet. n = 10 for both WT and drmy1–2, and original individual sample curves can be found in Source Data. The average signal intensity of the 10 replicates are presented as thick blue and red lines with the SD as partially translucent background. Note that four clusters of TCS signal are evident in WT, whereas in drmy1–2, TCS expression is higher and tends to surround the meristem.
e, Stage 6 flowers, where the sepals just close, from WT inflorescences cultured in 5 μM synthetic cytokinin BAP or mock media for 6 days. Blue arrowheads: delayed sepal initiation. Scale bars: 10 μm. Quantified in Extended Data Fig. 7c.
f, Stage 6 drmy1–2 flowers from inflorescences cultured in 5μM BAP or mock media for 6 days. Red arrowheads: smaller sepals, indicating delayed sepal initiation. Scale bars: 10 μm. Quantified in Extended Data Fig. 7c. Note drmy1–2 flowers cultured in BAP exhibit phyllotaxis defects.
g, The extent of disruption of auxin and cytokinin responses correlates with the degree of variability of sepal initiation timing. Mutation of ahp6, a cytokinin signaling inhibitor, has a very mild phenotype on its own, but enhances the drmy1–2 sepal initiation phenotypes. Quadruple mutations of the auxin receptors tir1afb1–1afb2–1afb3–1 (tir1afb1-2-3 for short) has a severely delayed sepal initiation phenotype. Cell walls stained with Propidium Iodide (PI) in grayscale. Yellow arrowheads: smaller sepal than normal, indicating the delayed sepal initiation. Scale bars: 50 μm. Note that tir1 afb1-2-3 mutants exhibit phyllotaxis defects. n = 3 biological replicates.
Strong and diffuse cytokinin responses in drmy1–2 mutants correlate with delayed sepal initiation.
Through its crosstalk with auxin, the plant hormone cytokinin controls the precise timing of flower primordium initiation within inflorescence meristems28,29. Therefore, we tested whether cytokinin signaling is involved in sepal primordium initiation and is altered in drmy1–2 mutants using the cytokinin signaling reporter pTCS::GFP (TCS)30. In wild-type flowers, TCS was expressed in the four incipient sepal positions, consistent with a role for cytokinin in primordium initiation. In the drmy1–2 mutant, the expression of TCS expanded and in some flowers formed a ring shape in the periphery of the floral meristem where the sepals should initiate (Fig. 4b and Extended Data Fig. 6b, quantified in Fig. 4d). drmy1–2 mutant plants also exhibited additional phenotypes associated with increased cytokinin signaling: disordered sequence and positions of flowers around the stem (phyllotaxy)28, and enlarged inflorescence meristems31,32 (Extended Data Fig. 6h–j).
Auxin and cytokinin signaling patterns are required for robust timing of sepal initiation.
Based on the hormone signaling reporters and hormone related phenotypes, cytokinin response increased and auxin response decreased in drmy1–2 mutants. More importantly, the tight spatial localization of response reporters became more diffuse in drmy1–2. We therefore used three different ways to disrupt the auxin or cytokinin signaling and tested whether these disruptions could cause defects in the timing of sepal primordium initiation: increasing cytokinin, decreasing auxin signaling, and disrupting the crosstalk.
First, we tested whether broadly increasing cytokinin signaling was sufficient to delay sepal primordium initiation by externally applying cytokinin to whole floral meristems in wild type. We cultured dissected wild-type inflorescences in 5 μM cytokinin (BAP) media or mock media for 6 days. Cytokinin-treated flowers exhibited delayed and more variable sepal primordium initiation, which mimicked the phenotypes of drmy1–2 mutants (Fig. 4e and Extended Data Fig. 7a, quantified in Extended Data Fig. 7c). Similar to drmy1–2, the outer sepal is less affected (Fig. 4e and Extended Data Fig. 7a, d). Further following the development of these flowers revealed that continued cytokinin treatments severely stunted growth and sepal size continued to be unequal (Extended Data Fig. 7g). We verified that cytokinin treatment not only increased TCS signals but also made TCS expression more diffuse (Extended Data Fig. 8a). As controls, the cytokinin receptor mutant wol-1 was relatively insensitive to the treatment (Extended Data Fig. 8b) and the TCS reporter remained unaffected when the inflorescence was treated with auxin (0.1, 1, and 20 μM NAA), confirming its specificity to cytokinin (Extended Data Fig. 8c). Culturing drmy1–2 mutant inflorescences in 5 μM cytokinin also enhanced the sepal initiation defects even for the outer sepal (Fig. 4f and Extended Data Fig. 7b–d). This shows that the delay in organ initiation is not maximal in drmy1, and it further suggests that organ initiation delays are associated with disrupted cytokinin patterns.
Having shown that enhanced cytokinin signaling could delay sepal initiation, we then checked whether reducing auxin signaling throughout the flower was sufficient to delay sepal primordium initiation. Auxin signaling is inhibited in the auxin receptor quadruple mutant tir1–1afb1–1afb2–1afb3–133 and we observed similar, but more severe defects in the timing of sepal primordium initiation defects compared with drmy1–2 (Fig. 4g). Thus, auxin signaling is also required for proper timing of sepal initiation.
Finally, we tested whether crosstalk between auxin and cytokinin is necessary for robust sepal initiation. We found that 5 μM cytokinin made the DR5 auxin response reporter’s signals more diffuse, similar to our observations in drmy1–2 mutants (Extended Data Fig. 7e); this suggested that broader and increased cytokinin signaling might contribute to the diffuse DR5 auxin responses observed in drmy1–2 mutants. However, we noted that DR5 expression levels did not decrease upon cytokinin treatment, in contrast with the drmy1–2 mutant, implying that DRMY1 has a role in promoting auxin signaling. Furthermore, when treated with 5 μM cytokinin, the polarity pattern of PIN1-GFP appeared similar to that in drmy1–2 mutants (Extended Data Fig. 7f).
In the inflorescence meristem, high auxin at floral primordia positions activates MONOPTEROS (MP), which induces the expression of Arabidopsis HISTIDINE PHOSPHOTRANSFER PROTEIN 6 (AHP6). AHP6 acts as a cytokinin signaling inhibitor to define a brief period during which auxin and cytokinin signaling overlap to trigger primordium initiation28,29. In the ahp6 mutant, initiation of sepal primordia was mildly affected compared to drmy1–2 (Fig. 4g). Thus, DRMY1 plays a more prominent role to ensure the robustness of sepal primordium initiation than AHP6. In drmy1–2ahp6 double mutants, the delayed initiation phenotype was enhanced (Fig. 4g), suggesting that DRMY1 and AHP6 regulate robustness in primordium initiation synergistically. Taken together, our results suggest that DRMY1-dependent patterns of auxin and cytokinin signaling are crucial for the robust temporal pattern of sepal initiation.
To further test whether timing of initiation is crucial for robust organ size, we measured sepal size at maturity for ahp6, drmy1–2ahp6, and tir1–1afb1–1afb2–1afb3–1. All showed more variable sepal size consistent with the more variable sepal initiation (Extended Data Fig. 7h, i).
Focused auxin and cytokinin signaling regions define zones of competence for sepal initiation.
How do the spatial patterns of auxin and cytokinin signaling determine the temporal pattern of sepal initiation? To answer this question, we used live imaging to track expression of the DR5 auxin response reporter and the TCS cytokinin response reporter throughout the initiation of sepal primordia in developing flowers (Fig. 5a, Supplementary Videos 3, 4 and 6). In wild-type incipient sepal primordia before initiation, the DR5 auxin response signal accumulated first in the outermost (L1) cell layer. Simultaneously, the TCS cytokinin response reporter was expressed directly below the DR5 signal. Both signals were restricted to incipient sepal positions. Over time, the DR5 signal invaded the inner cell layers (L2 and L3) leading to the coexistence of DR5 and TCS signals. After this overlap, we observed the outward bulges of primordium initiation. Then TCS and DR5 signals separated again. TCS signal remained at the base of the growing sepal, complementary to the DR5 signal which accumulated at the tip. In drmy1–2 mutants, the invasion of DR5 signal into the inner cell layers was decreased and delayed at the inner sepal (Fig. 5b, c, Supplementary Video 5). Simultaneously, TCS expression was expanded around the periphery of the floral meristem and not limited to the incipient sepal positions in drmy1–2 (Fig. 5d, e, Supplementary Video 7). Slowly the TCS signal resolved to a sharp domain of expression at the incipient sepal position in drmy1–2 mutants (Fig. 5e, Supplementary Video 7). Once both the sharp TCS domain and the DR5 invasion were achieved, the drmy1–2 inner sepal bulged out, indicating initiation. Although delayed, the focused domains of reporter expression were still eventually established in drmy1–2 mutants. Our results suggest that establishing precisely localized and limited domains of both auxin and cytokinin signaling is required for sepal initiation, and that sepal initiation is variably delayed in drmy1–2 until such precise domains can be established.
Fig. 5. Spatiotemporal patterns of auxin and cytokinin signaling regulate the timing of sepal initiation.

a, Dual marker live imaging tracking DR5 (auxin, cyan nuclei) and TCS (cytokinin, yellow) signaling reporter expression throughout sepal initiation in WT. Longitudinal sections through the developing flower are shown with the outer sepal on the right and the inner sepal on the left. Chlorophyll (grey) outlines the morphology of the flowers. Yellow arrowheads: overlapping DR5 and TCS signals; Blue arrowheads: separation between DR5 and TCS; White arrow: sepal initiation event; Scale bar: 10 μm. n = 3 live imaging series.
b,c, Live imaging of DR5 auxin signaling reporter (white) expression throughout sepal initiation in both WT (b) and the drmy1–2 mutant (c). Longitudinal sections through developing flowers are shown with the outer sepal on the right and the inner sepal on the left. p35S::mCherry-RCI2A: red, plasma membrane; blue and red arrows indicate the sepal initiation. Note that the invasion of DR5 into inner layers is delayed for the inner drmy1–2 sepal and is followed immediately by outgrowth. Scale bar: 20 μm. n = 3 live imaging series.
d,e, Live imaging tracking TCS cytokinin signaling reporter expression (white) throughout sepal initiation in both WT (d) and the drmy1–2 mutant (e). Top view of the developing flower shown with the outer sepal on the top and the inner sepal on the bottom. Blue and red arrows indicate sepal initiation. Chlorophyll autofluorescence: red; Scale bar: 20 μm. n = 3 live imaging series.
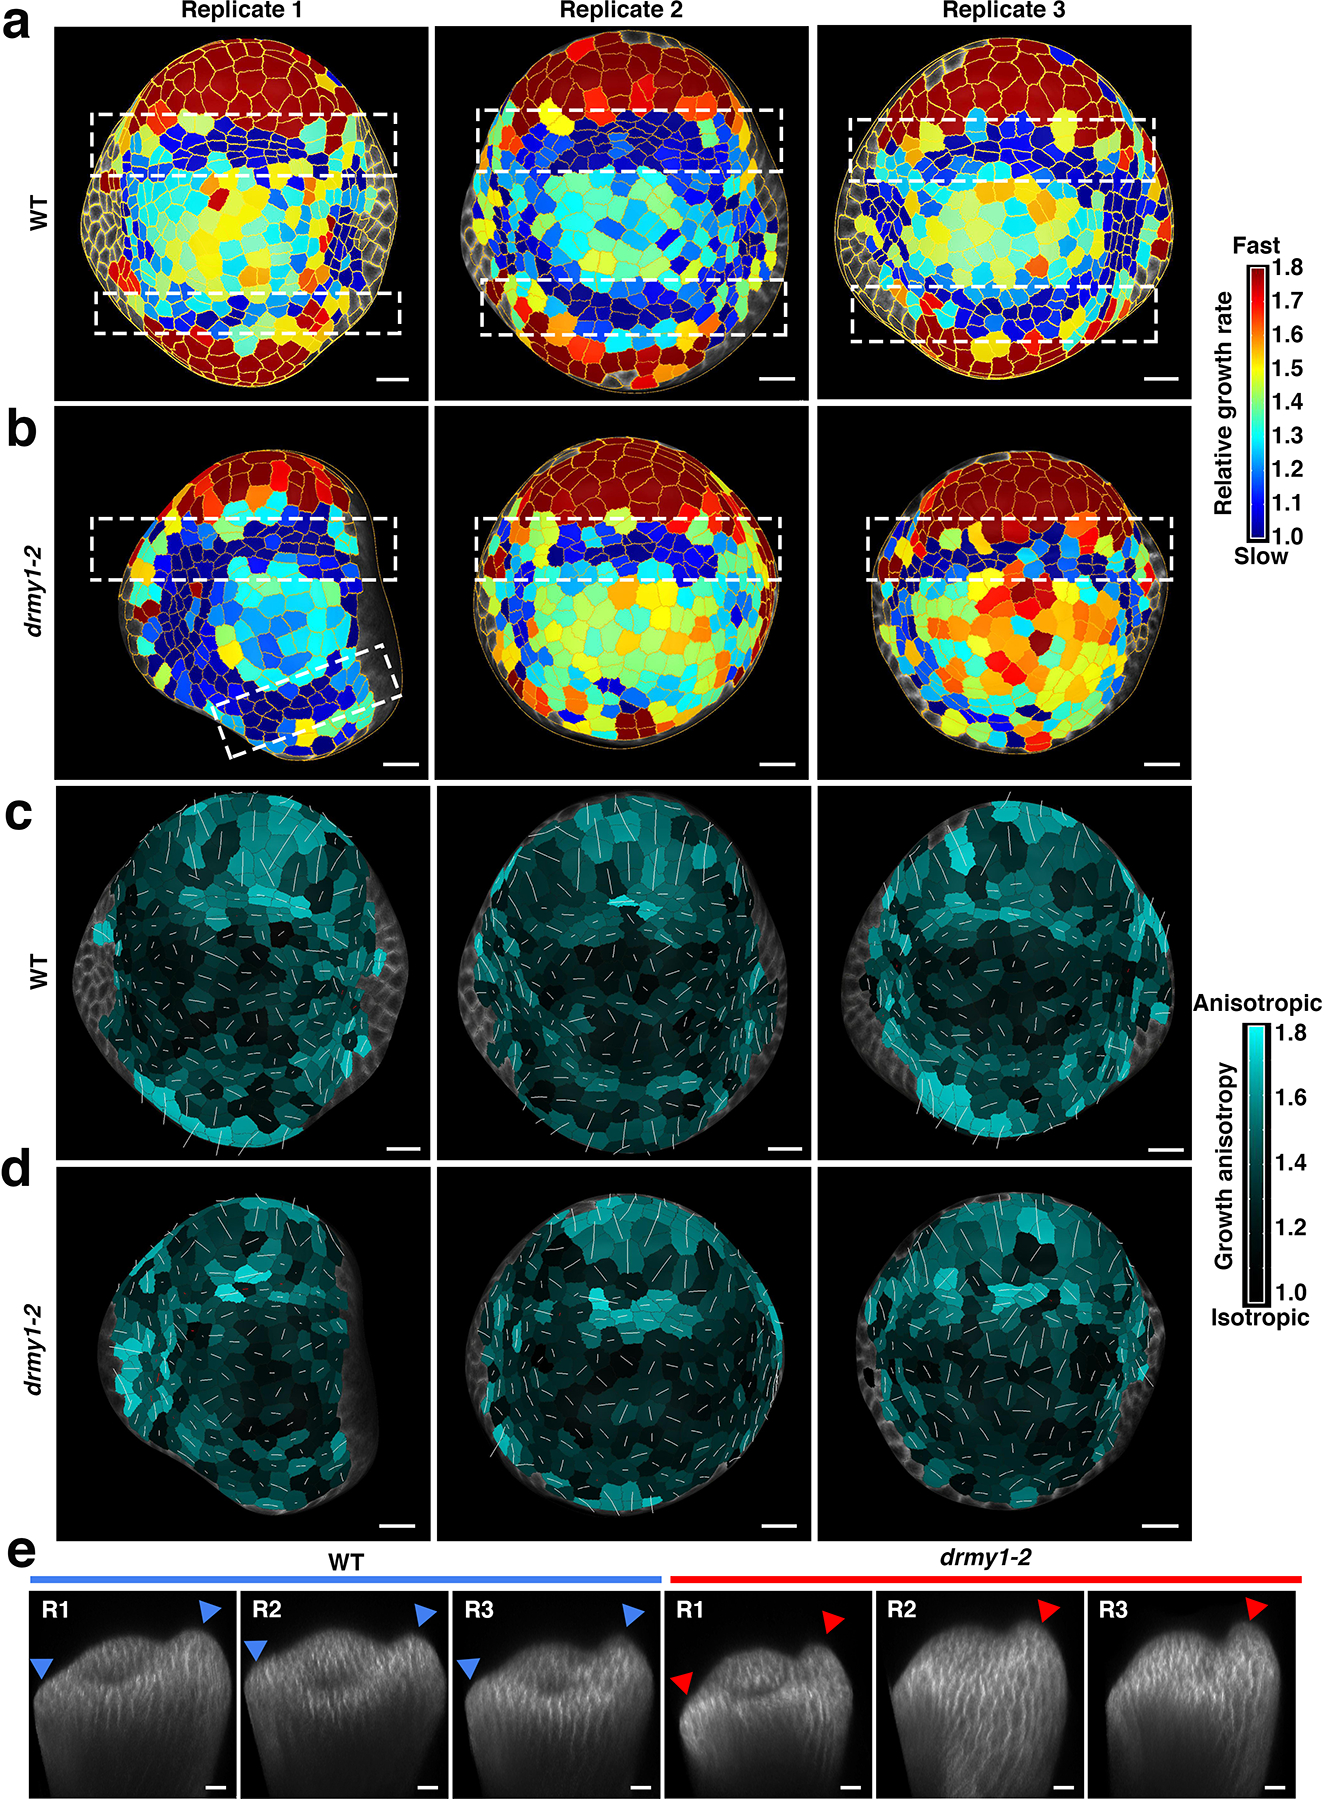
f,g, Cellular growth heatmap throughout sepal initiation in WT (f) and drmy1–2 (g). Top view of the flowers with the outer sepal at the top and the inner sepal at the bottom. For the heatmap, red indicates high relative growth rate while blue indicates low relative growth rate. Relative growth rate is defined as final cell size divided by initial cell size. White arrowheads: the band of cells with slower growth which specify the boundary between initiating sepals and the floral meristem center. Blue and red arrows indicate the sepal initiation. Segmented cells are outlined in yellow. Scale bar: 10 μm. n = 3 live imaging series.
For all live imaging series, the time point when outer sepal primordium emerged was defined as time point 0. Images were staged relative to the timing of outer sepal initiation (0 hr).
h, DRMY1 ensures focused hormone signaling and reduced cell wall stiffness during sepal initiation, thus making the temporal pattern of sepal initiation robust. The robust timing of sepal initiation is crucial for sepal size robustness both throughout growth and at maturity.
Tightly localized cell growth is associated with primordium initiation.
Auxin and cytokinin regulate cellular growth19,34,35. Since the spatiotemporal accumulation of hormone reporters was disrupted in drmy1–2, we also tested whether cell growth was affected during primordium emergence. The bulging of primordia requires both tightly localized regions of fast longitudinal growth at the periphery and slow latitudinal growth at the boundary between the primordium and the meristem center36,37. We analyzed the cellular growth rates and growth anisotropy of emerging primordia from live imaging, which were developmentally staged by the outer sepal morphology (Extended Data Fig. 9e). In both wild type and drmy1–2 mutants, before sepal initiation, cells grow heterogeneously without clear spatial pattern. Primordium initiation occurred with the appearance of a coordinated zone of fast-growing cells at the periphery and a tight band of slow growing cells at the boundary. For wild type, this switch to orchestrated spatial growth regions occurred at the inner sepal about 6 hours after the outer sepal (Fig. 5f, and Extended Data Fig. 9a), corresponding to the previous quantification of time intervals between sepal initiation (Fig. 2e, f). For drmy1–2, although fast and slow growth regions began normally for the outer sepal, cellular growth within the inner sepal region remained heterogeneous 6 hours after the outer sepal initiated (Fig. 5g, and Extended Data Fig. 9b). As an independent test, we analyzed growth anisotropy. A switch from isotropic growth to highly anisotropic growth led to primordium initiation in both WT and mutant (Extended Data Fig. 9c). In drmy1–2, the cellular growth at the regions where the inner sepal should initiate remained isotropic and randomly oriented during the time interval we analyzed (Extended Data Fig. 9d). Thus, in drmy1–2, the inability to create tightly localized auxin and cytokinin signaling patterns coincides with stiffer cell walls and the inability to create tightly localized growth patterns, delaying initiation.
Discussion
In this study, we report that DRMY1 ensures sepal size uniformity by coordinating the timing of sepal initiation (Fig. 5h). Because the drmy1–2 mutant delays but does not block sepal initiation, it provides insights into the mechanisms controlling the timing of organ initiation. It is well established that the pattern of auxin accumulation sets the position of organ initiation20–23. We observe that the sepal primordium does not emerge as soon as auxin signaling markers become apparent (Fig. 5a). Instead, stable focused regions of auxin and cytokinin signaling appear to define competency zones which give rise to tightly localized growth patterns required for organ initiation (Fig. 5h). In the case of auxin, a key event in the establishment of this focused region appears to be the invasion of auxin signaling into underlying cell layers, which later begin vascular development38. Consistent with our results, this auxin invasion has been shown to stabilize the positions at which floral primordia form in inflorescence meristems38. Auxin promotes growth through loosening the cell wall, and cell wall stiffness is hypothesized to feed back to regulate the polarity of the auxin efflux transporter PIN139,40. It remains for the future to determine how DRMY1 impinges on this feedback loop between cell wall stiffness, growth, and hormones.
Timing is important for developmental robustness in animals41. For example, the robustness of somite size is generated by the precise timing of the somite segmentation clock42. An implication of this work in Arabidopsis is that developmental timing of initiation can have cascading effects on organ size. In drmy1–2 mutants, the late-initiating sepals remain smaller throughout development, so that sepal size remains variable. One might hypothesize that higher variance originates from altered average size. However, we have previously shown and also see here (Fig. 3f, and Extended Data Fig. 1e) that decreasing sepal sizes does not automatically lead to increased sepal size variability in mutants14. Thus, the loss of regularity is not simply a side effect of decreased average sepal size. In sepals, uniformity of size is required throughout their growth to enclose the flower bud completely, creating a barrier with the external environment11. Thus, traditional compensation mechanisms that delay maturation and termination of growth until the organs reach the right size, such as DILP8 in Drosophila9,10, serve no purpose in sepals. We conclude that mechanisms ensuring precise timing of initiation make major contributions to robustness of organ size, when this is required throughout development. To explain why defects in timing of initiation cause defects in final organ size, we hypothesize that maturation and cessation of growth of the sepals occurs synchronously. If maturation occurs synchronously in wild type, we would expect that flowers with slightly larger outer sepals also have slightly larger inner sepals, because all of the sepals would have grown more before maturation. We indeed observed this correlation (Extended Data Fig. 4f). We have previously shown in vos1 mutants that disruption of synchrony in the timing of maturation causes increased sepal size variability14. Here we show in drmy1–2 mutants that disruption of synchrony in timing of imitation also causes increased sepal size variability. Thus, our results are consistent with the hypothesis that organs can achieve robustness in size throughout their development by synchronization of initiation and maturation.
Methods
Mutations and genotyping
In this study, we primarily used Arabidopsis thaliana accession Col-0 as the wild-type plants. As described in Hong et al., 201614, variable organ size and shape (vos) mutants were isolated from an M2 population of ethyl methanesulfonate (EMS) mutagenized Col-0. The vos2 (drmy1–2) mutant was back crossed to Col-0 three times to segregate unrelated mutations before further characterization. The vos2 (drmy1–2) mutant was then crossed with an Arabidopsis Landsberg erecta accession plant to generate a mapping population. The vos2 (drmy1–2) mutated gene was identified through map-based cloning following the standard procedure described in Lukowitz et al.43. The vos2 (drmy1–2) mutation was mapped to an interval containing 97 genes on chromosome 1 between 21.3M and 21.7M. The vos2 (drmy1–2) mutant has a G to A mutation at the junction between the third intron and the fourth exon within the DEVELOPMENT RELATED MYB-LIKE 1 (DRMY1, AT1G58220) gene, which was predicted to cause splicing defects that were later verified experimentally. The drmy1–2 G to A point mutation was genotyped through PCR amplification with the dCAPs44 primers oMZ113 and oMZ114 (sequences in Supplementary Table 1), followed by the digestion of PCR products with DdeI to produce 74-bp WT products and 100-bp mutant products. We crossed vos2 (drmy1–2) with drmy1–1 (allele with a T-DNA insertion in the first intron; SALK01274615) to test for allelism. The resulting F1 exhibited the drmy1 mutant phenotypes indicating these mutations failed to complement and are allelic. To verify the splicing defects, the mRNA was extracted from the drmy1–2 mutant inflorescences, followed by RT-PCR to generate cDNAs. Mutated DRMY1 CDS was amplified with primers listed in Supplementary Table 1 and then inserted into pENTR/D-TOPO vectors (Invitrogen). The resultant plasmids were then purified and sequenced with commercial primer M13F.
Flower staging
All the flower staging was based on Smyth et al.45.
Sepal area and shape analysis
Full-size, mature, stage 15 sepals were dissected from the flowers for analysis. For sepal area and shape variability comparison between wild type and drmy1–2 mutants, we selected the 10th to 25th flowers from the main branch (primary inflorescence) because they are relatively consistent in wild type as confirmed by Hong et al.14. To quantify the mean and variance of the areas of the four sepals within a single flower, we dissected sepals throughout development from the earliest flower we could start (ranging from the first one to the sixth one) to the latest flower we could get (ranging from the 42th one to the 67th one) on the main branch. The sepal contour extraction analysis was done as described in Hong et al.14. Briefly, the dissected sepals were flattened between slides and photographed with Canon Powershot A640 camera on a Zeiss Stemi 2000-C stereomicroscope. Custom python scripts were then used to extract the contour from each sepal photo and quantify the area and shape variability (scripts available in the supplementary material Data S1 of Hong et al.14). The coefficient of variation (CV) of sepal areas was calculated by dividing the standard deviation by the mean of the four sepal areas within a flower. For sepal area correlation, the outer sepal area was plotted as a function of the inner sepal area for individual flowers. In addition to plotting the values, we used a Gaussian kernel to estimate their probability density function (using scipy.stats library). We represented the probability density function with labelled contour lines shaping the density. We used a bandwith factor of 0.5, chosen as to ease the reading of data distribution.
Permutation test to confirm the difference between two populations
We used the permutation test to determine whether size distributions of sepals were significantly different between WT and drmy1–2. The permutation test does not require the knowledge of the underlying distribution functions. The permutation test was done as described in Hong et al.14.
Live imaging of sepal initiation and growth
½ MS media containing 1% sucrose, 0.25x vitamin mix, 1μL/mL plant preservative mixture and 1% agarose (recipe modified from Hamant et al.46) was poured into small Petri dishes (Fisher 60mm • 15mm) for positioning inflorescences and supporting growth. In this paper, we used two different methods to dissect and position the Arabidopsis inflorescences for live imaging. The first method, viewing the inflorescence from the side, was modified from Roeder et al.47. First, we removed the MS media from half of the Petri dish to create space for the inflorescence. Inflorescences of plants expressing the plasma membrane marker pLH13 (35S::mCitrine-RCI2A, yellow plasma membrane marker48) were dissected with a Dumont tweezer (Electron Microscopy Sciences, style5, Cat #72701-D). Overlying older flowers from one side were removed to expose the stage 4 flowers. The inflorescences were taped to a cover slip to ensure the correct orientation. The cover slip was then positioned in the Petri dish with the base of inflorescence stem inserted into the MS media. We then taped the Petri dish to the sides of the Percival growth chambers with inflorescence vertical and the bottom of the dish facing outwards to avoid growth bending. This method was mainly used for imaging the early stage lateral and outer sepal development.
In the second method, we imaged the inflorescence from the top, similar to the method reported in Hamant et al.46. Primary inflorescences containing p35S::mCitrine-RCI2A (pLH13), or DR5:: 3XVENUS-N7 (Auxin response reporter20), or pTCS::GFP (Cytokinin response reporter49), or both DR5::3XVENUS-N7 and p35S::mCherry-RCI2A (pMZ11, LR reaction between pENTR/D-TOPO with mCherry-RCI2A (pHM52) and pB7WG2 (destination vector with p35S), red plasma membrane marker), or both DR5::3XVENUS-N7 and pTCS::GFP were dissected with tweezers and then the stem was inserted into the MS media positioning the inflorescence upright. Further dissection with the tip of the tweezer or a needle was done to remove all the flowers older than stage 4. This method was used for imaging the initiation of sepal primordia and the late stage outer sepal development.
After dissection and positioning, the Petri dishes were kept in the growth chamber at least 6 hours for plant recovery before live imaging. The chosen flowers were imaged every 6 hours (sepal initiation), 12 hours or 24 hours (organ growth) with a Zeiss 710 confocal microscope. For long-term live imaging which lasted for more than 6 days, we transferred the inflorescences from the old Petri dishes to newly made fresh ones for keeping active growth every three days. Before imaging, the inflorescences were immersed in the water for at least 10 minutes and 20x Plan-Apochromat NA 1.0 water immersion objective was used for imaging. The wave lengths for the excitation and emission for the florescent proteins are listed in Supplementary Table 2. The depth of z-sections was set to 0.5 μm (live imaging for sepal growth) or 1 μm (live imaging for sepal initiation or reporter patterning). The resultant LSM files were converted and cropped with FIJI. MorphoGraphX was used for visualization of the spatial distribution of florescent signals and creation of digital longitudinal sections.
Image processing for growth quantification
Image processing and growth quantification were performed as described in Hong et al.14. Briefly, the confocal stacks collected from live imaging sepal growth were converted from LSM format to TIFF format with FIJI. The images were then imported into MorphoGraphX50. Sample surfaces were detected and meshes of the surface were generated. Fluorescent signals were then projected onto the meshes and cells were segmented on the meshes. For cellular growth, cell lineages were defined manually and cell area between different time points were compared to quantify growth rates. Heatmaps were generated to visualize the areal growth rate and the values for the growth rate of each cell were then exported to CSV files. Graphs of growth trends were generated with the analysis of the CSV files in Microsoft Excel. The cell division heatmap was also generated based on the cell lineages, presenting how many daughter cells originated from one mother cell. The analysis of Principal Directions of Growth (PDG) was also done with MorphoGraphX, following the user manual. Briefly, the two meshes of two different time points were loaded together with the parent labels. Check correspondence was done to make sure there were no errors in cell junctions. The growth directions were then computed and “Aniso (StrainMax versus StrainMin)” and “StrainMax” were visualized on the second time point mesh.
Imaging of reporter lines
Primary branches of the reporter line plants (DR5::3XVENUS-N7, pTCS::GFP, PIN1-GFP, pDRMY1::3XVENUS-N7, pDRMY1::DRMY1-mCitrine, p35S::mCitrine-RCI2A) were dissected with tweezers and inserted upright into ½ MS media (containing 1% sucrose, 0.25x vitamin mix and 1% Agar) poured into small Petri dishes. The samples were immersed in the water for 30 minutes and then further dissected with the tip of tweezers to remove all unnecessary flowers. After dissection, the inflorescences were put in the growth chamber for 6 hours for recovery and then imaged with 20x Plan-Apochromat NA 1.0 water immersion objective on a Zeiss 710 confocal microscope.
The seedlings of both WT and drmy1–2 with p35S::mCitrine-RCI2A were grown in ½ MS media (containing 1% sucrose, 0.25x vitamin mix and 1% agar) for around 5 days with Petri dishes placed vertically. The seedlings were then well positioned into waterdrops loaded in advance on the slides. After putting on the cover slip, the roots were imaged with 20x Plan-Apochromat NA 1.0 water immersion objective on the Zeiss 710 confocal microscope.
The excitation and emission wavelength for the fluorescent proteins are indicated in Supplementary Table 2.
Cytokinin (BAP) and auxin (NAA) treatments
Primary inflorescences containing target reporters were dissected and inserted into ½ MS media coated small Petri dishes. The inflorescences were then put into the chamber for at least 6 hours for recovery. Cytokinin or auxin containing ½ MS media were made following the ½ MS media recipe mentioned before, with specific volumes of the 0.5 g/L synthetic cytokinin (BAP) stock solution (kept in −20 °C) or 5 mM/L synthetic auxin (NAA) stock solution (kept in 4 °C) for specific concentrations. The inflorescences were then transferred to the cytokinin or auxin containing ½ MS media for the external cytokinin or auxin treatments. 20x Plan-Apochromat NA 1.0 water immersion objective on the Zeiss 710 confocal microscope was again used for image collection. For the long-term BAP treatment, the primary inflorescences containing plasma membrane markers were dissected to expose early stage flowers for confocal imaging. The inflorescences were then transferred to fresh BAP containing media and cultured in the Chamber for another 14 days before the final round of confocal imaging. For the BAP treatment, pTCS::GFP reporter lines were used as the positive control. The cytokinin receptor mutant wol was used as the negative control because it was relatively insensitive to the BAP treatment.
Transgenic plants
The DRMY1 gene promoter with 5’ UTR (1,535 bp before the start codon) and the terminator with 3’ UTR (331 bp after the stop codon) were PCR amplified with primers listed in Supplementary Table 1. These two pieces were fused with overlap PCR with PFU DNA polymerase. The PCR product was Adenine (A)-tailed with Taq DNA polymerase. With the help of this overhanging A, the overlap PCR product was then ligated into pGEM-T easy (Promega) to generate pMZ2. The Gateway conversion cassette was PCR amplified and digested with restriction enzymes AscI and KpnI and then ligated into pMZ2 between the DRMY1 promoter and terminator to make pMZ3. The resulting pMZ3 plasmid and binary vector pMOA36 were digested with NotI and ligated together to make pMZ4. The final pMZ4 Gateway destination vector includes the DRMY1 promoter, a gateway cassette, and the DRMY1 terminator. The DRMY1 gene CDS was PCR amplified with primers listed in Supplementary Table 1. The DRMY-mCitrine fusion was created by amplifying the CDS of DRMY1 and the CDS of mCitrine with primers listed in Supplementary Table 1. The DRMY1-mCitrine fusion was created through overlap PCR with a nine-alanine linker in the middle. Each of these PCR products was purified and cloned into pENTR/D-TOPO vectors (Invitrogen). The resultant vectors were LR combined into the destination vector pMZ4 to generate the final constructs used in this paper: pDRMY1::DRMY1 (pMZ6) and pDRMY1::DRMY1-mCitrine (pMZ18)). All of the final constructs were verified by sequencing and transformed into the drmy1–2 mutants by Agrobacterium-mediated floral dipping. All the T1 plants were grown in soil for about 10 days and then selected by spraying with 100 μg/mL Basta. The surviving plants were then checked for sepal phenotypes.
Quantification of DR5 and TCS signals
In order to quantify the DR5 and TCS signals at the different positions relative to the center of the floral meristem, we manually aligned the stacks in MorphoGraphX. They were placed with the z-axis located at the meristem center pointing upwards and the x-axis representing the 0° position pointing to the right. Angles increased in the counter-clockwise direction within the xy-plane. The images were aligned in such a way as to place outer sepal position at roughly 45° (the top-right direction when viewing down the z-axis).
For the quantification of the signal, we implemented a custom process in MorphoGraphX which computed a circular histogram of the signal sum around the z-axis. For each voxel of the aligned image, its angle about the z axis was determined. The voxels were grouped according to the angular values in bins of the size of 1° and their signal values weighted by their volume were summed up for each bin. To create the plot, we exported the resulting histogram to a csv-file and imported it into Microsoft Excel.
Extended Data
Extended Data Fig. 1. drmy1–2 floral organs have enhanced sepal size and shape variability.

a, DRMY1 mutations have little effect on the floral organ number. Numbers of sepals, petals, stamens and carpels were quantified for both WT and the drmy1–2 mutant. Two-tailed Student’s t test * p-value < 0.05 (p-value for the mean of organ number, WT versus drmy1–2 petal: 1.14E-03; WT versus drmy1–2 stamen number: 2.14E-08). Measure of centre: mean. Error bars: standard error of the mean. n = 30 flowers.
b, Quantification of the mean sepal area of the four sepals from an individual flower. Sequential flowers along the main branch of the stem (flower number on the x-axis) were measured at stage 14. Three replicates were included for both WT (blue) and drmy1–2 (red). Original individual sample curves can be found in Source Data. The mean of the 3 replicates are presented as thick blue and red lines with the SD as partially translucent background.
c, Quantification of the sepal shape variability for outer, inner and lateral sepals. Two-tailed Student’s t test * p-value < 0.05 (p-value for the mean of shape variability, WT versus drmy1–2 inner sepal: 2.70E-02; WT versus drmy1–2 lateral sepal: 1.00E-07) Measure of centre: mean. Error bars: standard error of the mean. n = 60 for both WT and drmy1–2 10th to 25th flowers along the main branch.
d, What at first appeared to be two sepals initiated at the inner sepal position of the drmy1–2 flower (left panel) fused to form a single sepal with a split tip at later time points of the live imaging (right panel). Red arrowheads: initiating sepals. Red arrow: the fused sepal. Scale bar: 20 μm.
e, Coefficient of variation (CV) calculated for the areas of the outer, inner and lateral sepals. Sepals from different flowers were pooled together. n = 48 flowers.
f, Average CV calculated for the areas of all petals in each single flower for WT and drmy1–2. Two-tailed Student’s t test * p-value < 0.05 (p-value for the mean of CV for petal area within individual flowers, WT versus drmy1–2: 1.27E-03). Measure of centre: mean. Error bars: standard error of the mean. n = 20 flowers for both WT and drmy1–2.
Extended Data Fig. 2. DRMY1 is required for sepal size robustness.

a, Sequencing of DRMY1 transcripts from the drmy1–2 mutant verified that splicing defects occur. DRMY1 transcripts were reverse transcribed and amplified from RNA extracted from the drmy1–2 mutant and inserted into pENTR/D-TOPO for sequencing. Black shading: nucleotides remaining in the transcript after the splicing; Gray shading: nucleotides spliced out. Orange capital letter: exon. Purple lower-case letter: intron in the WT DRMY1 transcript. Red arrowhead indicates one base pair shift.
b, qRT-PCR measuring the expression of DRMY1 in WT and the drmy1–2 mutant using two pairs of primers: one before the mutation site and the other across the mutation site. The expression level in WT quantified with the primers before the mutation site was set to 1 using the Delta-delta-CT method. Two-tailed Student’s t test * p-value < 0.05 (p-value for the mean of expression fold change, WT versus drmy1–2 before mutation: 3.31E-03; WT versus drmy1–2 across mutation: 2.01E-04). Measure of centre: mean. Error bars: standard error of the mean. n = 3 biological replicates.
c,d,e,f,g,h, Inflorescences of WT (c), drmy1–1 (d), drmy1–2 (e), F1 of the cross between drmy1–1 and drmy1–2 for allelism test (f), T3 plants of drmy1–2 transformed with pDRMY1::DRMY1 (g), and T3 plants of drmy1–2 transformed with pDRMY1::DRMY1-mCitrine (h). Orange arrows: smaller sepals in individual flowers. Note, open flower buds indicate unequal sepal sizes. Scale bars: 0.5 mm. n = 3 inflorescences.
i,j, Transcriptional (i, pDRMY1::3XVENUS-N7, nuclear localized gray signal) and translational (j, pDRMY1::DRMY1-mCitrine, gray) DRMY1 reporter expression patterns are similar. Cell walls were stained with PI in i and plasma membranes were fluorescently labeled with pUBQ10::mCherry-RCI2A in j. Both DRMY1 reporters are expressed in the inflorescence meristem, floral meristems, and initiating floral organs, with stronger expression in the periphery. Scale bars: 20 μm. n = 3 inflorescences.
Extended Data Fig. 3. Cell wall stiffness increases in the drmy1–2 mutant.

a, Graph of flower radius used to assess developmental stage based on flower size. The radii of flowers without sepal primordia (SP = 0), with only the outer sepal primordium (SP = 1), or with outer and inner sepal primordium (SP > 1) were measured for wild-type and drmy1–2 inflorescences. The critical size threshold for outer sepal initiation is specified with a yellow dashed line. Note this size is the same for wild type and drmy1–2, indicating the stage of outer sepal initiation is not affected in drmy1–2. In contrast, the critical size threshold for inner sepal initiation (orange dashed lines), is larger for drmy1–2 than wild type, consistent with delayed inner sepal initiation. In the violin plots, the black line represents the median and the individual data points are shown. n = 46 flowers for WT SP = 0; n = 21 for WT SP = 1; n = 45 for WT SP > 1; n = 53 for drmy1–2 SP = 0; n = 63 for drmy1–2 SP = 1; n = 33 for drmy1–2 SP > 1.
b, The average apparent elastic modulus calculated from AFM measurements of the flowers is significantly higher for the drmy1–2 mutant. Two-tailed Student’s t test * p-value < 0.05 (p-value for the mean of apparent elastic modulus, WT versus drmy1–2: 6.81E-04). Measure of centre: mean. Error bars: standard errors of the mean. n = 11 samples measured for both WT and drmy1–2.
c, Cell shrinkage heatmap after osmotic treatment in WT and drmy1–2. Group of cells were segmented together for area comparison. Red in the heatmap represents less shrinkage, thus stiffer cell wall. Scale bar: 50 μm. n = 3 flowers.
d, Average shrinkage ratio after osmotic treatment further confirms that cells undergo less shrinkage in the drmy1–2 mutant, indicating the cell walls are stiffer. Two-tailed Student’s t test * p-value < 0.05 (p-value for the mean of shrinkage ratio, WT versus drmy1–2: 5.56E-08). Measure of centre: mean. Error bars: standard errors of the mean. n = 161 cell groups for WT and n= 129 cell groups for drmy1–2.
e, Bar graph of GO terms that are overrepresented (against a genome wide average) among genes more strongly expressed in drmy1–2 inflorescences than in WT inflorescences. Genes used for this GO term analysis are listed in the “Upreg. in drmy1–2, padj < 0.1” table of Supplementary Data 1.
f, Bar graph of GO terms that are overrepresented (against a genome wide average) among genes more strongly expressed in WT inflorescences than in drmy1–2 inflorescences. Genes used for this GO term analysis are listed in the “Downreg. in drmy1–2, padj < 0.1” table of Supplementary Data 1.
For both (e) and (f), a subset of significant GO terms was selected for each graph (Fisher test with Yekutieli multi-test adjustment, significance level 0.05 using the AgriGo 2.0 website). The percentage of differentially expressed genes in drmy1–2 versus WT associated the GO term is shown with black bars. Genome (gray) reports the frequency of genes associated with that term in the Arabidopsis genome, which would be the frequency expected by chance for a randomly selected subset of genes. The percentage of genes was calculated as the number of genes associated with that term divided by the total number of genes. n = 3 biological replicates.
Extended Data Fig. 4. Sepal cell growth is slower in the drmy1–2 mutant.
a,b, 24-hour late stage (from stage 6 to stage 9) cellular growth heatmap for both WT (a) and drmy1–2 (b) outer sepals. Relative growth rate is defined as final cell size divided by initial cell size. Segmented cells outlined in yellow. Note the outer sepal base is at the bottom of the image and its tip points up. Scale bars: 20 μm.
c, Growth curves of the late stage average cellular growth for both WT and drmy1–2. *: Flower stage 9 extends over multiple 24-hour intervals. Measure of centre: mean. Error bars represent standard error of the mean. n = 3 flowers.
d, 36-hour cell division heatmap for both WT and drmy1–2. The total number of cells derived from one progenitor is represented in the heatmap with 1 meaning no divisions. Throughout sepal development, the drmy1–2 sepal cells undergo fewer divisions than WT. Scale bars: 20 μm.
e, Confocal images of sepals from individual flowers (shown in Fig. 3a,b) after 11 days of live imaging. Area variability was quantified by the coefficient of variation (CV). Two lateral primordia fused to form the left drmy1–2 lateral sepal. Scale bar: 100 μm. Sepals from 1 flower are shown here, representing 3 live imaging series.
f, The outer sepal area plotted as a function of the inner sepal area in individual flowers. Each color represents a pool of three plants and each point is for one flower (using the same dataset as Fig. 1d and Extended Data Fig. 1b). In addition to plotting the values, we use a Gaussian kernel to estimate their probability density function. We represent the probability density function with labelled contour lines shaping the density. We use a bandwith factor of 0.5, chosen to make the data distribution easier to read. n = 167 WT flowers and n = 148 drmy1–2 flowers.
g, The mean drmy1–2 sepal area divided by WT mean sepal area ratio for each sepal type. Sepals from different flowers were pooled together. n = 48 flowers.
Extended Data Fig. 5. Spatiotemporal averaging is not affected in the drmy1–2 mutant at early stage.

a, The maximal principal direction of growth (PDGmax, white line) of WT sepal cells calculated for 24-hour and 48-hour intervals. For 24-hour intervals, the PDGmax shows both spatial and temporal variations in WT. Cell outlines are shown in cyan. Over the whole 48-hour interval these variations average out such that the PDGmax are oriented vertically along the major growth axis of the sepal. One cell showing good temporal averaging is highlighted with blue boxes and magnified in insets. n = 3 live imaging series. Scale bar: 20 μm.
b, The maximal principal direction of growth (PDGmax, white line) of the drmy1–2 sepal cells calculated for 24-hour and 48-hour intervals. The PDGmax also shows similar spatial and temporal variations in the drmy1–2 situation. One cell showing good temporal averaging is again highlighted with red boxes at different time points, indicating that temporal averaging of growth direction is not affected by DMRY1 mutations. n = 3 live imaging series. Scale bar: 20 μm.
c, Graph plotting the average spatial variability of the growth rates (Varea) for sepal epidermal cells during sepal development. Blue curves are for WT sepals and red curves are for drmy1–2 sepals. Measure of centre: mean. Error bars represent standard error. n = 3 flowers.
d, Graph plotting the average temporal variability of the growth rates (Darea) for sepal epidermal cells during the development of sepals. Blue curves are for WT sepals and red curves are for drmy1–2 sepals. Measure of centre: mean. Error bars represent standard error. n = 3 flowers.
Extended Data Fig. 6. Auxin signaling is suppressed and more diffuse while cytokinin signaling expands and is enhanced in drmy1–2 mutants.

a, Confocal imaging of the DR5 auxin response reporter (white) in the whole inflorescence of WT and the drmy1–2 mutant. p35S::mCherry-RCI2A: red, for plasma membrane. Scale bar: 20 μm. n = 10 inflorescences.
b, Confocal imaging of the TCS cytokinin signaling reporter (gray) in whole inflorescences of WT and the drmy1–2 mutant. Chlorophyll autofluorescence: red. Scale bar: 20 μm. n = 10 inflorescences.
c, Confocal imaging of PIN1 immunolocalization experiments to show PIN1 accumulation in inflorescences and flowers of WT and drmy1–2. PIN1 exhibits polar localization in drmy1–2 similar to wild type; however, it forms more convergence points in flowers. Blue/Red arrowheads: PIN1 convergence points. Inset: Same images with increased brightness to show the morphology of the flowers. Scale bars: 20 μm. n = 3 inflorescences.
d, Confocal imaging of pPIN1::PIN1-GFP to show PIN1 accumulation in the inflorescences and flowers of WT and drmy1–2. Again, PIN1 forms abnormal convergence points in drmy1–2. Blue/Red arrowheads: PIN1 convergence points. Scale bars: 50 μm for IM and 20 μm for flowers. n = 3 inflorescences.
e, Images of whole plants for WT and drmy1–2, showing the bushiness and short stature of drmy1–2. Scale bar: 2 cm. n = 3 plants.
f, Confocal images of root meristems for WT and drmy1–2. The regions specified by yellow arrowheads indicate the meristematic zone. Scale bar: 50 μm. n = 3 root tips.
g, Photograph of 10-day old seedlings for WT and drmy1–2, showing drmy1–2 has shorter roots and fewer lateral roots. Scale bar: 1 cm. n = 3 plates.
h, Confocal images of inflorescence meristems for WT and drmy1–2 (Top view). Yellow dashed circles indicate how meristem sizes were measured in i. Scale bar: 50 μm. n = 10 inflorescence meristems.
i, Quantification of inflorescence meristem sizes for WT and drmy1–2. Two-tailed Student’s t test * p-value < 0.05 (p-value for the mean of inflorescence meristem sizes, WT versus drmy1–2: 2.01E-07). Measure of centre: mean. Error bars represent standard error of the mean. n = 10 inflorescence meristems.
j, Histograms of divergence angles between siliques for WT and drmy1–2, showing the enhanced variability in phyllotaxy observed in drmy1–2 mutants. 137° is expected for spiral phyllotaxy observed in wild type.
Extended Data Fig. 7. Cytokinin treatment mimics the drmy1–2 mutant.

a,b, Confocal imaging of the whole inflorescences of WT (a) and drmy1–2 (b) cultured in mock conditions or 5 μM BAP (synthetic cytokinin) for 6 days. p35S::mCitrine-RCI2A: gray, for plasma membrane. Phenotypes quantified in Extended Data Fig. 7c. Blue or red arrowheads: flowers with obvious delayed sepal initiation phenotypes. Scale bars: 50 μm.
c, Graph characterizing the proportions of flower phenotypes observed after 5 μM BAP treatment for 6 days. Normal phenotype (N, black) is defined as similar to wild type. Mildly affected phenotype (M, grey) is similar to drmy1–2. Severely affected phenotype (S, silver) is more severe than drmy1–2. n = 23 (N: 23/23, M: 0/23, S: 0/23) flowers from 7 inflorescences for mock treated wild type; n = 42 (N: 4/42, M: 35/42, S: 3/42) flowers from 12 inflorescences for mock treated drmy1–2; n = 47 (N: 2/47, M: 14/47, S: 31/47) flowers from 16 inflorescences for BAP treated wild type; and n = 37 (N: 0/37, M: 3/37, S: 34/37) flowers from 18 inflorescences for BAP treated drmy1–2. A one-sided Kolmogorov-Smirnov test was used to compare the distributions of different situations. p-value for WT mock versus drmy1–2 mock: 7.73 E-14; p-value for WT mock versus WT BAP: 1.67 E-16; p-value for WT BAP versus drmy1–2 mock: 4.53 E-9; p-value for WT BAP versus drmy1–2 BAP: 7.55 E-3; p-value for drmy1–2 mock versus drmy1–2 BAP: 1.95E-15.
d, Graph of flower radius to assess developmental stage based on flower size. The radii of flowers without sepal primordia (SP = 0) or with only the outer sepal primordium (SP = 1) were measured for wild-type and drmy1–2 inflorescences cultured in either mock or 5 μM BAP for 6 days. The critical size threshold for outer sepal initiation is specified with a yellow dashed line. Note this size is the same for wild type mock and wild type BAP samples, indicating the stage of outer sepal initiation is not affected by BAP treatment. In contrast, for BAP treated drmy1–2, this characteristic size is more variable, consistent with the strongly enhanced phenotype. In the violin plots, the black line represents the median and the individual data points are shown. WT Mock SP = 0: n = 5; WT Mock SP = 1: n = 12; drmy1–2 Mock SP = 0: n = 11; drmy1–2 Mock SP = 1: n = 14; WT BAP SP = 0: n = 19; WT BAP SP = 1: n = 19; drmy1–2 BAP SP = 0: n = 19; drmy1–2 BAP SP = 1: n = 19.
e, 5 μM BAP treatment on the DR5 auxin signaling reporter (white) for 3 days. p35S::mCherry-RCI2A: red, for plasma membrane; Red arrowhead: indicates the same flower before and after the BAP treatment. Scale bar: 50 μm. Note the DR5 signal becomes more diffuse after cytokinin treatment. n = 3 inflorescences.
f, 5 μM BAP treatment on PIN1-GFP (cyan) auxin efflux carrier for 2 days. Red arrowhead: indicates the same flower before and after the BAP treatment; Scale bar: 50 μm. PIN1-GFP appears to form additional convergence points similar to drmy1–2. n = 3 inflorescences.
g, Long-term treatment of flowers with 5 μM BAP causes severe sepal size defects. Wild-type inflorescences were cultured for 6 days on mock or BAP media, dissected to reveal flowers with initiating sepals, and further cultured for 14 days to examine the effects on sepal size. n = 3 flowers.
h, The sepal area distribution for mature WT, drmy1–2, ahp6, drmy1–2ahp6, and tir1–1afb1–1afb2–1afb3–1 (tir1afb1-2-3 for short) sepals. The boxes extend from the lower to upper quartile values of the data and the whiskers extend past 1.5 of the interquartile range. Outliers are indicated with small dots. Sepals from different flowers were pooled together. n = 35 flowers. Wild-type and drmy1–2 data was subsampled from that shown in Extended Data Figure 1b. Two-tailed Student’s t test * p-value < 0.05 (p-value for the mean of sepal area, WT versus drmy1–2: 2.70E-33; WT versus ahp6: 1.42E-38; WT versus drmy1–2ahp6: 9.91E-25; WT versus tir1abf1–1afb2–1afb3–1: 1.22E-39).
i, Average coefficient of variation (CV) calculated for the areas of all sepals in each single flower for WT, drmy1–2, ahp6, drmy1–2ahp6, and tir1–1afb1–1afb2–1afb3–1. n = 35 flowers. Two-tailed Student’s t test * p-value < 0.05 (p-value for the mean of CV, WT versus drmy1–2: 4.99E-14; WT versus ahp6: 1.75E-13; WT versus drmy1–2ahp6: 8.06E-16; WT versus tir1abf1–1afb2–1afb3–1: 3.31E-32). Measure of centre: mean. Error bars represent standard error of the mean.
Extended Data Fig. 8. BAP treatment functions through cytokinin signaling.

a, 5 μM BAP treatment on the TCS cytokinin signaling reporter (gray) for 24 hours. Control showing that cytokinin treatment enhances TCS reporter expression. Chlorophyll autofluorescence: red. Scale bars: 50 μm. n = 3 inflorescences for each treatment.
b, 5 μM BAP treatment on the cytokinin receptor mutant wol-1 for 4 days. Control showing that mutation of the cytokinin receptor (wol-1) abrogates delayed sepal initiation in response to cytokinin. Lower left flower removed during imaging. Cell walls stained with PI: gray. Scale bar: 50 μm. n = 3 inflorescences.
c, NAA (auxin) treatment in a gradient of concentration on the TCS cytokinin signaling reporter (gray) for 24 hours. Auxin treatment did not enhance TCS reporter expression. Control showing that the induction of TCS reporter expression is specific to cytokinin treatment. Chlorophyll autofluorescence: red. Scale bars: 20 μm. n = 3 inflorescences for each treatment.
Extended Data Fig. 9. Cellular growth remains heterogeneous and randomly oriented for the drmy1–2 inner sepals.
a,b, Cumulative 18-hour cellular growth heatmap for both WT (a) and drmy1–2 (b) floral meristems. White dashed boxes highlight the bands of cells with slower growth rate which specify the boundary. They are always adjacent to the fast growth regions at the periphery, where sepals initiate. Segmented cells outlined in yellow. Three replicates are shown. Note that the drmy1–2 replicate 1 grows relatively normally. Scale bars: 10 μm.
c,d, 18-hour cellular growth anisotropy heatmap for the same WT (c) and drmy1–2 (d) floral meristems. Growth anisotropy was calculated by dividing the cell stretch at the maximum direction by the cell stretch at the minimum direction. Cyan indicates higher growth anisotropy while black indicates lower growth anisotropy. White lines within the cells shows the maximum principle directions of growth. The initiating regions have higher anisotropy with the periphery part showing longitudinal growth and the boundary parts showing latitudinal growth. Three replicates are shown. Scale bars: 10 μm.
e, Side views of the floral meristems at the last time points with outer sepals on the right and inner sepals on the left. The morphology of outer sepals was used for staging and appears equivalent in all samples. Arrowheads: the initiation/bulging of sepals from floral meristems. Scale bars: 10 μm. n = 3 flowers shown. R = replicate.
Supplementary Material
Acknowledgments:
We thank Fabrice Besnard, Anthony Bretscher, Joseph Cammarata, Kate Harline, Jessica McGory and Batthula Vijaya Lakshmi Vadde for comments on the manuscript. We thank Xiaoying Zhu for drawing the anatomical diagrams by hand. We thank Elliot Meyerowitz and Arnavaz Garda for sharing seeds for DR5::3XVENUS-N7/PIN1::GFP (Ler). We thank Teva Vernoux and Géraldine Brunoud for sharing seeds for pTCS::GFP (Col), pPIN1::PIN1-GFP (Col), and TCS DR5 (Col). We thank Fal Kateryna and Feng Zhao for teaching the protocol for PIN1 immunolocalization. We thank Fabrice Besnard for assisting with the phyllotaxy measurement.
Funding:
Research reported in this publication was supported by the National Institute of General Medical Sciences of the National Institutes of Health (NIH) under award number R01GM134037 (A.H.K.R), Human Frontier Science Program grant RGP0008/2013 (A.B./O.H., A.H.K.R., C.B.L., R.S.S.), Weill Institute startup funding (E.M.S., A.H.K.R.), and Cornell Graduate School travel grant program (M.Z.). We thank Cornell University Biotechnology Resource Center (BRC) for sequencing service (supported by NIH 1S10OD010693-01). This work made use of the Cornell Center for Materials Research shared SEM facilities which are supported through the NSF MRSEC program (DMR-1719875). The content is solely the responsibility of the authors and does not necessarily represent the official views of the National Institutes of Health or other funding agencies.
Footnotes
Supplementary Methods
Please see Supplementary Methods for further information on Plant Growth Conditions; Photographing of flowers, inflorescences, and whole plants; Meristem size analysis; Phyllotaxy analysis; Scanning electron Microscopy (SEM) observation; Analysis of spatiotemporal variability in the growth of cell area; Gaussian curvature measurement; PIN1 immunolocalization; Atomic force microscopy (AFM) and data analysis; Osmotic treatments measuring sepal stiffness; and Generating and analyzing RNA-seq data.
Accession Numbers
RNAseq data: NCBI BioProject IPRJNA564625. Individual RNA-seq read sets are archived in SRA as follows: WT replicate 1, SRX6821462, WT replicate 2, SRX6821463, WT replicate 3, SRX6821464, drmy1–2 replicate 1, SRX6821465, drmy1–2 replicate 2, and SRX6821466, drmy1–2 replicate 3, SRX6821467.
Gene names: DRMY1, AT1G58220; AHP6, AT1G80100; TIR1, AT3G62980; AFB1, AT4G03190; AFB2, AT3G26810; AFB3, AT1G12820; WOL, AT2G01830; and PIN1, AT1G73590.
Competing interests:
Authors declare no competing interests.
Data and materials availability:
RNA-seq data are available at NCBI BioProject PRJNA564625.
All other data are available in the main text, the extended data figures, or the supplementary materials.
Materials are available by request.
Supplementary Materials:
References
- 1.Williams RW. Mapping genes that modulate mouse brain development: a quantitative genetic approach in Mouse brain development. (Springer; Berlin Heidelberg, Berlin, Heidelberg, 2000), vol. 30, pp. 21–49. [DOI] [PubMed] [Google Scholar]
- 2.Mizukami Y A matter of size: Developmental control of organ size in plants. Curr. Opin. Plant Biol 4, 533–539 (2001). [DOI] [PubMed] [Google Scholar]
- 3.Gomez M, Gomez V & Hergovich A The Hippo pathway in disease and therapy: cancer and beyond. Clin. Transl. Med 3, 22 (2014). [DOI] [PMC free article] [PubMed] [Google Scholar]
- 4.Zygulska AL, Krzemieniecki K & Pierzchalski P Hippo pathway - brief overview of its relevance in cancer. J. Physiol. Pharmacol 68, 311–335 (2017). [PubMed] [Google Scholar]
- 5.Nicodème Fassinou Hotegni V, Lommen WJM, Agbossou EK & Struik PC Heterogeneity in pineapple fruit quality results from plant heterogeneity at flower induction. Front. Plant Sci 5, 670 (2014). [DOI] [PMC free article] [PubMed] [Google Scholar]
- 6.Félix MA & Wagner A Robustness and evolution: Concepts, insights and challenges from a developmental model system. Heredity (Edinb). 100, 132–140 (2008). [DOI] [PubMed] [Google Scholar]
- 7.Waddington CH Canalization of development and the inheritance of acquired characters. Nature 150, 563–565 (1942). [DOI] [PubMed] [Google Scholar]
- 8.Vogel G How do organs know when they have reached the right size? Science 340, 1156–1157 (2013). [DOI] [PubMed] [Google Scholar]
- 9.Garelli A, Gontijo AM, Miguela V, Caparros E & Dominguez M Imaginal discs secrete insulin-like peptide 8 to mediate plasticity of growth and maturation. Science 336, 579–582 (2012). [DOI] [PubMed] [Google Scholar]
- 10.Colombani J, Andersen DS & Léopol P Secreted peptide dilp8 coordinates Drosophila tissue growth with developmental timing. Science 336, 582–585 (2012). [DOI] [PubMed] [Google Scholar]
- 11.Roeder AH, Sepals. in: Encyclopedia of Life Sciences (ELS), John Wiley & Sons, Ltd, Chichester: (2010). [Google Scholar]
- 12.Wolpert L Arms and the man: The problem of symmetric growth. PLoS Biol. 8, e1000477 (2010). [DOI] [PMC free article] [PubMed] [Google Scholar]
- 13.Katsanos D et al. Stochastic loss and gain of symmetric divisions in the C. elegans epidermis perturbs robustness of stem cell number. PLoS Biol. 15, e2002429 (2017). [DOI] [PMC free article] [PubMed] [Google Scholar]
- 14.Hong L et al. Variable Cell Growth Yields Reproducible Organ Development through Spatiotemporal Averaging. Dev. Cell 38, 15–32 (2016). [DOI] [PubMed] [Google Scholar]
- 15.Wu P et al. DRMY1, a Myb-Like Protein, Regulates Cell Expansion and Seed Production in Arabidopsis thaliana. Plant Cell Physiol. 60, 285–302 (2019). [DOI] [PubMed] [Google Scholar]
- 16.Dubos C et al. MYB transcription factors in Arabidopsis. Trends Plant Sci. 15, 573–581 (2010). [DOI] [PubMed] [Google Scholar]
- 17.Peaucelle A et al. Arabidopsis Phyllotaxis Is Controlled by the Methyl-Esterification Status of Cell-Wall Pectins. Curr. Biol 18, 1943–1948 (2008). [DOI] [PubMed] [Google Scholar]
- 18.Peaucelle A et al. Pectin-induced changes in cell wall mechanics underlie organ initiation in Arabidopsis. Curr. Biol 21, 1720–1726 (2011). [DOI] [PubMed] [Google Scholar]
- 19.Arsuffi G & Braybrook SA Acid growth: An ongoing trip. J. Exp. Bot 69, 137–146 (2018). [DOI] [PubMed] [Google Scholar]
- 20.Heisler MG et al. Patterns of auxin transport and gene expression during primordium development revealed by live imaging of the Arabidopsis inflorescence meristem. Curr. Biol 15, 1899–1911 (2005). [DOI] [PubMed] [Google Scholar]
- 21.Jönsson H, Heisler MG, Shapiro BE, Meyerowitz EM & Mjolsness E An auxin-driven polarized transport model for phyllotaxis. Proc. Natl. Acad. Sci. U. S. A 103, 1633–1638 (2006). [DOI] [PMC free article] [PubMed] [Google Scholar]
- 22.Smith RS et al. A plausible model of phyllotaxis. Proc. Natl. Acad. Sci. U. S. A 103, 1301–1306 (2006). [DOI] [PMC free article] [PubMed] [Google Scholar]
- 23.Reinhardt D et al. Regulation of phyllotaxis by polar auxin transport. Nature 426, 255–260 (2003). [DOI] [PubMed] [Google Scholar]
- 24.Chandler JW, Jacobs B, Cole M, Comelli P & Werr W DORNRÖSCHEN-LIKE expression marks Arabidopsis floral organ founder cells and precedes auxin response maxima. Plant Mol. Biol 76, 171–185 (2011). [DOI] [PubMed] [Google Scholar]
- 25.Cheng Y, Dai X & Zhao Y Auxin biosynthesis by the YUCCA flavin monooxygenases controls the formation of floral organs and vascular tissues in Arabidopsis. Genes Dev. 20, 1790–1799 (2006). [DOI] [PMC free article] [PubMed] [Google Scholar]
- 26.Billou I et al. The PIN auxin efflux facilitator network controls growth and patterning in Arabidopsis roots. Nature 433, 39–44 (2005). [DOI] [PubMed] [Google Scholar]
- 27.Goh T, Kasahara H, Mimura T, Kamiya Y & Fukaki H Multiple AUX/IAA-ARF modules regulate lateral root formation: The role of Arabidopsis SHY2/IAA3-mediated auxin signalling. Philos. Trans. R. Soc. B Biol. Sci 367, 1461–1468 (2012). [DOI] [PMC free article] [PubMed] [Google Scholar]
- 28.Besnard F et al. Cytokinin signalling inhibitory fields provide robustness to phyllotaxis. Nature 505, 417–421 (2014). [DOI] [PubMed] [Google Scholar]
- 29.Besnard F, Rozier F & Vernoux T The AHP6 cytokinin signaling inhibitor mediates an auxin-cytokinin crosstalk that regulates the timing of organ initiation at the shoot apical meristem. Plant Signal. Behav 9, e28788 (2014). [DOI] [PMC free article] [PubMed] [Google Scholar]
- 30.Müller B & Sheen J Cytokinin and auxin interaction in root stem-cell specification during early embryogenesis. Nature 453, 1094–1097 (2008). [DOI] [PMC free article] [PubMed] [Google Scholar]
- 31.Gordon SP, Chickarmane VS, Ohno C & Meyerowitz EM Multiple feedback loops through cytokinin signaling control stem cell number within the Arabidopsis shoot meristem. Proc. Natl. Acad. Sci. U. S. A 106, 16529–16534 (2009). [DOI] [PMC free article] [PubMed] [Google Scholar]
- 32.Bartrina I, Otto E, Strnad M, Werner T & Schmülling T Cytokinin regulates the activity of reproductive meristems, flower organ size, ovule formation, and thus seed yield in Arabidopsis thaliana. Plant Cell 23, 69–80 (2011). [DOI] [PMC free article] [PubMed] [Google Scholar]
- 33.Dharmasiri N, Dharmasiri S & Estelle M The F-box protein TIR1 is an auxin receptor. Nature 435, 441–445 (2005). [DOI] [PubMed] [Google Scholar]
- 34.Weijers D, Nemhauser J & Yang Z Auxin: Small molecule, big impact. J. Exp. Bot 69, 133–136 (2018). [DOI] [PMC free article] [PubMed] [Google Scholar]
- 35.Wybouw B & De Rybel B Cytokinin – A Developing Story. Trends Plant Sci. 24, 177–185 (2019). [DOI] [PubMed] [Google Scholar]
- 36.Kwiatkowska D Flower primordium formation at the Arabidopsis shoot apex: Quantitative analysis of surface geometry and growth. J. Exp. Bot 57, 571–580 (2006). [DOI] [PubMed] [Google Scholar]
- 37.Kwiatkowska D Flowering and apical meristem growth dynamics. J. Exp. Bot 59, 187–201 (2008). [DOI] [PubMed] [Google Scholar]
- 38.Bhatia N et al. Auxin Acts through MONOPTEROS to Regulate Plant Cell Polarity and Pattern Phyllotaxis. Curr. Biol 26, 3202–3208 (2016). [DOI] [PMC free article] [PubMed] [Google Scholar]
- 39.Braybrook SA & Peaucelle A Mechano-Chemical Aspects of Organ Formation in Arabidopsis thaliana: The Relationship between Auxin and Pectin. PLoS One 8, e57813 (2013). [DOI] [PMC free article] [PubMed] [Google Scholar]
- 40.Spartz AK et al. SAUR inhibition of PP2C-D phosphatases activates plasma membrane H+-ATPases to promote cell expansion in Arabidopsis. Plant Cell 26, 2129–2142 (2014). [DOI] [PMC free article] [PubMed] [Google Scholar]
- 41.Ebisuya M & Briscoe J What does time mean in development? Dev. 145, dev164368 (2018). [DOI] [PMC free article] [PubMed] [Google Scholar]
- 42.Mara A & Holley SA Oscillators and the emergence of tissue organization during zebrafish somitogenesis. Trends Cell Biol. 17, 593–599 (2007). [DOI] [PubMed] [Google Scholar]
- 43.Lukowitz W, Gillmor CS & Scheible WR Positional cloning in Arabidopsis. Why it feels good to have a genome initiative working for you. Plant Physiol. 123, 795–805 (2000). [DOI] [PMC free article] [PubMed] [Google Scholar]
- 44.Neff MM, Turk E & Kalishman M Web-based primer design for single nucleotide polymorphism analysis. Trends Genet. 18, 613–615 (2002). [DOI] [PubMed] [Google Scholar]
- 45.Smyth DR, Bowman JL & Meyerowitz EM Early flower development in Arabidopsis. Plant Cell 2, 755–767 (1990). [DOI] [PMC free article] [PubMed] [Google Scholar]
- 46.Hamant O, Das P, Burian A, Time-lapse imaging of developing shoot meristems using a confocal laser scanning microscope in Methods in Molecular Biology, (Humana Press, Totowa, NJ, 2019), vol. 1992, pp. 257–268. [DOI] [PubMed] [Google Scholar]
- 47.Roeder AHK et al. Variability in the control of cell division underlies sepal epidermal patterning in Arabidopsis thaliana. PLoS Biol. 8, e1000367 (2010). [DOI] [PMC free article] [PubMed] [Google Scholar]
- 48.Robinson DO et al. Ploidy and Size at Multiple Scales in the Arabidopsis Sepal. Plant Cell 30, 2308–2329 (2018). [DOI] [PMC free article] [PubMed] [Google Scholar]
- 49.Loncarek J, Hergert P, Magidson V, & Khodjakov A Control of Daughter Centriole assembly by the Pericantriolar Material. Nat Cell Biol 10, 322–8 (2008). [DOI] [PMC free article] [PubMed] [Google Scholar]
- 50.Barbier de Reuille P et al. MorphoGraphX: A platform for quantifying morphogenesis in 4D. Elife 4, 1–20 (2015). [DOI] [PMC free article] [PubMed] [Google Scholar]
Associated Data
This section collects any data citations, data availability statements, or supplementary materials included in this article.