Abstract
Background:
Single Venc 4D flow MRI with Cartesian readout is hampered by poor velocity resolution and noise when imaging during diastole. Dual Venc acquisitions typically require the acquisition of two distinct datasets, which leads to longer scan times.
Purpose/Hypothesis:
To design and develop a 4D Spiral Dual Venc sequence. The sequence allows for separate systolic and diastolic Vencs as part of a single acquisition with a prescribed switch time. The implemented sequence was hypothesized to be comparable to Cartesian 4D flow, but with increased velocity resolution in the diastolic phase and with better scan efficiency and reduced noise.
Study Type:
Prospective.
Population:
The studied populations were two phantoms—a straight pipe with a stenotic narrowing and a phantom of the aortic arch which included a calcific polymeric valve—under both steady and pulsatile flows, six healthy volunteers, and eight patients with severe aortic stenosis (AS).
Field Strength/Sequence:
1.5T, Dual Venc 4D flow with spiral readouts.
Assessment:
Data from the proposed sequence were compared with data from 4D Cartesian Dual Venc and Single Venc acquisitions. Noise was assessed from the acquired velocity data with the pump turned off and by varying Venc. Steady acquisitions were compared to the proximal slice of the lowest Single Venc acquisition.
Statistical Tests:
Steady flows were compared using relative-root-mean-squared-error (RRMSE). For in vivo flows and pulsatile in vitro flows, net flow for corresponding timepoints were compared with the Pearson correlation test (P < 0.01). Results: For steady flows, RRMSEs for Single Vencs ranged from 17.6% to 19.4%, and 9.6% to 16.5% for Dual Vencs. The net flow correlation coefficient for the aortic arch phantom was 0.975, and 0.995 for the stenotic phantom. Normal volunteer and patient comparisons yielded a correlation of 0.970 and 0.952, respectively. in vitro and in vivo pulsatile flow waveforms closely matched.
Data Conclusion:
The Dual Venc offers improved noise properties and velocity resolution, while the spiral trajectory offers a scan efficient acquisition with short echo time yielding reduced flow artifacts.
Aortic stenosis is a progressive valvular disease that if left untreated has a 2-year survival rate of 50% for symptomatic patients.1 The disease reduces the motion of the valve leaflet, reducing the effective valve area, increasing left ventricular pressure, and the peak systolic velocities for flow exiting the valve.1–5
Accurate diagnosis and treatment is dependent on measurement of several flow characteristics, including effective orifice area (EOA), transvalvular pressure gradient (TVPG), ejection time, peak outflow tract velocity, and peak aortic jet velocity.2,6 These parameters are typically determined via Doppler echocardiography with spectral and color flow mapping. However, there are some advantages in using 4D phase-contrast (4D flow) magnetic resonance imaging (MRI) in order to acquire these flow characteristics.7 These include operator independence, the ability to image both anatomy and flow, and acquisition of velocities in three orthogonal directions instead of a single direction, which is typical for Doppler.
4D flow is based on phase contrast MRI (PC-MRI)8 that captures three components of flow velocities over time as part of a single acquisition. Capturing all three components of velocities in a 3D volume as part of the same scan has several advantages, including improved data fidelity, and the ability to visualize complex flow. 4D flow scans also remove the need for exact placement of the scan plane, which is required for 2D flow acquisitions.
A variety of methods have been proposed to reduce scan times for 4D flow imaging. These techniques include compressed sensing, k-t SENSE, k-t BLAST, and k-t GRAPPA, which utilize undersampling of k-space and/or utilize parallel imaging methods through the use of multiple coil elements.9,10 Alternative approaches involve non-Cartesian k-space readouts, eg, radial or spiral trajectories.7,11–13 Playing two gradients concurrently with interleaves as opposed to phase encode and readout gradients played in succession results in improved scan efficiency.
Velocity scans in MRI are acquired through phase offsets, and phase as a quantity wraps. When performing PC-MRI one needs to know the maximum velocity in the flow. A phase shift in the range of – π to π radians encodes velocities in the range of −Venc to Venc. Velocities outside of this range lead to wrapped or aliased velocities, causing artifacts in the acquired flow images. To avoid velocity aliasing, a straightforward approach is to set the Venc at a value larger than any velocity in the imaging volume. The drawback is noise variance that is directly proportional to Venc; the higher the Venc, the greater the contamination of the velocity data with noise.14 This becomes particularly pertinent in biphasic cardiovascular flows.
Since systolic flow is high-speed, and diastolic is low-speed, applying the same Venc to the entire cardiac cycle also results in poor velocity resolution during diastole. This renders the velocity image quality poor in the diastolic phase of the cardiac cycle. Proposed solutions in the literature involve Dual Venc and more generally Multi-Venc acquisitions.15–19 The common implementation uses two Vencs that separately acquire high and low Venc images. The proposed methods can be done in one acquisition, or in two separate acquisitions, which subsequently are combined. The drawback of two separate acquisitions is the doubling of the acquisition time. Acquiring the high and low Venc images as part of the same acquisition is the approach adopted here. This study designed, tested, and validated a novel 4D flow Spiral Dual Venc sequence in phantoms, normal volunteers, as well as in patients with aortic stenosis.
Materials and Methods
All implementations of the Dual Venc acquisition required specification of a switch time (TDV) when the systolic high Venc was switched to a diastolic low Venc. This was prescribed in milliseconds after R wave, but can also be specified as percent of cardiac cycle. For all studies performed, the TDV was arrived at a priori via a 2D PC-MRI scan of the aortic outflow jet. TDV was specified as the time immediately following the systolic ejection phase.
Pulse Sequence
The proposed pulse sequence is illustrated in Fig. 1. The advantage of the approach is a scan efficient acquisition with a short echo time (TE) as well as distinct Vencs for the systolic (high) and diastolic (low) flows. For comparison purposes, we also implemented a Dual Venc Cartesian 4D flow sequence.16 Both sequences use four-point balanced Hadamard based encoding, which allows for acquisitions with improved velocity-to-noise ratio in each direction. The main extension to our standard Spiral 4D flow sequence7 is a time variant velocity encoding gradient. This extension can be done for as many heart phases as desired by the user. However, for this study only two Vencs were used, which vary according to the set switch time, TDV. This means that for each cardiac cycle, the Venc has a high value before time TDV (eg, end-systolic time) and a much smaller value after time TDV. This was done by optimizing the phase encoding gradients around the lowest Venc, which has a demand for larger gradients in a fixed time period. This results in acquisitions that have the same TE, repetition time (TR), and acquisition time. The resulting Dual Venc sequence’s TE is the same TE seen from a comparable Single Venc sequence with the lower of the two Vencs.
FIGURE 1:
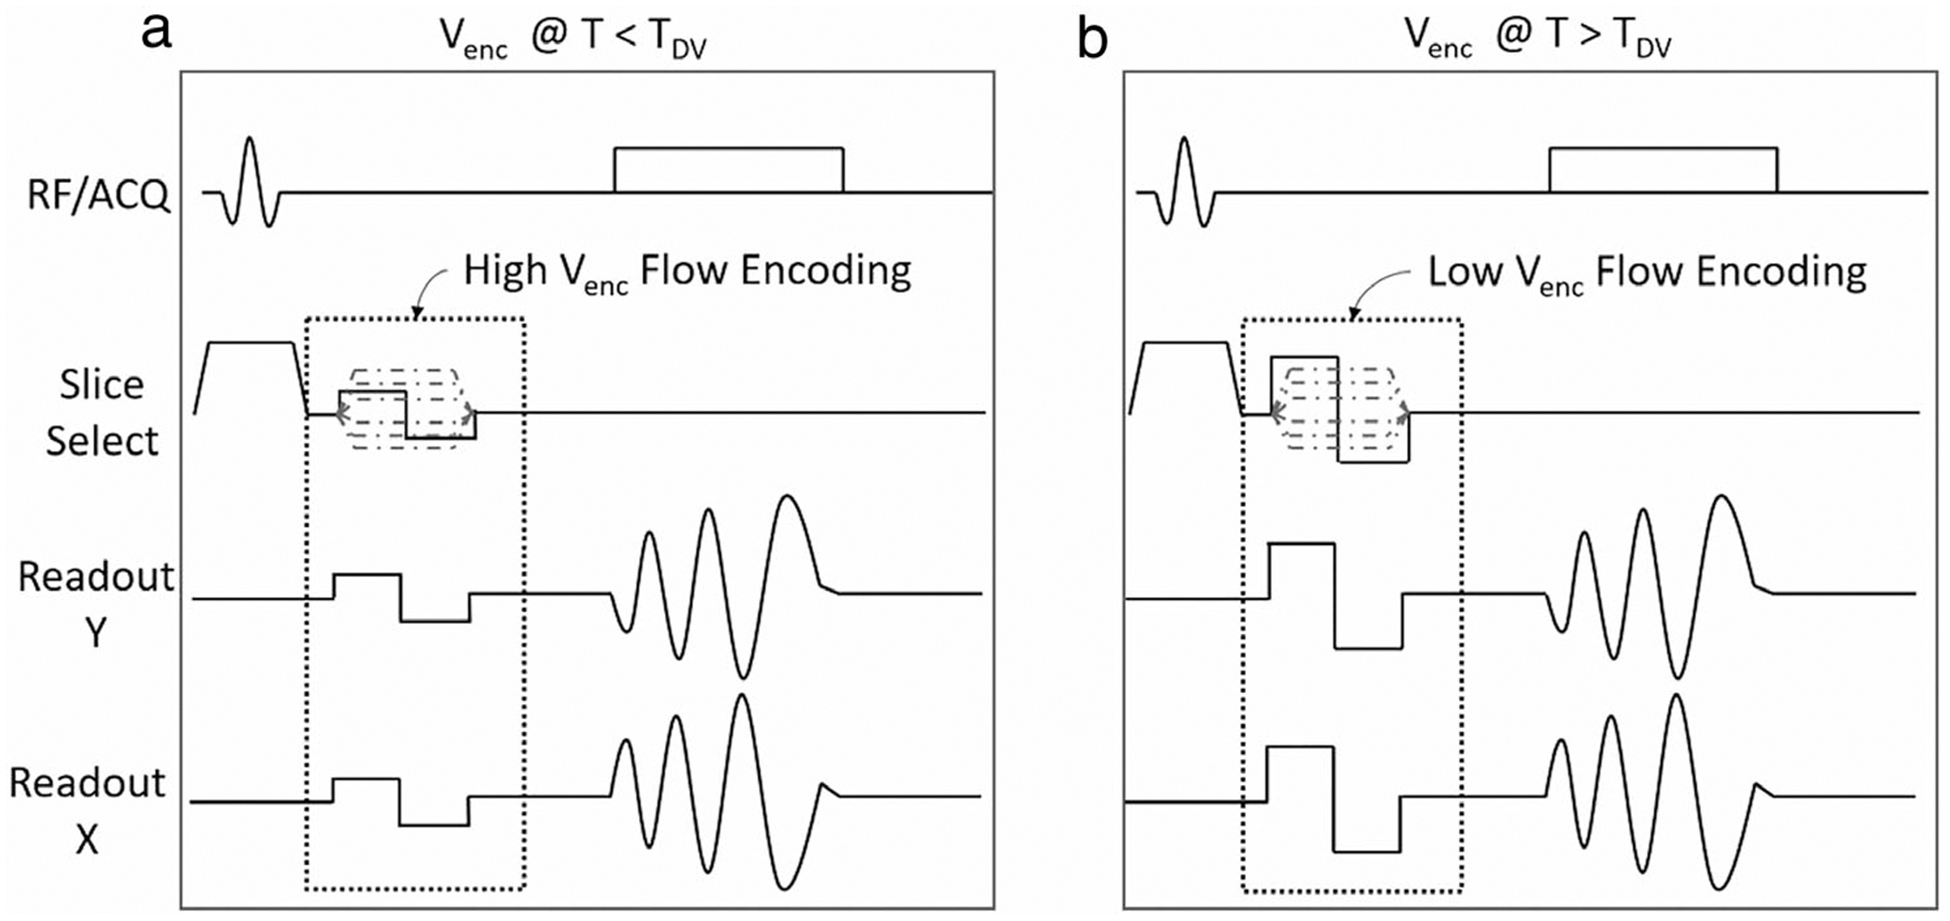
The Dual Venc pulse sequence. The bipolar gradients change the maximum based on the set Venc. The Venc of the sequence on the left is higher than the one on the right. The switch to the low Venc happens at TDV, which is a user defined time in the R-R interval.
Flow Phantoms
Testing was initially performed on an MR-compatible flow circuit; the schematic of which can be seen in Fig. 2. Two types of phantoms were used: a stenotic phantom with 1” diameter in the straight pipe section and 87% area narrowing at the stenotic throat and a phantom of the aortic arch,20 which included housing for a replaceable synthetic polymeric valve with different degrees of calcifications mimicking human disease.21
FIGURE 2:
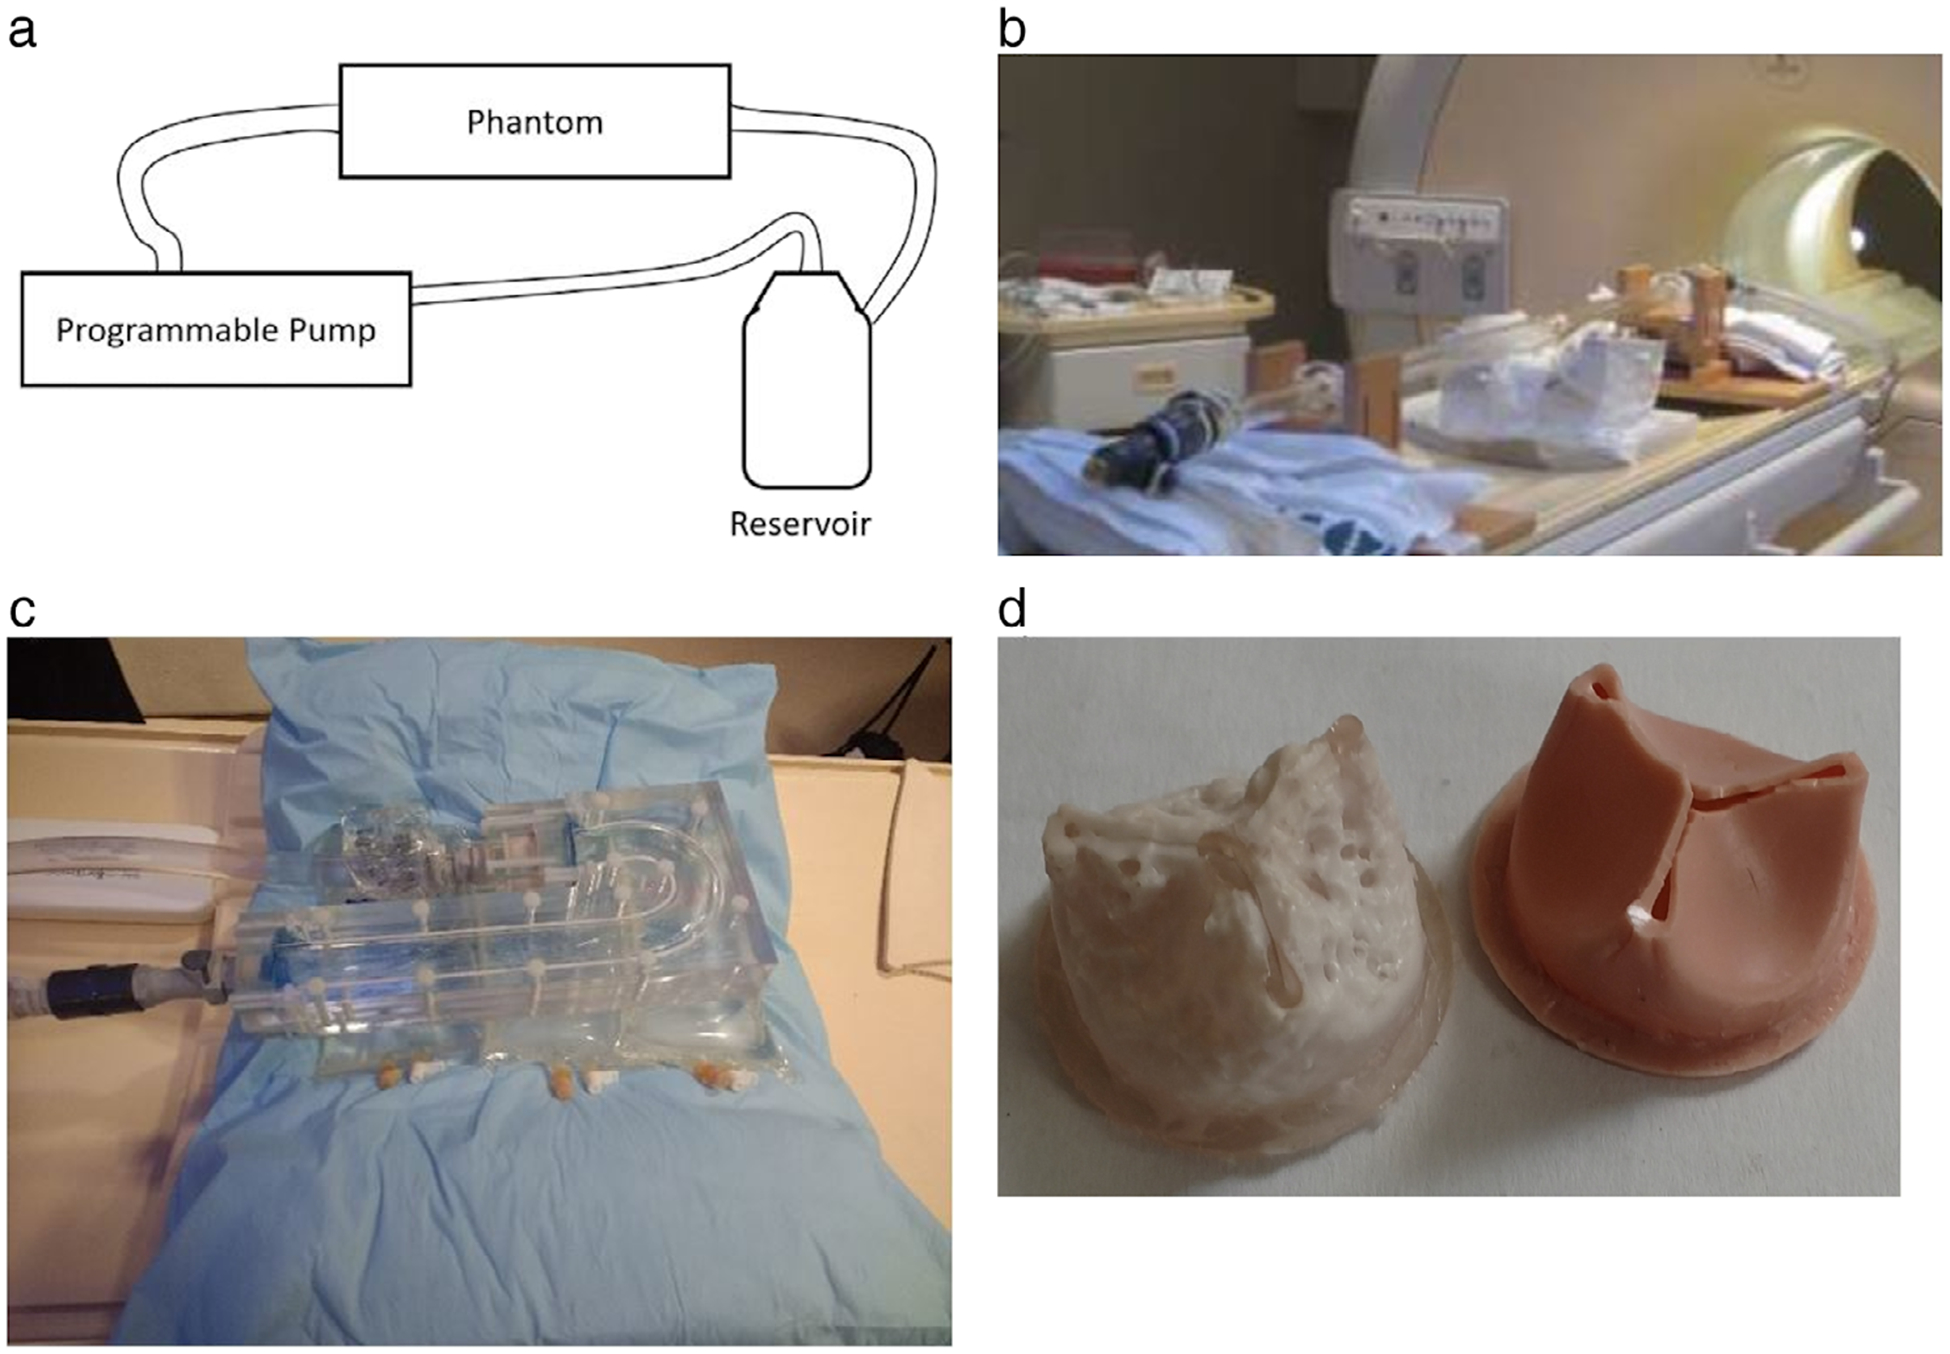
(a) The flow circuit. The open-air reservoir holds the blood mimicking fluid, which circulates through the system. The pump pulls the fluid from the reservoir, through a flexible plastic tubing. The pump then pushes the fluid in the flow circuit as prescribed by the programmed flow waveform. The fluid then exits the phantom and returns to the reservoir. (b) A picture of the stenotic phantom on the MRI table; the acrylic phantom has a 1” inner diameter, which narrows to 0.35” at the throat for an 87% area occlusion. (c) The aortic arch phantom precision machined with 1” diameter from clear acrylic. The setup permits changing polymeric valves in a separate block close to the inlet. (d) Calcific polymeric valves, at 50% (left) and at 0% (right) calcification. The valves, which are 1” in diameter, are made of polyurethane with various levels of calcium phosphate.21
The stenotic phantom has a straight pipe section proximal to the throat to ensure fully developed flow as well as a straight section distal to the throat, a portion of which is imaged. The aortic arch phantom has an inner diameter of 1” as well, which was precision-machined out of clear acrylic. The stenotic section smoothly narrows to a minimum diameter of 0.36” at the throat by following a Gaussian curve.
The compliant valves were created with four different degrees of calcification. These lead approximately to 0%, 50%, 75%, and 95% flow occlusion, modeling different degrees of disease severity. The valves were created by starting with polymeric valve molds and embedding differing amounts of calcium hydroxyapatite. The approach accurately models native calcified aortic valves.
The flow circuit was filled with a blood mimicking fluid that is comprised of 60% distilled water and 40% glycerol. This results in a viscosity around 0.0043 Pascal sec, and a density of ~1035 kg/m3, similar to human blood.7 The blood mimicking fluid was driven by a custom-made programmable pump (LB-Engineering, Berlin, Germany) that can create both steady and pulsatile flows up to a peak flow rate of 400 ml/s. For gated acquisitions, the pump also generates a trigger signal that is sent to the scanner for ECG-dependent imaging. The duration of each cycle is specified at the pump, but defaults to 60 bpm. The default was used in the steady flow acquisitions, while a programmed flow waveform dictated the duration of the pulsatile acquisitions. In the case of no flow acquisitions (performed for measuring noise levels), a Philips internal simulated ECG signal was used for gated acquisitions.
Imaging Protocol
All imaging was performed with a 1.5T Philips Achieva Scanner (Best, Netherlands), with a 16-channel XL Torso coil or a 16-channel SENSE knee coil. The sequences used for all experiments were 4D Cartesian (Conventional) flow, 4D Spiral flow, and Dual Venc versions of these, which were implemented in-house. The field of view (FOV) was 125 × 125 × 170 mm for the arch phantom and 100 × 100 × 60 mm for the stenotic phantom. The imaging parameters for all studies can be seen in Tables 1 and 2. In order to compare different scans, identical TRs were prescribed. The selected TR was that of the longest spiral sequence. The Venc switch time, or TDV, was set on the console by the operator, and chosen to be the best split between systole (high Venc) and diastole (low Venc).
TABLE 1.
In Vitro Steady Flow 4D Spiral Dual Venc Scan Parameters
| Field of view (mm) | 100*100*60 | |
| Resolution (mm) | 1.56*1.56*3 | |
| Number of slices | 20 | |
| Matrix size | 64*64 | |
| Flip angle (°) | 12 | |
| Triggering frequency (min−1) | 72 | |
| Number of phases | 16 | |
| Spiral | TE/TR (msec) | 1.85/11 |
| Readout time (msec) | 4 | |
| Number of interleaves | 36 | |
| Systole Venc (cm/s) | 400/600/800 | |
| Diastole Venc (cm/s) | 250 | |
| Venc switch time (msec) (TDV) | 365 |
The steady flow scans were gated in order to allow for a Dual-Venc 4D Spiral Flow assessment using the proposed pulse sequence. The Venc was determined via a prior 2D through plane phase-contrast scan from a region thought to have the highest flow velocities.
TABLE 2.
In Vitro Pulsatile Flow and in vivo Human Subject Scan Parameters
| Field of view (mm3) | 100*100*60 | 100*100*48 | 125*125*170 | 200*200*50 | |
| Resolution (mm) | 1.56*1.56*3 | 1.5*1.5*4 | 2*2*5 | 2.5*2.5*5 | |
| Matrix size | 64*64 | 68*68 | 64*64 | 80*80 | |
| Flip angle (°) | 12 | 8 | 8 | 8 | |
| Triggering frequency (mm−1) | 72 | 34 | 40 | Varies | |
| Number of phases | 16 | 15 | 18 | 16 | |
| Cartesian readout | TE/TR (msec) | 4.3/12 | 4.2/14 | 3.6/11 | 2.8/Varies |
| Readout time (msec) | 3.4 | .3.5 | 3.1 | 2.1 | |
| Systole Venc (cm/s) | 400 or 250 | 300 | 200 | 400 | |
| Diastole Venc (cm/s) | 100 | — | 140 | — | |
| Venc switch time (msec) | 340 | — | 800 | — | |
| Scan time(mm:ss) | 27:46 | 9:44 | 70:25 | 7:27 | |
| Spiral readout | TE/TR (msec) | 2.3/12 | 2.4/14 | 2/11 | 2.3/Varies |
| Readout time (msec) | 4 | 4 | 4 | 4 | |
| Numbet of interleaves | 36 | 32 | 32 | 16 | |
| Systole Venc (cm/s) | 400 or 250 | 300 | 200 | 400 | |
| Diastole Venc (cm/s) | 100 | 90 | 140 | 100 | |
| Venc switch time (msec) | 340 | 850 | 800 | Varies (default = 400) | |
| Scan time (mm:ss) | 15:38 | 7:05 | 35:14 | 3:00 |
In each case, the Venc was specified via a prior 2D through plane phase-contrast scan. In the table Qmax represents the maximum rate in the prescribed flow waveform. Please note that the scan time for human subjects stated in this table do not take into account respiratory gating, which in general increase the stated times by 3 times or more (depending on individual subjects’ gating efficiency).
A variety of in vitro steady and pulsatile flow scans were considered. The pulsatile scans show the strength of the Dual Venc approach (Table 2). In order to study the effect of noise, a few gated steady flow and no-flow scans (pump turned off) were also acquired. The TDV was set to be as close to 50% division between the cardiac phases as possible for the steady flow. The no-flow scans were done as individual Single Venc scans.
The protocol was approved by the Veterans Affairs (VA) Institutional Review Board. Healthy volunteers as well as patients with severe aortic stenosis (AS) were scanned. Patients were recruited from the Cardiology Clinic at the Robley Rex VA Medical Center (all male subjects, age 69 ± 8.6). Severe AS was defined based on echo measurements: peak systolic velocity greater than 3.5 m/s, effective orifice area (EOA) less than 1 cm2, or transvalvular pressure gradient (TVPG) ≥ 40 mmHg. All human subject data were acquired with both respiratory and cardiac gating. In order to reduce the scan times (each subject underwent multiple 4D acquisitions) the acquisition parameters were relaxed to a resolution of 2.5 × 2.5 × 5 mm, with an FOV of 200 × 200 × 50 mm and flip angle of 8 degrees. Data were acquired over a variable number of heart phases, with a minimum of 16 phases. The number of phases selected was based on whether the addition of a heart phase was possible and/or added time to the scan. The navigator window length was set to 100 mm, with an acceptance window of 7 mm. The Venc was patient-dependent, but defaulted to 400 cm/s for systole and 100 cm/s for diastole. Any changes to the Venc were made based on a breath-held 2D PC-MRI through-plane acquisition performed prior to the 4D flow acquisition. The plane was placed distal to the aortic valve to capture the peak systolic velocity in the flow. The peak through-plane velocity waveform from the 2D PC-MRI scan determined the high and low Venc settings. Subsequently, 4D flow scans were performed starting with Cartesian Dual Venc and Spiral Dual Venc, which is the minimum volunteer or patient scan. If the volunteer or patient were able to tolerate more acquisitions, then subsequent acquisitions were attempted. These other attempted scans were Spiral Single Venc and Cartesian Single Venc scans with the high Venc value, and finally Spiral Single Venc and Cartesian Single Venc with the low Venc value. In total, six normal volunteers and eight patients with severe AS were scanned. Two volunteers and one patient completed the full set of acquisitions.
Analysis of Data
In order to quantify the effect of Venc on measurement noise in the 4D flow acquisition, a no-flow case was acquired and the resulting data were analyzed. For this, the pump was turned off and as a result all velocities were expected to be identical to zero. Any deviation from zero was attributed to noise and eddy currents. Mean (and standard deviation) of velocities in the fluid region were calculated and reported.
| (1) |
In Eq. 1, i is the slice index, while j is the pixel index in the region of interest (ROI) for that slice. For each slice, the voxel velocities inside manually delineated stenotic phantom contours were summed to form a net flow error.
The efficacy of the protocol was also tested via a steady flow with gated acquisition. A low Venc (higher than the peak velocity) and a high Venc larger than the low Venc were chosen. This was done by comparing the net flow of the first slice acquired proximal to stenotic narrowing to all the other slices. The cumulative error for the scan can be estimated by calculating the relative root mean squared error (RRMSE). The RRMSE was used to compare the Dual Venc scans’ RRMSE to that of the Single Venc Cartesian readout 4D flow. In Eq. 2, Qexp(n,t) is the flow waveform distal to the stenosis for slice n and Qinlet(t) represents flow calculated in the first slice at the inlet.
| (2) |
Velocity-to-noise ratio (VNR) is another parameter that is useful for assessing noise and improvements due to Dual Venc. The equation used for this calculation is22:
| (3) |
where two velocity images (v1 & v2) with the same ROI are used. In Eq. 3, the mean of velocities in two identical regions in two images with flow (v1 & v2) is divided by the standard deviation of the difference from the same regions. In our case, VNR was calculated for the gated no-flow, and the steady acquisitions as these phantom studies had 16 acquisitions for the same imaged volume. Each of the 16 acquisitions were compared with each other, and the resultant VNR was averaged to arrive at the reported VNR.
The final set of experiments involved pulsatile flow through the phantoms. Comparing the flow waveforms determined through different acquisitions offer an indication of matching peak flow rates and accuracy in time. The prescribed waveform used by the pump was not included in this comparison, as the programmed and observed waveforms are in general different. This is because of the compliant tubing and flow connectors in the circuit that cause damping of the prescribed waveform. For this reason, comparison of the programmed waveform produced by the pump and the flow waveforms measured by different MR methods would not provide any additional insight regarding the accuracy of the methods. Further illustration of this issue may be found in Ref. 7. The other approach to visualization of data was the scatterplot where the Single Venc net flow values were compared to the corresponding Dual Venc counterpart in time and slice. This was done along with a linear fit of the scatterplot and the Pearson correlation coefficient (P < 0.01).
Results
Figure 3 illustrates a few pictorial results from the in vitro studies. Figure 3a,b display sagittal views of the velocity magnitudes in peak systole and diastole acquired with the Spiral Dual Venc acquisition for a pulsatile flow waveform with Qmax = 150 ml/s. Please see Table 2 for the scan parameters. Figure 3c–f is from the same aortic arch flow experiment with Spiral Dual Venc acquisition (Table 2). Figure 3c,e are velocity magnitudes in the sagittal and axial orientations in peak systole and Fig. 3d,f is in diastole. The sagittal orientation was derived from postprocessing in GTFlow (GyroTools GmbH, Zurich, Switzerland).
FIGURE 3:
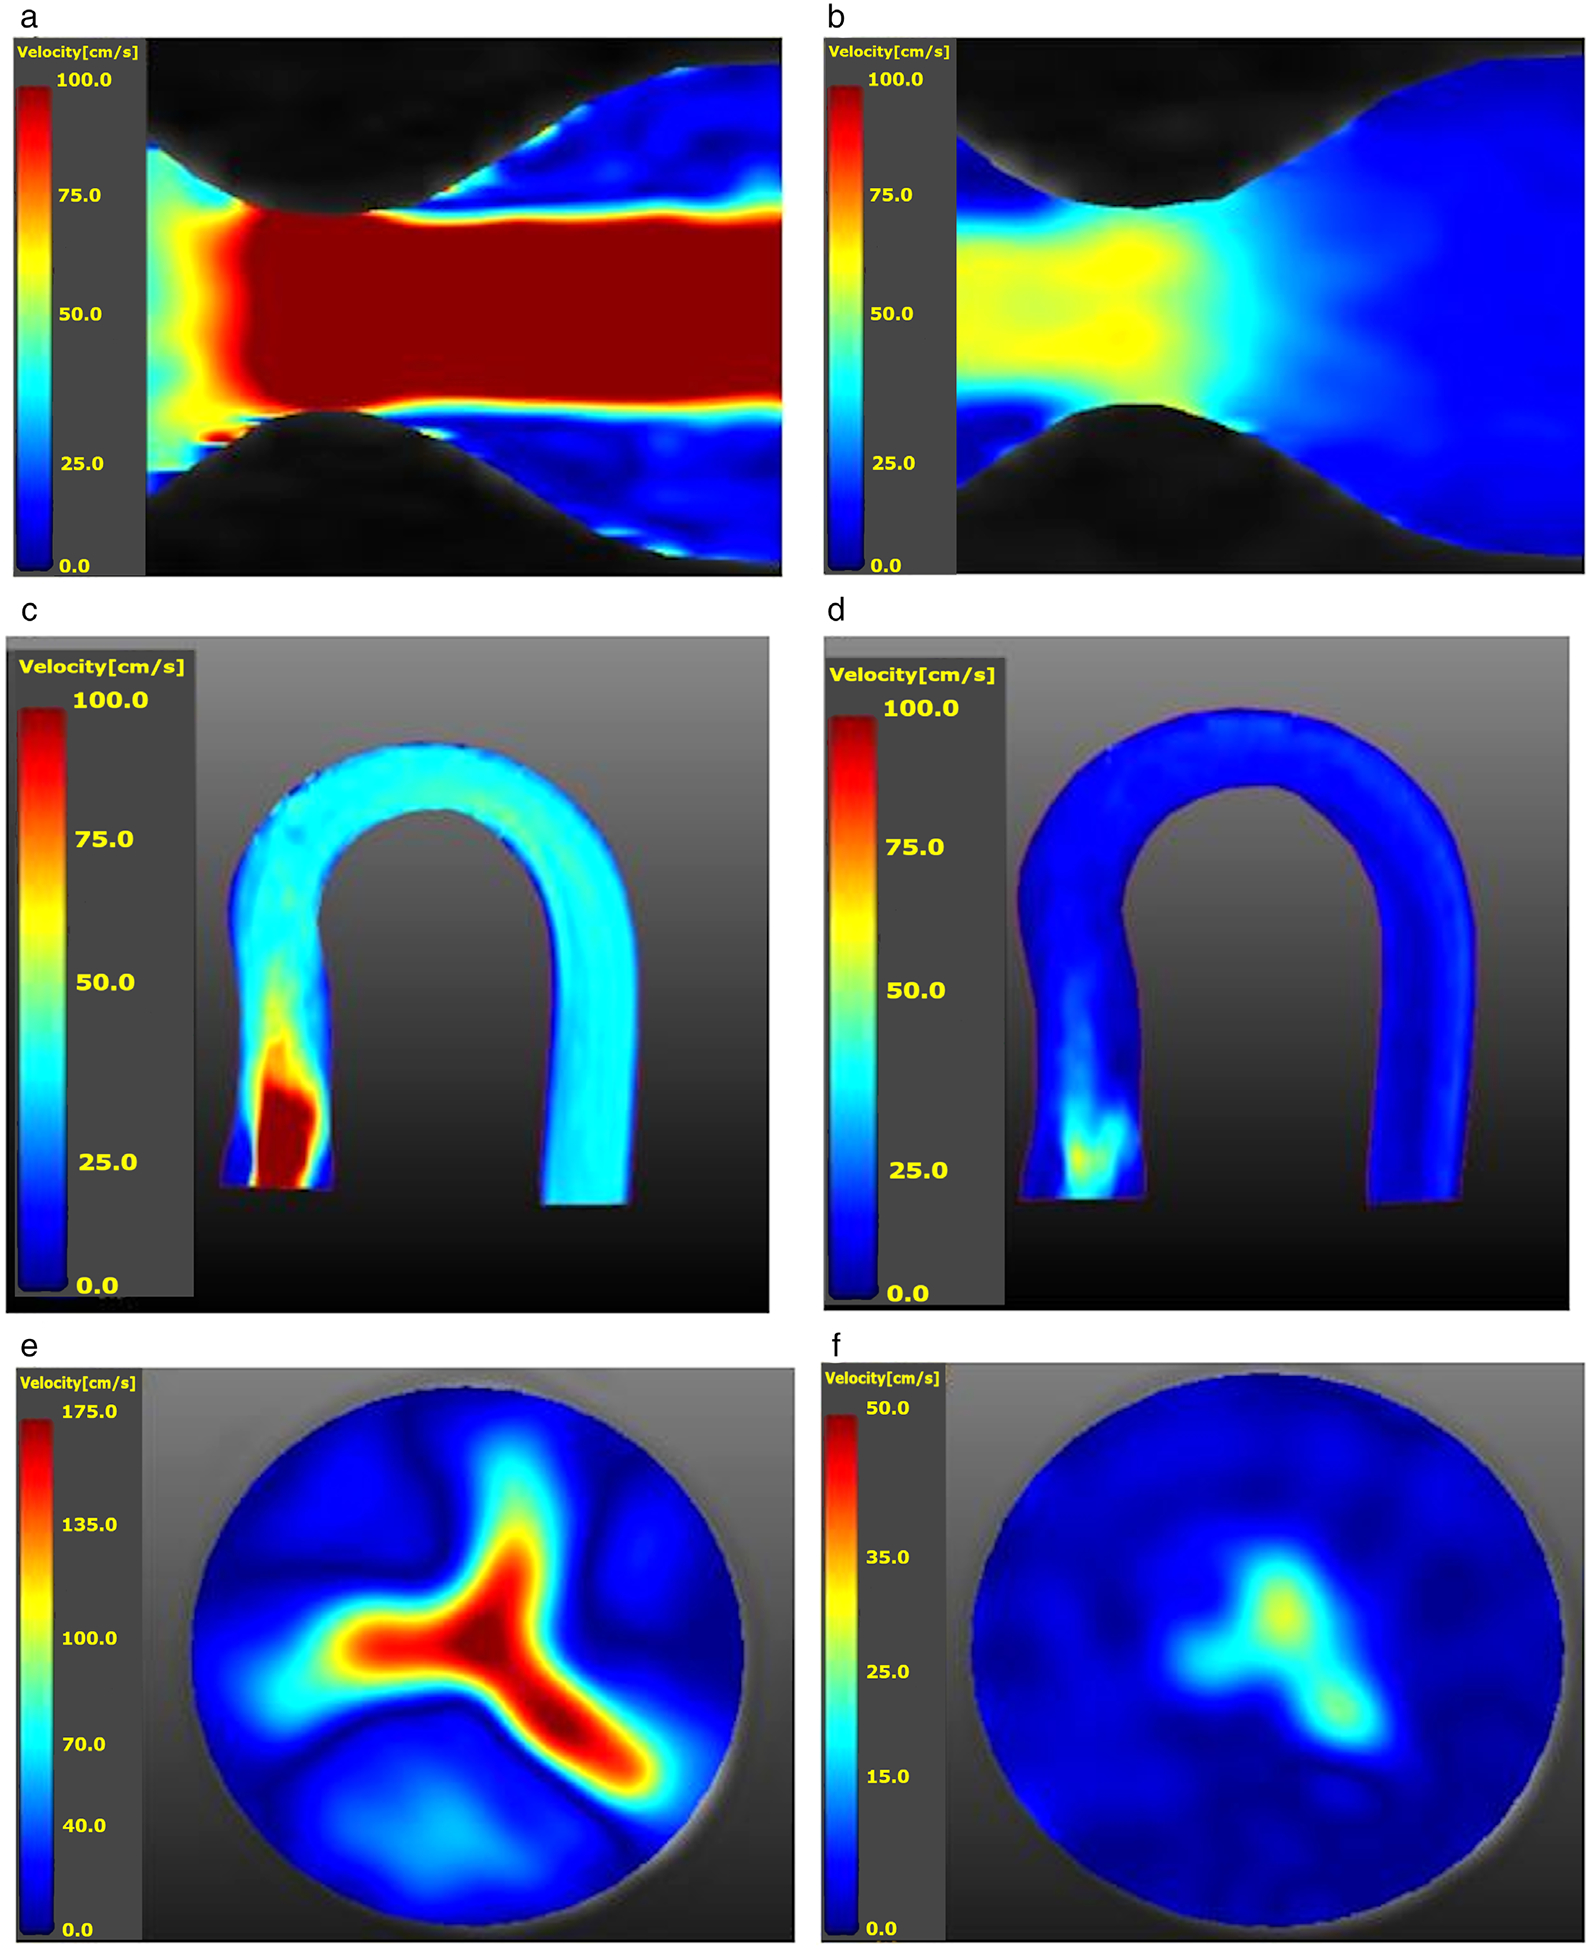
(a) Velocity magnitude map of a sagittal cut of the stenotic phantom distal to the throat or region of interest during systole. Qmax = 150 ml/s (range: 100.0 cm/s to 0.0 cm/s. (b) Velocity magnitude map in diastole for the same study (range: 100.0 cm/s to 0.0 cm/s). (c) Velocity magnitude map of the aortic arch phantom with a 0% calcification synthetic valve at peak systole (Qmax = 150 ml/s). The valve is located on the lower left portion of the picture; the high-speed jet may be seen immediately distal to the valve (range: 100.0 cm/s to 0.0 cm/s). (d) The same sagittal slice as in (c), but during diastole (range: 100.0 cm/s to 0.0 cm/s). (e) peak systolic axial slice of velocity magnitudes corresponding to (c) and immediately distal to the valve. The valve opening clearly visible with its trileaflets (range: 175.0 cm/s to 0.0 cm/s). (f) Corresponding diastolic axial slice of velocity magnitudes (range: 50.0 cm/s to 0.0 cm/s).
Analysis of Noise
Figure 4 shows the aggregate voxel velocities for the no-flow case (pump turned off) in the stenotic phantom, displaying error on a per-slice basis. Figure 4a shows the net flow error dependent on the slice location. Due to system imperfections, this error increased as the slice location moved from the magnet isocenter, which was coincident with the coil center. The low Venc net flow error (any deviation from zero) has a slightly negative bias, while the higher Venc has a positive bias with the spiral acquisitions diverging more from zero with increasing distance from the isocenter. Figure 4b shows the average velocity error as a function of slice number with the coil center located around slices 5 or 6. This not only shows a good agreement between slices, but also shows the effect of coil placement on error. The coil center was placed around slices 5 or 6 at the throat of the stenotic phantom, where the net flow error was lower. The velocity error was combined between slices to create mean error and error standard deviation for the acquisition types. The mean error for high Venc (200 cm/s) acquisitions were 3.06 cm/s, and 3.11 cm/s for Spiral and Cartesian trajectories, respectively. The corresponding standard deviations for error were 1.24 cm/s and 1.31 cm/s. The mean error for low Venc (40 cm/s) acquisitions were 1.18 cm/s and 1.01 cm/s for Spiral and Cartesian trajectories, respectively, with a corresponding standard deviation of 0.35 cm/s, and 0.32 cm/s. The VNR (Eq. 3) was calculated for the Cartesian and Spiral no-flow cases. In the Cartesian case the high Venc VNR was 2.3, while for the low Venc case it was 3.1. In the Spiral no-flow case the high Venc VNR was 2.5, while for the low Venc case it was 3.8. This confirms the statement in Refs. 14 and 22 that the VNR inversely varies with Venc independent of readout trajectory.
FIGURE 4:
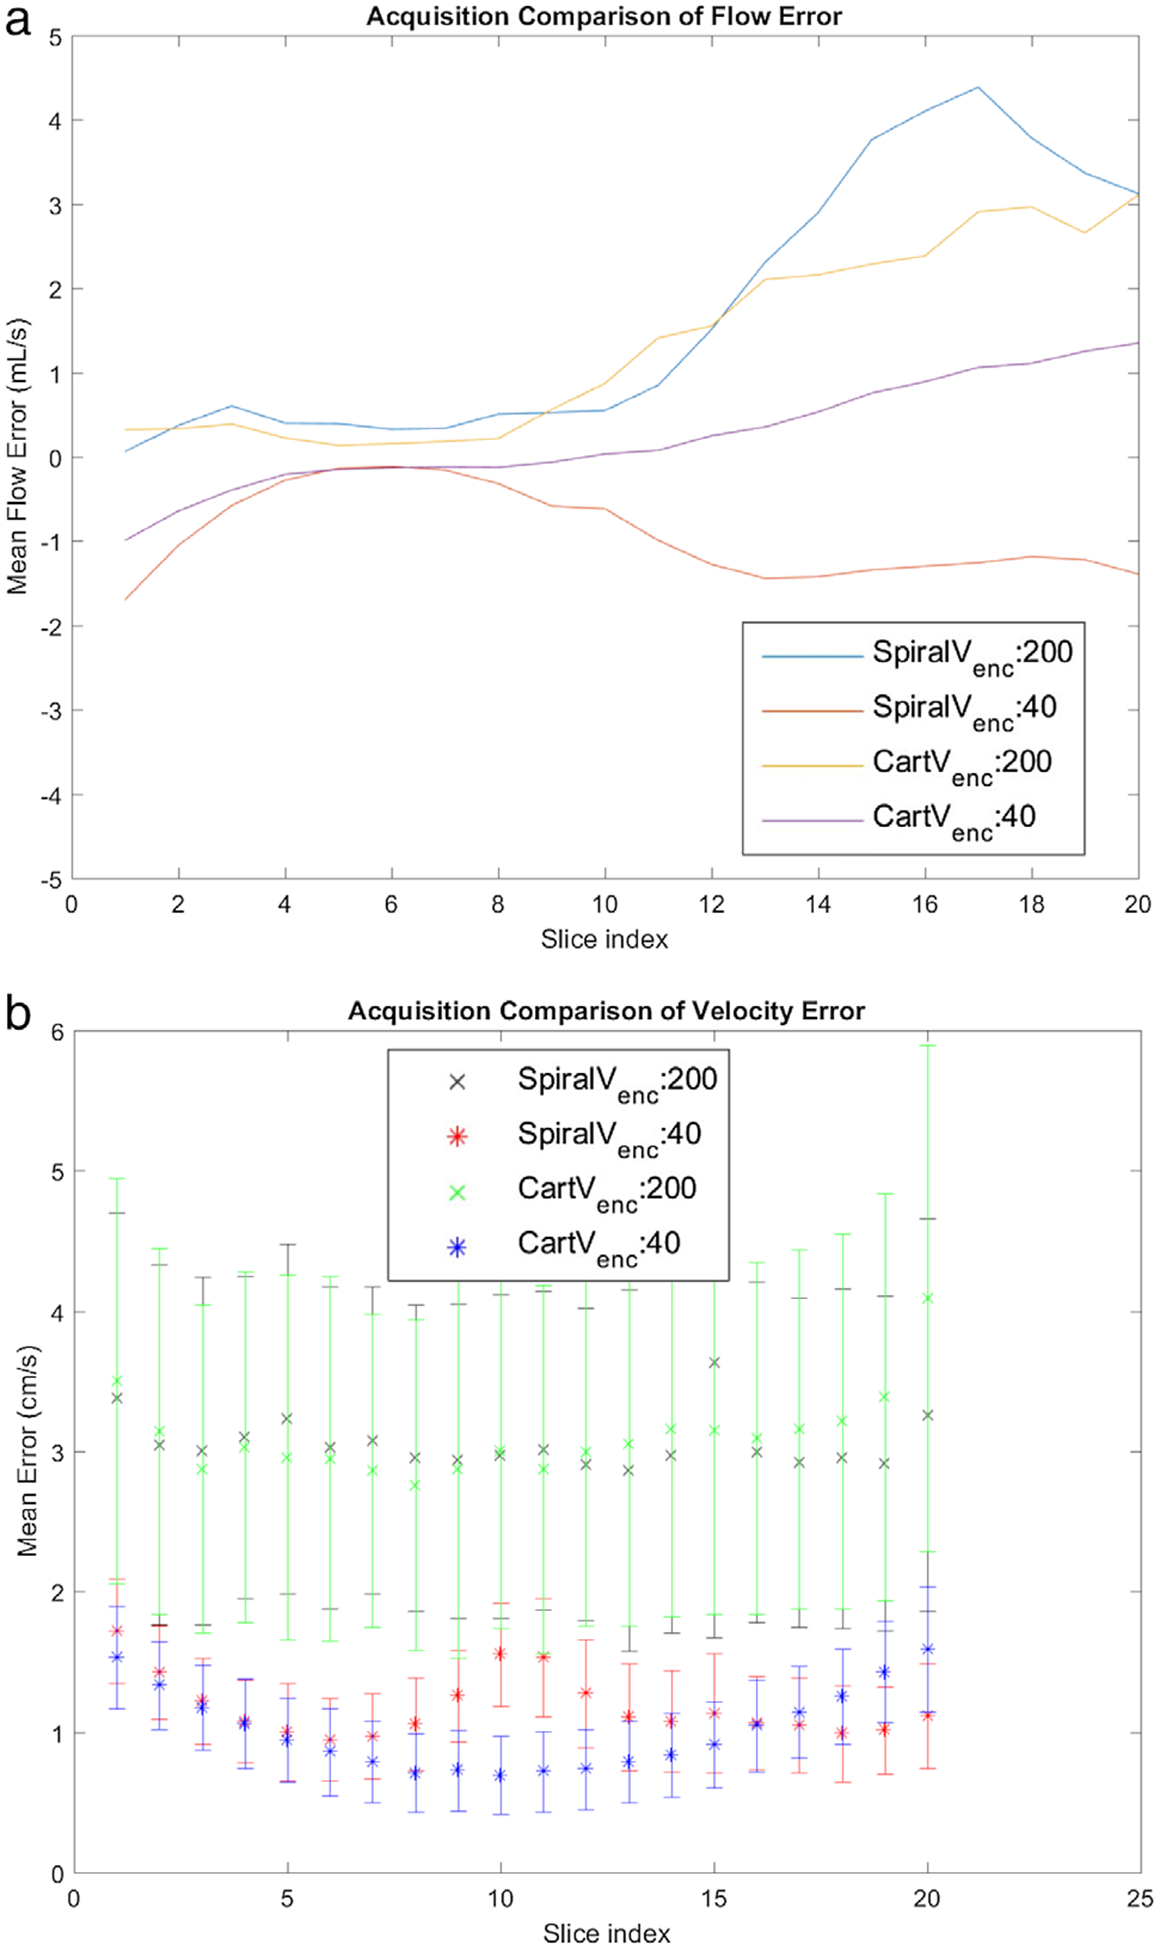
No-flow Single Venc results. Four sequences are compared. These are: Spiral High Venc (200 cm/s), Spiral Low Venc (40 cm/s), Cartesian High Venc (200 cm/s), and Cartesian Low Venc (40 cm/s). (a) flow error by slice. (b) Mean and standard deviation of velocity error as a function of Slice 5 is approximately at the isocenter and is at the stenosis throat.
Steady Flows
The results of the RRMSE calculation (Eq. 2) for the Q = 130 ml/s steady flow rate with n = 20 can be seen in Table 3. As noted earlier, the study was gated (prescribed pulsatile waveform was constant) to remove the effect of random noise. To do the calculation in Eq. 2, Qinlet was measured from the first slice proximal to the stenosis from a low Venc acquisition, averaged over 16 temporal phases. The trend in the table is that as the high Venc is increased, RRMSE does as well. The lower Dual Venc RRMSE, in comparison to the high Venc counterpart, is in part due to the low Venc portion of this acquisition. As seen in Table 3, the VNR was also calculated for steady flows and similar to the no-flow case; once again it inversely varied with the prescribed Venc. The high Venc VNR of the Dual Venc acquisition follows the trend of its Single Venc counterpart, while the low Venc portion remains consistent.
TABLE 3.
RRMSE for Steady Flow (130 mL/s) Data Acquired With 4D Spiral Flow (Eq. 2)
| Dual Venc | 400 | 250 | 9.63 | 13.3/18.0 |
| 600 | 250 | 14.18 | 10.8/19.1 | |
| 800 | 250 | 16.52 | 9.0/18.4 | |
| Single Venc | 400 | 17.60 | 13.0 | |
| 600 | 17.67 | 11.0 | ||
| 800 | 19.43 | 8.8 |
The Qinlet, from Eq. 2, in this case is the Low Venc acquisition with Cartesian 4D flow measured for the first slice and averaged over time to reduce noise. VNR was calculated via Eq. 3, and in the case of Dual Venc in the table, the high Venc VNR is shown first and the low Venc VNR is shown second.
Pulsatile Flow
The prescribed programmed flow at the inlet was chosen to be similar to in vivo aortic flow waveforms. The flow waveform measured in slice 12, distal to the valve, from the various 4D flow sequences can be in seen in Fig. 5a. In this figure the Single Venc acquisitions are plotted as a dotted line, while the Dual Venc results are plotted with a solid line. The Cartesian has a data marker of an x, while Spiral has a circular marker. There is general agreement between the measured flow waveforms, with the Spiral high Venc having a lower peak flow bias, while the Cartesian high Venc and Spiral Dual Venc show very similar peak flows. In diastole the flow waveforms are grouped more closely with acquisition trajectory, with the Dual Vencs having a slightly positive bias to their respective high Venc acquisition. Figure 5b is the flow waveform calculated from slice 6 of the stenotic phantom, 4 mm distal to the stenosis throat. In this figure the consequence of choosing too low a Venc can be seen where the systolic flow waveform is artifactual for one of the acquisitions due to velocity aliasing, while the other two acquisitions show agreement. All three acquisitions exhibit close agreement in diastole. The flow data points from various sequences tested are compared in the scatterplots in Fig. 5c,d. In Fig. 5c, each point in the scatterplot is the net flow for a specific timepoint and slice of the aortic arch phantom for the Spiral Dual Venc sequence and the related Cartesian Dual Venc sequence. This comparison was for the case of the 50% calcific polymeric valve. The Pearson correlation coefficient between the two measurements was 0.975 (P < 0.01). In Fig. 5d, each point in the scatterplot is the net flow for a specific timepoint and slice of the stenotic phantom for comparison of Spiral Dual Venc and Convention 4D flow with the same high Venc. The scatterplot in Fig. 5d resulted in a Pearson correlation coefficient of 0.995 (P < 0.01).
FIGURE 5:
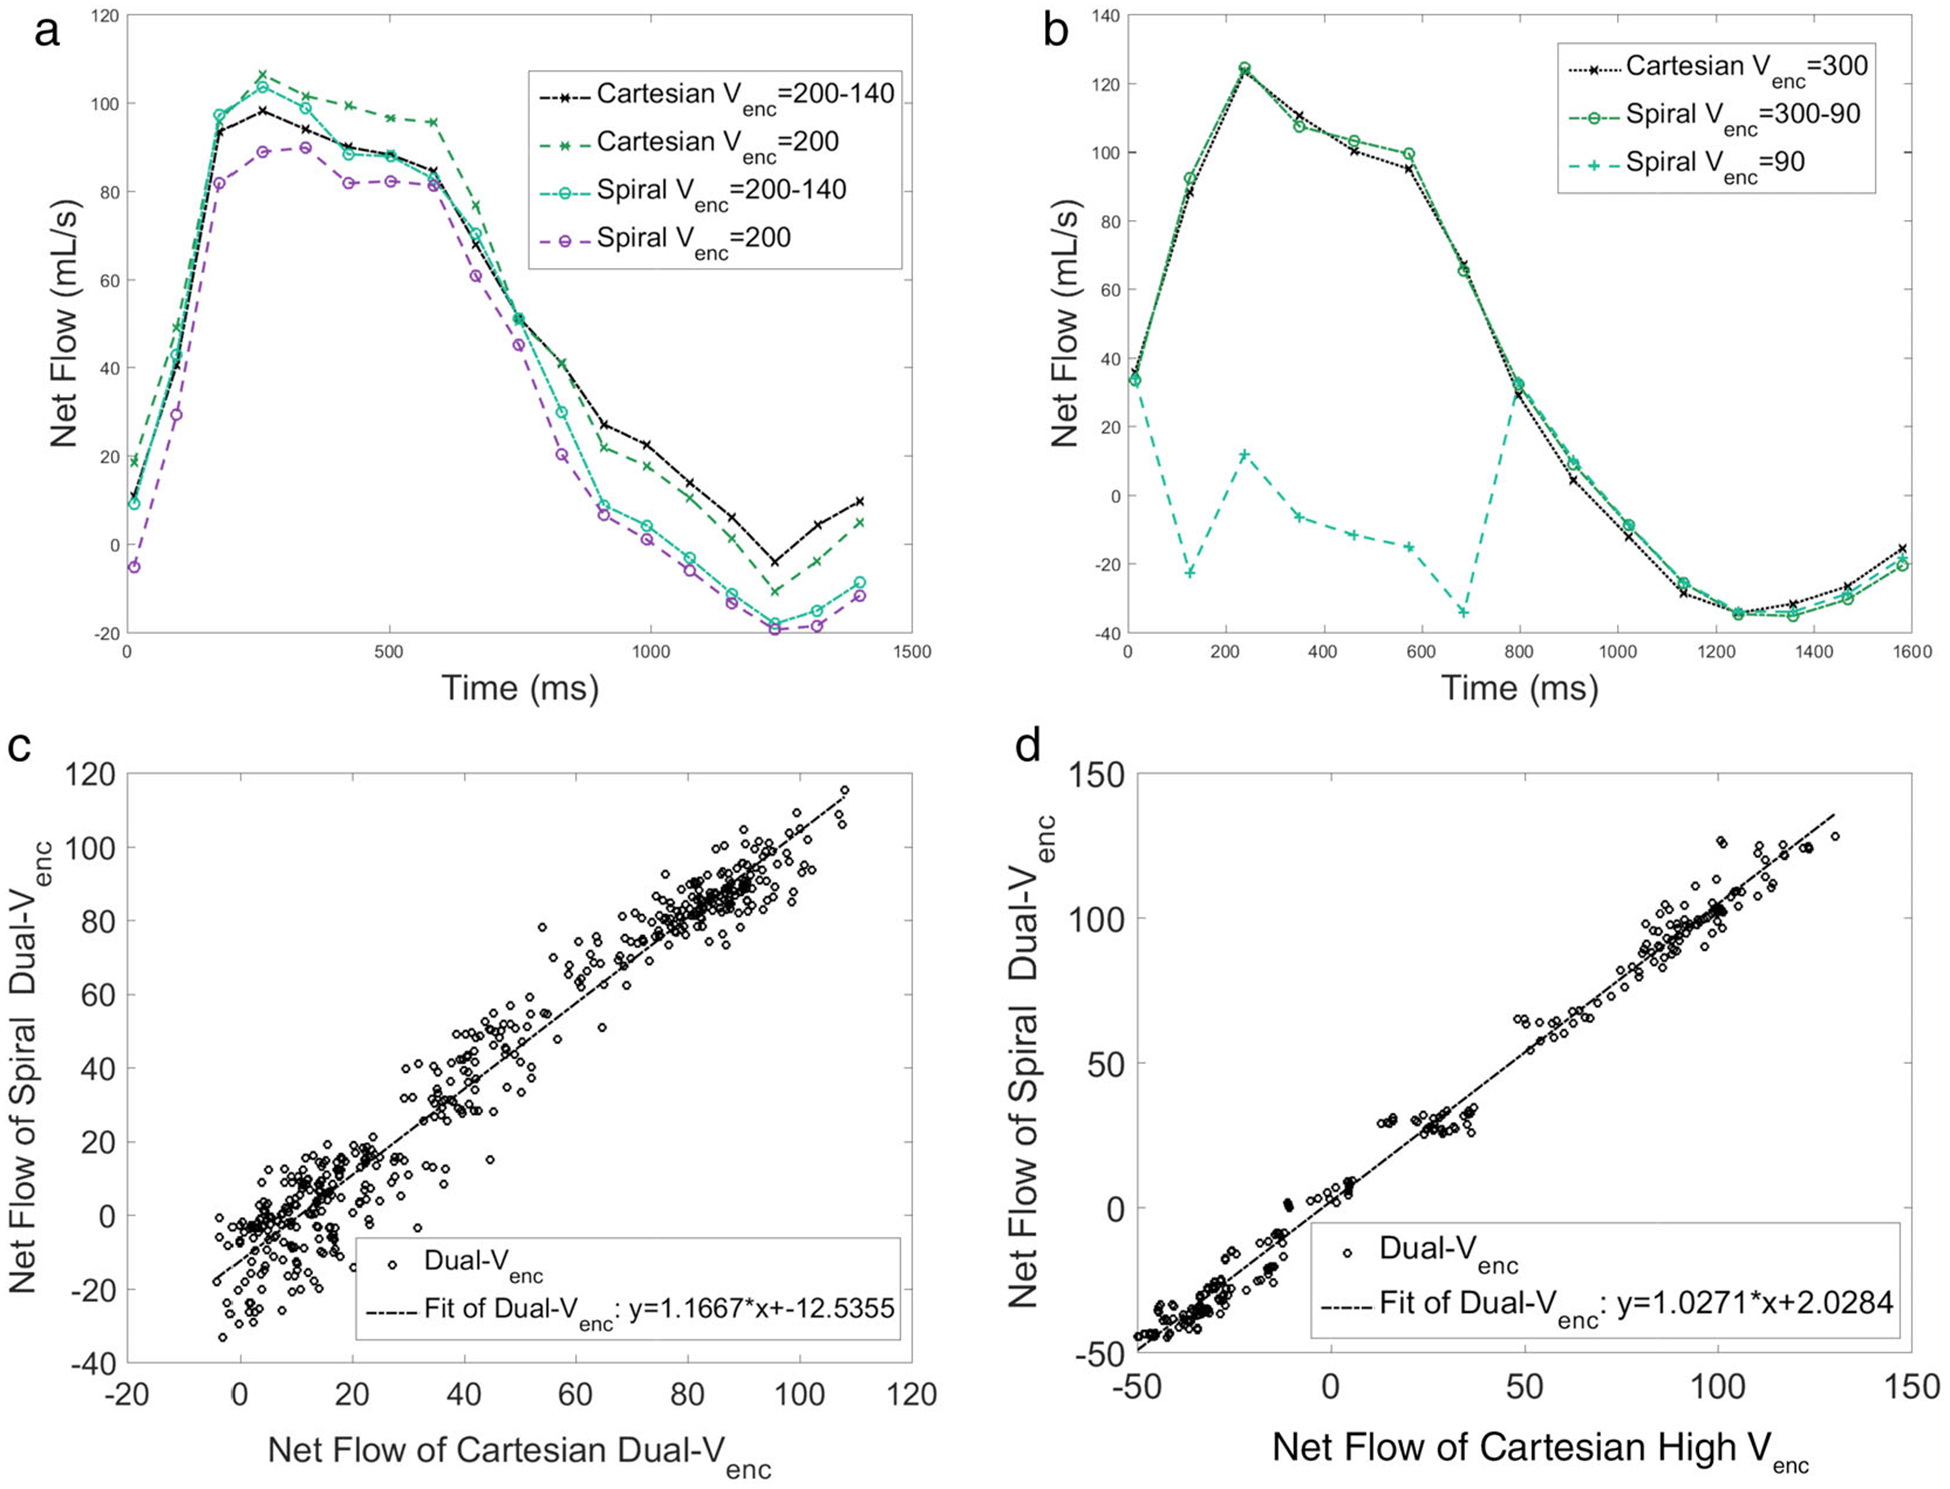
(a) Flow waveform of the aortic arch phantom (Fig. 2c) with a synthetic valve, with 0% occlusion. The slice chosen was 5 mm distal to the valve. (b) Flow waveform in the stenotic phantom (Fig. 2b) calculated from a slice location 4 mm distal to the stenosis throat. Note the Spiral Single Venc waveform is artifactual because of velocity aliasing. In this figure the Single Venc acquisitions are plotted with dotted line, while the Dual Venc results are plotted with a solid line. The Cartesian has a data marker of an x, while Spiral has a circular marker. (c) Comparison of Dual Venc Spiral and Dual Venc Cartesian flow data points for the slice immediately distal to the 50% polymeric valve in the aortic arch phantom. The Pearson correlation coefficient for the scatterplot is 0.975. (d) Comparison of the same Dual Venc Spiral, and High Venc Cartesian in the stenotic phantom. Pearson correlation coefficient for this scatterplot is 0.995. See text for additional description.
In Vivo Results
The results from the healthy volunteers and patients can be seen in Figs. 6 and 7. Figure 6a,b compare Spiral and Cartesian High Venc flow waveforms with those from Spiral Dual Venc. The waveforms are quite comparable, with the biggest differences occurring in diastole for both volunteers. Dual Venc Cartesian and Dual Venc Spiral flow data were compared for all normal volunteers (six subjects) and patients with AS (seven subjects). This was done for all healthy volunteers in Fig. 6c, and all patients in Fig. 6d. The resulting Pearson correlation coefficients were 0.970 in Fig. 6c and 0.952 in Fig. 6d. Figure 7 shows the flow waveform, scatterplot, and valve velocity distributions for a patient with severe AS. This figure compares the Dual Venc Spiral, with a High Venc and a Low Venc Spiral acquisition—once again the Low Venc acquisition exhibiting artifactual values in systole due to velocity aliasing. Figure 7b shows the net flow comparison between Spiral Dual Venc and Cartesian Dual Venc, with a resultant Pearson correlation coefficient of 0.930. Figure 7c shows velocity magnitudes in a slice close to the patient’s aortic valve during systole. Figure 7d shows velocity magnitudes in diastole when the aortic valve is closed at the same slice position. See Table 2 for the associated scan times. Please note that the scan time for human subjects stated in this table do not take into account respiratory gating, which in general increases the stated acquisition times by 3 times or more (depending on individual subjects’ gating efficiency).
FIGURE 6:
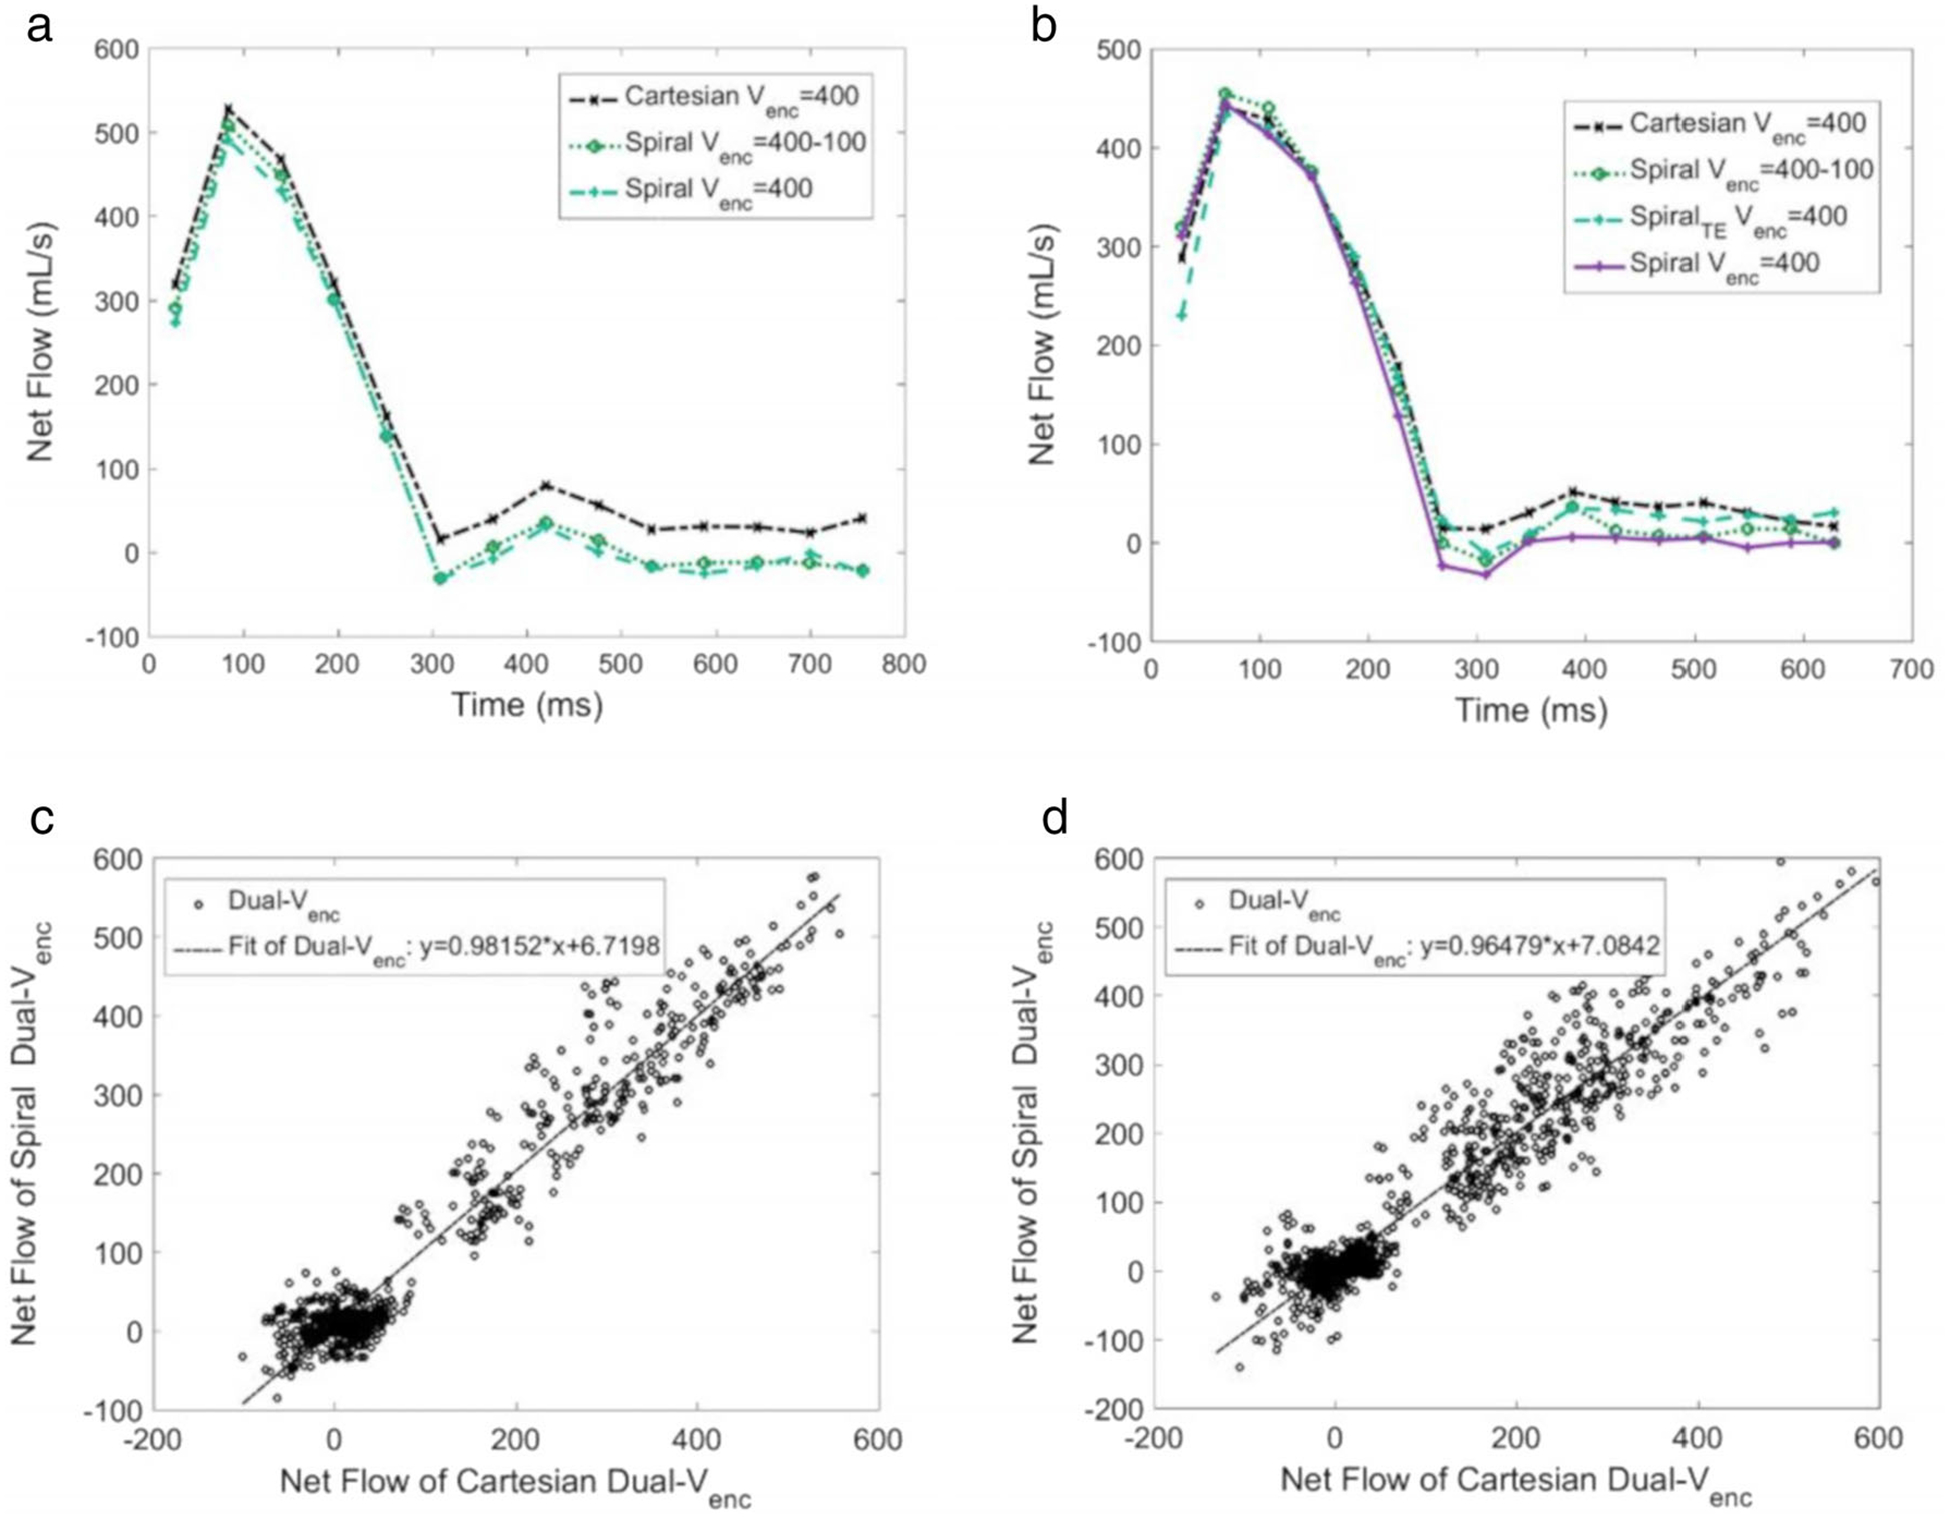
(a) Flow waveform in a normal subject distal to the aortic valve from Spiral and Cartesian Single Venc and Spiral Dual Venc acquisitions. (b) Waveforms measured with the same sequences in a different normal subject. (c) Scatterplot of flow data for all healthy volunteers (n = 6, Pearson correlation coefficient of 0.970). (d) Scatterplot of flow data for all patients with severe aortic stenosis (n = 7, Pearson correlation coefficient of 0.952). For both (c,d), flow rates for a specific slice, timepoint, and volunteer are single points.
FIGURE 7:
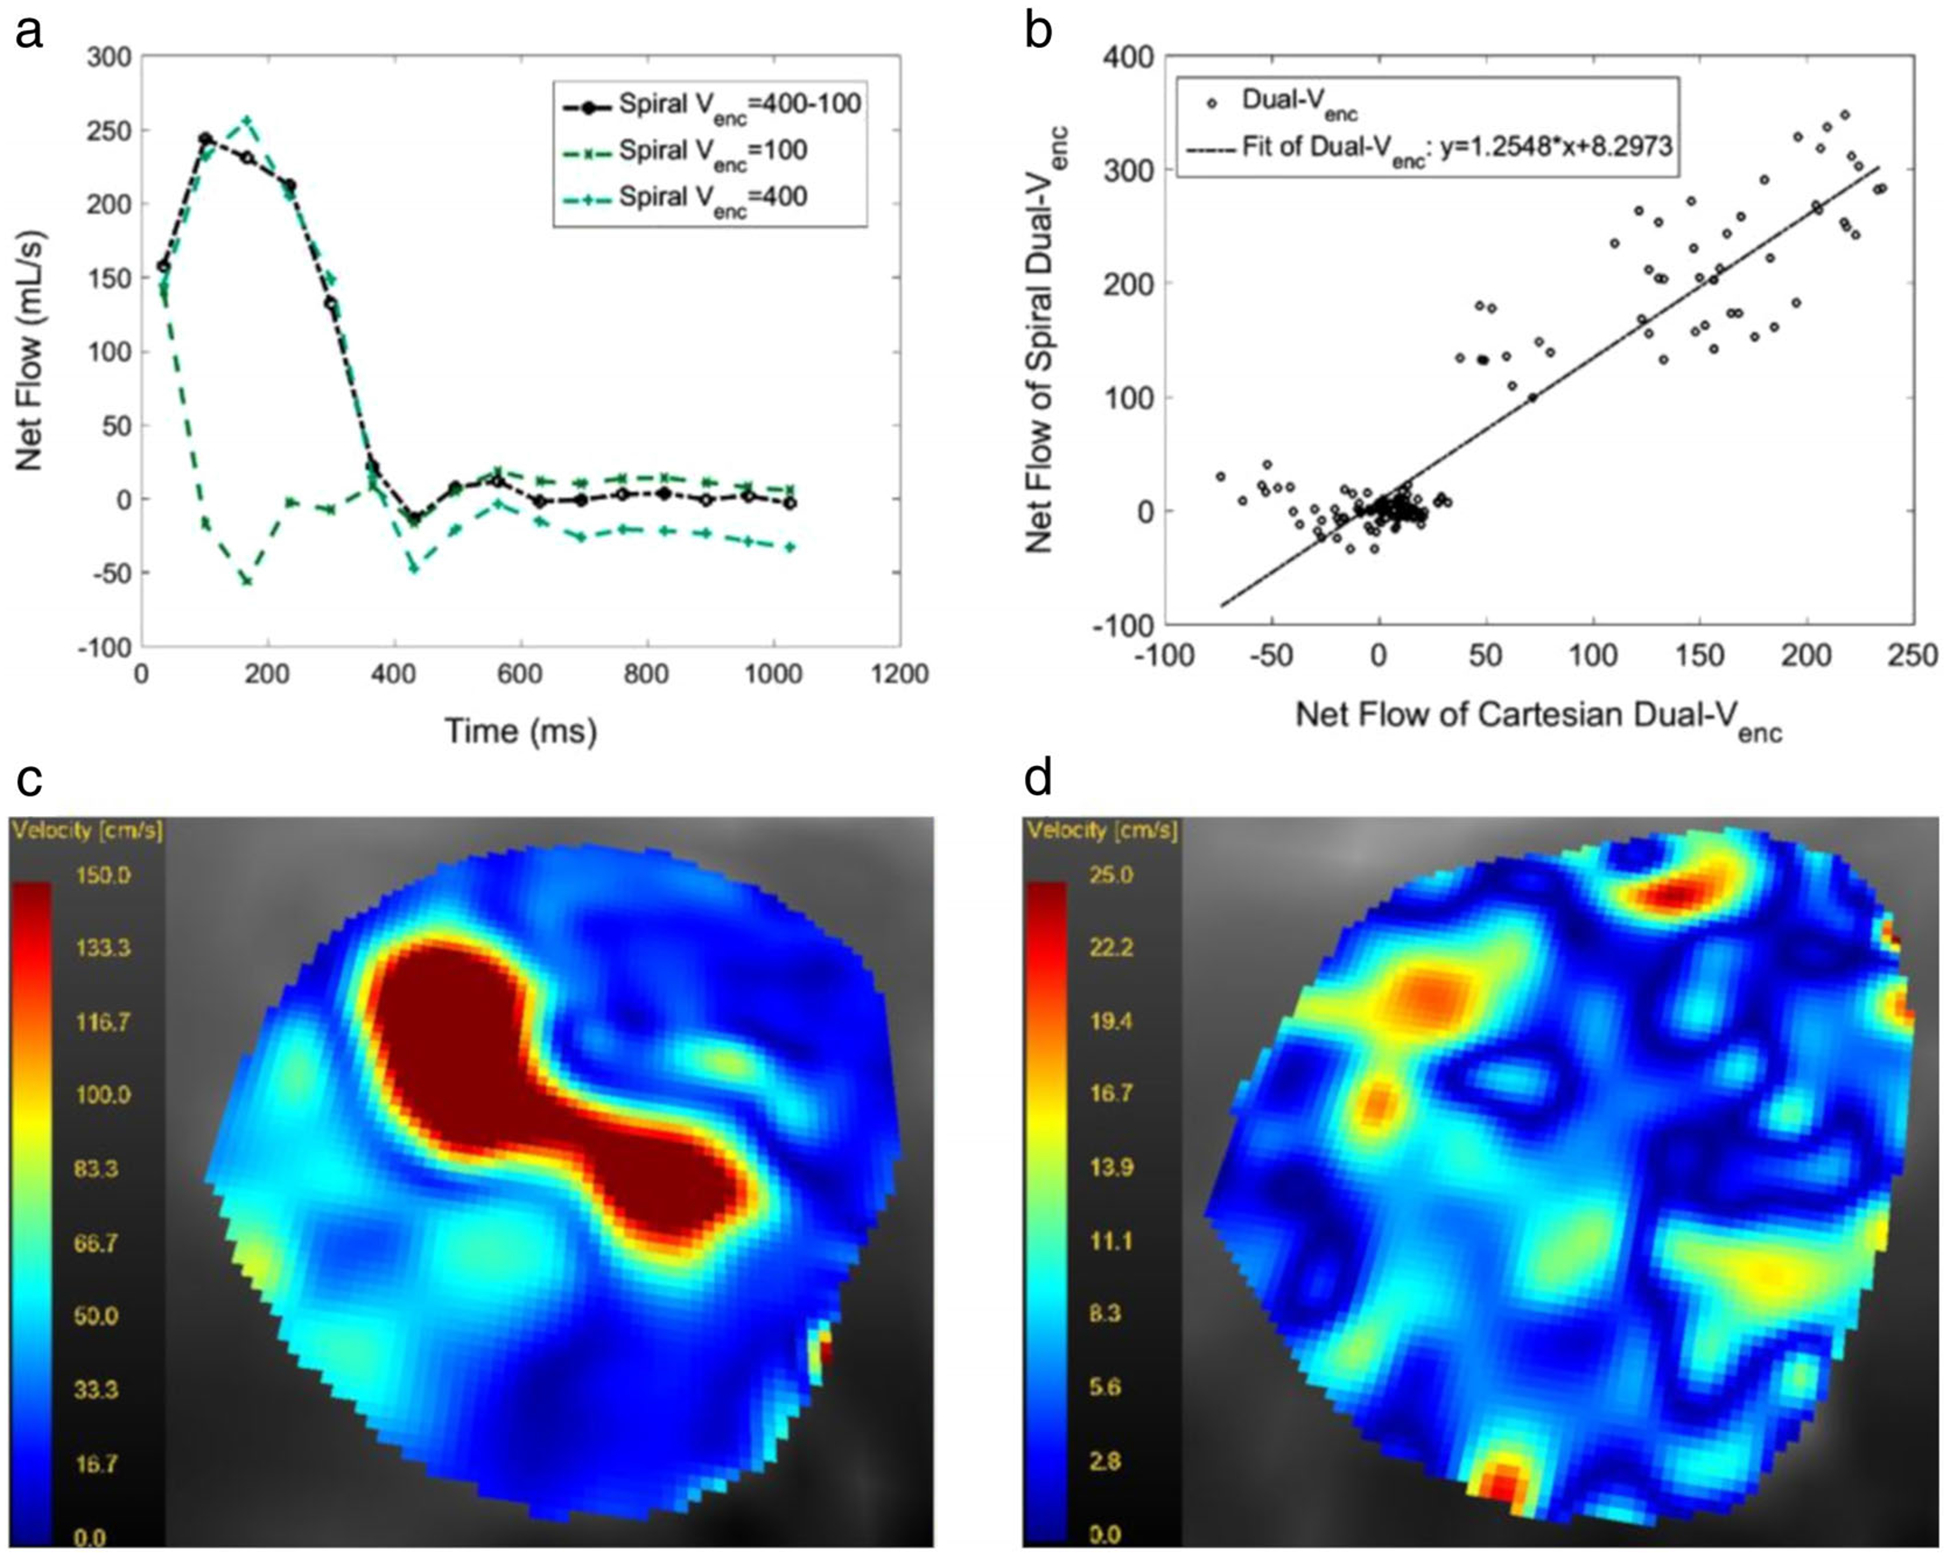
(a) Flow waveform in a patient with severe AS as measured with a Dual Venc, a high Venc and a low Venc spiral acquisition for the entire R-R interval. The TDV was set to 400 msec. Note that the low Venc acquisition leads to velocity aliasing in systole and an artifactual flow waveform. (b) The scatterplot of the Dual Venc vs. High Venc acquisition in the same patient. All slice positions and timepoints were included. The Pearson correlation coefficient was 0.930, (c) (range: 150 cm/s to 0.0 cm/s) and (d) (range: 25.0 cm/s to 0.0 cm/s) show magnitude of velocities in an axial slice at the aortic valve level in the same patient at peak systole and in mid-diastole.
Discussion
This study demonstrated an implementation of a Spiral Dual Venc pulse sequence, in which the Venc varies in time—higher Venc during systole and a lower Venc during diastole. The reduced Venc in diastole leads to improvement in velocity resolution and to a reduction in noise in the acquired data. Reduction of noise is important, since calculation of many hemodynamic parameters such as pressure24 or wall shear stress25 require derivative operations that are noise sensitive.
Owing to the interleaved spiral readout of k-space, the method proposed here results in efficient scans that are better tolerated by patients as well as a reduced TE, which in turn results in reduction of flow artifacts.7 The method was validated in phantom studies, normal subjects, and patients with severe AS. The results show that the sequence performs as good as its Single Venc counterpart in measurement of flow. However, the importance of the Dual Venc acquisition is in its improved velocity resolution in diastole and reduced noise due to the lower diastolic Venc.
Many of the previous Dual or Multi Venc implementations used scans equal to the number of Vencs.15,17,18,22 These scans are then stitched together using the separate Vencs in the R-R time. The multiple scans approach becomes costly in terms of scan efficiency, impeding clinical applications of 4D flow.
Reference 15 implemented the Dual Venc pulse sequence as a single scan in that it is seven TRs long, as opposed to the typical four TRs of a 4D flow scan. This sequence used a common reference for a high and low Venc scan with the resulting scan time only 1.75 longer than a Single Venc scan. Reference 16 implemented a 3D Cartesian phase contrast acquisition. The advantages of the interleaved Spiral implementation is the scan efficiency and reduced TE, which as noted previously leads to flow artifact reduction.
The proposed approach was adopted as it improves diastolic flow data, while maintaining the scan time of a low Venc Spiral acquisition. This is important when scanning patients, as >30-minute scan times for some individuals is untenable.
Limitations of the Study
Dual Venc acquisitions are applicable to flows where there is a large difference in the temporal value of velocities such as cardiovascular flows, which are biphasic. The reduction in noise in the data should permit more accurate measurement and computation of hemodynamic parameters of interest such as the pressure gradient and wall shear stress, where higher-order derivatives of the data need to be calculated. Despite the clearly general statement that reduced noise in the collected data improves calculation of these parameters, the study has not demonstrated the degree to which these measures will be improved when calculated from Dual Venc 4D flow.
The study does demonstrate that for calculation of flow waveforms 4D Spiral Dual Venc offers a similar performance to both conventional 4D flow and Dual Venc 4D flow acquisitions with Cartesian readouts. As with the conventional Dual Venc, Spiral Dual Venc offers good noise properties and velocity resolution; however, owing to the spiral readout, it offers reduced echo time and scan times.
Acknowledgment
Contract grant sponsor: National Institutes of Health; Contract grant number: 1R21-HL132263.
References
- 1.Pellikka PA, Sarano ME, Nishimura RA, et al. Outcome of 622 adults with asymptomatic, hemodynamically significant aortic stenosis during prolonged follow-up. Circulation 2005;111:3290–3295. [DOI] [PubMed] [Google Scholar]
- 2.Nishimura RA, Otto CM, Bonow RO, et al. 2014 AHA/ACC guideline for the management of patients with valvular heart disease: A report of the American College of Cardiology/American Heart Association Task Force on Practice Guidelines. J Am Coll Cardiol 2014;63:e57–e185. [DOI] [PubMed] [Google Scholar]
- 3.Bonow RO, Carabello BA, Chatterjee K, et al. 2008 focused update incorporated into the ACC/AHA 2006 guidelines for the management of patients with valvular heart disease: A report of the American College of Cardiology/American Heart Association Task Force on Practice Guidelines (Writing Committee to revise the 1998 guidelines for the management of patients with valvular heart disease) Endorsed by the Society of Cardiovascular Anesthesiologists, Society for Cardiovascular Angiography and Interventions, and Society of Thoracic Surgeons. J Am Coll Cardiol 2008;52:e1–e142. [DOI] [PubMed] [Google Scholar]
- 4.Otto CM, Lind BK, Kitzman DW, Gersh BJ, Siscovick DS. Association of aortic-valve sclerosis with cardiovascular mortality and morbidity in the elderly. N Engl J Med 1999;341:142–147. [DOI] [PubMed] [Google Scholar]
- 5.Stewart BF, Siscovick D, Lind BK, et al. Clinical factors associated with calcific aortic valve disease fn1. J Am Coll Cardiol 1997;29:630–634. [DOI] [PubMed] [Google Scholar]
- 6.Pibarot P, Dumesnil JG. Improving assessment of aortic stenosis. J Am Coll Cardiol 2012;60:169–180. [DOI] [PubMed] [Google Scholar]
- 7.Negahdar MJ, Kadbi M, Kendrick M, Stoddard MF, Amini AA. 4D spiral imaging of flows in stenotic phantoms and subjects with aortic stenosis. Magn Reson Med 2016;75:1018–1029. [DOI] [PMC free article] [PubMed] [Google Scholar]
- 8.Markl M, Frydrychowicz A, Kozerke S, Hope M, Wieben O. 4D flow MRI. J Magn Reson Imaging 2012;36:1015–1036. [DOI] [PubMed] [Google Scholar]
- 9.Carlsson M, Toger J, Kanski M, et al. Quantification and visualization of cardiovascular 4D velocity mapping accelerated with parallel imaging or kt BLAST: Head to head comparison and validation at 1.5 T and 3 T. J Cardiovasc Magn Reson 2011;13:1. [DOI] [PMC free article] [PubMed] [Google Scholar]
- 10.Lustig M, Donoho D, Pauly JM. Sparse MRI: The application of compressed sensing for rapid MR imaging. Magn Reson Med 2007;58:1182–1195. [DOI] [PubMed] [Google Scholar]
- 11.Sigfridsson A, Petersson S, Carlhall C-J, Ebbers T. Four-dimensional flow MRI using spiral acquisition. Magn Reson Med 2012;68:1065–1073. [DOI] [PubMed] [Google Scholar]
- 12.Gu T, Korosec FR, Block WF, et al. PC VIPR: A high-speed 3D phase-contrast method for flow quantification and high-resolution angiography. Am J Neuroradiol 2005;26:743–749. [PMC free article] [PubMed] [Google Scholar]
- 13.Kadbi M, Negahdar MJ, Traughber M, et al. 4D UTE flow: A phase-contrast MRI technique for assessment and visualization of stenotic flows. Magn Reson Med 2015;73:939–950. [DOI] [PubMed] [Google Scholar]
- 14.Pelc NJ, Bernstein MA, Shimakawa A, Glover GH. Encoding strategies for three-direction phase-contrast MR imaging of flow. J Magn Reson Imaging 1991;1:405–413. [DOI] [PubMed] [Google Scholar]
- 15.Schnell S, Ansari SA, Wu C, et al. Accelerated dual Venc 4D flow MRI for neurovascular applications. J Magn Reson Imaging 2017;46:102–114. [DOI] [PMC free article] [PubMed] [Google Scholar]
- 16.Nilsson A, Bloch KM, Carlsson M, et al. Variable velocity encoding in a three-dimensional, three-directional phase contrast sequence: Evaluation in phantom and volunteers. J Magn Reson Imaging 2012;36: 1450–1459. [DOI] [PubMed] [Google Scholar]
- 17.Ha H, Kim GB, Kweon J, et al. Multi-VENC acquisition of four-dimensional phase-contrast MRI to improve precision of velocity field measurement. Magn Reson Med 2016;75:1909–1919. [DOI] [PubMed] [Google Scholar]
- 18.Callaghan FM, Kozor R, Sherrah AG, et al. Use of multi-velocity encoding 4D flow MRI to improve quantification of flow patterns in the aorta. J Magn Reson Imaging 2016;43:352–363. [DOI] [PubMed] [Google Scholar]
- 19.Callahan S, Henn A, Negahdar M, et al. Dual-venc 4D flow spiral imaging of aortic flows. In: Proc 27th Annual Meeting ISMRM, Montreal; 2019. [Google Scholar]
- 20.Henn A, Callahan S, Kendrick M, Kheradvar A, Amini AA. An MR compatible aortic arch phantom with calcific polymeric valves In: Proceedings of SPIE Medical Imaging, February 2019, San Diego, CA. [Google Scholar]
- 21.Falahatpisheh A, Morisawa D, Toosky TT, Kheradvar A. A calcified polymeric valve for valve-in-valve applications. J Biomech 2017;50:77–82. [DOI] [PMC free article] [PubMed] [Google Scholar]
- 22.Nett E, Johnson K, Frydrychowicz A, Munoz Del Rio A, Schrauben E, Francois C, Wieben O. Four-Dimensional phase contrast MRI with accelerated dual velocity encoding. J Magn Reson Imaging 2012;35: 1462–1471. [DOI] [PMC free article] [PubMed] [Google Scholar]
- 23.Nasiraei-Moghaddam A, Behrens G, Fatouraee N, et al. Factors affecting the accuracy of pressure measurements in vascular stenoses from phase-contrast MRI. Magn Reson Med 2004;52:300–309. [DOI] [PubMed] [Google Scholar]
- 24.Negahdar MJ, Kadbi M, Cha J, Cebral J, Amini A. Noninvasive 3D pressure calculation from PC-MRI via non-iterative harmonics-based orthogonal projection: Constant flow experiment. In: Engineering in Medicine and Biology Society (EMBC), 2013 35th Annual International Conference of the IEEE; 2013, p 4390–4393. [DOI] [PubMed] [Google Scholar]
- 25.Stalder AF, Russe M, Frydrychowicz A, Bock J, Hennig J, Markl M. Quantitative 2D and 3D phase contrast MRI: Optimized analysis of blood flow and vessel wall parameters. Magn Reson Med 2008;60: 1218–1231. [DOI] [PubMed] [Google Scholar]


