

Abstract
TGFβ plays a crucial role in the tumor microenvironment by regulating cell-cell and cell-stroma interactions. We previously demonstrated that TGFβ signaling on myeloid cells regulates expression of CD73, a key enzyme for production of adenosine, a pro-tumorigenic metabolite implicated in regulation of tumor cell behaviors, immune response, and angiogenesis. Here, using an MMTV-PyMT mouse mammary tumor model, we discovered that deletion of TGFβ signaling on myeloid cells (PyMT/TGFβRIILysM) affects ECM formation in tumor tissue, specifically increasing collagen and decreasing fibronectin deposition. These changes were associated with mitigated tumor growth and reduced metastases. Reduced TGFβ signaling on fibroblasts was associated with their proximity to CD73+ myeloid cells in tumor tissue. Consistent with these findings, adenosine significantly downregulated TGFβ signaling on fibroblasts, an effect regulated by A2A and A2B adenosine receptors. METABRIC data set analysis revealed that patients with triple-negative breast cancer and basal type harbored a similar signature of adenosine and ECM profiles: high expression of A2B adenosine receptors correlated with decreased expression of Col1 and was associated with poor outcome. Taken together, our studies reveal a new role for TGFβ signaling on myeloid cells in tumorigenesis. This discovered crosstalk between TGFβ/CD73 on myeloid cells and TGFβ signaling on fibroblasts can contribute to ECM remodeling and pro-tumorigenic actions of CAF.
Keywords: TGFβ, adenosine, tumor
Introduction
Tumor microenvironment consists of multiple cellular and non-cellular components, creating a niche for tumor development. Complex interactions of its components, including cells, extracellular matrix (ECM), dissolved or/and immobilized on acellular surfaces active molecules, etc., are critical for tumor outcome and require thorough investigation (1).
TGFβ contributes to normal organogenesis and tissue homeostasis and, importantly, plays a crucial role in cancer progression by regulation of different aspects of tumor behavior (1–3). Pleiotropic functions of TGFβ both as a tumor suppressor and a tumor promoter are well-known, and are continue to be examined extensively by many researchers. In tumor microenvironment, TGFβ regulates functioning of both parenchyma and stroma (1,2,4). The effects of TGFβ include regulation of numerous ECM-related genes - collagen type I (Col1), collagen type III (Col3), fibronectin, as well as matrix modifying enzymes such as matrix metalloproteinases type 2 (MMP2), MMP9, and lysyl oxidase homologue 4 (LOXL4) (2), suggesting an essential role of TGFβ in behavior of cancer associated fibroblasts (CAFs). CAFs directly and indirectly regulate tumor cells phenotype, their proliferation, invasiveness and metastatic abilities. Generally, CAFs regulate tumor progression by directing production and remodeling of ECM structures, angiogenesis, and secretion of wide specter of cytokines (4–6). TGFβ impact on tumor infiltrating immune cells has become recognized in recent years. TGFβ regulates the recruitment, motility, activation and function of immune cells. It drives polarization of M2 macrophages and N2 neutrophils, inhibits NK cell maturation, and promotes Treg differentiation that can alter immune system net effect from anti- to pro-tumorigenic (7,8).
On the other hand, inadequate TGFβ signaling in different cells of tumor microenvironment can also be detrimental. For instance, at the late phase of tumor development, the loss of TGFβ signaling in carcinoma cells changes their behavior to more aggressive (9). Fang et al. have shown that lack of TGFβ signaling in fibroblasts leads to increased tumor weight and number of metastasis (10). In contrast to carcinoma cells and fibroblasts, the loss of TGFβ signaling in myeloid cells correlates with better outcome (11). Recently, our group demonstrated that TGFβ signaling in myeloid cells regulates expression of CD73 ecto-enzyme, which is in pair with CD39 is responsible for extracellular ATP breakdown to adenosine. Adenosine, known promoting agent in tumor microenvironment, is directly affects behavior of neoplastic cells, and participates in formation of the immunosuppressive niche and angiogenesis (3). Adenosine works through G-protein-coupled receptors A1, A2A, A2B, and A3. These receptors have different affinity to adenosine, conveying signal via different downstream pathways, and their expression and effects are vary and depend on cell type and environment (12,13). Building on the seminal discoveries by Sitkovsky group, who were first to provide the genetic and pharmacological in vivo evidence for non-redundant functioning of extracellular adenosine - A2 receptors - cAMP axis in regulation of inflammation and tumor protection (14,15), a conceptually new field of anti-cancer therapy by targeting the hypoxia-extracellular adenosine-A2AR/A2BR signaling pathways has been developed, leading to current promising clinical trials (16).
Mechanisms of changes in TGFβ signaling during tumor progression on tumor or stromal cells may be diverse and include mutations that lead to the absence of key proteins of TGFβ pathway, insufficient downstream signaling, or downregulation by another signaling pathway. Here we demonstrate how TGFβ signaling on a single cell type can shape net response of tumor microenvironment and contribute to cancer outcome. Specifically, we show that TGFβ signaling in myeloid cells affects tumorigenic properties of CAFs that participate in tissue architectural rearrangements associated with adverse outcome. Using single cell image analysis, we tested our hypothesis that CD73+ myeloid cells via adenosine production and activation of adenosine receptors regulate CAF’s response to TGFβ. Following analysis of human METABRIC data sets and outcome of breast cancer patients shows that A2B adenosine receptors can play an important role in this process.
Materials and methods
Transgenic mice.
Experiments were performed on MMTV-PyMT/TGFβRIIfloxed and MMTV-PyMT/TGFβRIILysM-KO mice (FVB background) established and maintained as described (3,17). To generate MMTV-PyMT/TGFβRIILysM-KO mice, we first crossed LysM-Cre mice (FVB background, kindly provided by Timothy Blackwell, Vanderbilt University Medical Center, Nashville, TN, USA) with MMTV-PyMT mice and then MMTV-PyMT/TGFβRIIfloxed mice with MMTV-PyMT/LysM-Cre mice. The studies were approved by IACUC at Vanderbilt University Medical Center.
Cell line.
Immortalized mouse tumor mammary fibroblasts were generated in Dr. Harold Moses laboratory (Vanderbilt University), used in previous publications (18–20), and gifted to us. Fibroblasts were growing in T-75 flasks (Fisher scientific, USA) in DMEM medium (Gibco, USA) supplemented with 10% FBS and 1% Antibiotic-antimycotic (Gibco, USA). Cell lines were not authenticated. Cells were Mycoplasma-free, tested using LookOut Mycoplasma PCR Detection Kit (Sigma), and used within 20 passages of thawing. For Western blotting assay, fibroblasts were transferred to 10cm cell culture dishes (Corning, USA). When cells achieved 90–95% confluency, they were treated with TGFβ, 1 ng/ml (R&D System, USA) and NECA (5′-N-Ethylcarboxamido adenosine, Sigma-Aldrich, USA).
Histology.
Tumor tissue samples were fixed in 10% neutral buffered formalin for 12–24 hours at room temperature. Fixed samples were embedded in paraffin blocks, and 5 μm sections were cut. H&E and all IHC staining procedures were performed by TPSR core at Vanderbilt University Medical Center. H&E staining was used for routine morphological analysis. To study ECM elements, we performed Picrosirius red staining and IHC staining for laminin (DAKO), fibronectin (Abcam) and elastin (Abcam). Macrophages, neutrophils, endothelial cells, and proliferating cells were detected using anti-F4/80 (Novus Biologicals LLC), anti-Ly6G (Abcam), anti-CD31 (Dianova), and anti-Ki67 (Cell Signaling Technology) antibodies, respectively. Fluorescent staining was performed with anti-aSMA (Abcam) with secondary anti-mouse Alexa Flour 488, pSMAD3 (Abcam) with secondary anti-rabbit-Biotin and Streptaviden Alexa Flour 647, F4/80 (Novus Biologicals LLC) with anti-rat Alexa Flour 750, CD73 (R&D System) with anti-sheep Alexa Flour 568. Pictures were taken on Keyence BZ-X710. Whole image scanning was performed on Apiro Versa 200 (Leica).
Western blotting.
Tissue protein extracts were analyzed by western blotting for total SMAD2/3, pSMAD3, and collagen type I. Running conditions: NuPAGE 4–12% Bis-Tris gel (Invitrogen, USA), 100V, 2hr for total SMAD2/3 and pSMAD3, or handmade 6% acrylamide gel (Bio-Rad recommendations), 100V, 5hr for collagen I. Transferring conditions: iBlot nitrocellulose gel transfer stacks (Invitrogen, USA) for total SMAD2/3 and pSMAD3, or 0,45 um nitrocellulose membrane, 20V, overnight for collagen. Blocking conditions: Tris-buffered saline (Corning, USA), 2,5% milk (Bio-Rad, USA), 0,05% Tween 20 (Sigma-Aldrich, USA), 1hr. Primary antibodies: anti-total SMAD2/3 rabbit antibodies (Abcam), anti-pSMAD3 rabbit antibodies (Abcam, USA) and anti-collagen I rabbit antibodies (Abcam, USA), overnight, 4°C. GAPDH was used as a housekeeping control. Secondary antibodies: anti-rabbit and anti-mouse antibodies HRP-conjugated, 2hr (Promega, USA).
Protein extraction.
For collagen detection by Western blotting, samples of tumor tissue were homogenized by pestle in RIPA protein lysis buffer and then treated by sonicater W-225 (Heat-ultrasonic systems, USA), at pulse regime, 40% of pulse duty for 10 sec. and 40% from maximum power. After sonication, samples were incubated with DNAse for 5 min, 25°C.
ELISA analysis.
ELISA was performed using DuoSet kit (R&D systems, USA) following the manufacturer’s protocol
RNA extraction and gene expression analysis.
RNA extraction was performed from previously frozen tissues following manufacturer’s instructions (Qiagen, Germany). Analysis of gene expression was performed by Nanostring technique with PanCancer Pathways panel (Nanostring, Seattle, WA). This panel shows the functional state of basic cancer pathways such as cell cycle and apoptosis, RAS, PI3K, STAT, MAPK, TGFβ, Hedgehog, Wnt, Notch, Chromatin modification, transcriptional regulation, and DNA damage control. 12 samples (6 control and 6 experimental) were used for NanoString analysis and gene expression quantification was made using the Nanostring nCounter platform (Nanostring Technologies, Seattle, WA, USA).
Gel contraction assay.
Immortalized mouse mammary fibroblasts and CD11b+ cells, extracted from mouse bone marrow, were embedded in collagen gel. The collagen gel was prepared from rat-tail collagen type I (Corning, USA), USA), 10 × Dulbecco’s Modified Eagle Medium (DMED, Gibco), 10 x NaHCO3, and sterile ddH2O. Concentration of rat tail collagen type I in the gel mixture was 3 mg/ml. Cells/gel mixture was placed in 24 well plates for 48 hr. TGFβ was added at concentration of 1 ng/ml after 48 hr incubation and collagen gel plaques were detached from well’s bottom for succeed contraction.
Image analysis.
ECM analysis:
ECM reach regions were imaged using picrosirius red staining in IF field in Texas red filter, with 20x objective. Analysis of ECM fibers was performed using CurveAlign (http://loci.wisc.edu/software/curvealign) and CtFIRE (http://loci.wisc.edu/software/ctfire) software packages.
Area-based analysis:
For images quantification, ImageJ v.1.51k was used (ImageJ, USA). To measure area that was occupied by different stages of cancer progression, free hand selection tool was used. To quantify number of IHC and picrosirius red positive pixels, 10 regions of interest (ROI) were taken. Threshold options demonstrated maximum pixels of interest and simultaneously minimum of background pixels. Results are presented as a percentage of positive area.
Single cell analysis:
To perform single cell analysis of multiplexed fluorescent stained images, image analysis pipeline was built on KNIME (Knime.com) platform (Knime 3.6 with integrated image processing and analysis extension v. 1.7.0.201906270525). DAPI-stained images were used to generate pixel classification model in Ilastik (https://www.ilastik.org) followed by integrated from ImageJ watershed algorithm for nuclear segmentation. Cell regions of interest (ROI) were generated by circular outgrow of nuclear masks. Single cell features were extracted by aligning nuclear or cell ROI’s masks to specific fluorescent stain images. Geometrical, statistical, and texture features were extracted for each segmented cell. For cell classifications, training set of positive and negative cells was annotated, and together with appended features, was fed into machine learning. Generated by artificial intelligence model was applied to whole data set, and binary probability of cell class was calculated for each cell. Investigator-defined probability cutoff determined a cell classification for “fibroblast” (a-sma probability > 0.6), “macrophage” (F4/80 probability >0.6). To quantify number of myeloid cell with CD73 expression, signal intensities, normalized to DAPI intensity (sums fluorescent signals), were graphed, and gates of cells with high F4–80/ high CD73 were made in a manner similar to FACS analysis and considered double positive cells. Total cell number and specific class cell number per image was quantified and percent calculations were made. For pSmad3 signal quantification fibroblast (aSMA+) data were filtered and grouped per image (per mouse) followed by extraction of median fluorescent intensity of pSmad3.
Statistical analysis.
Results were presented as mean ± SEM. Multiple comparisons between groups were performed using one-way ANOVA followed by Dunnett’s procedure for multiplicity adjustment. Two-group comparison was performed using two-sample t tests or Wilcoxon Rank-Sum test as appropriate. The gene expression was normalized across all arrays. Gene symbols were assigned using the manufacturer-provided annotation, but the analysis was performed at probe level. Correlation analyses for the gene expressions between the signatures of interest were performed using data representing 562 patients (white, 35–70 y.o.) from METABRIC and up to 151 (female, white, 35–70 y.o., not Hispanic or Latino; varies by cancer type; S. Fig. 1) patients from TCGA. The association between RFS and A2b was analyzed using the univariable Cox proportional hazard regression model. When a subtype-gene expression interaction was present, stratified Kaplan-Meier survival curves were created to compare “high versus low” of the A2b and A2a gene expression for each subtype. All tests were statistically significant at two-sided 5% level. All analyses were conducted using GraphPad Prism 8.0 Software (GraphPad Prism, San Diego, CA, USA) or R version 3.6.0
Results
TGFβ signaling in myeloid cells regulates tumor development
Previously, we have generated mice with spontaneous tumor formation of mammary gland (MMTV-PyMT) without TGFβ receptor II on myeloid cells (LysM-Cre) PyMT/TGFβRIILysM. We have reported these mice have decreased tumor growth and, notably, the number of lung metastases (3). Because changes in extracellular matrix (ECM) are essential in metastasis (21,22) we decided to evaluate a morphology of tumor tissue, isolated from PyMT/TGFβRIILysM (experimental) and PyMT/TGFβRIIWT (control) animals to determine a mechanism by which TGFβ in myeloid cells contribute to metastasis.
Tumor tissues were isolated on 4th week after tumor had been first palpated (6–7 weeks of age), as described earlier (3). In the beginning of tumor formation, MMTV-PyMT model shows well-differentiated luminal adenoma, that usually present in the main collective duct, which then progress to the poor-differentiated adenocarcinoma (Fig. 1A). After formation of primary tumor around main collective duct, additional foci of cancer formation occur in peripheral ducts (23), thus allowing us to observe several stages of tumor development. Therefore, we separated the areas correspondent to different stages of tumor progression and performed histological and IHC analysis of these areas. As seen in Fig. 1A, two different areas can be distinguished in tumor tissue: early carcinoma (EC) and late carcinoma (LC). The EC was represented by ducts covered by 3–4 layers of tumor cells and ducts completely filled by tumor cells. Neoplastic cells in those regions have high level of differentiation and demonstrate secretory function. The structure of LC regions was represented by high amounts of tumor cells with high grade of nuclear pleomorphism, high levels of mitosis in the absence of duct structures. Connective tissue was presented by solitary fibers and formed disorganized web. We found that tumors isolated from PyMT/TGFβRIIWT mice have increased LC areas in comparison to tumors from PyMT/TGFβRIILysM mice (Fig. 1A).
Figure 1. Distinct histopathology of tumors with deleted TGFβ signaling in myeloid cells.
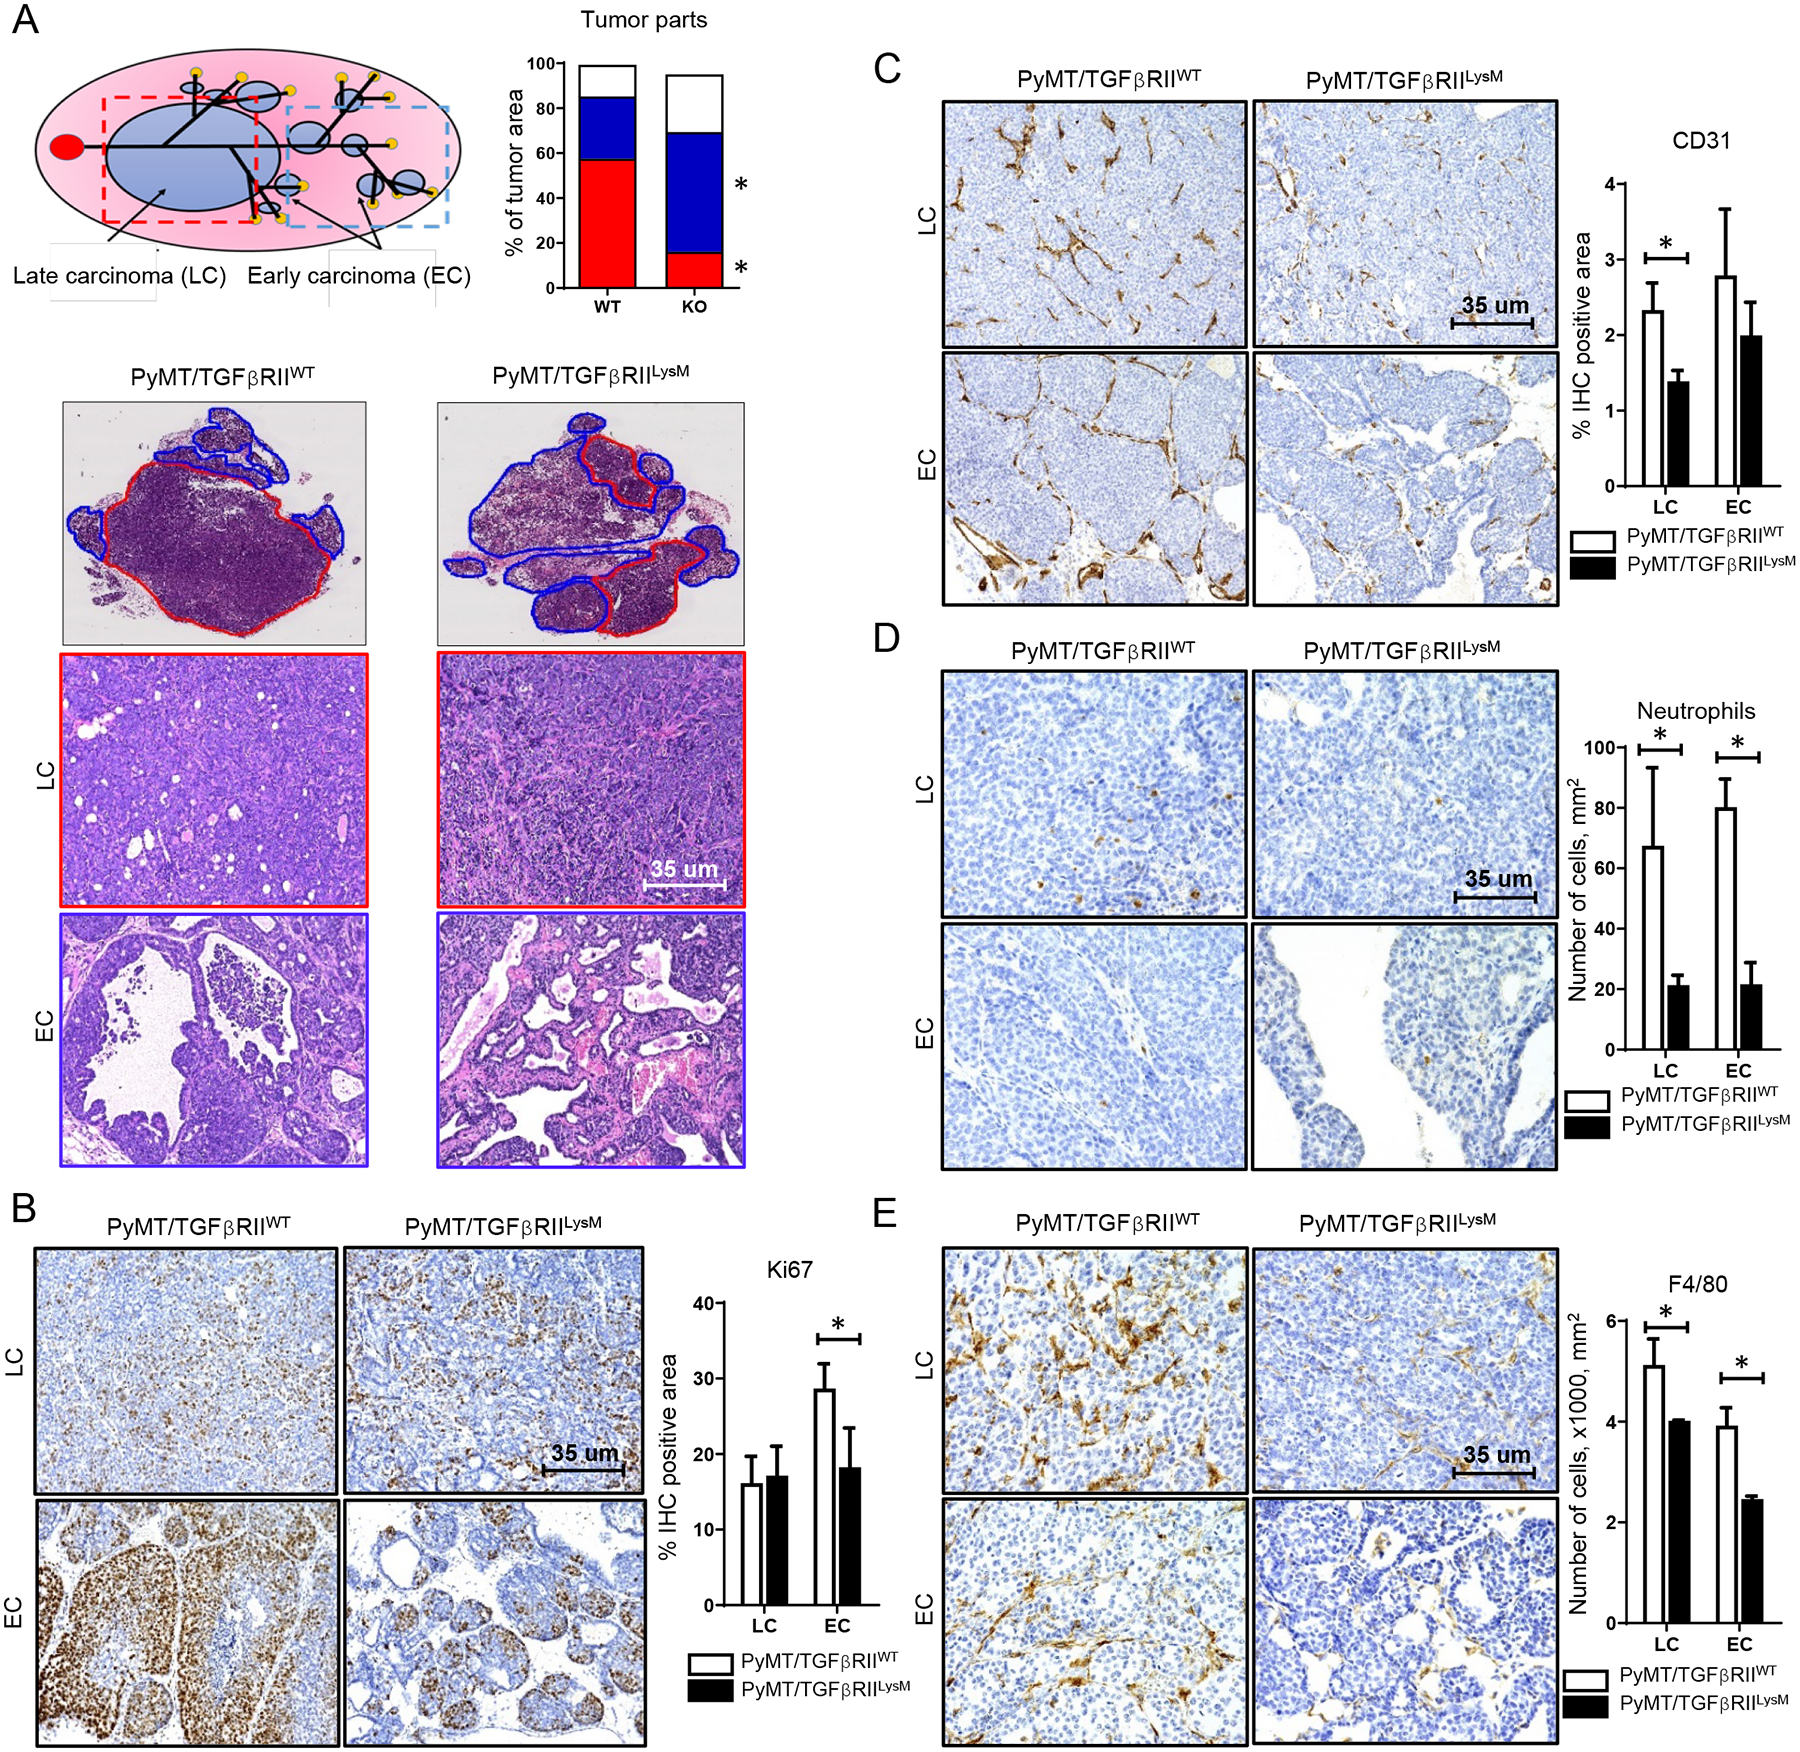
A. Scheme of tumor development in MMTV-PyMT mouse model. Localization of late carcinoma (LC, red outline) and early carcinoma (EC, blue outline) areas in tumor tissue from PyMT/TGFβRIILysM and PyMT/TGFβRIIWT mice, H&E staining. Graph shows percentage of tumor tissue that was occupied by LC, EC and other tissue (connective tissue, fat pad), * - < 0.05. IHC staining and quantification for Ki67 (B), CD31 (C), Neutrophils (D) and F4/80 (E) in tumors isolated from PyMT/TGFβRIILysM and PyMT/TGFβRIIWT mice, * - <0.05.
To detect proliferation rate, we performed Ki67 IHC staining. In EC areas, Ki67+ cells are mostly located in peripheral regions of ducts and usually form groups of different sizes. In LC regions, Ki67+ cells are located mostly separately and rarely form large groups. We found that number of Ki67+ cells in EC areas from PyMT/TGFβRIILySM tumors is decreased compared to corresponding areas from PyMT/TGFβRIIWT tumors (Fig. 1B).
Blood vessels in tumors are generally localized in connective tissue strands. Using CD31 staining, we observed an increased number of blood vessels in EC regions, with no difference between PyMT/TGFβRIIWT and PyMT/TGFβRIILysM animals. In LC areas, a higher density of blood vessels was observed in tumors of PyMT/TGFβRIIWT animals compared to corresponding areas from PyMT/TGFβRIILySM tumors (Fig. 1C).
Myeloid cells were localized primarily in connective tissue strands of EC and LC regions, especially near blood vessels. Also, a small number of macrophages and neutrophils were localized between neoplastic cells and in the necrosis regions. We detected that PyMT/TGFβRIILysM tumors have lower numbers of neutrophils (Gr1+), especially in EC regions, compared to PyMT/TGFβRIIWT tumors (Fig. 1D). Similarly, to neutrophils, F4/80+ were localized in connective tissue strands. We also found a decrease in number of macrophages in both EC and LC areas of tumors isolated from PyMT/TGFβRIILysM mice compared to corresponding areas from PyMT/TGFβRIIWT tumors (Fig. 1E).
To elucidate how the lack of TGFβ signaling in myeloid cells changes behavior of tumor microenvironment, we used Nanostring technologies (CancerPath panel). Hierarchical clustering analysis showed 2 clusters that were consisted of WT and KO samples mixed together (Fig. 2A). This suggests that the lack of TGFβ signaling in myeloid cells does not significantly change gene expression profile of tumors. Some of the genes that have demonstrated change in expression are related to PI3K and Wnt signaling pathways (Fig. 2B–D). This observation of the lack of significant changes in the expression of cancer-related genes discordant to differences in tumor growth rate directed us test the hypothesis that changes in structure and functions of ECM associated with TGFβ signaling in myeloid cells could be a key contributors to observed tumor phenotype.
Figure 2. Nanostring cancer-related pathway analysis.
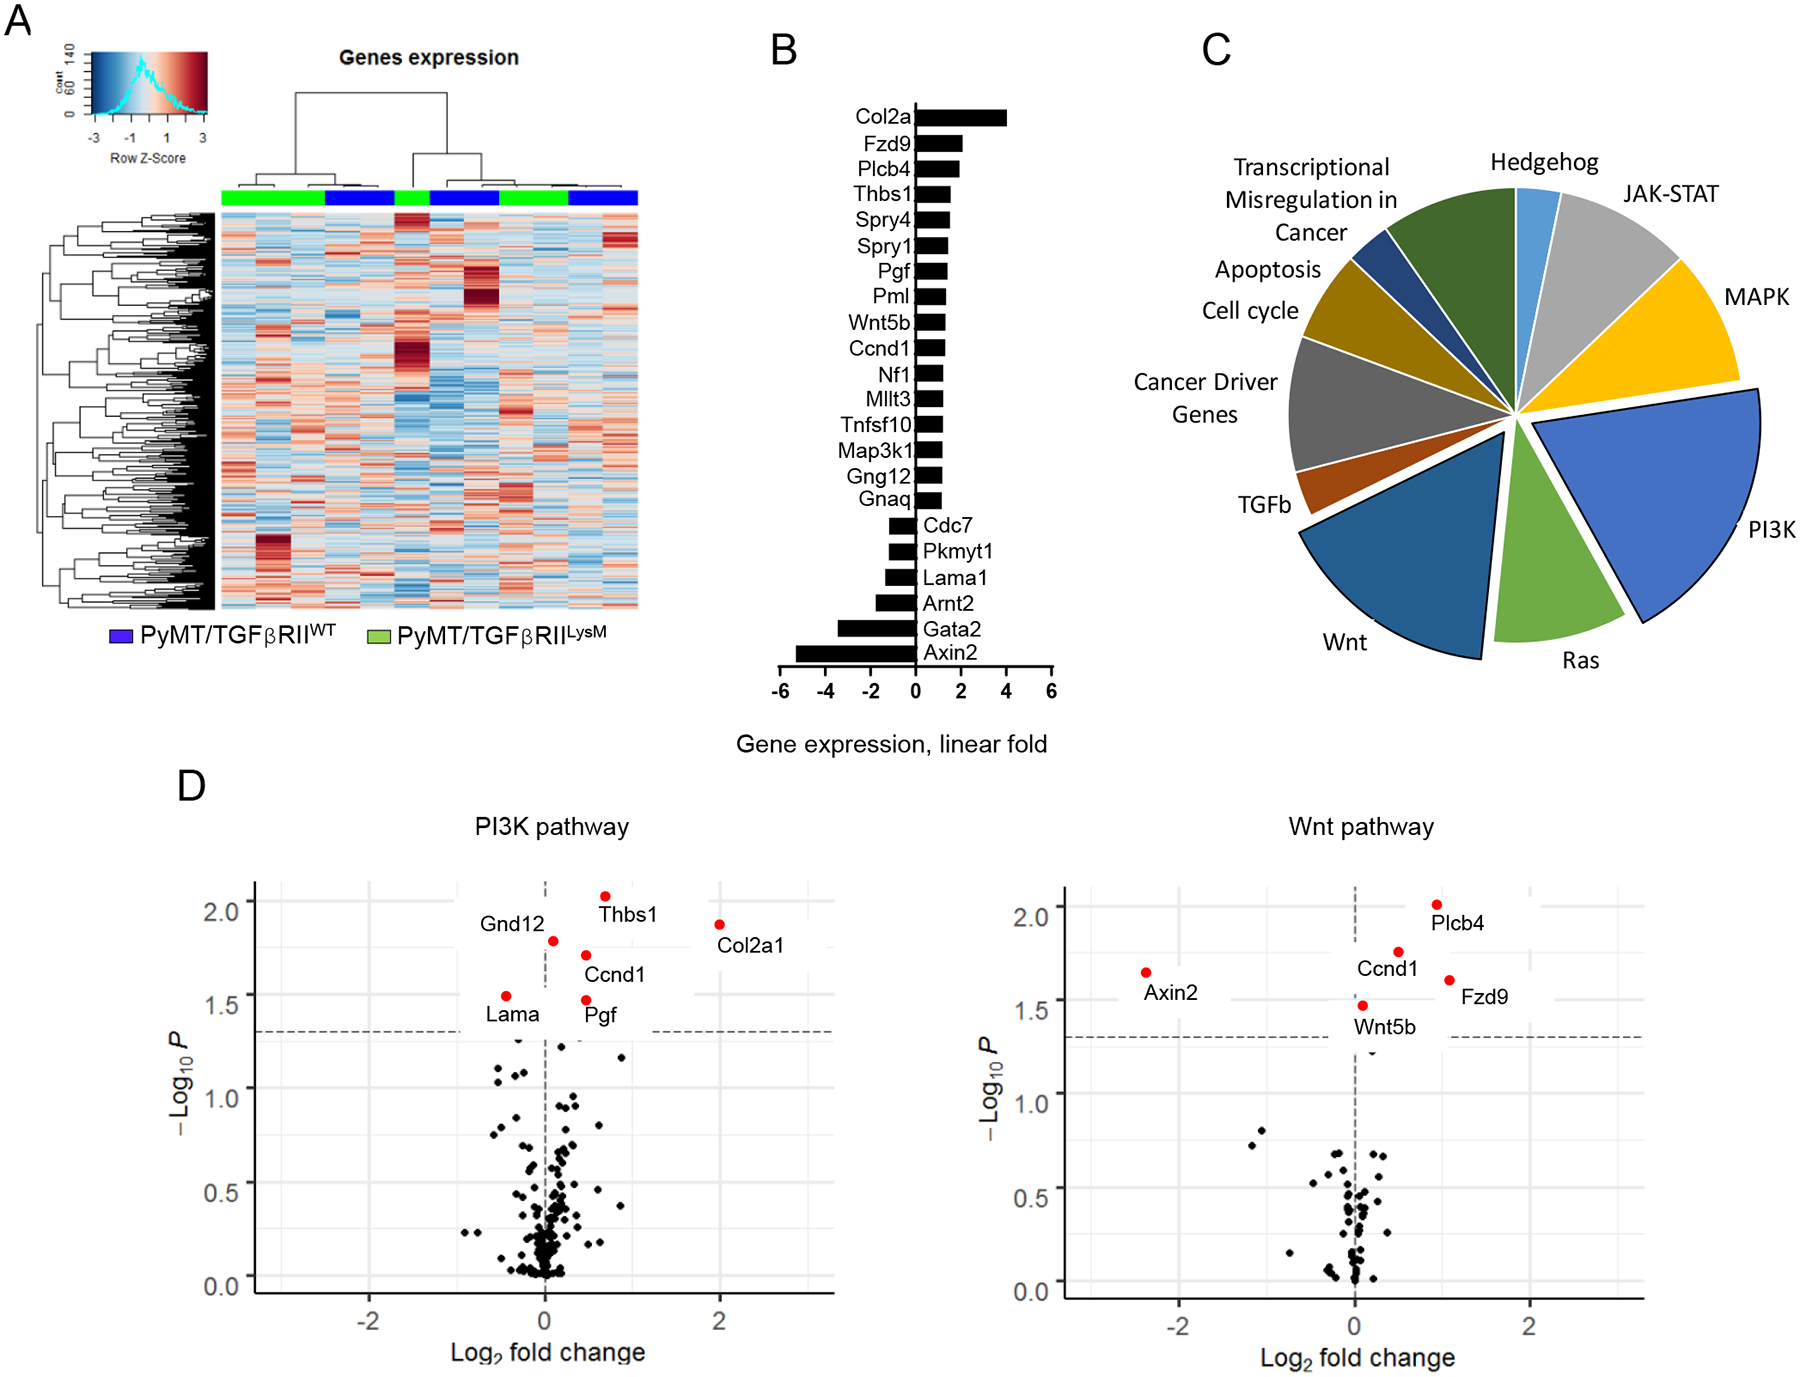
A. Heatmap and cluster analysis of cancer-related gene expression in tumor tissue, B. Fold change of most affected cancer-related genes, C. Pie plot showing number of significantly changed genes related to analyzed pathways by Nanostring, D. Vulcano plots demonstrate expression of genes in most changed pathways - PI3K and Wnt pathways.
TGFβ signaling in myeloid cells regulates ECM deposition in tumor tissue
To make detailed analysis of ECM, we used Picrosirius Red staining (PRS). Recently, it has been shown to be more informative in analysis of collagen deposition in tissue, than the second harmonic generation (SHG) (24). We found, that in LC area of tumor tissue, collagen formed fibers of variable length and width, and these fibers had different direction forming a web-like structure. In EC areas, collagen fibers surround ducts and often forms wide strands. We detected that tumors from PyMT/TGFβRIILysM mice contained higher amount of collagen deposition by picrosirius red staining especially in EC area compared to corresponding areas of PyMT/TGFβRIIWT tumors. (Fig. 3A). Using polarized light on PRS, we were able to distinguish mature and immature collagen in the tissue. Collagen fibers in all regions of tumors were represented mainly by mature collagen in both types of mice. However, the amount of immature collagen in EC regions was higher in PyMT/TGFβRIILysM tumors compared to control group (Fig. 3A). This is indicative of a more intensive collagen synthesis, secretion and assembly in that area during tumor development. In addition to PRS, we confirmed our finding by immunoblotting analysis, which also revealed an increased amount of collagen in MMTV-PyMT tumors without TGFβRII signaling in myeloid cells compared to control tumors (Fig. 3B).
Figure 3. ECM components in MMTV-PyMT tumors.

A. Picrosirius red staining of MMTV-PyMT tumor tissue in brightfield (top) and polarized light (bottom) of the same area. Frames are showing red/orange fibers (*) as mature and yellow/green fibers as immature collagen (o). Graphs show percentage of picrosirius red positive area in bright field as total collagen (left plot) and in polarized light as mature (center plot) and immature collagen (right plot). B. Immunoblotting for Col1 showed more protein in the whole tumor tissue of PyMT/TGFβRIILysM vs. PyMT/TGFβRIIWT mice. Blot is normalized to total protein. C. IHC staining and quantification for Laminin and Fibronectin (D) proteins in tumors of PyMT/TGFβRIILysM and PyMT/TGFβRIIWT mice. * - p < 0.05.
In addition, we analyzed other basic ECM components – laminin, fibronectin, and elastin. Laminin is one of the major components of basal membrane of gland ducts (22). Laminin was represented by threads of variable length, which during tumor progression, became shorter and did not form uninterrupted structure of basal membrane. In some areas, laminin was nearly absent. We found that PyMT/TGFβRIILysM tumors contain more laminin in LC area compared to PyMT/TGFβRIIWT tumors, but found no difference in laminin content in their EC areas (Fig. 3C). Furthermore, we have also observed a reduced amount of fibronectin only in LC regions of PyMT/TGFβRIILysM tumors compared to PyMT/TGFβRIIWT, whereas the presence of fibronectin in EC areas was almost similar in both tumors (Fig. 3D). In contrast, we did not find any elastin-positive fibers in ECM, but some of neoplastic cells contained elastin-positive structures in cytoplasm. However, there was no difference visually between PyMT/TGFβRIIWT and PyMT/TGFβRIILysM tumors.
CD73+ myeloid cells regulate TGFβ signaling in fibroblasts
TGFβ is a major regulator of collagen secretion by fibroblasts (25). Since we have detected an increased collagen amount in tumor tissue of PyMT/TGFβRIILysM mice, we next determined if TGFβ signaling is affected in tumor tissue of these mice. Whole tumor tissue homogenates demonstrated higher phosphorylation of SMAD2/3 in PyMT/TGFβRIILysM versus control animals, despite the fact that these mice are lacking TGFβ signaling in myeloid cells. (Fig. 4A). Next, we measured concentration of total and active TGFβ protein by ELISA and found no difference between experimental mice and control group (Fig. 4B). Further, we analyzed TGFβ signaling in isolated cell populations focusing specifically on fibroblasts, the cells that primarily secrete collagen. For this purpose, we used multiplex immunofluorescent staining for pSMAD3, aSMA, F4/80, and CD73 to detect activity of TGFβ signaling (pSMAD3), distinguish activated fibroblasts (aSMA+) and myeloid cells (F4/80). Importantly, we included CD73 stain in antibody panel to confirm previously published flow cytometry data that CD73 is decreased in myeloid cells with deletion of TGFβ signaling (3). Visually, we observed that tumor and stromal cells located in close proximity to F4/80 positive cells had reduced pSMAD3 signal (Fig. 4C). To extract quantitative data to support this observation we performed single cell analysis of multicolor stained slides. For this, we built an image analysis pipeline utilizing KNIME analytical platform. First, using DAPI stained nuclei (Fig.4D, first panel), we generated nuclear segmentation (Fig.4D, second panel). Next, generated cell masks were applied to single channel images (stained for F4/80, aSMA, CD73 and pSmad3) to extract cell features. In parallel, supervised machine learning was conducted on single channel images. For this, training set was annotated with positive and negative cell examples. These annotations were combined with extracted cell features to generate model for quantification of cell class probabilities. Cell phenotyping was achieved using binary probabilities (positive/negative) for aSMA (activated fibroblast) and F4/80 (macrophage) (Fig. 4D, third panel). We have confirmed our previous finding (3) that cells with deleted TGFβRII have downregulated CD73 by showing that numbers of CD73+F4/80+myeloid cells are decreased in tumor tissue of PyMT/TGFβRIILysM mice compared to control (Fig. 4E). In addition, we found that tumor tissue of PyMT/TGFβRIILysM mice contain more fibroblasts (aSMA+F4/80−) with higher median fluorescence for pSMAD3 compared to control (Fig. 4F). These data consistent with a hypothesis that CD73+ myeloid cells can negatively regulate TGFβ effects on tumor-associated fibroblasts. (Fig. 4G).
Figure 4. Adenosine/TGFβ axis in tumor tissue.
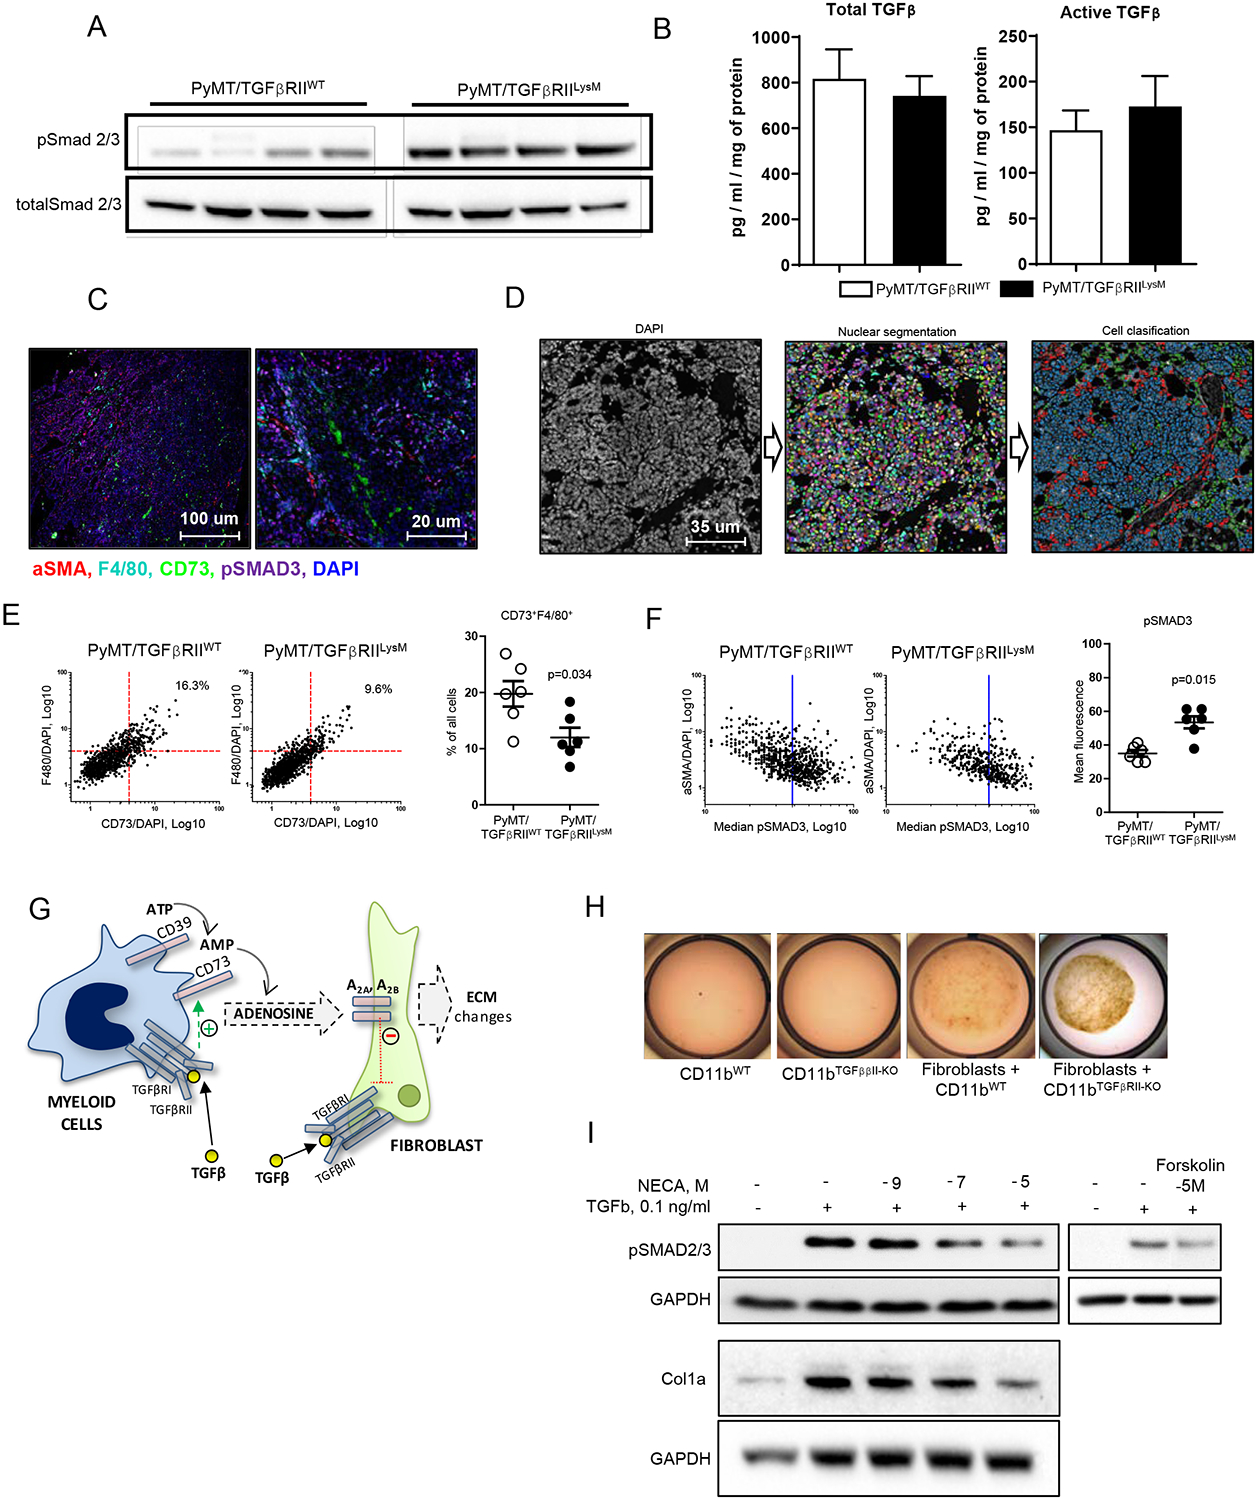
A. Immunoblotting of pSMAD2/3 of whole tumor tissue protein lysates detected an increased phosphorylation in PyMT/TGFβRIILysM tumors vs. PyMT/TGFβRIIWT (top panel). Loading control: total SMAD2/3 (bottom panel). B. ELISA for total and active TGFβ protein in whole tumor tissue extracts from PyMT/TGFβRIILysM and PyMT/TGFβRIIWT mice. C. Representative images of multiplex immunofluorescent staining for aSMA (red), F4/80 (turquoise), pSMAD3 (magenta), CD73 (green) and DAPI (blue), 10x (left) and 40x (right). D. Image analysis workflow. DAPI-stained images (first panel) were used for single cell segmentation (second panel, random colors). Supervised machine learning was conducted on IF-stained images (as shown on C) overlaid with single cell masks. Cell phenotyping was achieved using binary probabilities derived from artificial intelligence-generated models for each cell marker (third panel, red - fibroblasts, green - macrophages, blue - all other cells). E. Log plots of CD73 and F4/80 fluorescent signals normalized to DAPI (Sum signal [target]/Sum signal [Dapi]), as detected on all cells from WT (left) or KO mice (right). Number of cells with high F4/80 and CD73 fluorescent signals were calculated and expressed as a percentage of total number of cells per image (upper right corner). Representative plot is shown. Quantification of F4/80/CD73 double positive cells. F. pSmad3 fluorescent signal on gated fibroblasts (aSMA+/f4/80- cells). Representative plot with Median of signal intensity in WT (left) and KO (right) is shown. Quantification of pSmad3 in fibroblasts from WT and KO images. G. Schematic outline of a hypothesis where interplay of CD73+ myeloid cell (blue), generating adenosine, and TGFβ signaling on fibroblast (green) is demonstrated. H. Gel contraction assay. CD11b cells were differentiated from bone marrow in the presence of M-CSF for 5 days and mixed with fibroblasts in a ratio 3:1. I. Immunoblotting for pSMAD2/3 and Col1 of proteins isolated from fibroblasts cultured with TGFβ, NECA and Forskolin.
To test this hypothesis, we performed a gel contraction assay by mixing mouse mammary tumor fibroblasts with myeloid cells into gel and after 24h set time stimulated them with TGFβ (Fig. 4H). We found that fibroblasts’ response to TGFβ was decreased when they were mixed with WT myeloid cells vs. myeloid cells with deleted TGFβRII. CD73+ myeloid cells provide a vast supply of adenosine in tumor tissue and (3). We have also demonstrated that CD73, expressed on myeloid cells is upregulated by TGFβ signaling. To determine if adenosine can be associated with observed decrease of TGFβ signaling on fibroblasts, we treated mouse mammary tumor fibroblasts with TGFβ and NECA (a stable analog of adenosine). We found a significant downregulation of TGFβ-stimulated phosphorylation of SMAD2/3 and collagen accumulation (Fig. 4I). Incubation cells with adenylate cyclase activator Forskolin recapitulated this effect of adenosine, demonstrating a link between an adenosine A2 receptor-mediated signaling and a TGFβ signaling pathways. These data suggest that adenosine, generated by CD73+ myeloid cells infiltrating tumor tissue may downregulate TGFβ effects on tumor-associated fibroblasts via activation of adenylate cyclase- driven adenosine receptors (A2 type). These myeloid cell interactions with fibroblasts resulting in downregulation of TGFβ on latter could be associated with pro-tumorigenic properties of CAF and represent a promising pharmacological target.
Association of adenosine receptors and ECM components with outcome of cancer patients.
To gain insight adenosine signaling in human breast cancers we have used open source METABRIC data sets to assess the association between the expressions of adenosinergic related genes (CD73, A2aR and A2bR) and ECM related genes. Analysis of METABRIC data showed that high expression of ADORA2B (low affinity A2b adenosine receptor) was associated with high expression of NT5E (Fig. 5A). We did not observe an association between ADORA2A (high affinity A2a adenosine receptor) and NT5E (CD73). In addition, we found that high expression of ADORA2B, but not ADORA2A, was associated with the lower expression of main ECM genes - COL1A1, COL1A2, COL11A1 (Fig. 5B). This finding demonstrates similar to animal model pattern: increased adenosine signaling in conjunction to downregulated TGFβ signaling. Using TCGA data, we found that only patients with head and neck squamous adenocarcinoma have changes close to patients with breast cancer (S. Fig. 1). Stratifying breast cancer patients by stage and number of positive lymph nodes, we found that most significant changes appear in patients with Stage I cancer or with 1–3 positive lymph nodes (S. Fig. 2).
Figure 5. Adenosine receptors in breast cancer patients.
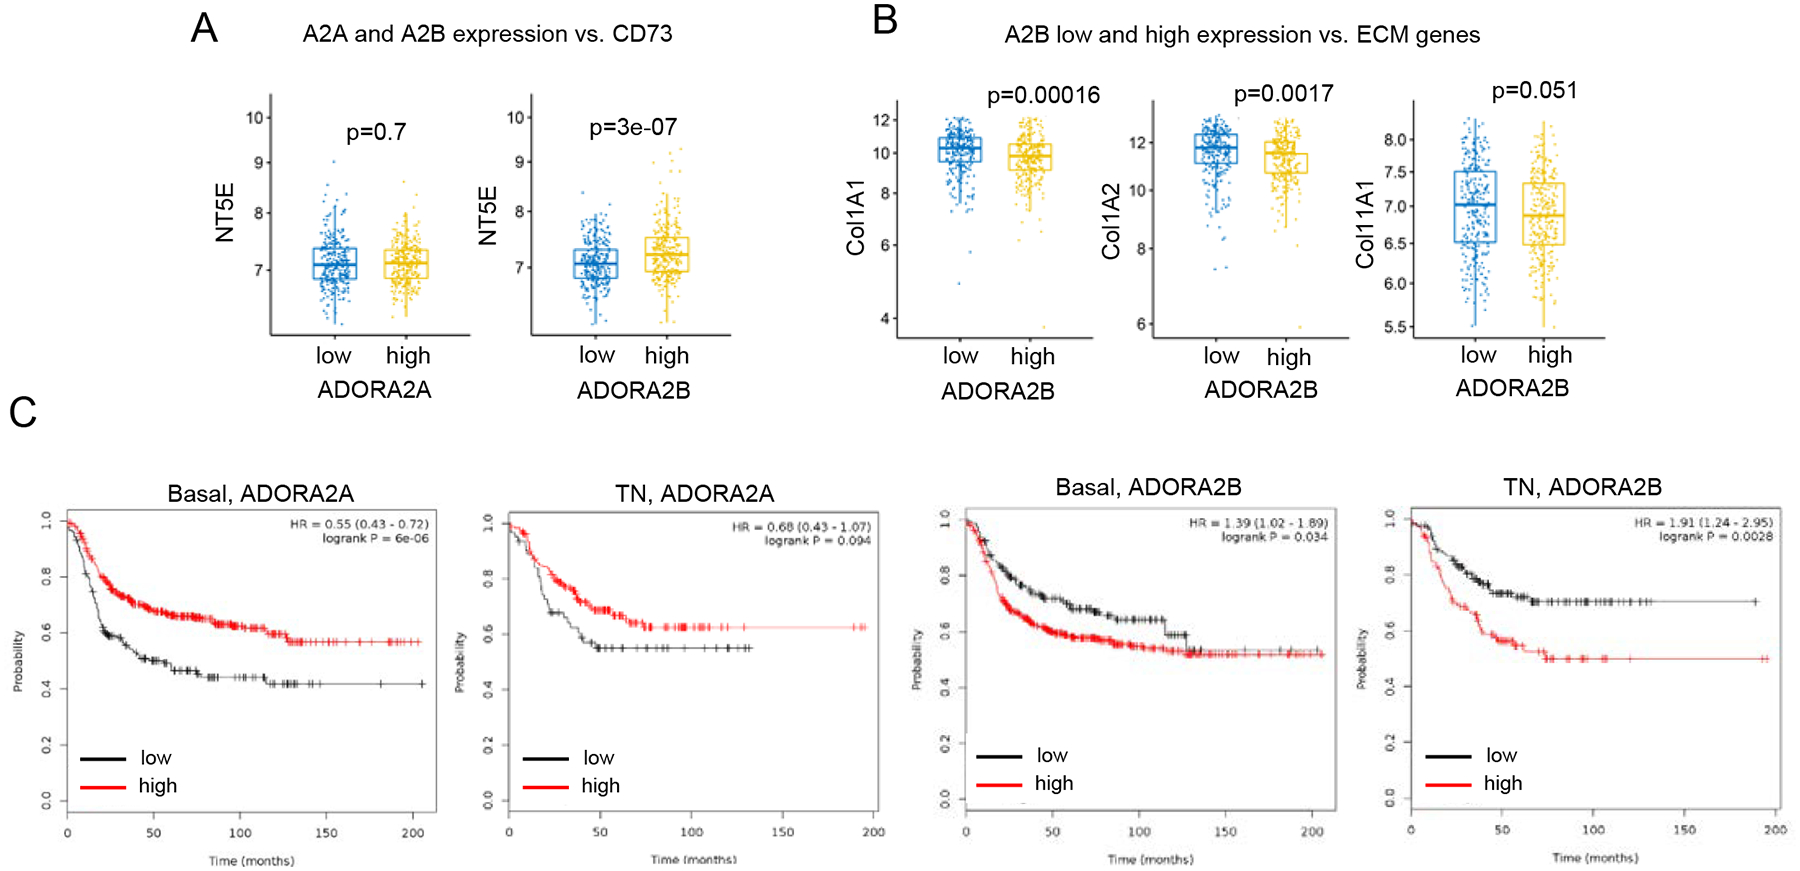
A. Correlations between the expression of A2a (ADORA2A) and A2b (ADORA2B) adenosine receptors with CD73 (NT5E) using NETABRIC database. B. Correlations between the expressions of A2b (ADORA2B) adenosine receptors and ECM-related genes in breast cancer patients using METABRIC database. C. KM survival plots of breast cancer patients in relation to the expressions of A2a and A2b adenosine receptors.
Analysis of survival of breast cancer patients (http://kmplot.com) showed that the high expression of ADORA2B was associated with shorter survival for basal type and triple negative type of breast cancer only. Importantly, ADORA2A correlative data is contrasting ADORA2B data in these cancer types, demonstrating adverse impact of A2B adenosine receptor in breast cancer that could be mediated through its ability to downregulate TGFβ response (Fig. 5C).
Discussion
In this study, we demonstrated that TGFβ signaling in myeloid cells impacts tumor architecture and malignant potential. In a mouse model of myeloid cell-specific TGFβ receptor II knockout, deletion of TGFβ signaling resulted in significant changes in ECM composition in tumor tissue, i.e., in increased amounts of collagen and laminin and decreased deposition of fibronectin. Given a profound role of TGFβ in regulation of collagen production, we sought to assess its amount and signaling status in tumor tissue. Whereas no difference in total and active TGFβ protein was detected in tumor tissue homogenates from control and PyMT/TGFβRIILySM mice, TGFβ signaling was increased in the latter group. Previously, we have demonstrated that TGFβ signaling in myeloid cells regulates CD73-mediated production of pro-tumorigenic adenosine (3). In the current study, we discovered the next branch of TGFβ tumorigenic mechanism mediated by CD73+ myeloid cells that decrease TGFβ signaling in fibroblasts resulting in formation of a less prominent tumor stroma. We demonstrated, for the first time, that stimulation of adenosine receptors directly disturbs TGFβ effects on cancer-associated fibroblasts resulting in altered fibroblasts functions that may affect tumor progression, invasion, and metastasis. In addition, we performed METABRIC human data analysis that revealed inverse correlation between expression of Col1 and A2B adenosine receptor, whereas A2A receptor expression was not associated with any of ECM genes. Moreover, using survival data of breast cancer patients (http://kmplot.com), we found that patients with basal and triple negative breast cancer, which had also a high level of A2B receptor expression had poor outcome; on contrary, the A2A receptor expression was found to be associated with better outcome in these patients.
TGFβ is a well-known regulator of growth, differentiation, and migration, which are essential for tumor progression. Recently, multidimensionality of its effects became to be recognized with the realization that TGFβ exhibits actions on all cells within tumor microenvironment resulting in a complex net outcome. This outcome is dependent on a type and functional status of target cells and availability of partners, such as cytokines and active metabolites of signaling pathways (2). Numerous reports showed that the loss of TGFβ signaling in cancer associated fibroblasts correlates with poor prognosis (10,26), the same hold truth for the loss of its signaling in tumor cells (27–29). Our recent studies showed that the loss of TGFβ signaling on myeloid cells, in contrary, reduces tumor growth and metastasis (3). The present study provides insight into mechanism by which TGFβ, acting on myeloid cells, can contribute to cancer progression. Our results, that demonstrate a relative decrease in area occupied by late carcinoma in PyMT/TGFβRIILySM mice, are indicative of reduced rate of tumor progression in these mice, and provide in vivo evidence that TGFβ signaling in myeloid cells promote tumor progression. Finding of enhanced TGFβ signaling in tumor tissue lysates and decreased expression of cancer related genes like PI3K, JAK-STAT, Ras and MAPK in PyMT/TGFβRIILySM mice provides evidence for overall low-grade tumors in these mice.
Matrix composition, amount, physical properties, and tumor cell-ECM interactions are crucial for cancer progression (21,22,30–33). Fibrillar collagen is the most prevalent ECM protein in a body (34), contributing to mechanical properties of normal tissues and tumors (35). While changes occurring in organization and mechanical properties of ECM in breast cancer are reported to correlate with poor outcome (21,36–38), the mechanisms of such changes remain poorly understood. Overall collagen accumulation is considered to be a hallmark of breast cancer progression (39). However, our observation of increased deposition of Collagen 1 in PyMT/TGFβRIILySM mice is challenging this dogma. In contrast, another ECM protein, fibronectin, was significantly decreased in late carcinoma regions of PyMT/TGFβRIILySM tumors, compared to corresponding regions of PyMT/TGFβRIIWT tumors. Fibronectin (FN) has been shown to be produced by both cancer-associated fibroblasts and cancer cells themselves. Generally, FN expression in breast cancer is associated with poor clinical outcome (3,22). Thus, the data presented here suggest that TGFβ signaling in myeloid cells regulates a balance of deposition of main ECM proteins- collagen and fibronectin, both of which are significantly involved to tumor progression.
Fibroblasts are principal cells maintaining ECM integrity in normal and diseased tissues (40). Differences in tumor stroma deposition in a mouse model with deleted TGFβ signaling on myeloid cells, led us to hypothesize that TGFβ signaling in myeloid cells can affect functions of fibroblasts in tumor microenvironment contributing to observed changes.
We have previously demonstrated that TGFβ signaling in myeloid cells regulates the expression of CD73 ectoenzyme on mature myeloid cells (3). Tumor tissue, in comparison to normal tissue, is enriched with extracellular ATP (eATP), released from cells as a part of damage-associated molecular pattern (DAMP) (41). The eATP, in general, exerts anti-tumorigenic and pro-inflammatory effects (42). However, eATP is degraded further by CD39/CD73 enzymatic pair to adenosine (43), a known pro-tumorigenic metabolite (16). As a result, the concentration of adenosine in tumor microenvironment is elevated (44–46). There is strong evidence that adenosine modulates immune response during cancer progression, as well as behavior of neoplastic cells (16). In this study, we demonstrated that the adenosine downregulates TGFβ-induced phosphorylation of SMAD2/3 and collagen synthases on fibroblasts indicating new interplay of adenosinergic and TGFβ signaling on another cell type, cancer-associated fibroblasts. Relatively high concentration of adenosine in tumor tissue can be maintained only with sustained activity of CD39/CD73 enzymatic pair (3). Using gel contraction assay, we detected an increased fibroblast response to TGFβ mixed with cells having downregulated expression of CD73. Therefore, we suggested that myeloid cells having ability to generate adenosine downregulate TGFβ dependent functions of fibroblasts.
It has been demonstrated, that adenosine forms immunosuppressive niche, enhances angiogenesis, and changes neoplastic cells behavior to more aggressive (16). We assume that under healthy condition general biological role of observed phenomenon is to reduce destructing effect related with inflammation. Indeed, Ohta and coauthors observed similar adenosine dependent effects on T cells in melanoma cancer. They suggested mechanism that explain insufficient effects of T cell in tumor microenvironment where hypoxic condition and excessive cells death determine high concentration of adenosine in cancer tissue which through A2A and A2B receptors modulate T cells phenotype to immunosuppressive (14,15,47). In this study, we demonstrated, that stimulation of adenosine receptors directly affects TGFβ actions on cancer-associated fibroblasts, resulting in altered fibroblasts functions that may affect tumor progression, invasion, and metastasis. Adenosine can exert its actions by interacting with A1, A2A, A2B, or A3 subtypes of adenosine receptors of P1 purinergic family. Specific P1 receptor repertoire expressed on variety of cells, including fibroblasts, endothelial cells, immune cells, and tumor cells can be different, creating unique dynamic adenosinergic milieu. Both A2 subtypes of adenosine receptors increase intracellular cAMP by stimulation of adenylate cyclase, whereas A1 and A3 inhibit this enzyme (12,13). Our observation that the adenylate cyclase activator Forskolin, similarly to adenosine, inhibits TGFβ- induced SMAD phosphorylation in fibroblasts suggests the involvement of A2 subtypes of adenosine receptors in adenosine/TGFβ pathways cross talk. To find association between A2 subtypes of adenosine receptors and cancer, we performed METABRIC human data analysis that revealed inverse correlation between expression of Col1 and A2B adenosine receptors, whereas the expression ofA2A receptors was not associated with any of ECM genes. Moreover, using survival data of breast cancer patients (http://kmplot.com), we found that patients with basal and triple negative breast cancer, which had also a high level of A2B receptor expression had poor outcome; on contrary, the A2A receptor expression was found to be associated with better outcome in these patients.
It has been previously demonstrated that an increased expression of CD73 in human breast cancer correlates with poor outcome (44). Our findings that A2A and A2B expression is associated with ECM protein production and regulation of TGFβ signaling revealed a new mechanism, by which adenosine may play a central role in tumor tissue matrix deposition, thus affecting tumor progression. Our data show that the high levels of A2B receptor expression in basal and triple negative types of human breast tumors are associated with lower survival. This may indicate a potential role of A2B adenosine receptors in promoting tumor development via its ability to downregulate TGFβ response in fibroblasts demonstrated in our study.
There is an increased interest in development of pharmacological approach to inhibit adenosine metabolism during tumor progression. In present, anticancer clinical trials investigators mostly concentrate their attention on CD39, CD73 and A2A adenosine receptors (48–50). Our data show that A2B receptors can be also a valuable target in anticancer therapy. The primary strategy of adenosine receptors inhibition in anticancer treatment is blocking of adenosine signaling predominantly in immune cells because it works as immune checkpoint (12,13,44–46,48,51,52). Our new data indicate that adenosine signaling in fibroblasts can play an important role in tumor progression. Our study showed that stimulation of adenosine receptors on fibroblasts can downregulate their TGFβ signaling and polarize them to cells with pro-cancerogenic properties.
In summary, the interaction between myeloid cells and CAFs, demonstrated in our study, provides new insights into processes, which determine pleiotropic functions of TGFβ in tumor development. Better understanding of mechanisms that are critical for tumor microenvironment formation and evolution provides a basis for development of novel therapeutic approaches based on more precise targeting and manipulation of adenosinergic and TGFβ signaling.
Supplementary Material
Acknowledgements
This work was supported by NIH grant R01CA200681 (S.N.).
Footnotes
The authors whose names are listed above have NO conflict of interest to report
References
- 1.Bhat R, Bissell MJ. Of plasticity and specificity: dialectics of the micro- and macro-environment and the organ phenotype. Wiley Interdiscip Rev Membr Transp Signal 2014;3:147–63 [DOI] [PMC free article] [PubMed] [Google Scholar]
- 2.Pickup M, Novitskiy S, Moses HL. The roles of TGFbeta in the tumour microenvironment. Nat Rev Cancer 2013;13:788–99 [DOI] [PMC free article] [PubMed] [Google Scholar]
- 3.Ryzhov SV, Pickup MW, Chytil A, Gorska AE, Zhang Q, Owens P, et al. Role of TGF-beta signaling in generation of CD39+CD73+ myeloid cells in tumors. J Immunol 2014;193:3155–64 [DOI] [PMC free article] [PubMed] [Google Scholar]
- 4.Jolly LA, Novitskiy S, Owens P, Massoll N, Cheng N, Fang W, et al. Fibroblast-Mediated Collagen Remodeling Within the Tumor Microenvironment Facilitates Progression of Thyroid Cancers Driven by BrafV600E and Pten Loss. Cancer Res 2016;76:1804–13 [DOI] [PMC free article] [PubMed] [Google Scholar]
- 5.Joyce JA. Therapeutic targeting of the tumor microenvironment. Cancer Cell 2005;7:513–20 [DOI] [PubMed] [Google Scholar]
- 6.Lu P, Weaver VM, Werb Z. The extracellular matrix: a dynamic niche in cancer progression. J Cell Biol 2012;196:395–406 [DOI] [PMC free article] [PubMed] [Google Scholar]
- 7.Yang L, Pang Y, Moses HL. TGF-beta and immune cells: an important regulatory axis in the tumor microenvironment and progression. Trends Immunol 2010;31:220–7 [DOI] [PMC free article] [PubMed] [Google Scholar]
- 8.Batlle E, Massague J. Transforming Growth Factor-beta Signaling in Immunity and Cancer. Immunity 2019;50:924–40 [DOI] [PMC free article] [PubMed] [Google Scholar]
- 9.Neuzillet C, Tijeras-Raballand A, Cohen R, Cros J, Faivre S, Raymond E, et al. Targeting the TGFbeta pathway for cancer therapy. Pharmacol Ther 2015;147:22–31 [DOI] [PubMed] [Google Scholar]
- 10.Fang WB, Jokar I, Chytil A, Moses HL, Abel T, Cheng N. Loss of one Tgfbr2 allele in fibroblasts promotes metastasis in MMTV: polyoma middle T transgenic and transplant mouse models of mammary tumor progression. Clin Exp Metastasis 2011;28:351–66 [DOI] [PMC free article] [PubMed] [Google Scholar]
- 11.Pang Y, Gara SK, Achyut BR, Li Z, Yan HH, Day CP, et al. TGF-beta signaling in myeloid cells is required for tumor metastasis. Cancer Discov 2013;3:936–51 [DOI] [PMC free article] [PubMed] [Google Scholar]
- 12.Giuliani AL, Sarti AC, Di Virgilio F. Extracellular nucleotides and nucleosides as signalling molecules. Immunol Lett 2019;205:16–24 [DOI] [PubMed] [Google Scholar]
- 13.Liu H, Xia Y. Beneficial and detrimental role of adenosine signaling in diseases and therapy. J Appl Physiol (1985) 2015;119:1173–82 [DOI] [PMC free article] [PubMed] [Google Scholar]
- 14.Ohta A, Gorelik E, Prasad SJ, Ronchese F, Lukashev D, Wong MK, et al. A2A adenosine receptor protects tumors from antitumor T cells. Proc Natl Acad Sci U S A 2006;103:13132–7 [DOI] [PMC free article] [PubMed] [Google Scholar]
- 15.Ohta A, Sitkovsky M. Role of G-protein-coupled adenosine receptors in downregulation of inflammation and protection from tissue damage. Nature 2001;414:916–20 [DOI] [PubMed] [Google Scholar]
- 16.Vigano S, Alatzoglou D, Irving M, Menetrier-Caux C, Caux C, Romero P, et al. Targeting Adenosine in Cancer Immunotherapy to Enhance T-Cell Function. Front Immunol 2019;10:925. [DOI] [PMC free article] [PubMed] [Google Scholar]
- 17.Novitskiy SV, Moses HL. Turn off the IDO: will clinical trials be successful? Cancer Discov 2012;2:673–5 [DOI] [PubMed] [Google Scholar]
- 18.Owens P, Polikowsky H, Pickup MW, Gorska AE, Jovanovic B, Shaw AK, et al. Bone Morphogenetic Proteins stimulate mammary fibroblasts to promote mammary carcinoma cell invasion. PLoS One 2013;8:e67533. [DOI] [PMC free article] [PubMed] [Google Scholar]
- 19.Cheng N, Bhowmick NA, Chytil A, Gorksa AE, Brown KA, Muraoka R, et al. Loss of TGF-beta type II receptor in fibroblasts promotes mammary carcinoma growth and invasion through upregulation of TGF-alpha-, MSP- and HGF-mediated signaling networks. Oncogene 2005;24:5053–68 [DOI] [PMC free article] [PubMed] [Google Scholar]
- 20.Shaw AK, Pickup MW, Chytil A, Aakre M, Owens P, Moses HL, et al. TGFbeta signaling in myeloid cells regulates mammary carcinoma cell invasion through fibroblast interactions. PLoS One 2015;10:e0117908. [DOI] [PMC free article] [PubMed] [Google Scholar]
- 21.Hanley CJ, Noble F, Ward M, Bullock M, Drifka C, Mellone M, et al. A subset of myofibroblastic cancer-associated fibroblasts regulate collagen fiber elongation, which is prognostic in multiple cancers. Oncotarget 2016;7:6159–74 [DOI] [PMC free article] [PubMed] [Google Scholar]
- 22.Insua-Rodriguez J, Oskarsson T. The extracellular matrix in breast cancer. Adv Drug Deliv Rev 2016;97:41–55 [DOI] [PubMed] [Google Scholar]
- 23.Lin EY, Jones JG, Li P, Zhu L, Whitney KD, Muller WJ, et al. Progression to malignancy in the polyoma middle T oncoprotein mouse breast cancer model provides a reliable model for human diseases. Am J Pathol 2003;163:2113–26 [DOI] [PMC free article] [PubMed] [Google Scholar]
- 24.Drifka CR, Loeffler AG, Mathewson K, Mehta G, Keikhosravi A, Liu Y, et al. Comparison of Picrosirius Red Staining With Second Harmonic Generation Imaging for the Quantification of Clinically Relevant Collagen Fiber Features in Histopathology Samples. J Histochem Cytochem 2016;64:519–29 [DOI] [PMC free article] [PubMed] [Google Scholar]
- 25.Papageorgis P, Stylianopoulos T. Role of TGFbeta in regulation of the tumor microenvironment and drug delivery (review). Int J Oncol 2015;46:933–43 [DOI] [PMC free article] [PubMed] [Google Scholar]
- 26.Bhowmick NA, Chytil A, Plieth D, Gorska AE, Dumont N, Shappell S, et al. TGF-beta signaling in fibroblasts modulates the oncogenic potential of adjacent epithelia. Science 2004;303:848–51 [DOI] [PubMed] [Google Scholar]
- 27.Forrester E, Chytil A, Bierie B, Aakre M, Gorska AE, Sharif-Afshar AR, et al. Effect of conditional knockout of the type II TGF-beta receptor gene in mammary epithelia on mammary gland development and polyomavirus middle T antigen induced tumor formation and metastasis. Cancer Res 2005;65:2296–302 [DOI] [PubMed] [Google Scholar]
- 28.Novitskiy SV, Forrester E, Pickup MW, Gorska AE, Chytil A, Aakre M, et al. Attenuated transforming growth factor beta signaling promotes metastasis in a model of HER2 mammary carcinogenesis. Breast Cancer Res 2014;16:425. [DOI] [PMC free article] [PubMed] [Google Scholar]
- 29.Muraoka-Cook RS, Kurokawa H, Koh Y, Forbes JT, Roebuck LR, Barcellos-Hoff MH, et al. Conditional overexpression of active transforming growth factor beta1 in vivo accelerates metastases of transgenic mammary tumors. Cancer Res 2004;64:9002–11 [DOI] [PubMed] [Google Scholar]
- 30.Liotta LA. Tumor invasion and metastases--role of the extracellular matrix: Rhoads Memorial Award lecture. Cancer Res 1986;46:1–7 [PubMed] [Google Scholar]
- 31.Sabeh F, Shimizu-Hirota R, Weiss SJ. Protease-dependent versus -independent cancer cell invasion programs: three-dimensional amoeboid movement revisited. J Cell Biol 2009;185:11–9 [DOI] [PMC free article] [PubMed] [Google Scholar]
- 32.Friedl P, Alexander S. Cancer invasion and the microenvironment: plasticity and reciprocity. Cell 2011;147:992–1009 [DOI] [PubMed] [Google Scholar]
- 33.Friedl P, Wolf K. Tube travel: the role of proteases in individual and collective cancer cell invasion. Cancer Res 2008;68:7247–9 [DOI] [PubMed] [Google Scholar]
- 34.Theocharis AD, Skandalis SS, Gialeli C, Karamanos NK. Extracellular matrix structure. Adv Drug Deliv Rev 2016;97:4–27 [DOI] [PubMed] [Google Scholar]
- 35.Collagen Fretzl P.. Structure and Mechanics. Book, Springer; US: 2008 [Google Scholar]
- 36.Oskarsson T Extracellular matrix components in breast cancer progression and metastasis. Breast 2013;22 Suppl 2:S66–72 [DOI] [PubMed] [Google Scholar]
- 37.Lochter A, Bissell MJ. Involvement of extracellular matrix constituents in breast cancer. Semin Cancer Biol 1995;6:165–73 [DOI] [PubMed] [Google Scholar]
- 38.Egeblad M, Rasch MG, Weaver VM. Dynamic interplay between the collagen scaffold and tumor evolution. Curr Opin Cell Biol 2010;22:697–706 [DOI] [PMC free article] [PubMed] [Google Scholar]
- 39.Xu S, Xu H, Wang W, Li S, Li H, Li T, et al. The role of collagen in cancer: from bench to bedside. J Transl Med 2019;17:309. [DOI] [PMC free article] [PubMed] [Google Scholar]
- 40.Lynch MD, Watt FM. Fibroblast heterogeneity: implications for human disease. J Clin Invest 2018;128:26–35 [DOI] [PMC free article] [PubMed] [Google Scholar]
- 41.Hernandez C, Huebener P, Schwabe RF. Damage-associated molecular patterns in cancer: a double-edged sword. Oncogene 2016;35:5931–41 [DOI] [PMC free article] [PubMed] [Google Scholar]
- 42.Cauwels A, Rogge E, Vandendriessche B, Shiva S, Brouckaert P. Extracellular ATP drives systemic inflammation, tissue damage and mortality. Cell Death Dis 2014;5:e1102. [DOI] [PMC free article] [PubMed] [Google Scholar]
- 43.Shaikh G, Cronstein B. Signaling pathways involving adenosine A2A and A2B receptors in wound healing and fibrosis. Purinergic Signal 2016;12:191–7 [DOI] [PMC free article] [PubMed] [Google Scholar]
- 44.Borea PA, Gessi S, Merighi S, Vincenzi F, Varani K. Pharmacology of Adenosine Receptors: The State of the Art. Physiol Rev 2018;98:1591–625 [DOI] [PubMed] [Google Scholar]
- 45.Yokoyama U, Patel HH, Lai NC, Aroonsakool N, Roth DM, Insel PA. The cyclic AMP effector Epac integrates pro- and anti-fibrotic signals. Proc Natl Acad Sci U S A 2008;105:6386–91 [DOI] [PMC free article] [PubMed] [Google Scholar]
- 46.Young A, Mittal D, Stagg J, Smyth MJ. Targeting cancer-derived adenosine: new therapeutic approaches. Cancer Discov 2014;4:879–88 [DOI] [PubMed] [Google Scholar]
- 47.Sitkovsky MV, Hatfield S, Abbott R, Belikoff B, Lukashev D, Ohta A. Hostile, hypoxia-A2-adenosinergic tumor biology as the next barrier to overcome for tumor immunologists. Cancer Immunol Res 2014;2:598–605 [DOI] [PMC free article] [PubMed] [Google Scholar]
- 48.Leone RD, Sun IM, Oh MH, Sun IH, Wen J, Englert J, et al. Inhibition of the adenosine A2a receptor modulates expression of T cell coinhibitory receptors and improves effector function for enhanced checkpoint blockade and ACT in murine cancer models. Cancer Immunol Immunother 2018;67:1271–84 [DOI] [PMC free article] [PubMed] [Google Scholar]
- 49.Leone RD, Emens LA. Targeting adenosine for cancer immunotherapy. J Immunother Cancer 2018;6:57. [DOI] [PMC free article] [PubMed] [Google Scholar]
- 50.Sek K, Molck C, Stewart GD, Kats L, Darcy PK, Beavis PA. Targeting Adenosine Receptor Signaling in Cancer Immunotherapy. Int J Mol Sci 2018;19 [DOI] [PMC free article] [PubMed] [Google Scholar]
- 51.Willingham SB, Ho PY, Hotson A, Hill C, Piccione EC, Hsieh J, et al. A2AR Antagonism with CPI-444 Induces Antitumor Responses and Augments Efficacy to Anti-PD-(L)1 and Anti-CTLA-4 in Preclinical Models. Cancer Immunol Res 2018;6:1136–49 [DOI] [PubMed] [Google Scholar]
- 52.Mediavilla-Varela M, Castro J, Chiappori A, Noyes D, Hernandez DC, Allard B, et al. A Novel Antagonist of the Immune Checkpoint Protein Adenosine A2a Receptor Restores Tumor-Infiltrating Lymphocyte Activity in the Context of the Tumor Microenvironment. Neoplasia 2017;19:530–6 [DOI] [PMC free article] [PubMed] [Google Scholar]
Associated Data
This section collects any data citations, data availability statements, or supplementary materials included in this article.