Highlights
-
•
The exploration of the cryptocurrencies market efficiency before and after the COVID-19 pandemicthrough a multifractal analysis.
-
•
The study of the herding biases by quantifying the self-similarity intensity of cryptocurrency returns’ during the COVID-19.
-
•
COVID-19 was revealed to have an impact on the efficiency of all the five cryptocurrencies.
Keywords: Cryptocurrency, Efficiency index, Generalised Hurst exponent, COVID-19, Herding behaviour
Abstract
Cryptocurrency markets are complex systems based on speculation. Where investors interact using strategies that generate some biases responsible for endogenous instabilities. This paper investigated the herding biases by quantifying the self-similarity intensity of cryptocurrency returns’ during the COVID-19 pandemic. The main purpose of this work was to study the level of cryptocurrency efficiency through multifractal analysis before and after the coronavirus pandemic. The empirical results proved that COVID-19 has a positive impact on the cryptocurrency market efficiency.
1. Introduction
Nowadays, the COVID-19, which is a part of the coronavirus family, has spread fear and anxiety amongst people and investors. This psychological state may therefore lead to behavioural biases like the herding behaviour.
Several academic studies have focused on the existence of this behaviour (Mnif et al., 2019) during crisis and epidemic diseases (Economou et al., 2016). More recent studies have expanded their investigations on cryptocurrency markets with CSAD and CSSD methods. However, to the best of the authors' knowledge, the existence of herding behaviour in cryptocurrencies during epidemic diseases has not been explored using the multifractal analysis. For this reason, the top cryptocurrencies dynamics and the herding bias existence we reanalysed before and after the coronavirus disease spread. Our main contribution through this study is an attempt to determine the COVID-19 impact on the cryptocurrency market.
This paper is designed as follows: In the second section, a brief summary of the literature was introduced. The used data were described in the third section and the applied methodology was provided in the fourth section. The empirical results were discussed in the fifth section before drawing our major conclusion in the last section.
2. State of the art
The financial stability in markets is essential for investment security and safety. The volatility bubble resulting from a herding behaviour can be the genesis of an unstable market for a certain period. Therefore, stability conditions might be spelled by financial innovation tools such as mathematics-based heuristics. Previous models based on Gaussian distributions are insufficient to predict the future of capital markets. As an alternative, the multifractal models seem to be more accurate patterns in forecasting matters with different market risks. In this context, B. B. Mandelbrot (1975) appeared as the pioneer with the first study on the fractal theory that was applied in finance to detect crashes and crises.
The MFDFA method was investigated by Mensi et al. (2017) to detect the efficiency level of the sectoral stock markets. Their results showed a moderate efficiency in the short-run but a higher efficiency level over the long-run. These markets become rather inefficient after financial crises.
The MFDFA approach was also investigated to assess the efficiency level of the Bitcoin and Ethereum markets (Mensi et al., 2019).
Other empirical studies developed the existing relations between multifractality and herding. amongst these, we can cite the empirical investigation of Cajueiro and Tabak (2009) who proved that herding behaviour occurs during an excessive co-movement. Accordingly, the authors considered that herding behaviour may cause a market multifractality. This link was also explored by Fernández-Martínez et al. (2017) who used the Hurst exponent to measure herding behaviour intensity in financial markets and capture the outbreak of a bubble.
The impact of pandemic disease son financial markets was investigated by Bennett et al. (2015) and Claessens et al. (2010). However, the effect of the recent COVID-19 pandemic has not been deeply developed because of its recentness and uncertainty. This study was therefore an attempt to contribute to the literature by exploring the effect of the recent coronavirus pandemic on the cryptocurrency market behaviour and efficiency.
3. Data
The sample consists of five cryptocurrencies extracted from www.coinmarketcap.com on a daily basis frequency until 19th May2020 according to their market capitalisation and availability (Table 1 ). The datawas then split into two periods before and afterthe date of 31st December 2019 corresponding to the COVID-19 outbreak.
Table 1.
. Data description.
| Cryptocurrencies | Starting date | Number of observation |
|---|---|---|
| Bitcoin | April 29th, 2013 | 2578 |
| Ethereum | August 7th, 2015 | 1746 |
| Ripple | August 4th, 2013 | 2479 |
| Litecoin | April 29th, 2013 | 2578 |
| Binance | July 25th, 2017 | 1030 |
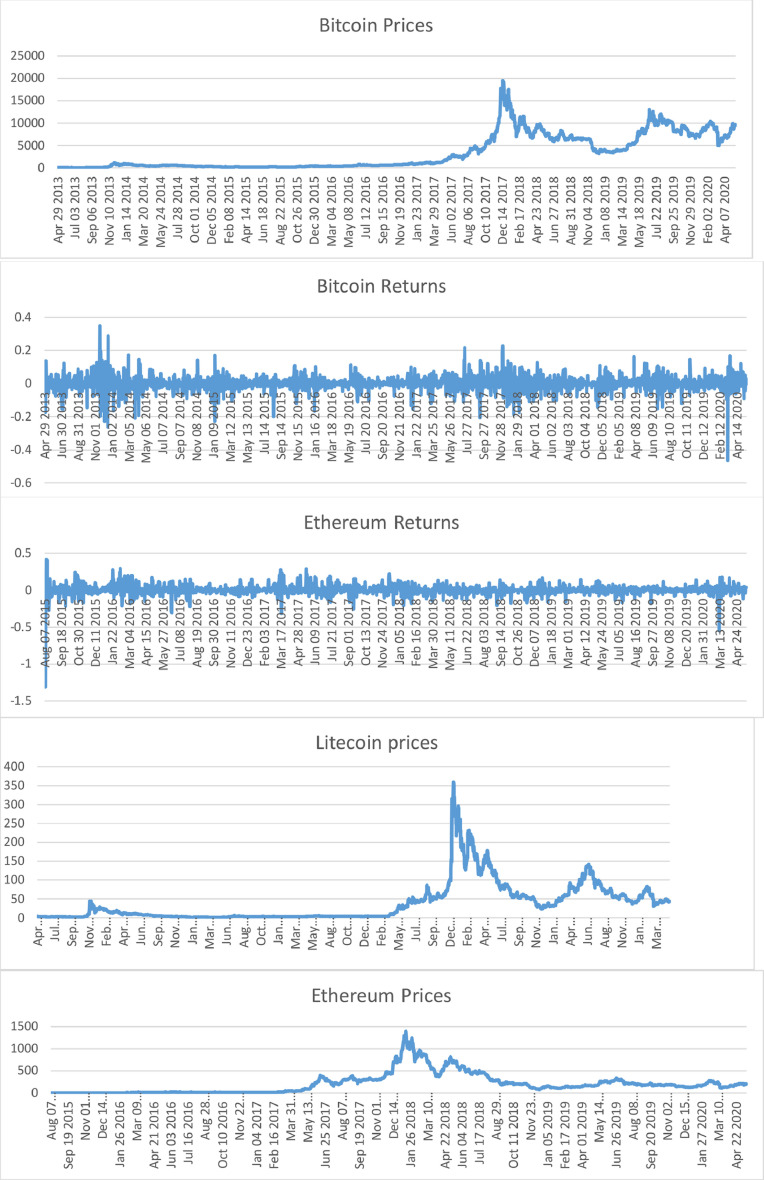
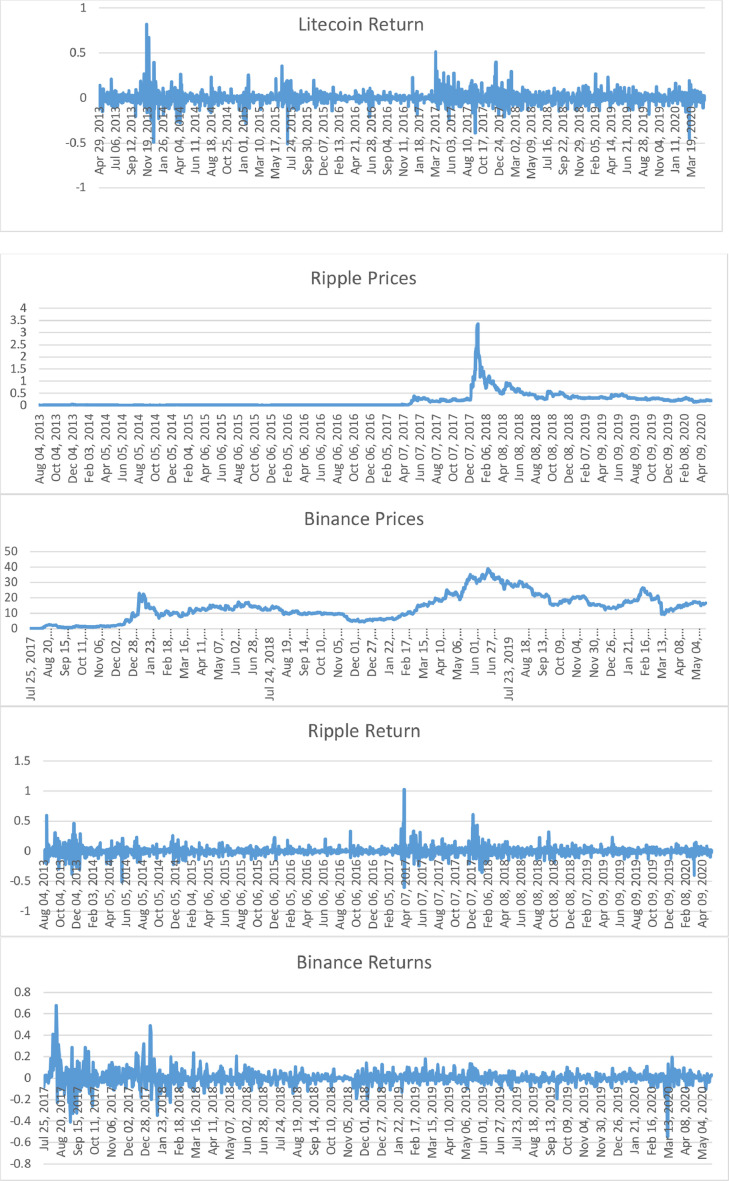
The daily returns of cryptocurrencies are defined as:
| (1) |
where r t is the cryptocurrency return at date t, and Pt is the cryptocurrency price at date t (Fig. 1 ).
Fig. 1.
Depicts the evolution of daily cryptocurrencies’ prices and returns.
4. Methodology
This empirical part used the fractal theory to detect the herding behaviour presence and assess the cryptocurrency markets inefficiency before and after the COVID-19 pandemic.
4.1. The MFDFA approach
The MDFA approach, as detailed by Kantelhardt et al. (2002), can be expressed through 5 steps as follows:
xi is a time series of length N, i ranges from 1 to N.
In step 1, we identify the profile or cumulative sum Y(i):
| (2) |
denotes the mean value of the whole series (. This process converts a white noise process into a random walk.
Step 2 consists in dividing the profile Yt into segments of equal length s.
The local trend is estimated, in the next step, by the least-square fitting polynomial for any segment of length v.
| (3) |
This detrending process is repeated over a range of various window sizes s.
In the fourth step, the segments are average to draw the qth order fluctuation function Fq:
| (4) |
Where q is different from zero.
In the last step, the scaling behaviour of the fluctuation functions is identified by plotting the log-log plots of Fq(s) for each value of q versus s:
| (5) |
We chose to set the order at m = 1 to avoid over fitting as detailed in the work of Lashermes et al. (2004).
4.2. Generalized Hurst exponent (GHE)
Hurst exponent (Hurst, 1951) is used as a bubble detection metric. In other words, when H<0.5, the series are anti-persistent with no shape and lesser fractal quotient. Therefore, we are in the case of no herd behaviour.
H = 0.5 implies that the series follows a theoretical random walk and they are entirely stochastic in nature.
Finally, when H>0.5, the series is evidently persistent with a clear shape, a higher fractal quotient, and a trace of herd behaviour.
The financial markets' roughness was firstly introduced by B. Mandelbrot (1963). In the case of fractional Brownian, he quantifies the series roughness by estimating the Holder exponent (H) (Benoit et al., 1968) and defines the fractal dimension (d) as:
| (6) |
and
| (7) |
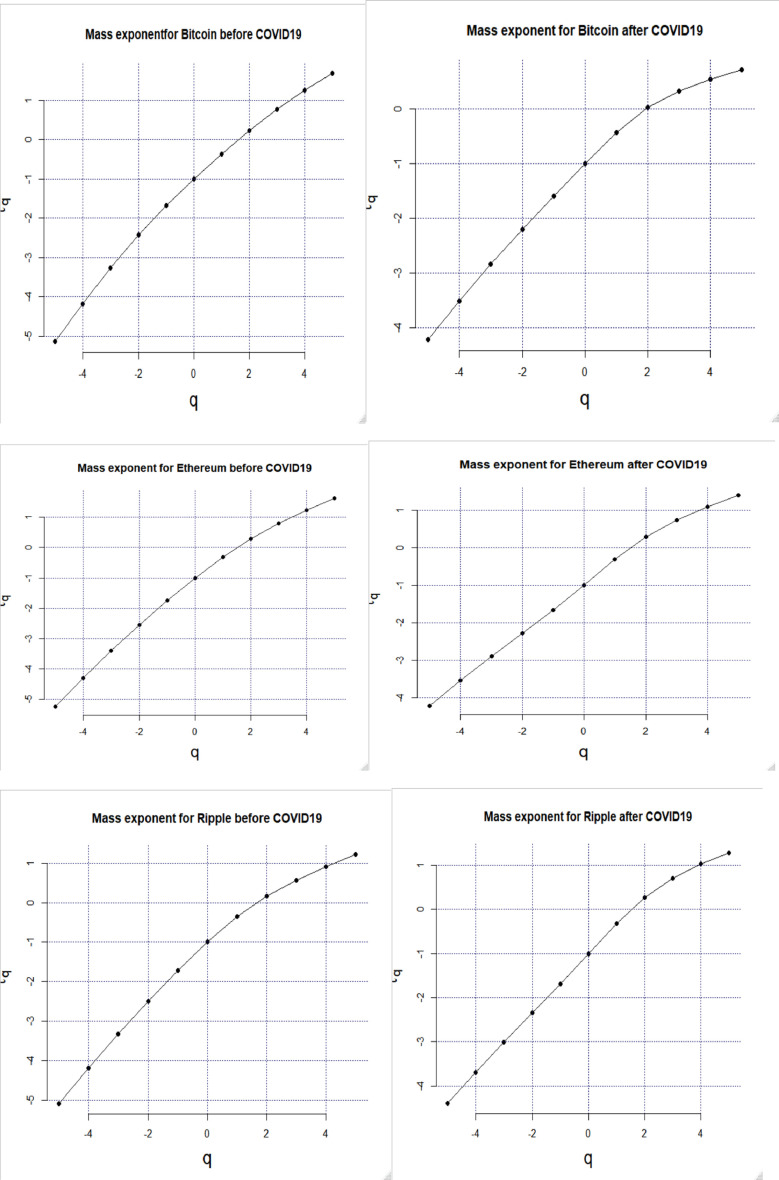
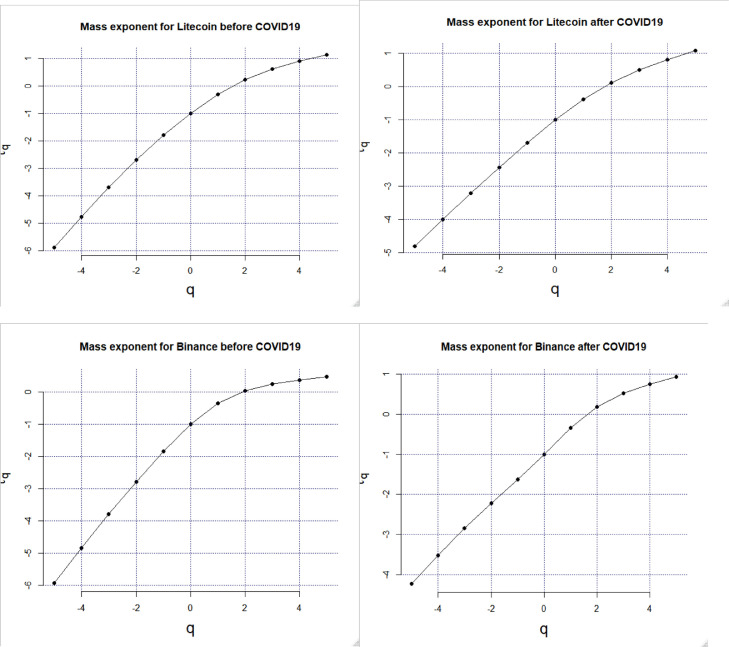
The scaling function of the multifractal processτ(q) is concave for the multifractal but linear for the monofractal process (Fig. 4). τ(q) can be formulated either from the generalized Hurst exponent:
| (8) |
or from the generalized fractal dimension:
| (9) |
Fig. 4.
Mass exponent before and after the COVID-19.
The GHE procedure is mostly built on fractal geometry (Di Matteo, 2007). The q-order moment Kq(μ) of the X(t) increments’ distribution is defined as:
| (10) |
Where . is the average andμ is the time interval between increments; q is an order upper than zero.
The GHE is deduced from the scaling law as shown in Eq. (11).
| (11) |
The following relations in Eq. (12) is obtained from the Legendre transform:
| (12) |
Therefore, the singularity spectrum f(α) is defined as
| (13) |
In this study, the range of the generalized Hurst exponent ΔH max q H(q) - min q H(q) and the width of the multifractal spectrum Δα max q α(q) - min q α(q) were calculated in order to measure the level of multifractality which increases with the increase of either of those measures. The scaling range at smin=10 and smax= (T/4) for MF-DFA were also fixed as suggested by (Rizvi et al., 2014), where T is the series’ length of the used cryptocurrency.
4.3. Magnitude of long-memory or the inefficiency index (MLM)
In this subsection, a measure of the long memory magnitude related to the generalized Hurst exponent was defined to quantify the market efficiency level.
The inefficiency index based on the multifractal dimension indicates that the fluctuations comprising smaller H (−5) and larger H (5) follow the random walk process.
In other words, when MLM = 0 the volatilities of these cryptocurrencies’ returns are absolutely efficient with no long memory and no herding behaviour.
Accordingly, a higher (lower) MLM value indicates a higher (lower) long memory level and a higher (lower) herding behaviour level in the volatility of the cryptocurrencies’ returns. Ultimately, this work tested the efficiency and the herding levels by the MLM inefficiency index suggested by (Khuntia and Pattanayak, 2020) and denoted as:
| (14) |
5. Empirical results
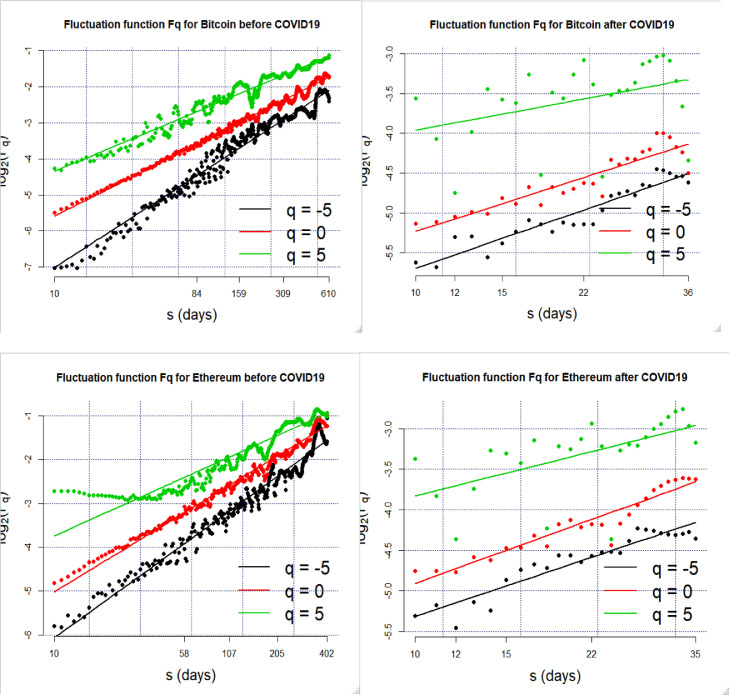
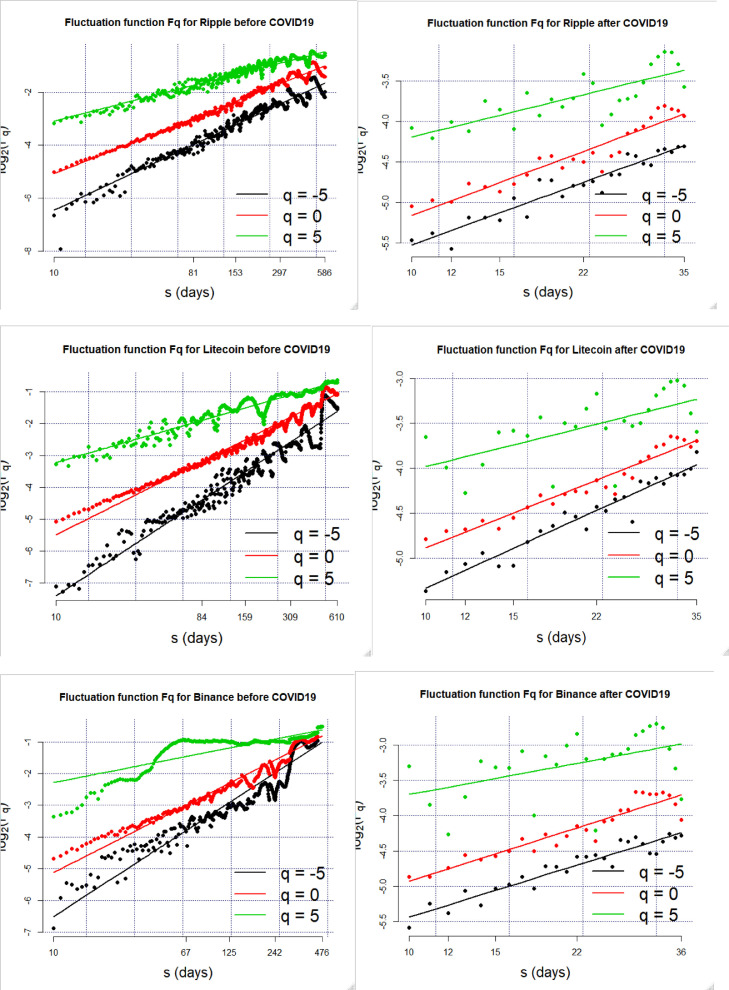
Unlike mono-fractal series, the multi-fractal series do not have a normal distribution. The qth-order Hurst exponent in Fig. 2 , expressed as “hq”, was found to have various traces.
Fig. 2.
Fluctuation function before and after the COVID-19.
The slopes “hq” in Fig. 2 are represented by cored dots for various orders of the exponent such as q = 5 (black), q = 0 (red) and q = −5 (green). The multifractal spectrum is almost symmetric before COVID-19 which shows the self-affine character of cryptocurrency returns. In other words, the cryptocurrency returns depend on many parameters and dimensions while following their own past patterns. This makes the prediction of its evolvement over time more difficult to achieve in the future.
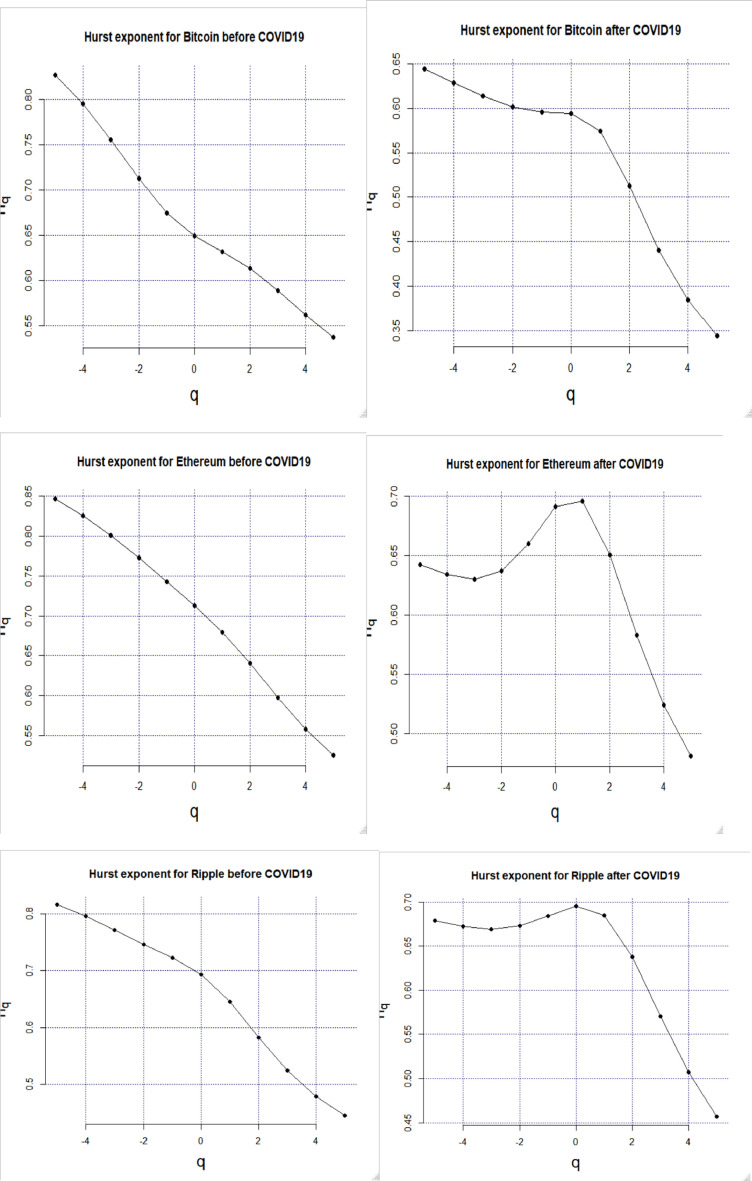
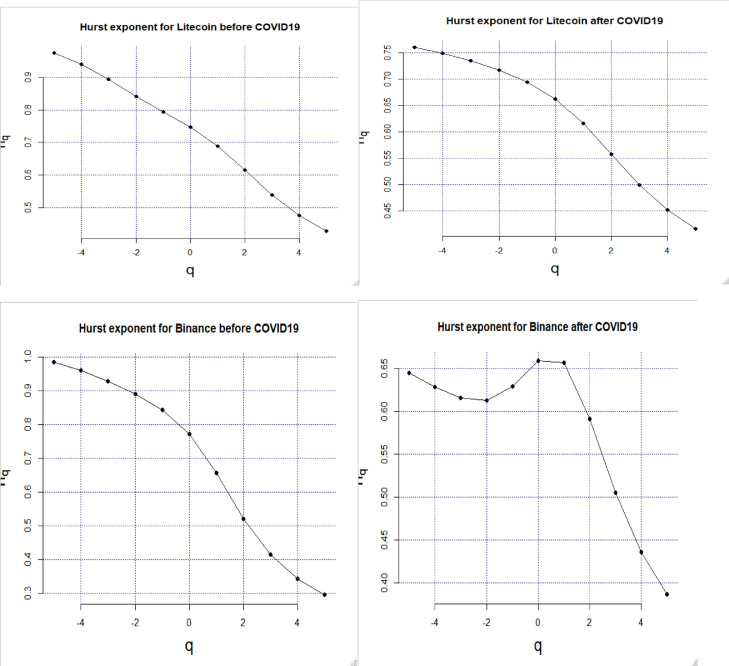
According to the graphs of Fq versus s (Fig. 2) and Hq versus q (Fig. 3 ), we set H(q = ± 5) because of the soft change in the slope for the used cryptocurrencies.
Fig. 3.
Hurst exponent before and after the COVID-19.
The negative and positive q in Table 2 were used in order to explain the effects of the small and large variations, respectively. The cryptocurrencies series multifractality results are confirmed once again in Table 2 because the Hq is dependant on q. The Hq () change results show that the studied markets reveal less fractality and become more efficient. In the case of q = 2, the Hurst exponent H = H (q = 2) −1 is around 0.4 which is less than 0.5, showing that the studied cryptocurrencies’ markets are anti-persistent before and after COVID-19. These results are in accordance with those of Khuntia and Pattanayak (2020).
Table 2.
Generalized Hurst exponent for −5<q<5 before and after COVID-19 pandemic.
| Q | Bitcoin (BTC) | Ethereum (ETH) | Ripple (XRP) | Litecoin (LTC) | Binance (BNB) | |||||
|---|---|---|---|---|---|---|---|---|---|---|
| Before | After | Before | After | Before | After | Before | After | Before | After | |
| −5 | 0.8271 | 0.6442 | 0.8469 | 0.6422 | 0.8169 | 0.6790 | 0.9757 | 0.7607 | 0.9852 | 0.6452 |
| −4 | 0.7954 | 0.6288 | 0.8257 | 0.6340 | 0.7961 | 0.6724 | 0.9405 | 0.7493 | 0.9601 | 0.6287 |
| −3 | 0.7560 | 0.6138 | 0.8008 | 0.6302 | 0.7721 | 0.6694 | 0.8947 | 0.7350 | 0.9284 | 0.6156 |
| −2 | 0.7125 | 0.6016 | 0.7728 | 0.6369 | 0.7468 | 0.6731 | 0.8420 | 0.7171 | 0.8898 | 0.6129 |
| −1 | 0.6744 | 0.5957 | 0.7431 | 0.6598 | 0.7229 | 0.6845 | 0.7934 | 0.6940 | 0.8426 | 0.6295 |
| 0 | 0.6491 | 0.5943 | 0.7125 | 0.6911 | 0.6936 | 0.6955 | 0.7470 | 0.6622 | 0.7720 | 0.6594 |
| 1 | 0.6320 | 0.5744 | 0.6796 | 0.6959 | 0.6452 | 0.6849 | 0.6882 | 0.6160 | 0.6569 | 0.6567 |
| 2 | 0.6134 | 0.5129 | 0.6411 | 0.6504 | 0.5822 | 0.6380 | 0.6144 | 0.5573 | 0.5216 | 0.5911 |
| 3 | 0.5891 | 0.4405 | 0.5976 | 0.5829 | 0.5236 | 0.5706 | 0.5385 | 0.4992 | 0.4152 | 0.5050 |
| 4 | 0.5624 | 0.3843 | 0.5576 | 0.5245 | 0.4780 | 0.5069 | 0.4750 | 0.4517 | 0.3440 | 0.4354 |
| 5 | 0.5376 | 0.3444 | 0.5254 | 0.4815 | 0.4445 | 0.4569 | 0.4272 | 0.4156 | 0.2964 | 0.3864 |
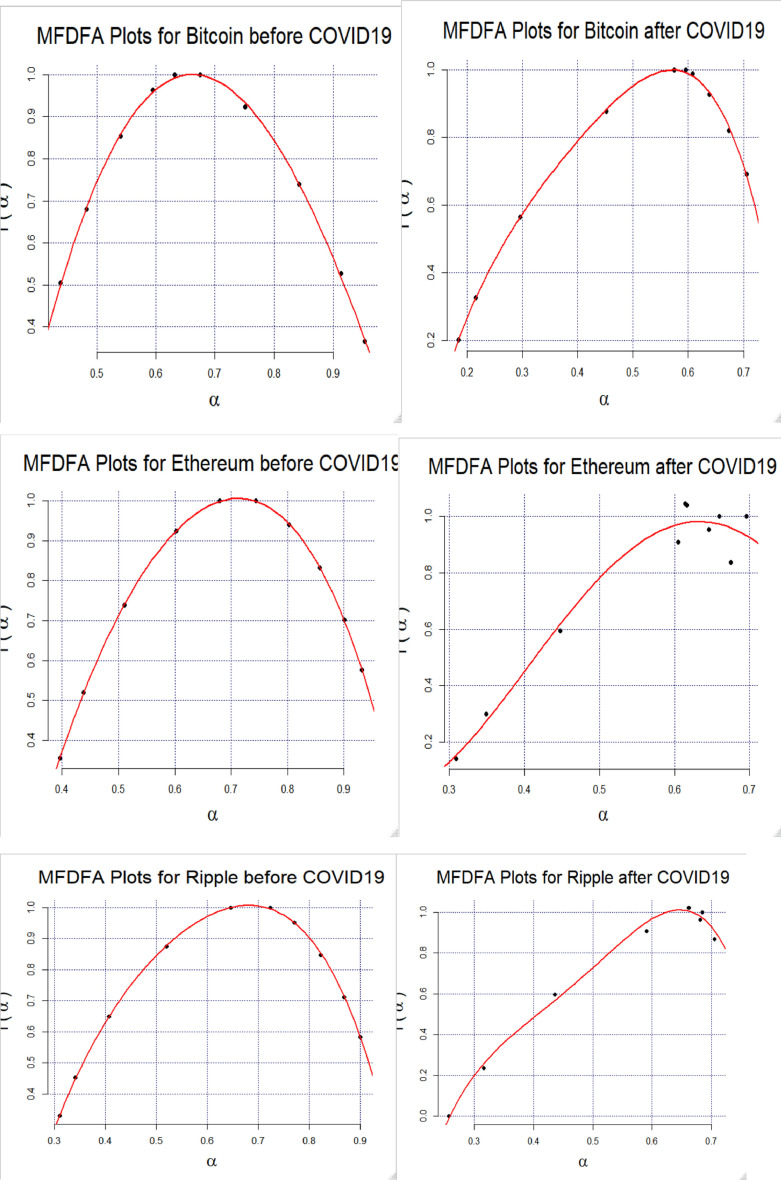
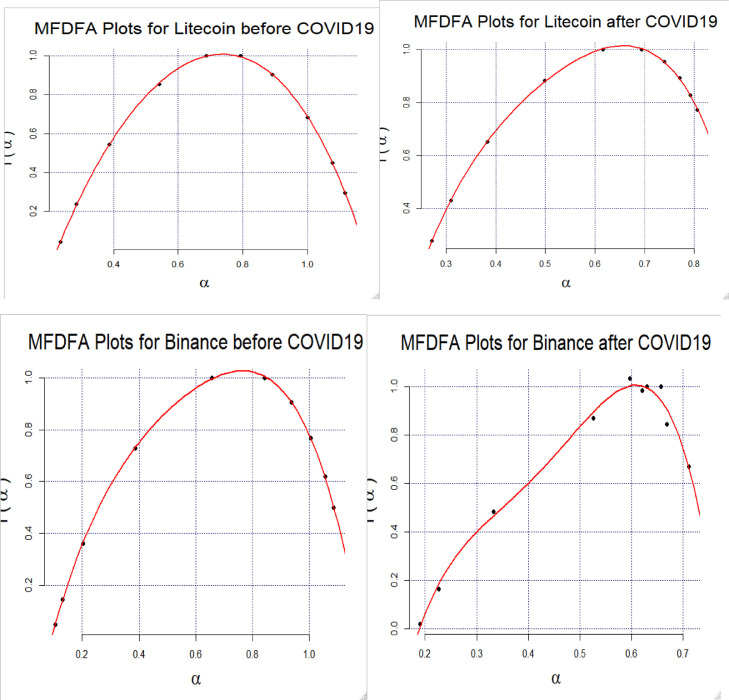
Fig. 5 depicts the plots of α versus f(α) schematizing the “Multifractal spectrum”. The width of the fractal spectrum Δα represents the difference between the upper and the lower probabilities as shown in Table 3 . The multifractality increases when Δαexpands (Lu et al., 2013). Accordingly, the multifractality of these markets is reduced after the COVID-19 pandemic (Table 3).
Fig. 5.
MFDFA plots.
Table 3.
Multifractality results before and after the COVID-19 pandemic.
| Δα | ΔHq | Hurst average | Fractal dimension(d) | LML | Ranking | ||
|---|---|---|---|---|---|---|---|
| Bitcoin | Before | 0.5155 | 0.2895 | 0.66809091 | 1.331909 | 0.18235 | 1 |
| After | 0.521 | 0.2998 | 0.53953636 | 1.460464 | 0.1489 | 4 | |
| Ethereum | Before | 0.5351 | 0.3215 | 0.7002818 | 1.299718 | 0.18615 | 3 |
| After | 0.3655 | 0.1607 | 0.6208545 | 1.379145 | 0.08035 | 1 | |
| Ripple | Before | 0.5896 | 0.3724 | 0.65653636 | 1.343464 | 0.18595 | 2 |
| After | 0.4485 | 0.2221 | 0.63010909 | 1.369891 | 0.11105 | 2 | |
| Litecoin | Before | 0.8805 | 0.5485 | 0.72150909 | 1.278491 | 0.27425 | 4 |
| After | 0.5351 | 0.3451 | 0.6234636 | 1.376536 | 0.17255 | 5 | |
| Binance | Before | 0.9796 | 0.6888 | 0.69201818 | 1.307982 | 0.3444 | 5 |
| After | 0.5208 | 0.2588 | 0.57871818 | 1.421282 | 0.1294 | 3 | |
For more robust results, this brief study computed the (LML) inefficiency index based on Hq() as shown in Table 3. The larger this (LML) index is, the less efficient the market is.
Several recent studies linked the fractal theory to Hausdorff topology (Hausdorff, 1918) to detect the presence and the level of herding and other heuristic biases (Ghosh and Kozarevic, 2019). In fact, the herding behaviour increases when the shape moves from Douady rabbit (with a fractal dimension d = 1.4 and d = 1.38) to five circles inversion fractal (d = 1.36) and finally to reach the Dendrite Julia (d = 1.18) and the Gosper Island contour (d = 1.12).
Δα and ΔHq decreased in all cases except for Bitcoin when the COVID-19 pandemics spread showing that the studied markets, excluding that of Bitcoin, become less multi-fractal and therefore more efficient.
The fractal dimension (d) increases for all cases indicating that the herding behaviour is reduced after COVID-19.
The LML index values are smaller than 0.35and greater than 0.08 proving that all of these cryptocurrencies are almost efficient with different degrees. The closest of the LML inefficiency index value to zero is attributed to Bitcoin before the COVID-19 outbreak and to Ethereum after COVID-19. In addition, this LML index decreased in these five cryptocurrencies after the outbreak highlighting that this pandemic has a positive impact on the efficiency of these markets.
6. Conclusion
This paper investigated the efficiency level and detected the existence of herding behaviour in the five top cryptocurrency markets using the generalized Hurst exponent as an evaluation measurement of fractality by means of the multi- fractal detrended fluctuation approach. Five cryptocurrencies with high market capitalisation were employed to explain the method and focus on the COVID-19 impact on their efficiency. The GHE estimation empirical results indicate that most cryptocurrencies are multi-fractal before COVID-19. These findings are in line with other empirical findings (Stosic et al., 2019) and fit the general expectation about most cryptocurrency markets.
For the sake of robust results, we measured the cryptocurrency efficiency using the Magnitude of Long-memory index. The results clearly show that Bitcoin was the most efficient before the disease outbreak; however, it was found to be less efficient than Ethereum after the COVID-19 outbreak. Furthermore, all of the studied cryptocurrencies become more efficient after the spread of this pandemic.
This empirical study may provide marketers with valuable analysis and knowledge, and help them make the best decisions and strategies. Potential future studies may focus and explore the monetary and governmental policies to be adapted to face the COVID-19 dangerous effects on society and economy.
Authorship statement
All persons who meet authorship criteria are listed as authors, and all authors certify that they have participated sufficiently in the work to take public responsibility for the content, including participation in the concept, design, analysis, writing, or revision of the manuscript. Furthermore, each author certifies that this material or similar material has not been and will not be submitted to or published in any other publication before its appearance in the Hong Kong Journal of Occupational Therapy.
Authorship contributions
Conception and design of study: Anis Jarboui, Emna Mnif, Khaireddine Mouakhar acquisition of data: Anis Jarboui, Emna Mnif, Khaireddine Mouakhar analysis and/or interpretation of data:. Anis Jarboui, Emna Mnif, Khaireddine Mouakhar
Drafting the manuscript: Anis Jarboui, Emna Mnif, Khaireddine Mouakhar revising the manuscript critically for important intellectual content: Anis Jarboui, Emna Mnif, Khaireddine Mouakhar
Approval of the version of the manuscript to be published (the names of all authors must be listed):
Anis Jarboui, Emna Mnif, Khaireddine Mouakhar
Acknowledgements
All persons who have made substantial contributions to the work reported in the manuscript (e.g., technical help, writing and editing assistance, general support), but who do not meet the criteria for authorship, are named in the Acknowledgements and have given us their written permission to be named. If we have not included an Acknowledgements, then that indicates that we have not received substantial contributions from non-authors.
Footnotes
Supplementary material associated with this article can be found, in the online version, at doi:10.1016/j.frl.2020.101647.
Appendix. Supplementary materials
References
- Bennett D., Chiang C.F., Malani A. Learning during a crisis: the SARS epidemic in Taiwan. J. Dev. Econ. 2015 doi: 10.1016/j.jdeveco.2014.09.006. [DOI] [PMC free article] [PubMed] [Google Scholar]
- Cajueiro D.O., Tabak B.M. Multifractality and herding behavior in the Japanese stock market. Chaos Solitons Fractals. 2009 doi: 10.1016/j.chaos.2007.07.091. [DOI] [Google Scholar]
- Claessens S., Dell'Ariccia G., Igan D., Laeven L. Cross-country experiences and policy implications from the global financial crisis. Econ. Policy. 2010 doi: 10.1111/j.1468-0327.2010.00244.x. [DOI] [Google Scholar]
- Di Matteo T. Multi-scaling in finance. Quant. Financ. 2007 doi: 10.1080/14697680600969727. [DOI] [Google Scholar]
- Economou F., Katsikas E., Vickers G. Testing for herding in the Athens Stock Exchange during the crisis period. Financ. Res. Lett. 2016 doi: 10.1016/j.frl.2016.05.011. [DOI] [Google Scholar]
- Fernández-Martínez M., Sánchez-Granero M.A., Muñoz Torrecillas M.J., Mckelvey B. A comparison of three hurst exponent approaches to predict nascent bubbles in SandP500 stocks. Fractals. 2017 doi: 10.1142/S0218348x17500062. [DOI] [Google Scholar]
- Ghosh B., Kozarevic E. Multifractal analysis of volatility for detection of herding and bubble: evidence from CNX Nifty HFT. Invest. Manage. Financ. Innov. 2019 doi: 10.21511/imfi.16(3).2019.17. [DOI] [Google Scholar]
- Hausdorff F. Dimension und äußeres Maß. Math. Ann. 1918 doi: 10.1007/BF01457179. [DOI] [Google Scholar]
- Hurst H.E. Long-term storage capacity of reservoirs. Trans. Am. Soc. Civil Eng. 1951 [Google Scholar]
- Kantelhardt J.W., Zschiegner S.A., Koscielny-Bunde E., Havlin S., Bunde A., Stanley H.E. Multifractal detrended fluctuation analysis of nonstationary time series. Phys. A. 2002 doi: 10.1016/S0378-4371(02)01383-3. [DOI] [Google Scholar]
- Khuntia S., Pattanayak J.K. Adaptive long memory in volatility of intra-day bitcoin returns and the impact of trading volume. Financ. Res. Lett. 2020 doi: 10.1016/j.frl.2018.12.025. [DOI] [Google Scholar]
- Lashermes B., Abry P., Chainais P. New insights into the estimation of scaling exponents. Int. J. Wavelets Multiresolut. Inf. Process. 2004 doi: 10.1142/s0219691304000597. [DOI] [Google Scholar]
- Lu X., Tian J., Zhou Y., Li Z. Multifractal detrended fluctuation analysis of the Chinese stock index futures market. Phys. A. 2013 doi: 10.1016/j.physa.2012.11.037. [DOI] [Google Scholar]
- Mandelbrot B. The variation of certain speculative prices. J. Bus. 1963 doi: 10.1086/294632. [DOI] [Google Scholar]
- Mandelbrot B.B. Stochastic models for the Earth’s relief, the shape and the fractal dimension of the coastlines, and the number area rule for islands. Proc. Natl. Acad. Sci. U.S.A. 1975 doi: 10.1073/pnas.72.10.3825. [DOI] [PMC free article] [PubMed] [Google Scholar]
- Mandelbrot B.B., Van Ness J.W. Fractional brownian motions, fractional noises and applications. SIAM Rev. 1968 doi: 10.1137/1010093. [DOI] [Google Scholar]
- Mensi W., Hammoudeh S., Al-Jarrah I.M.W., Sensoy A., Kang S.H. Dynamic risk spillovers between gold, oil prices and conventional, sustainability and Islamic equity aggregates and sectors with portfolio implications. Energy Econ. 2017 doi: 10.1016/j.eneco.2017.08.031. [DOI] [Google Scholar]
- Mensi W., Lee Y.J., Al-Yahyaee K.H., Sensoy A., Yoon S.M. Intraday downward/upward multifractality and long memory in Bitcoin and Ethereum markets: an asymmetric multifractal detrended fluctuation analysis. Financ. Res. Lett. 2019 doi: 10.1016/j.frl.2019.03.029. [DOI] [Google Scholar]
- Mnif E., Salhi B., Jarboui A. Herding behaviour and Islamic market efficiency assessment: case of Dow Jones and Sukuk market. Int. J. Islam. Middle Eastern Financ. Manage. 2019 doi: 10.1108/IMEFM-10-2018-0354. [DOI] [Google Scholar]
- Rizvi S.A.R., Dewandaru G., Bacha O.I., Masih M. An analysis of stock market efficiency: developed vs Islamic stock markets using MF-DFA. Phys. A. 2014 doi: 10.1016/j.physa.2014.03.091. [DOI] [Google Scholar]
- Stosic D., Stosic D., Ludermir T.B., Stosic T. Multifractal behavior of price and volume changes in the cryptocurrency market. Phys. A. 2019 doi: 10.1016/j.physa.2018.12.038. [DOI] [Google Scholar]
Associated Data
This section collects any data citations, data availability statements, or supplementary materials included in this article.


