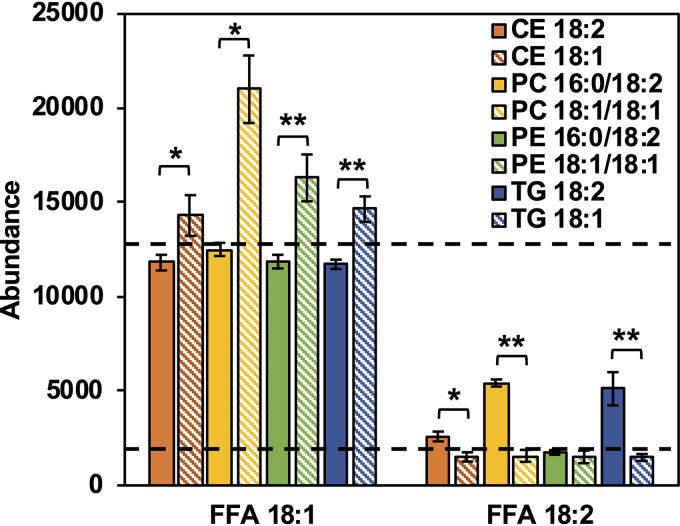
FIG 8.
Relative abundances of free oleic (FFA 18:1) and free linoleic (FFA 18:2) resulting from the incubation of purified Geh with cholesteryl esters, phospholipids, and triglycerides containing oleic and linoleic acids. n = 3 per group. The dashed lines indicate the background levels of FFA 18:1 and FFA 18:2 detected in the incubations of lipids that did not contain these FAs. Statistical analysis was conducted using Student’s t test. *, P ≤ 0.05; **, P ≤ 0.01.

