

Abstract
Aim
To evaluate the influence of diabetes on the severity and fatality of severe acute respiratory syndrome coronavirus‐2 (SARS‐CoV‐2) infection.
Materials and Methods
The medical records of 66 hospitalized coronavirus disease 2019 (COVID‐19) patients were collected and classified into non‐severe (mild/moderate cases) and severe (severe/critical cases) groups. Logistic regression analysis was used to estimate the risk of severe COVID‐19 (severe/critical infection). In addition, a meta‐analysis including published studies reported the impact of diabetes on the severity and fatality of COVID‐19. The current study was conducted using fixed effects models.
Results
There were 22 diabetes and 44 non‐diabetes cases among the 66 hospitalized COVID‐19 patients. Seven patients with diabetes (31.82%) were diagnosed as severe COVID‐19 cases, which was significantly higher than that in the non‐diabetes group (4/44, 9.09%, P = .033). After adjustment for age and gender, diabetes was significantly associated with COVID‐19 severity (OR: 5.29, 95% CI: 1.07–26.02). A meta‐analysis further confirmed the positive association between diabetes and COVID‐19 severity (pooled OR = 2.58, 95% CI: 1.93–3.45). Moreover, the patients with diabetes infected with SARS‐CoV‐2 had a 2.95‐fold higher risk of fatality compared with those patients without diabetes (95% CI: 1.93–4.53).
Conclusions
Our findings provide new evidence that diabetes is associated with a higher risk of severity and fatality of COVID‐19. Therefore, intensive monitoring and antidiabetic therapy should be considered in patients with diabetes with SARS‐CoV‐2 infection.
Keywords: COVID‐19, diabetes, fatality, severity
1. INTRODUCTION
Coronavirus disease 2019 (COVID‐19), caused by severe acute respiratory syndrome coronavirus‐2 (SARS‐CoV‐2), is an ongoing public health emergency of international significance. 1 Although the fatality of SARS‐CoV‐2 infection appears to be less than that observed in SARS‐CoV and Middle East respiratory syndrome (MERS)‐CoV infections, the new virus possesses strong transmissibility. 2 , 3 As of 3 April 2020, ~1 100 000 laboratory‐confirmed patients presented in more than 200 countries/regions around the world. Moreover, the virus has led to the deaths of over 50 000 people, mostly older people and those with underlying chronic diseases. 4 Therefore, identification of the risk factors for the severity and fatality of SARS‐CoV‐2 infection is urgently needed, to better understand and prevent this global public health epidemic.
Accumulative clinical studies have suggested that patients with diabetes with acute viral respiratory infections often experience severe complications such as pneumonia, acute respiratory distress syndrome, organ failure and even death. 5 , 6 , 7 For example, Yang et al have reported that a known history of diabetes was an independent predictor for the fatality of SARS‐CoV infection. 8 More importantly, normalization of blood glucose levels and the possible suppression of ketosis using intravenous insulin‐glucose infusion or intensive insulin therapy have been shown to reduce mortality and morbidity in patients with diabetes admitted to intensive care units. 8 In addition, Garbati et al reported that 88% of MERS‐CoV‐infected patients with diabetes had poor outcomes compared with 39% of individuals who had any type of non‐diabetic co‐morbidity with MERS‐CoV infection, suggesting that diabetes in particular is a major contributor to MERS severity. 9
As one of the most important public health problems in the 21st century, diabetes affects more than 400 million adults throughout the world. 10 However, investigations into the effects of diabetes on the severity and fatality of SARS‐CoV‐2 infection have to date been limited. Therefore, the first objective of this study was to explore the association between diabetes and COVID‐19 severity in hospitalized patients. Then we combined our results with those from previously published studies in a meta‐analysis. This assessment should be helpful for the management of patients with diabetes with SARS‐CoV‐2 infection.
2. MATERIALS AND METHODS
2.1. Study population
From 23 January to 9 March 2020, a total of 66 COVID‐19 patients were admitted to Huai'an Fourth People's Hospital, which is the sole hospital caring for COVID‐19 patients in Huai'an City. Huai'an City is located in the hinterland of northern Jiangsu, China, with a population of 5.68 million people. Diagnosis of SARS‐CoV‐2 infection is based on the New Coronavirus Pneumonia Prevention and Control Program (fifth version) published by the National Health Commission of China. 11 All included patients were laboratory‐confirmed hospitalized cases on the basis of positive qRT‐PCT results for SARS‐CoV‐2 in swab samples. In the current study, the severity of COVID‐19 was determined as per the following criteria 11 : (a) mild cases: the clinical symptoms were mild and there was no sign of pneumonia on imaging; (b) moderate cases: only showing fever and respiratory symptoms with radiological findings of pneumonia; (c) severe cases (for adults): (i) respiratory distress (≥30 breaths/minute); (ii) oxygen saturation (≤93% at rest); (iii) arterial partial pressure of oxygen (PaO2)/fraction of inspired oxygen (FiO2) ≤300 mmHg; and (d) critical cases: (i) respiratory failure and requiring mechanical ventilation; (ii) shock; (iii) with other organ failure that requires ICU care. To analyse the associations between diabetes and the severity of SRAS‐CoV‐2 infection, the mild/moderate and severe/critical COVID‐19 cases were classified into non‐severe and severe groups, respectively.
In the current study, patients co‐infected with two or more pathogens were excluded. This study was reviewed and approved by the Medical Ethical Committee of Huai'an Fourth People's Hospital (approval number HASY2020004) in accordance with the 1974 Declaration of Helsinki for Human Research. A waiver of informed consent was obtained.
2.2. Data collection and laboratory tests
Demographic and clinical features were extracted from electronic medical records using a standardized data collection form. All data were checked by a team of trained physicians. In the current study, all of the laboratory tests were examined within 24 hours of hospital admission. The SARS‐CoV‐2 RNA was isolated from each pharyngeal swab specimen and amplified using qRT‐PCR kits (BGI Genomics, Beijing, China), as recommended by the Chinese Center for Disease Control and Prevention. Other routine laboratory tests, including lymphocyte counts, neutrophil counts and serum levels of aspartate aminotransferase (AST), alanine aminotransferase (ALT), fasting plasma glucose (FPG), creatine kinase (CK), C‐reactive protein (CRP), total cholesterol (TC) and triglycerides (TG) were measured using commercial reagents according to the manufacturer's instructions.
2.3. Assessment of diabetes
In line with American Diabetes Association guidelines, patients were identified as having diabetes if they were currently treated with insulin or oral hypoglycaemic agents, or had an FPG concentration of ≥7.0 mmol/L on at least two separate occasions. 12
2.4. Statistical analysis
In the current study, the mild/moderate and severe/critical COVID‐19 cases were classified into non‐severe and severe groups, respectively. Continuous variables were expressed as mean ± SD or median (interquartile range). Categorical variables were expressed as numbers (%). The unpaired t‐test, χ2 test or Fisher's exact test was used to compare the characteristics of COVID‐19 patients with or without diabetes, as appropriate. Logistic regression analysis was used to estimate the risk of COVID‐19 severity (severe/critical infection) by calculating the odds ratios (ORs) and 95% confidence intervals (CIs). Statistical analyses were performed using SAS 9.4 software (SAS Institute, Cary, NC, USA); a two‐sided P value of <.05 was defined as statistically significant.
Based on the guidelines of the Preferred Reporting Items for Systematic reviews and Meta‐Analyses (PRISMA), 13 this meta‐analysis was conducted by combining the results of the current study and previous studies reporting the effects of diabetes on the severity and fatality of hospitalized COVID‐19 cases. The exclusion criteria were: (a) repeated articles, letters, comments, editorials and expert opinions; (b) case reports; (c) review and meta‐analysis articles; and (d) studies without available data. First, we searched the relevant studies in the PubMed, Embase, medRxiv, Cochrane library and CNKI databases for articles published up to 20 March 2020 using the following terms: “COVID‐19 or SARS‐CoV‐2 or 2019‐nCoV or NCIP” and “diabetes” or “diabetes mellitus”. To be included in the meta‐analysis for the associations between diabetes and COVID‐19 severity, a study had to: (a) group patients with COVID‐19 based on disease severity; (b) show available data for the number of patients with diabetes with SARS‐CoV‐2 infection; (c) be published in English or Chinese; and (d) include at least 20 cases. We searched the reference lists of relevant publications manually to identify more studies. Finally, 12 studies met the criteria. 14 , 15 , 16 , 17 , 18 , 19 , 20 , 21 , 22 , 23 , 24 , 25 Second, we searched the relevant studies for the meta‐analysis of the relationship between diabetes and COVID‐19 fatality as described above. Included articles had to: (a) show available data on the number of patients with diabetes; (b) show available data on the number of deaths of SARS‐CoV‐2‐infected patients with diabetes; (c) be published in English or Chinese; and (d) include at least 20 cases. In total, six studies satisfied all the criteria. 26 , 27 , 28 , 29 , 30 , 31 The quality of all the included studies was evaluated using the Newcastle‐Ottawa Scale (Table S1).
Figure S1 depicts the flow of the study selection process. Two authors (JW and JZ) independently extracted the data and, if there were disagreements, these were discussed and resolved with a third author (CD). We extracted information about the authors, date of publication, sample size, range of age, the number of diabetes cases, the number of severe or fatality cases and the effect size. Potential heterogeneity between studies was examined using the I2 judgement model. If I2 <50%, there was no heterogeneity among the included studies and the fixed effects model was selected; otherwise, the results of the independent studies were not the same because of sampling errors, and the random effects model was selected. 32 The funnel plot and Egger's test were used to examine potential publication bias. 33 This meta‐analysis was performed using the Meta package in R software (version 3.6.1). All reported P‐values were two‐tailed, and those <0.05 were considered statistically significant unless otherwise specified.
3. RESULTS
3.1. Characteristics of COVID‐19 patients
There were 22 diabetes and 44 non‐diabetes cases among the 66 hospitalized COVID‐19 patients included in this study. In patients with diabetes, seven cases (31.82%) were diagnosed as severe SARS‐CoV‐2 infections, which was significantly higher than in the non‐diabetes group (4/44, 9.09%, P = .033). Compared with the non‐diabetes COVID‐19 cases, patients with diabetes with SARS‐CoV‐2 infection more probably had higher levels of CRP (P = .001) and neutrophil counts (P = .033) upon admission. As expected, the mean body mass index was 26.75 ± 2.68 kg/m2 in patients with diabetes, which was significantly higher than that in non‐diabetes cases (24.97 ± 3.07 kg/m2, P = .027). However, no significant differences were observed in other characteristics between the two groups (Table 1).
TABLE 1.
Baseline characteristics of COVID‐19 patients with or without diabetes upon admission
| Variable | Patients without diabetes (n = 44) | Patients with diabetes (n = 22) | t/ χ 2 | P |
|---|---|---|---|---|
| Age, years | 47.98 ± 15.11 | 52.55 ± 13.70 | 1.19 | .237 |
| Male, n (%) | 28 (63.64) | 16 (72.73) | 0.55 | .460 |
| BMI, kg/m2 | 24.97 ± 3.07 | 26.75 ± 2.68 | 2.27 | .027 |
| Hypertension, n (%) | 15 (55.56) | 12 (44.44) | 2.54 | .111 |
| White blood cell count, ×109/L | 4.67 ± 1.46 | 5.86 ± 3.34 | 1.61 | .120 |
| Lymphocyte count, ×109/L | 1.25 ± 0.53 | 1.01 ± 0.58 | 1.67 | .101 |
| Neutrophil count, ×109/L | 2.72 (2.13–3.57) | 3.63 (2.50–5.72) | 2.13 | .033 |
| Haemoglobin, g/L | 146.55 ± 14.41 | 139.27 ± 16.30 | 1.85 | .069 |
| Platelet count, ×109/L | 153.16 ± 43.99 | 156.55 ± 47.88 | 0.29 | .776 |
| FPG, mmol/L | 5.65 ± 0.68 | 10.98 ± 3.74 | 9.11 | <.001 |
| TC, mmol/L | 3.73 ± 0.71 | 3.93 ± 0.64 | 1.08 | .284 |
| TG, mmol/L | 1.39 ± 1.08 | 1.42 ± 0.36 | 0.15 | .878 |
| CRP, mg/L | 10.42 (4.24–34.20) | 43.31 (23.93–87.77) | 3.41 | .001 |
| AST, U/L | 27.20 ± 13.18 | 30.30 ± 14.27 | 0.87 | .386 |
| ALT, U/L | 31.14 ± 17.24 | 36.95 ± 25.37 | 0.93 | .360 |
| CK, U/L | 94.84 ± 76.89 | 78.23 ± 59.47 | 0.89 | .378 |
| Severe cases, n (%) | 4 (9.09%) | 7 (31.82) | .033 a |
Data in bold means the difference between two groups is significant.
Abbreviations: ALT, alanine aminotransferase; AST, aspartate aminotransferase; BMI, body mass index; CK, creatine kinase; CRP, C‐reactive protein; FPG, fasting plasma glucose; TC, total cholesterol; TG, triglycerides.
Fisher's Exact Test.
3.2. Associations between diabetes and COVID‐19 severity
As shown in Table 2, univariate logistic regression analysis revealed that diabetes was significantly associated with severe SARS‐CoV‐2 infection (OR: 4.67, 95% CI: 1.19–18.26). Furthermore, after adjustment for age and gender, patients with diabetes infected with SARS‐CoV‐2 were shown to have a 5.29‐fold higher risk of developing severe COVID‐19 compared with those patients without diabetes (95% CI: 1.07–26.02).
TABLE 2.
Logistical analysis of the association between diabetes and COVID‐19 severity
| Non‐diabetes cases (n = 44) | Diabetes cases (n = 22) | P | |
|---|---|---|---|
| Severe cases | 7 | 4 | |
| Model 1 | 1.00 (ref.) | 4.67 (1.19–18.26) | .027 |
| Model 2 | 1.00 (ref.) | 5.29 (1.07–26.02) | .041 |
Model 1: unadjusted; Model 2: adjusted for age and gender.
3.3. Meta‐analysis of the association between diabetes and COVID‐19 severity
Figure 1A summarizes the association between diabetes and COVID‐19 severity, based on 12 previously published studies and the results from the current study. The total number of patients included in this analysis was 2455, consisting of 94 and 471 severe COVID‐19 cases in diabetes (232 cases) and non‐diabetes groups (2223), respectively (Table 3). As the results show, patients with diabetes with SARS‐CoV‐2 infection had a higher risk of developing severe COVID‐19 (pooled OR = 2.58, 95% CI: 1.93–3.45), with a moderate heterogeneity between the studies (I2 = 44%, P = .04). The estimated effect sizes were similar in the sensitivity analysis, regardless of exclusion of any single study one at a time (Figure 1B). Furthermore, subgroup analysis results revealed that the pooled OR was 3.04 (95% CI: 2.03–4.56) for the patients aged <50 years and 2.58 (95% CI: 1.93–3.26) for the patients aged ≥50 years, respectively (Figure 2). In addition, the funnel plots and Egger's test (t = 0.60, P = .559) did not show the existence of any potential publication bias in the current meta‐analysis (Figure S2A).
FIGURE 1.
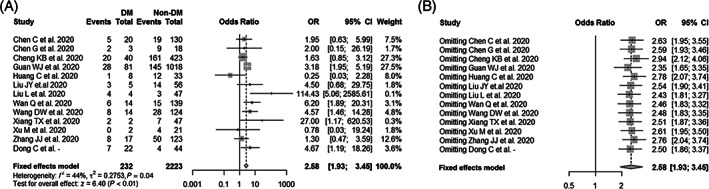
Meta‐analysis of the associations between diabetes mellitus (DM) and COVID‐19 severity. (A) Forest plot of the COVID‐19 severity for comparison between patients with and without diabetes; (B) sensitivity analysis of the COVID‐19 severity for comparison between patients with and without diabetes after excluding any single study one at a time
TABLE 3.
Characteristics of the identified studies on COVID‐19 severity in patients with and without diabetes
| Author | Non‐diabetes cases, n (%) | Diabetes cases, n (%) | ||
|---|---|---|---|---|
| Non‐severe | Severe | Non‐severe | Severe | |
| Xiang TX et al. 25 | 7 (14.89) | 40 (85.11) | 2 (100.00) | 0 (0) |
| Chen G et al. 15 | 9 (50.00) | 9 (50.00) | 2 (66.67) | 1 (33.33) |
| Wan Q et al. 17 | 15 (10.79) | 124 (89.21) | 6 (42.86) | 8 (57.14) |
| Wang DW et al. 14 | 28 (22.58) | 96 (77.42) | 8 (57.14) | 6 (42.86) |
| Zhang JJ et al. 20 | 50 (40.65) | 73 (59.35) | 8 (47.06) | 9 (52.94) |
| Liu L et al. 19 | 3 (6.38) | 44 (93.62) | 4 (100.00) | 0 (0) |
| Guan WJ et al. 21 | 145 (14.24) | 873 (85.76) | 28 (34.57) | 53 (65.43) |
| Huang C et al. 22 | 12 (36.36) | 21 (63.64) | 1 (12.50) | 7 (87.50) |
| Liu JY et al. 16 | 14 (25.00) | 42 (75.00) | 3 (60.00) | 2 (40.00) |
| Xu M et al. 18 | 4 (19.05) | 17 (80.95) | 0 (0) | 2 (100.00) |
| Cheng KB et al. 24 | 161 (38.06) | 262 (61.94) | 20 (50.00) | 20 (50.00) |
| Chen C et al. 23 | 19 (14.62) | 111 (85.38) | 5 (25.00) | 15 (75.00) |
| This Study | 4 (9.09) | 40 (90.91) | 7 (31.82) | 15 (68.18) |
FIGURE 2.
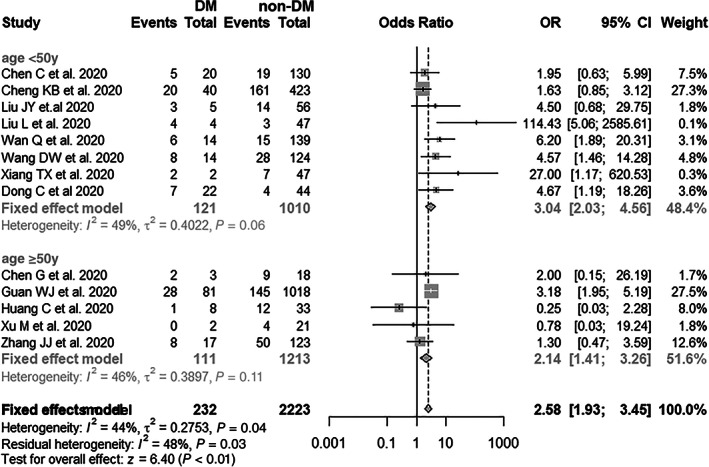
Subgroup analysis of diabetes mellitus (DM) and the risk of COVID‐19 severity (age <50 and ≥50 years)
3.4. Meta‐analysis of the association between diabetes and COVID‐19 fatality
Figure 3A summarizes the association between diabetes and fatality of SARS‐CoV‐2 infection based on six published clinical studies. The total number of patients included in this analysis was 2116, consisting of 62 and 89 fatal COVID‐19 cases in the diabetes (322 cases) and non‐diabetes groups (1794 cases), respectively (Table 4). As the results show, diabetes mellitus was significantly associated with a higher risk of fatality in COVID‐19 patients (pooled OR = 2.95, 95% CI: 1.93–4.53), with a low heterogeneity between studies (I2 = 29%, P = .21). Additionally, subgroup analysis suggested that the pooled OR was 4.19 (95% CI: 2.20–8.00) for patients aged <50 years and 2.54 (95% CI: 1.49–4.33) for patients aged ≥50 years (Figure 4). Sensitivity analysis showed that the exclusion of any single study one at a time did not alter the direction or statistical difference (Figure 3B). Similarly, the funnel plots and Egger's test (t = 0.22, P = .834) did not show the existence of any potential publication bias in the current study (Figure S2B).
FIGURE 3.
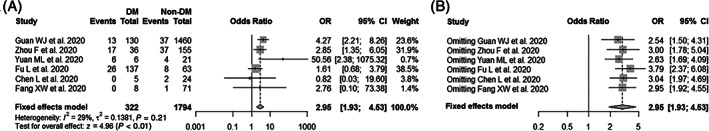
Meta‐analysis of the associations between diabetes mellitus (DM) and COVID‐19 fatality. (A) Forest plot of the COVID‐19 fatality for comparison between patients with and without diabetes; (B) sensitivity analysis of the COVID‐19 fatality for comparison between patients with and without diabetes after excluding any single study one at a time
TABLE 4.
Characteristics of the identified studies on COVID‐19 fatality in patients with and without diabetes
| Author | Non‐diabetes cases, n (%) | Diabetes cases, n (%) | ||
|---|---|---|---|---|
| Survival | Death | Survival | Death | |
| Guan WJ et al.26 | 1423 (97.47) | 37 (2.53) | 117 (90.00) | 13 (10.00) |
| Zhou F et al.27 | 118 (76.13) | 37 (23.87) | 19 (52.78) | 17 (47.22) |
| Yuan ML et al.28 | 17 (80.95) | 4 (19.05) | 0 (0) | 6 (100.00) |
| Fu L et al.29 | 55 (87.30) | 8 (12.70) | 111 (81.02) | 26 (18.98) |
| Chen L et al.30 | 22 (91.67) | 2 (8.33) | 5 (100.00) | 0 (0) |
| Fang XW et al.31 | 70 (98.59) | 1 (1.41) | 8 (100.00) | 0 (0) |
FIGURE 4.
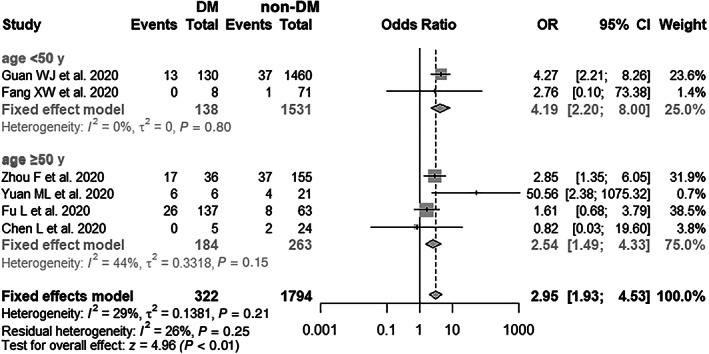
Subgroup analysis of diabetes mellitus (DM) and risk of COVID‐19 fatality (age <50 and ≥50 years)
4. DISCUSSION
To our knowledge, this is the first study to address the effect of diabetes on COVID‐19 severity and the first meta‐analysis to investigate the associations of diabetes with the severity and fatality of SARS‐CoV‐2 infection. As the results show, among our hospitalized cases, the severity rate of SARS‐CoV‐2 infection in patients with diabetes was 31.82%, which was much higher than that in COVID‐19 patients without diabetes (9.09%). In the current meta‐analysis, patients with diabetes with COVID‐19 were shown to have 2.58‐ and 2.95‐fold higher risks of severity and fatality compared with COVID‐19 patients without diabetes, respectively. Indeed, the chronic conditions influencing the severity of SARS‐CoV‐2, such as diabetes, hypertension and obesity, have also been addressed in other respiratory illnesses such as SARS and MERS. For example, Yang et al have reported that the prevalence of known diabetes among dead SARS patients was much higher (21.5%) than in survivors (3.9%). 8 In addition, ORs for severe MERS‐CoV infection have been reported to range from 7.2 to 15.7 in subjects with diabetes. 34 , 35
Although the exact interaction between diabetes and virus infection is not well understood, results from previous studies could partially explain our findings. First, host defence to virus infection is largely mediated by innate immunity and the synthesis of related cytokines, such as interleukins and interferons. 36 However, diabetes and its related conditions can downregulate the immune system by impairing the function of innate immunity, such as chemotaxis, phagocytosis and the activity of neutrophils and macrophages, and then lead to severe illness. 37 Second, the most recent studies report that many patients with a severe and particularly fatal course of COVID‐19 seemed to die from small pulmonary emboli/thrombosis. 38 , 39 Considering that diabetes was significantly associated with the development of myocardial infarction and cerebrovascular thrombosis, it is rational to hypothesize that diabetes might increase poor outcomes of SRAS‐CoV‐2 infection by inducing a hypercoagulable state in COVID‐19 patients. Third, similar to SARS‐CoV, SARS‐CoV‐2 infection is mediated by the binding of its spike protein to the cellular receptor, angiotensin‐converting enzyme 2 (ACE2), which also plays a pivotal role in the development of diabetes. 40 , 41 Furthermore, in addition to the heart and lungs, ACE2 can be expressed in brain, liver, placenta and kidneys, providing a potential mechanism for the severity of symptoms and multi‐organ dysfunction that can be observed in severe COVID‐19 patients. 42 Finally, the results from previous studies report that influenza virus and SARS‐CoV infection could induce a transient elevation of FPG levels. 41 , 43 Although similar effects of SARS‐CoV‐2 infection were not observed in our patients, it cannot be concluded that SARS‐CoV‐2 infection did not affect the FPG level because of the limited sample size in the current study.
Recently, increasing numbers of clinical studies have reported that circulating CRP levels, as well as lymphocyte and neutrophil counts, were significantly associated with COVID‐19 severity. For example, Zhang et al's study in Wuhan reported that the median CRP level was 47.6 mg/L (IQR: 20.6–87.1 mg/L) in severe COVID‐19 patients, which was much higher than in patients with non‐severe COVID‐19. 20 CRP is well known as a sensitive acute‐phase reactant and it plays an instructive role in the acquired immune response. 44 Additionally, both neutrophil and lymphocyte counts were significant predictors of CRP in SARS‐CoV infections. 44 Similarly, our results showed that CRP levels and neutrophil counts were clearly increased in patients with diabetes with a SARS‐CoV‐2 infection. However, no significant difference in lymphocyte counts was observed between COVID‐19 patients with and without diabetes. In addition, our results showed that adjustments for lymphocyte count and CRP could significantly affect the associations between diabetes and COVID‐19 severity (Table S2), indicating that more studies should be conducted to explore the characteristics of inflammation induced by SARS‐CoV‐2 infections in patients with diabetes.
After pooling together studies with a larger sample size, we observed a significant association of diabetes with the severity and fatality of SARS‐COV‐2 infection. Sensitivity analysis with an exclusion of studies one by one did not change the results materially, suggesting that each included study may not have had a particularly strong influence on the results. However, some limitations of our study should be discussed. First, publication bias is inevitable in any meta‐analysis, and relevant articles may have been missed as we only included studies published in English or Chinese. Second, some studies lacked sufficient information to be properly evaluated. For example, most researchers did not provide the exact dates of biomarker measurements such as viral load, lymphocyte counts, CRP, ALT and AST. Additionally, the potential impact of antidiabetic drugs on the outcomes of patients with diabetes was not addressed in most studies. This might weaken the interpretation of our findings. Third, because of the limited number of patients and outcomes in our study, any adjustments made might cause issues with overfitting in the multivariable model. Therefore, more studies with large sample sizes should be conducted to validate our findings, although the adjustment made for potential confounding one at a time neither altered the direction nor statistical difference, except for lymphocyte count and CRP (Table S2). Finally, considering that all the studies included adopted a retrospective study design, there may be bias in regard to collecting medical information in a retrospective manner. Therefore, caution should be taken when interpreting the findings. However, it would be difficult to conduct randomized controlled trials because of ethical issues.
In conclusion, our findings provide new evidence that diabetes could significantly increase the risks of severity and fatality with SARS‐CoV‐2 infection. Given the potentially devastating effects of hyperglycaemia and ketosis on multi‐organ function, intensive monitoring and insulin therapy would be helpful for the improvement of outcomes in patients with diabetes with SARS‐CoV‐2 infection.
CONFLICT OF INTEREST
The authors declare no competing interests.
AUTHOR CONTRIBUTIONS
CD contributed to design of the study, data interpretation and drafting of the manuscript. JW, JZ, XS contributed to data collection, entry, analysis and interpretation. LW, YX, YZ, XL contributed to provision of data, analysis and interpretation. All authors have read and approved the final manuscript.
Supporting information
Table S1 Characteristics and Quality assessment of included studies
Table S2 Associations between diabetes mellitus and COVID‐19 severity by adjusting potential confounding one‐by‐one
Figure S1 Flow diagram of the studies included in the meta‐analysis.
Figure S2 Funnel plot for the articles included in the meta‐analysis for COVID‐19 severity (A) and fatality (B)
ACKNOWLEDGMENTS
The authors thank Yonghong Zhang and Zhirong Guo (Soochow University) for their suggestions on this work. JW, JZ and XS contributed equally to this study.
Wu J, Zhang J, Sun X, et al. Influence of diabetes mellitus on the severity and fatality of SARS‐CoV‐2 (COVID‐19) infection. Diabetes Obes Metab. 2020;22:1907–1914. 10.1111/dom.14105
Peer Review The peer review history for this article is available at https://publons.com/publon/10.1111/dom.14105.
Funding information The National Natural Science Foundation of China (NSFC), Grant/Award Number: 81773507
REFERENCES
- 1. He Z. What further should be done to control COVID‐19 outbreaks in addition to cases isolation and contact tracing measures? BMC Med. 2020;18(1):80. [DOI] [PMC free article] [PubMed] [Google Scholar]
- 2. Jiang X, Rayner S, Luo MH. Does SARS‐CoV‐2 has a longer incubation period than SARS and MERS? J Med Virol. 2020;92(5):476‐478. [DOI] [PMC free article] [PubMed] [Google Scholar]
- 3. Mian A, Khan S. Coronavirus: the spread of misinformation. BMC Med. 2020;18(1):e89. [DOI] [PMC free article] [PubMed] [Google Scholar]
- 4.Coronavirus Outbreak. https://www.worldometers. info/coronavirus/. Accessed April 3, 2020.
- 5. Bloomgarden ZT. Diabetes and COVID‐19. J Diabetes. 2020;12(4):347‐348. [DOI] [PubMed] [Google Scholar]
- 6. Klekotka RB, Mizgała E, Król W. The etiology of lower respiratory tract infections in people with diabetes. Pneumonol Alergol Pol. 2015;83(5):401‐408. [DOI] [PubMed] [Google Scholar]
- 7. Davis TM, Weerarathne T, Foong Y, et al. Community‐acquired infections in type 2 diabetic patients and their nondiabetic partners: The Fremantle Diabetes Study. J Diabetes Complications. 2005;19(5):259‐263. [DOI] [PubMed] [Google Scholar]
- 8. Yang JK, Feng Y, Yuan MY, et al. Plasma glucose levels and diabetes are independent predictors for mortality and morbidity in patients with SARS. Diabet Med. 2006;23(6):623‐628. [DOI] [PubMed] [Google Scholar]
- 9. Garbati MA, Fagbo SF, Fang VJ, et al. A comparative study of clinical presentation and risk factors for adverse outcome in patients hospitalised with acute respiratory disease due to MERS coronavirus or other causes. PLoS One. 2016;11(11):e0165978. [DOI] [PMC free article] [PubMed] [Google Scholar]
- 10. Blind E, Janssen H, Dunder K, et al. The European medicines agency's approval of new medicines for type 2 diabetes. Diabetes Obes Metab. 2018;20(9):2059‐2063. [DOI] [PMC free article] [PubMed] [Google Scholar]
- 11. National Health Commission of the People's Republic of China. Diagnosis and treatment of new coronavirus pneumonitis (trial version 5). http://www.nhc.gov.cn/yzygj/s7653p/202002/3b09b894ac9b4204a79db5b8912d4440.shtml. Accessed Feb 8, 2020.
- 12. American Diabetic Association . Report of the expert committee on the diagnosis and classification of diabetes mellitus. Diabetes Care. 1997;20(7):1183‐1197. [DOI] [PubMed] [Google Scholar]
- 13. Moher D, Liberati A, Tetzlaff J, Altman DG, the PRISMA Group . Preferred reporting items for systematic reviews and meta‐analyses: The PRISMA statement. PLoS Med. 2009;6(7):e1000097. [DOI] [PMC free article] [PubMed] [Google Scholar]
- 14. Wang D, Hu B, Hu C, et al. Clinical characteristics of 138 hospitalized patients with 2019 novel coronavirus‐infected pneumonia in Wuhan, China. JAMA. 2020;2020:e201585. [DOI] [PMC free article] [PubMed] [Google Scholar]
- 15. Chen G, Wu D, Guo W, et al. Clinical and immunologic features in severe and moderate forms of Coronavirus Disease 2019. medRxiv. 2020. 10.1101/2020.02.16.20023903. Accessed Feb 19, 2020. [DOI]
- 16. Liu JY, Liu Y, Xiang P, et al. Neutrophil‐to‐lymphocyte ratio predicts severe illness patients with 2019 novel coronavirus in the early stage. medRxiv. 2020. 10.1101/2020.02.10.20021584. Accessed Feb 12, 2020. [DOI] [PMC free article] [PubMed]
- 17. Wan Q, Shi AQ, He T, et al. Analysis of clinical features of 153 patients with novel coronavirus pneumonia in Chongqing. Chin J Clin Infect Dis. 2020;2020(01):16‐20. [Google Scholar]
- 18. Xu M, Li MD, Zhan WQ, et al. Clinical analysis of 23 cases of 2019 novel coronavirus infection in Xinyang City, Henan Province. Chin Crit Care Med. 2020;32:E010‐E010. [Google Scholar]
- 19. Liu L, Gao JY, Hu WM, et al. Clinical characteristics of 51 patients discharged from hospital with COVID‐19 in Chongqing, China. medRxiv. 2020. 10.1101/2020.02.20.20025536. Accessed Feb 23, 2020. [DOI]
- 20. Zhang J, Dong X, Cao Y, et al. Clinical characteristics of 140 patients infected with SARS‐CoV‐2 in Wuhan, China. Allergy. 2020. 10.1111/all.14238. Accessed Feb 19, 2020. [DOI] [PubMed] [Google Scholar]
- 21. Guan WJ, Ni ZY, Hu Y, et al. Clinical characteristics of coronavirus disease 2019 in China. N Engl J Med. 2020;382:1708‐1720. [DOI] [PMC free article] [PubMed] [Google Scholar]
- 22. Huang C, Wang Y, Li X, et al. Clinical features of patients infected with 2019 novel coronavirus in Wuhan, China. Lancet. 2020;395(10223):497‐506. [DOI] [PMC free article] [PubMed] [Google Scholar]
- 23. Chen C, Chen C, Yan JT, et al. Analysis of myocardial injury in patients with COVID‐19 and association between concomitant cardiovascular diseases and severity of COVID‐19. Chin J Cardiol. 2020;48(0):E008. [DOI] [PubMed] [Google Scholar]
- 24. Cheng KB, Wei M, Shen H, et al. Clinical characteristics of 463 patients with common and severe type coronavirus disease 2019. Shan Med J. 2020;43(S1):1‐15. [Google Scholar]
- 25. Xiang TX, Liu JM, Xu F, et al. Analysis of clinical characteristics of 49 patients with Novel Coronavirus Pneumonia in Jiangxi province. Chin J Resp Crit Care Med. 2020;19(02):154‐160. [Google Scholar]
- 26. Guan WJ, Liang WH, Zhao Y, et al. Comorbidity and its impact on 1,590 patients with COVID‐19 in China: A nationwide analysis. medRxiv. 2020. 10.1101/2020.02.25.20027664. Accessed Feb 27, 2020. [DOI] [PMC free article] [PubMed]
- 27. Zhou F, Yu T, Du R, et al. Clinical course and risk factors for mortality of adult inpatients with COVID‐19 in Wuhan, China: a retrospective cohort study. Lancet. 2020;395(10229):1054‐1062. [DOI] [PMC free article] [PubMed] [Google Scholar]
- 28. Yuan ML, Yin W, Tao ZW, Tan W, Hu Y. Association of radiologic findings with mortality of patients infected with 2019 novel coronavirus in Wuhan, China. PLoS One. 2020;15(3):e0230548. [DOI] [PMC free article] [PubMed] [Google Scholar]
- 29. Fu L, Fei J, Xiang HX, et al. Influence factors of death risk among COVID‐19 patients in Wuhan, China: a hospital‐based case‐cohort study. medRxiv. 2020. 10.1101/2020.03.13.20035329. Accessed Mar 16, 2020. [DOI]
- 30. Chen L, Liu HG, Liu W, et al. Analysis of clinical features of 29 patients with 2019 novel coronavirus pneumonia. Chin J Tuberc Respir Dis. 2020;43(3):E005.203‐208. [DOI] [PubMed] [Google Scholar]
- 31. Fang XW, Mei Q, Yang T, et al. Clinical characteristics and treatment strategies of 79 patients with COVID‐19. Chin Pharmacol Bull. 2020;36(04):453‐459. [Google Scholar]
- 32. Stang A. Critical evaluation of the Newcastle‐Ottawa scale for the assessment of the quality of nonrandomized studies in meta‐analyses. Eur J Epidemiol. 2010;25(9):603‐605. [DOI] [PubMed] [Google Scholar]
- 33. Egger M, Davey Smith G, Schneider M, et al. Bias in meta‐analysis detected by a simple, graphical test. BMJ. 1997;315(7109):629‐634. [DOI] [PMC free article] [PubMed] [Google Scholar]
- 34. Al‐Tawfiq JA, Hinedi K, Ghandour J, et al. Middle East respiratory syndrome coronavirus: a case‐control study of hospitalized patients. Clin Infect Dis. 2014;59(2):160‐165. [DOI] [PMC free article] [PubMed] [Google Scholar]
- 35. Alraddadi BM, Watson JT, Almarashi A, et al. Risk factors for primary middle east respiratory syndrome coronavirus illness in humans, Saudi Arabia, 2014. Emerg Infect Dis. 2016;22(1):49‐55. [DOI] [PMC free article] [PubMed] [Google Scholar]
- 36. Barra NG, Gillgrass A, Ashkar AA. Effective control of viral infections by the adaptive immune system requires assistance from innate immunity. Expert Rev Vaccines. 2010;9(10):1143‐1147. [DOI] [PubMed] [Google Scholar]
- 37. Green WD, Beck MA. Obesity impairs the adaptive immune response to influenza virus. Ann Am Thorac Soc. 2017;14(Suppl 5):S406‐S409. [DOI] [PMC free article] [PubMed] [Google Scholar]
- 38. Connors JM, Levy JH. COVID‐19 and its implications for thrombosis and anticoagulation. Blood. 2020;135(23):2033‐2040. [DOI] [PMC free article] [PubMed] [Google Scholar]
- 39. Casey K, Iteen A, Nicolini R, et al. COVID‐19 pneumonia with hemoptysis: Acute segmental pulmonary emboli associated with novel coronavirus infection. Am J Emerg Med. 2020;S0735‐6757(20):30239‐30244. [DOI] [PMC free article] [PubMed] [Google Scholar]
- 40. Hoffmann M, Kleine‐Weber H, Schroeder S, et al. SARS‐CoV‐2 cell entry depends on ACE2 and TMPRSS2 and is blocked by a clinically proven protease inhibitor. Cell. 2020;181(2):271‐280. [DOI] [PMC free article] [PubMed] [Google Scholar]
- 41. Yang JK, Lin SS, Ji XJ, Guo LM. Binding of SARS coronavirus to its receptor damages islets and causes acute diabetes. Acta Diabetol. 2010;47(3):193‐199. [DOI] [PMC free article] [PubMed] [Google Scholar]
- 42. Bindom SM, Lazartigues E. The sweeter side of ACE2: Physiological evidence for a role in diabetes. Mol Cell Endocrinol. 2009;302(2):193‐202. [DOI] [PMC free article] [PubMed] [Google Scholar]
- 43. Saito T, Yamaguchi I. Effect of glycosylation and glucose trimming inhibitors on the influenza A virus glycoproteins. J Vet Med Sci. 2000;62(6):575‐581. [DOI] [PubMed] [Google Scholar]
- 44. Wang JT, Sheng WH, Fang CT, et al. Clinical manifestations, laboratory findings, and treatment outcomes of SARS patients. Emerg Infect Dis. 2004;10(5):818‐824. [DOI] [PMC free article] [PubMed] [Google Scholar]
Associated Data
This section collects any data citations, data availability statements, or supplementary materials included in this article.
Supplementary Materials
Table S1 Characteristics and Quality assessment of included studies
Table S2 Associations between diabetes mellitus and COVID‐19 severity by adjusting potential confounding one‐by‐one
Figure S1 Flow diagram of the studies included in the meta‐analysis.
Figure S2 Funnel plot for the articles included in the meta‐analysis for COVID‐19 severity (A) and fatality (B)