

Summary
Healthcare workers involved in aerosol‐generating procedures, such as tracheal intubation, may be at elevated risk of acquiring COVID‐19. However, the magnitude of this risk is unknown. We conducted a prospective international multicentre cohort study recruiting healthcare workers participating in tracheal intubation of patients with suspected or confirmed COVID‐19. Information on tracheal intubation episodes, personal protective equipment use and subsequent provider health status was collected via self‐reporting. The primary endpoint was the incidence of laboratory‐confirmed COVID‐19 diagnosis or new symptoms requiring self‐isolation or hospitalisation after a tracheal intubation episode. Cox regression analysis examined associations between the primary endpoint and healthcare worker characteristics, procedure‐related factors and personal protective equipment use. Between 23 March and 2 June 2020, 1718 healthcare workers from 503 hospitals in 17 countries reported 5148 tracheal intubation episodes. The overall incidence of the primary endpoint was 10.7% over a median (IQR [range]) follow‐up of 32 (18–48 [0–116]) days. The cumulative incidence within 7, 14 and 21 days of the first tracheal intubation episode was 3.6%, 6.1% and 8.5%, respectively. The risk of the primary endpoint varied by country and was higher in women, but was not associated with other factors. Around 1 in 10 healthcare workers involved in tracheal intubation of patients with suspected or confirmed COVID‐19 subsequently reported a COVID‐19 outcome. This has human resource implications for institutional capacity to deliver essential healthcare services, and wider societal implications for COVID‐19 transmission.
Keywords: airway, COVID‐19, coronavirus, healthcare workers, intubation
요약
기관 삽관과 같은 에어로졸을 생성하는 시술에 관여하는 의 료 종사자는 COVID‐19에 걸릴 위험이 높아질 수 있다. 그러 나 그 위험의 크기는 알려져 있지 않다. 저자들은 COVID‐19 가 의심되거나 확인된 환자의 기관 삽관에 참여한 의료 종사 자를 모집하는 전향적 국제 다기관 코호트 연구를 수행하였 다. 기관 삽관 에피소드, 개인 보호장비 사용 및 이후 시술자 건강 상태에 대한 정보를 자가 보고(self‐reporting)를 통해 수집하였다. 일차 평가변수는 기관 삽관 후 자가 격리 또는 입 원이 필요한 검사실 확인 COVID‐19 진단(laboratory‐con‐ firmed COVID‐19 diagnosis) 또는 새로운 증상의 발현이었 다. 일차 평가변수와 의료 종사자 특성, 시술 관련 요인 및 개 인 보호장비 사용과의 연관성을 콕스 회귀분석(Cox regres‐ sion analysis)을 이용하여 조사하였다. 2020년 3월 23일부터 6월 2일까지 17개국의 503개 병원에서 1718명의 의료 종사자 들이 기관 삽관 에피소드 5148건을 보고하였다. 일차 평가변 수의 전체 발생률은 32일의 중앙값(사분범위[범위]: 18‐48일 [0‐116일]) 추적관찰 동안 10.7%였다. 첫 번째 기관 삽관 이후, 7일, 14일, 21일 이내 누적 발생률은 각각 3.6%, 6.1%, 8.5%였 다. 일차 평가변수의 위험은 국가별로 다양하였으며 여성에서 더 높았지만, 다른 요인과는 관련이 없었다. COVID‐19가 의심 되거나 확인된 환자의 기관 삽관에 관여한 의료 종사자 10명 중 약 1명은 후속적으로 COVID‐19 결과를 보고하였다. 이는 필수적인 의료 서비스를 제공할 수 있는 기관 역량에 대한 인 적 자원 측면의 영향과 COVID‐19 전파에 대한 더욱 광범위한 사회적 영향을 미친다.
Introduction
Severe acute respiratory syndrome coronavirus 2 (SARS‐CoV‐2) is transmitted by exposure to asymptomatic carriers or patients with coronavirus disease 2019 (COVID‐19). As cases of COVID‐19 continue to rise globally, there are increasing concerns about the risks of SARS‐CoV‐2 transmission to healthcare workers involved in direct patient care. During the SARS‐CoV‐1 outbreak, healthcare workers were disproportionately affected, comprising 21% of those infected [1]. Some of those at greatest risk were involved in aerosol‐generating procedures [2].
There are currently no prospective procedure‐specific data during the current COVID‐19 pandemic. However, based on SARS‐CoV‐1 data, tracheal intubation is thought to pose the greatest risk of nosocomial transmission of COVID‐19 to healthcare workers [3]. In response, interventions such as the appropriate use of personal protective equipment (PPE) [4] and specific procedural techniques [5, 6] have been implemented. Healthcare workers who develop suspected or confirmed COVID‐19 require self‐isolation and may need hospitalisation. The magnitude of this risk is important to inform clinicians in their daily practice [7]; demonstrate the ramifications to clinical workforce; and consider the societal implications of nosocomial COVID‐19 in healthcare workers. However, we currently lack data to estimate the scale of this risk.
To better understand the hazards to healthcare workers caring for patients with suspected or confirmed COVID‐19, we designed a self‐reporting provider registry to collect data on nosocomial exposure, procedural performance, use of PPE and subsequent COVID‐19–related outcomes after tracheal intubation. We aimed to determine the incidence and risk factors for developing COVID‐19 in healthcare workers after their involvement in tracheal intubation. These data can inform clinicians, policy‐makers and the wider public of the potential hazards of tracheal intubation to the healthcare workforce and society.
Methods
We adhered to the Strengthening the Reporting of Observational Studies in Epidemiology (STROBE) guidelines [8]. The intubateCOVID registry was launched on 23 March 2020 as an investigator‐led, prospective multicentre cohort study recruiting healthcare workers performing or assisting in tracheal intubation of patients with suspected or confirmed COVID‐19 across 17 countries. Information on the registry was disseminated via national and international professional organisations and social media. Individual provider registration and subsequent data submission were completely voluntary, and all participants gave consent for inclusion of their data in this study. Registry data were collected via a web‐based database (Knack.com, Evenly Odd, Inc., Philadelphia, Pennsylvania, USA). At registration, participants recorded their own baseline characteristics, and thereafter utilised the registry to record details of any tracheal intubation procedures they were involved in, and to self‐report follow‐up outcomes related to their COVID‐19 infection status. Details of all data variables collected in the registry are available in the Supporting Information, Appendix S1. Data collection for the registry is ongoing, but the present analysis of data reported to date was undertaken to ensure timely dissemination of results that would potentially guide clinical practice during the COVID‐19 pandemic.
Institutional review at the lead site in the UK, Guy’s and St Thomas’ NHS Foundation Trust, determined the project did not require ethics approval based on the UK Health Research Authority guidance on service evaluations (Service Evaluation ID: 10769). Similar determinations were obtained subsequently by at least one site in all other participating countries. Further details of governance approvals in other jurisdictions are available at https://intubatecovid.org/supporting-documents. Data are stored and processed in compliance with European Union (EU) General Data Protection Regulations and the EU‐US Privacy Shield Framework.
Due to international variation in patient testing and changing patient case definitions at different points during the pandemic, the COVID‐19 status of patients requiring tracheal intubation (either suspected or confirmed) was reported by participants based on local convention. Other details of tracheal intubation procedures were also collected (Supporting Information, Appendix S1), including devices used, number of attempts at tracheal intubation and PPE used.
Emails were sent each week to participants on Fridays at 0900 hrs GMT + 1, reminding them to report their COVID‐19 infection status as one of the following four options: laboratory‐confirmed COVID‐19; admission to hospital with COVID‐19–related symptoms; self‐isolation due to COVID‐19–related symptoms; or no COVID‐19 symptoms or diagnosis. Participants were encouraged to report their infection status on multiple occasions over time. Data collection included the date of reported status, and the presence of any of the following symptoms: fatigue; cough; sore throat; headache; myalgia; fever; loss of smell or taste; breathlessness; diarrhoea; nausea or vomiting; abdominal pain; or photophobia. As participants were enrolled at different times during the study, depending on when the registry opened in their respective countries and institutions, follow‐up times were variable depending on enrolment date relative to the date of data extraction. The primary endpoint of the study was a composite outcome of either new laboratory‐confirmed COVID‐19 or new COVID‐19 symptoms requiring self‐isolation or hospitalisation [9].
Participant and tracheal intubation characteristics were summarised with categorical variables expressed as frequencies and percentages and continuous variables as mean (SD) or median (IQR [range]). Follow‐up time was defined as the time elapsed between the first tracheal intubation reported and either the first reported positive COVID‐19–related outcome, or the latest follow‐up if no positive COVID‐19–related outcomes were reported. Kaplan–Meier estimates were plotted to illustrate the cumulative incidence of the primary endpoint over follow‐up time. Kaplan–Meier estimates of the cumulative incidences of both the primary endpoint and its components over follow‐up were tabulated at 7, 14 and 21 days and the frequency and proportion of reported symptoms were summarised. Associations between patient and tracheal intubation characteristics and the primary endpoint were investigated using univariable and multivariable Cox proportional hazards models. Since characteristics tended to differ between intubations within participants, procedural variables were included as time‐updated covariates. We selected significant variables on univariable modelling to enter as covariates into our multivariable model. No adjustments were made for multiple testing and therefore all analyses should be considered exploratory. To account for multiple tracheal intubations reported by participants, cumulative incidences were also plotted for time from every tracheal intubation, ignoring within‐participant dependence, and time from the most recent tracheal intubation, with censoring at the participant’s subsequent tracheal intubation. To investigate whether performing an increased number of tracheal intubations led to a higher incidence of the primary endpoint, Kaplan–Meier curves from the first, second and third tracheal intubation were compared. There were no missing data from our baseline covariates; missing outcomes were handled as censored outcome variables as is standard for time‐to‐event modelling. No sample size calculation was performed before data collection and analysis, and a convenience sample was used. All analyses were performed using Stata version 16.0 (StataCorp., Texas, USA) or R version 3.5.2 (R Foundation for Statistical Computing, Vienna, Austria). A two‐sided significance level of 0.05 was used unless otherwise stated.
Results
Data were submitted by participants from 503 hospitals in 17 countries. Between 23 March and 2 June 2020, 2182 participants recorded at least one tracheal intubation in the registry, and 6320 tracheal intubations were reported. Participants recorded a median (IQR [range]) of two (1–3 [1–42]) tracheal intubations (Table S1 in Appendix S1, Supporting Information). We analysed 5148 tracheal intubations by 1718 participants who recorded at least one tracheal intubation and one follow‐up (Table 1; Fig. 1).
Table 1.
Participant characteristics according to primary endpoint status. a Values are mean (SD) or number (proportion).
|
All participants n = 1718 |
Primary endpoint present | ||
|---|---|---|---|
| Yes | No | ||
| n = 184 | n = 1534 | ||
| Age; years | 41.5 (8.7) | 41.3 (8.3) | 41.6 (8.7) |
| Female | 692 (40.3%) | 89 (48.4%) | 603 (39.3%) |
| Speciality | |||
| Anaesthesia | 1428 (83.1%) | 150 (81.5%) | 1278 (83.3%) |
| Intensive care medicine | 251 (14.6%) | 31 (16.8%) | 220 (14.3%) |
| Emergency medicine | 28 (1.6%) | 3 (1.6%) | 25 (1.6%) |
| Other b | 11 (0.6%) | 0 | 11 (0.7%) |
| Professional status | |||
| Senior physician | 1205 (70.1%) | 127 (69.0%) | 1078 (70.3%) |
| Junior physician | 353 (20.5%) | 39 (21.2%) | 314 (20.5%) |
| Non‐physician c | 160 (9.3%) | 18 (9.8%) | 142 (9.3%) |
| Country | |||
| UK | 835 (48.6%) | 107 (58.2%) | 728 (47.5%) |
| USA | 377 (21.9%) | 32 (17.4%) | 345 (22.5%) |
| Australia | 128 (7.5%) | 11 (6.0%) | 117 (7.6%) |
| Sweden | 79 (4.6%) | 13 (7.1%) | 66 (4.3%) |
| Ireland | 34 (2.0%) | 6 (3.3%) | 28 (1.8%) |
| Other d | 265 (15.4%) | 15 (8.2%) | 250 (16.3%) |
Lab‐confirmed COVID‐19 diagnosis, self‐isolation due to symptoms or hospital admission with ≥ 1 symptom.
Ear nose and throat; head and neck; maxillofacial surgery; and respiratory medicine.
Including advanced critical care practitioner, anaesthesia associate, certified registered nurse anaesthetist, operating department practitioner, paramedic, physician associate and registered nurse.
Countries with < 5 reported primary outcomes each, comprising Canada; Chile; China; Germany; India; Italy; Netherlands; New Zealand; Pakistan; Poland; Singapore; and South Africa.
Figure 1.
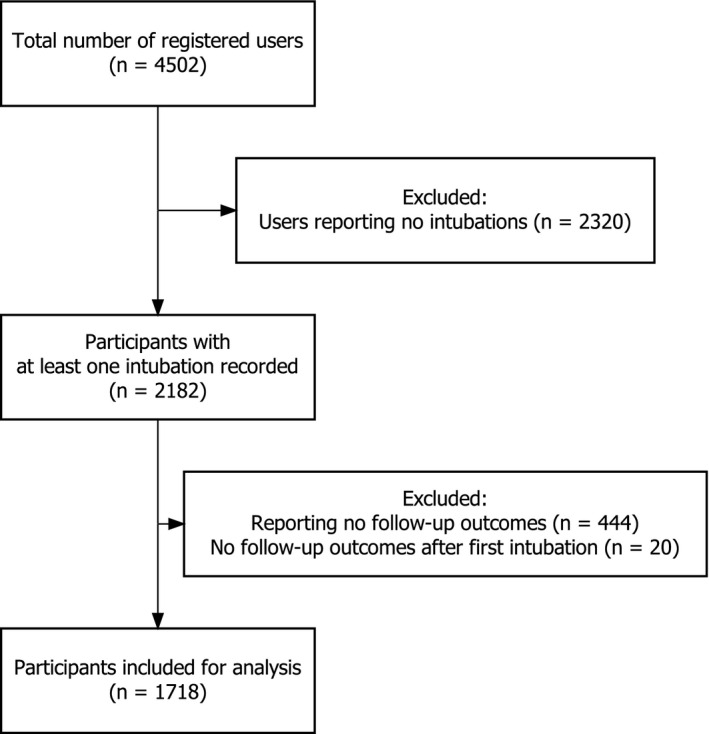
Flowchart of participants included in this study.
The three most frequently reported indications for performing tracheal intubation were respiratory failure (3666, 67.1%), general anaesthesia for surgery (714, 13.1%) and tracheal tube exchange (308, 5.6%). Approximately half of reported tracheal intubations were performed in critical care units (2783, 50.9%). Characteristics of reported tracheal intubations are summarised in Table 2.
Table 2.
Procedure characteristics according to primary endpoint status, a Values are number (proportion)
| Procedure characteristics |
All tracheal intubations n = 5148 |
Primary endpoint present | |
|---|---|---|---|
| Yes | No | ||
| n = 462 | n = 4686 | ||
| PPE WHO standard met | 4519 (87.8%) | 403 (87.2%) | 4116 (87.8%) |
| Confirmed COVID‐19 status of patient | 3128 (60.8%) | 308 (66.7%) | 2820 (60.2%) |
| Involvement | |||
| Assistant | 1451 (28.2%) | 149 (32.3%) | 1302 (27.8%) |
| Intubator/laryngoscopist | 3697 (71.8%) | 313 (67.7%) | 3384 (72.2%) |
| Location | |||
| ICU | 2653 (51.5%) | 218 (47.2%) | 2435 (52.0%) |
| ED | 799 (15.5%) | 70 (15.2%) | 729 (15.6%) |
| General ward | 796 (15.5%) | 114 (24.7%) | 682 (14.6%) |
| Operating theatre suite | 774 (15.0%) | 53 (11.5%) | 721 (15.4%) |
| Labour ward | 14 (0.3%) | 0 (0.0%) | 14 (0.3%) |
| Other | 112 (2.2%) | 7 (1.5%) | 105 (2.2%) |
| Indication | |||
| Deteriorating respiratory failure | 3485 (67.7%) | 334 (72.3%) | 3151 (67.2%) |
| General anaesthetic for surgery | 652 (12.7%) | 41 (8.9%) | 611 (13.0%) |
| Tube exchange | 298 (5.8%) | 19 (4.1%) | 279 (6.0%) |
| Elective tracheostomy insertion | 257 (5.0%) | 25 (5.4%) | 232 (5.0%) |
| Airway protection for low GCS | 233 (4.5%) | 24 (5.2%) | 209 (4.5%) |
| Cardiac arrest | 149 (2.9%) | 14 (3.0%) | 135 (2.9%) |
| Other airway manipulation on ICU | 62 (1.2%) | 5 (1.1%) | 57 (1.2%) |
| Other indication | 12 (0.2%) | 0 (0.0%) | 12 (0.3%) |
| Number of staff in tracheal intubation room | |||
| 1 | 12 (0.2%) | 1 (0.2%) | 11 (0.2%) |
| 2 | 396 (7.7%) | 22 (4.8%) | 374 (8.0%) |
| 3 | 2831 (55.0%) | 258 (55.8%) | 2573 (54.9%) |
| 4 | 1092 (21.2%) | 120 (26.0%) | 972 (20.7%) |
| 5+ | 816 (15.9%) | 61 (13.2%) | 755 (16.1%) |
| Rapid sequence induction | 3306 (64.2%) | 332 (71.9%) | 2974 (63.5%) |
| First attempt device | |||
| Videolaryngoscope | 3918 (76.1%) | 353 (76.4%) | 3565 (76.1%) |
| Direct laryngoscope | 996 (19.3%) | 88 (19.0%) | 908 (19.4%) |
| Tracheostomy/front‐of‐neck airway | 185 (3.6%) | 20 (4.3%) | 165 (3.5%) |
| Fibreoptic tracheal intubation | 49 (1.0%) | 1 (0.2%) | 48 (1.0%) |
| Number of attempts | |||
| 1 | 4653 (90.4%) | 421 (91.1%) | 4232 (90.3%) |
| 2 | 392 (7.6%) | 31 (6.7%) | 361 (7.7%) |
| 3+ | 103 (2.0%) | 10 (2.2%) | 93 (2.0%) |
| Apnoeic oxygenation | |||
| Facemask oxygen | 1695 (32.9%) | 136 (29.4%) | 1559 (33.3%) |
| High‐flow nasal oxygenation | 329 (6.4%) | 18 (3.9%) | 311 (6.6%) |
| Conventional nasal cannula | 207 (4.0%) | 18 (3.9%) | 189 (4.0%) |
| None of the above | 2917 (56.7%) | 290 (62.8%) | 2627 (56.1%) |
| Bag‐mask ventilation | 827 (16.1%) | 72 (15.6%) | 755 (16.1%) |
| Supraglottic airway device | 155 (3.0%) | 11 (2.4%) | 144 (3.1%) |
| Final airway management device | |||
| Tracheal tube | 4823 (93.7%) | 435 (94.2%) | 4388 (93.6%) |
| Elective tracheostomy | 279 (5.4%) | 25 (5.4%) | 254 (5.4%) |
| Supraglottic airway device | 26 (0.5%) | 1 (0.2%) | 25 (0.5%) |
| Emergency front‐of‐neck airway | 14 (0.3%) | 1 (0.2%) | 13 (0.3%) |
| Patient woken up | 6 (0.1%) | 0 (0.0%) | 6 (0.1%) |
ED, emergency department; GCS, Glasgow Coma Scale; ICU, intensive care unit; PPE, personal protective equipment; WHO, World Health Organization.
Lab‐confirmed COVID‐19 diagnosis, self‐isolation due to symptoms or hospital admission with ≥ 1 symptom.
The majority (4800, 87.9%) of tracheal intubations were performed with participants wearing PPE conforming to World Health Organization (WHO) recommended minimum standards for aerosol‐generating procedures (gown; gloves; eye protection; and respirator masks certified to N95 or FFP2 or FFP3 or equivalent standard) [10]. Specific PPE combinations varied across participants (Fig. 2). The use of respirator masks varied geographically, for example in the USA, N95 respirator masks (71.6%) and powered air‐purifying respirators (43.4%) were used more commonly than in the UK, where participants more frequently used FFP3/N100 respirator masks (89.3%).
Figure 2.
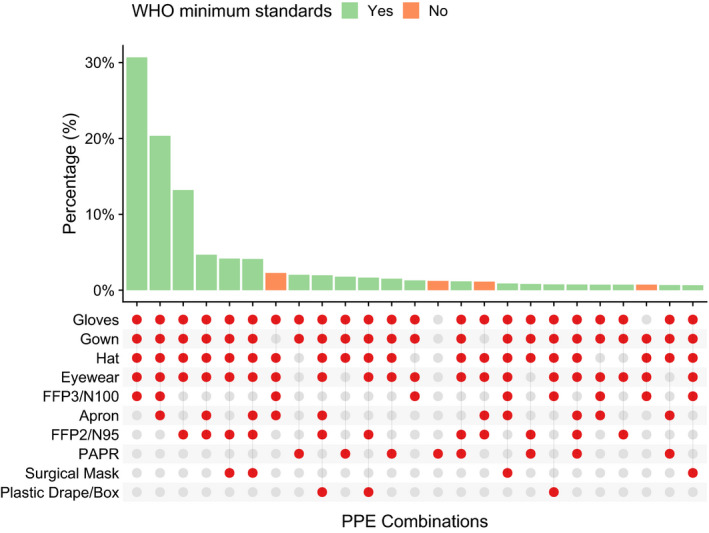
Plot showing the 25 most common combinations of personal protective equipment used in 5148 reported tracheal intubations. WHO, World Health Organization; PAPR, powered air‐purifying respirator; PPE, personal protective equipment.
Among participants, the median (IQR [range]) follow‐up from the first reported tracheal intubation was 32 (18–48 [0–116]) days. A follow‐up period of at least 21 days was available for 1192 participants (69.4%). A total of 184 participants (10.7%) met the primary endpoint, of whom 144 (8.4%) reported symptomatic self‐isolation, 53 (3.1%) reported laboratory‐confirmed COVID‐19 infection and 2 (0.1%) participants reported hospital admission with COVID‐19 symptoms. The most frequently reported COVID‐19 symptoms (Fig. 3, Table S2 in Appendix S1) among those with a primary outcome were fatigue (111, 60.3%), cough (102, 55.4%) and sore throat (100, 54.4%). Breathlessness was reported infrequently (35, 19.0%).
Figure 3.
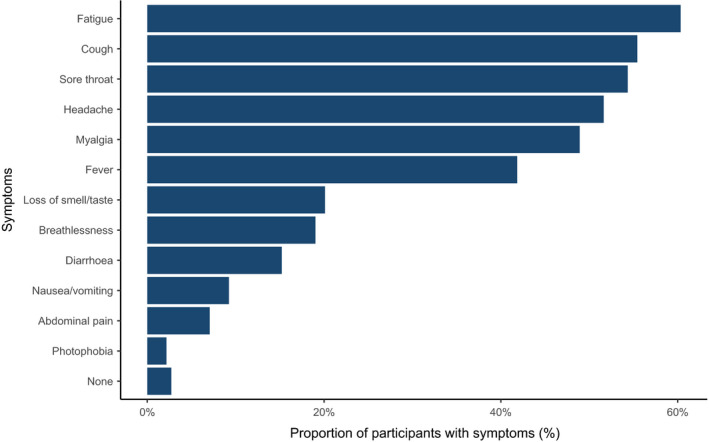
Symptoms reported in the 184 participants meeting the primary endpoint.
Cumulative incidences of the outcomes for 7, 14 and 21 days after the first tracheal intubation episode are shown in Table 3. Cumulative incidence plots (Fig. 4) for the primary outcome from the first tracheal intubation; most recent tracheal intubation; and any tracheal intubation, showed similar incidence rates regardless of the starting point of follow‐up.
Table 3.
Summary of clinical outcomes in 1718 participants. Values are number (proportion), number or proportion (95%CI).
| Outcome | Total incidence a | Cumulative incidence b | |||||
|---|---|---|---|---|---|---|---|
| n | 7 days | n | 14 days | n | 21 days | ||
| Reported COVID‐19 composite c | 184 (10.7%) | 60 |
3.6% (2.8–4.6) |
100 |
6.1% (5.1–7.4) |
133 |
8.5% (7.2–10.0) |
| Self‐isolation | 144 (8.4%) | 49 |
2.9% (2.2–3.9) |
80 |
4.9% (4.0–6.1) |
104 |
6.7% (5.5–8.1) |
| Laboratory‐confirmed COVID‐19 | 53 (3.1%) | 12 |
0.7% (0.4–1.3) |
26 |
1.6% (1.1–2.4) |
39 |
2.6% (1.9–3.5) |
| Hospital admission with ≥ 1 symptom | 2 (0.1%) | 1 |
0.1% (0.0–0.4) |
1 |
0.1% (0.0–0.4) |
1 |
0.1% (0.0–0.4) |
| Composite of laboratory‐confirmed COVID‐19 and hospital admission with ≥ 1 symptom | 54 (3.1%) | 13 |
0.8% (0.5–1.3) |
26 |
1.6% (1.1–2.4) |
39 |
2.6% (1.9–3.5) |
Over the whole duration from 23 March to 2 June 2020.
Kaplan–Meier estimates, from the date of first tracheal intubation.
Lab‐confirmed COVID‐19 diagnosis, self‐isolation due to symptoms, hospital admission with ≥ 1 symptom.
Figure 4.
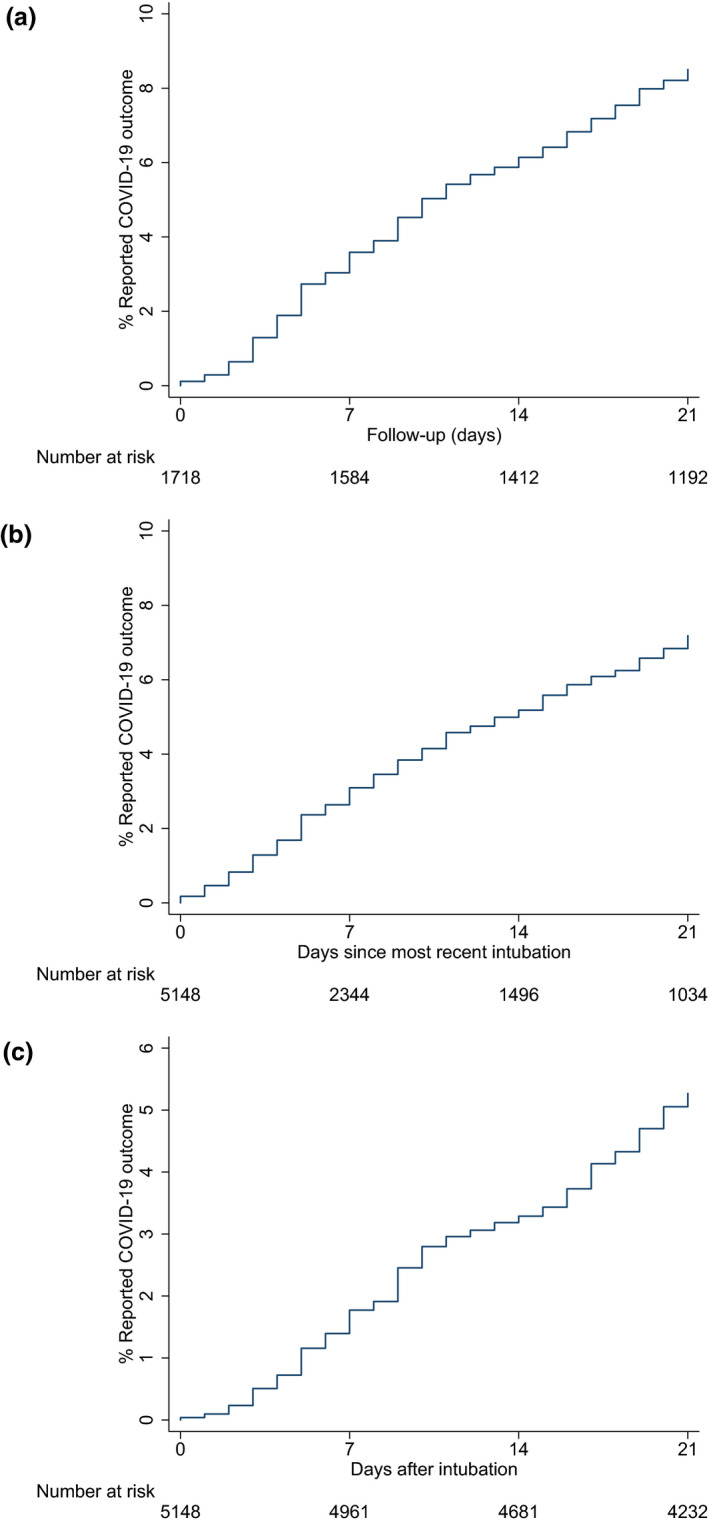
Plots of the cumulative incidence of primary endpoint over the follow‐up period from first tracheal intubation (a), most recent tracheal intubation (b) and from any tracheal intubation (c).
Univariable associations using Cox regression models indicated a significantly higher incidence of the primary endpoint of COVID‐19 infection between countries, in women and in assistants vs. intubators (Table 4), the latter which was attenuated in a multivariable analysis. In a multivariable model, between‐country differences and increased hazards for developing the primary endpoint in women persisted. No other significant associations were identified with other factors. The hazard rate for the primary endpoint appeared reasonably constant over time from tracheal intubation.
Table 4.
Associations between participant and procedural characteristics and the incidence of reporting the primary endpoint.
| Univariable analysis a | Multivariable analysis b | |||
|---|---|---|---|---|
| HR (95%CI) | p value | HR (95%CI) | p value | |
| Participant characteristics | ||||
| Age; years | 0.99 (0.98–1.01) | 0.56 | ||
| Female | 1.44 (1.08–1.93) | 0.01 | 1.36 (1.01–1.82) | 0.04 |
| Specialty | 0.98 | |||
| Anaesthesia | Reference group | |||
| Intensive care medicine | 1.09 (0.74–1.60) | |||
| Emergency medicine | 0.98 (0.31–3.07) | |||
| Grade | 0.74 | |||
| Senior physician | Reference group | |||
| Junior physician | 1.09 (0.76–1.57) | |||
| Non‐physician | 1.19 (0.73–1.95) | |||
| Country | 0.01 | 0.04 | ||
| UK | Reference group | Reference group | ||
| USA | 0.72 (0.48–1.07) | 0.73 (0.49–1.09) | ||
| Australia | 0.72 (0.39–1.34) | 0.78 (0.42–1.46) | ||
| Sweden | 1.40 (0.79–2.49) | 1.39 (0.78–2.48) | ||
| Ireland | 1.51 (0.66–3.43) | 1.57 (0.69–3.58) | ||
| Other | 0.46 (0.27–0.79) | 0.51 (0.29–0.88) | ||
| Procedural characteristics | ||||
| PPE WHO standard | 0.97 (0.63–1.51) | 0.91 | ||
| Patient‐confirmed COVID‐19 | 0.98 (0.73–1.32) | 0.90 | ||
| Intubator/laryngoscopist (vs. assistant) | 0.67 (0.50–0.92) | 0.01 | 0.76 (0.56–1.04) | 0.08 |
| Number of attempts> 1 | 1.08 (0.68–1.71) | 0.76 | ||
| Device | 0.99 | |||
| Videolaryngoscope | Reference group | |||
| Direct laryngoscope | 1.00 (0.70–1.44) | |||
| Tracheostomy | 0.97 (0.36–2.62) | |||
| Apnoeic oxygenation | 0.84 (0.63–1.14) | 0.27 | ||
| Bag‐mask ventilation | 0.81 (0.54–1.23) | 0.33 | ||
| Supraglottic airway device | 1.40 (0.66–2.97) | 0.39 | ||
| Days from last procedure | 0.93 | |||
| 1–3 | Reference group | |||
| 4–6 | 1.05 (0.58–1.91) | |||
| 7–9 | 1.07 (0.56–2.05) | |||
| 10–12 | 0.94 (0.45–1.98) | |||
| 13–15 | 1.18 (0.53–2.62) | |||
| 16–18 | 0.63 (0.26–1.52) | |||
| 19–21 | 1.28 (0.53–3.06) | |||
| 22+ | 0.90 (0.45–1.78) | |||
Where procedural characteristics are analysed as time‐updated variables.
Analysing one variable at a time in a Cox model.
including all variables simultaneously in a multivariable Cox model.
PPE, personal protective equipment; WHO, World Health Organization.
Discussion
We report a unique study of 1718 healthcare workers performing tracheal intubations on COVID‐19 patients across 503 hospitals in 17 countries. After a median follow‐up of 32 days from the first tracheal intubation episode, 10.7% of participants reported self‐isolation or hospitalisation with new symptoms, or laboratory confirmation of COVID‐19 after tracheal intubation episodes in patients with suspected or confirmed COVID‐19. The incidence of our primary endpoint increased over time from 3.6% within 7 days, to 6.1% within 14 days and 8.5% within 21 days of participants’ first recorded tracheal intubation episodes. Other than country and female sex, there were no other observable associations between clinician characteristics, procedural factors or PPE utilisation and the primary endpoint. The increased incidence of the primary endpoint in women, which persisted after multivariable adjustment in our modelling, supports future research into sex differences for COVID‐19 transmission and disease severity.
Tracheal intubation has previously been highlighted as a high‐risk aerosol‐generating procedure, with an OR of transmission of 6.6 for SARS‐CoV‐1 when compared with unexposed healthcare workers [2]. However, the incidence of infection in healthcare workers involved in tracheal intubation of suspected or confirmed COVID‐19 is unknown, and it is unclear which elements of the procedure may contribute to increased risk, if any. In examining the procedure‐related characteristics, we identified women as being at increased risk of reporting a COVID‐19 outcome. The reasons for this finding are unclear, and may point to biological differences between men and women, differences in symptom‐reporting behaviour or variations arising from heterogenous sex distributions in our sample. This warrants future research to fully understand the underlying mechanisms. Furthermore, we did not detect an association with the use of PPE in accordance with WHO standards, although perhaps the wide range of combinations of PPE reported may have hampered our ability to elucidate any relationship. Regardless, a significant concern highlighted by the data is the insufficient utilisation of PPE in more than 12% of cases. Although the reasons for deficiencies in PPE utilisation are beyond the scope of these data, this finding might reflect global concerns of PPE scarcity [11, 12, 13].
Although we are unable to ascribe a causal relationship between tracheal intubation and a COVID‐19 outcome, best estimates of population prevalence suggests that the outcomes reported herein may not be due exclusively to community exposure [4, 14, 15, 16, 17, 18]. There is little evidence that participant exposure was solely from the community. Data from the UK estimated a 2‐week community prevalence of laboratory‐confirmed COVID‐19 of approximately 0.27% [18], whereas population prevalence data estimate a US population infection rate of 0.7% and just 0.07% [16] in the European Union and UK. Variability in national, regional and local prevalence based on the disease spread geospatially and temporally [19], as well as differences in testing and reporting, hampers our ability to make direct comparisons with aggregate population‐level data.
Regardless of the exposure source, our results have significant implications for individual healthcare workers, the workforce and wider society. Self‐isolation due to symptoms or laboratory‐confirmed COVID‐19 of potentially a tenth of the workforce involved in tracheal intubation means that institutions should consider building capacity and resilience in workforce planning during this pandemic and thereafter [20]. Diminishing the availability of vital, highly trained health providers means that institutions may have a shortfall in their capacity to deliver essential healthcare services to both COVID‐19 and non‐COVID‐19 patients. At a public health level, household members of these clinicians will also face the requirement for self‐quarantine and are at risk of subsequently contracting the disease, thus amplifying the potential implications of healthcare worker infection. Similarly, other patients and the public may also become exposed to clinicians who develop COVID‐19, further perpetuating transmission beyond hospital walls. Of note, 7% of healthcare workers have been shown to be asymptomatic viral carriers based on reverse transcriptase polymerase chain reaction testing [17] and up to 44% may be asymptomatic seroconverters of immunoglobulins to SARS‐CoV‐2 [21]. One potential interpretation of these findings could be that our results may be underestimating the infection rate in clinicians involved in tracheal intubation, as a proportion of those without reported COVID‐19 outcomes in our study may be asymptomatic carriers. Therefore, policies for regular testing of those at greatest risk to personal and public health may be valuable. This could identify both asymptomatic carriers [17], as well as healthcare workers whose symptoms may be consistent with COVID‐19 but are due to alternative pathology.
Our study has several strengths. Firstly, we draw data from the largest international prospective database of high‐risk aerosol‐generating procedures globally that continues to collect surveillance data that can help inform practice. This may become increasingly relevant as further waves of COVID‐19 outbreaks emerge, allowing a comparative understanding of changes in practice and risk of healthcare workers. The follow‐up rate of participants after reporting tracheal intubation episodes in our cohort was high, providing validity to our findings. Moreover, the participant characteristics were representative of the clinicians and other healthcare workers likely to be involved in tracheal intubation. Finally, we report prospective data that have not been available from any pandemic or epidemic literature to date.
Some limitations must be discussed. Firstly, as healthcare workers involved in tracheal intubation may be exposed to SARS‐CoV‐2 from other sources, direct causality linked to tracheal intubations per se cannot be demonstrated. Secondly, asymptomatic seroconversion was not accounted for. Thus, the true incidence of infection may have been underestimated due to the prevalence of asymptomatic carrier states. Similarly, the reporting of critical illness and death was not feasible in the registry, potentially leading to a source of bias. Thirdly, the data were self‐reported, which carries inherent pitfalls. However, this possibility is minimised using fixed‐choice questions, as well as highly motivated participants reporting their tracheal intubation episodes contemporaneously. Participants continued to document tracheal intubation episodes regularly and recorded weekly outcomes throughout the study duration. Fourth, there is a risk of sampling bias stemming from the voluntary nature of study participation, and the healthcare providers engaging in this study may represent a small subset with clinical performance characteristics that are not representative of the larger community. Fifth, our analyses are limited to the aerosol‐generated procedures reported herein, and do not apply to other procedures associated with risks to healthcare professionals. Lastly, the lack of a control group hampers our full ability to contextualise these findings. Therefore, cautious interpretation of these results is encouraged.
In conclusion, approximately 10% of healthcare workers in our sample were either diagnosed with new COVID‐19 infection or required self‐isolation or hospitalisation with new symptoms following involvement in tracheal intubation of patients with suspected or confirmed COVID‐19. This information should inform decision‐making and planning of safe and sustainable delivery of healthcare services globally. Future work should focus on screening and identifying interventions to reduce risks to healthcare workers providing care for COVID‐19 patients.
Supporting information
Appendix S1. Additional information regarding the study.
Acknowledgements
KE and DW contributed equally to this article. This study received financial support from the Difficult Airway Society (UK), the American Society of Anesthesiologists, the International Anesthesia Research Society and the Anesthesia Patient Safety Foundation. The endorsing organisations are listed in Supplementary Table S4 in Appendix S1. KE is an Editor of Anaesthesia and this manuscript underwent external review. No other funding or competing interests declared.
This article is accompanied by an editorial by Kakodkar et al., Anaesthesia 2020; 75: 1415–9 and an editorial by Crawley et al., Anaesthesia 2020; 75: 1420–3
[Correction added on 8 January 2021, after first online publication: Twitter username for author M. Jonsson Fagerlund has been corrected in this version]
References
- 1. World Health Organization . Summary of probable SARS cases with onset of illness from 1 November 2002 to 31 July 2003. Emergencies Preparedness, Response 2004. https://www.who.int/csr/sars/country/table/en (accessed 01/05/2020).
- 2. Tran K, Cimon K, Severn M, et al. Aerosol generating procedures and risk of transmission of acute respiratory infections to healthcare workers: a systematic review. PLoS One 2012; 7: e35797. [DOI] [PMC free article] [PubMed] [Google Scholar]
- 3. Weissman DN, de Perio MA, Radonovich LJ. COVID‐19 and risks posed to personnel during endotracheal intubation. Journal of the American Medical Association 2020; 323: 2027–28. [DOI] [PMC free article] [PubMed] [Google Scholar]
- 4. Sorbello M, El‐Boghdadly K, Di Giacinto I, et al. The Italian coronavirus disease 2019 outbreak: recommendations from clinical practice. Anaesthesia 2020; 75: 724–32. [DOI] [PubMed] [Google Scholar]
- 5. Canelli R, Connor CW, Gonzalez M, et al. Barrier enclosure during endotracheal intubation. New England Journal of Medicine 2020; 382: 1957–8. [DOI] [PMC free article] [PubMed] [Google Scholar]
- 6. Cook TM, El‐Boghdadly K, McGuire B, et al. Consensus guidelines for managing the airway in patients with COVID‐19. Anaesthesia 2020; 75: 785–99. [DOI] [PMC free article] [PubMed] [Google Scholar]
- 7. Rosenbaum L. Harnessing our humanity — how Washington’s health care workers have risen to the pandemic challenge. New England Journal of Medicine 2020; 382: 2069–71. [DOI] [PubMed] [Google Scholar]
- 8. von Elm E, Altman DG, Egger M, et al. The strengthening the reporting of observational studies in epidemiology (STROBE) statement: guidelines for reporting observational studies. Journal of Clinical Epidemiology 2008; 61: 344–9. [DOI] [PubMed] [Google Scholar]
- 9. Centers for Disease Control and Prevention . Cases in the U.S. 2020. https://www.cdc.gov/coronavirus/2019-ncov/cases-updates/cases-in-us.html (accessed 16/05/2020).
- 10. World Health Organization . Rational use of personal protective equipment for coronavirus disease (COVID‐19) and considerations during severe shortages: interim guidance. https://apps.who.int/iris/handle/10665/331695 (accessed 31/05/2020).
- 11. Ranney ML, Griffeth V, Jha AK. Critical supply shortages — the need for ventilators and personal protective equipment during the COVID‐19 pandemic. New England Journal of Medicine 2020; 382: e41. [DOI] [PubMed] [Google Scholar]
- 12. Artenstein AW. In pursuit of PPE. New England Journal of Medicine 2020; 382: e46. [DOI] [PMC free article] [PubMed] [Google Scholar]
- 13. World Health Organization . Shortage of personal protective equipment endangering health workers worldwide. https://www.who.int/news-room/detail/03-03-2020-shortage-of-personal-protective-equipment-endangering-health-workers-worldwide (accessed 02/04/2020).
- 14. Remuzzi A, Remuzzi G. COVID‐19 and Italy: what next? Lancet 2020; 395: 1225–8. [DOI] [PMC free article] [PubMed] [Google Scholar]
- 15. Hunter E, Price DA, Murphy E, et al. First experience of COVID‐19 screening of health‐care workers in England. Lancet 2020; 6736: 19–20. [DOI] [PMC free article] [PubMed] [Google Scholar]
- 16. Keeley AJ, Evans C, Colton H, et al. Roll‐out of SARS‐CoV‐2 testing for healthcare workers at a large NHS Foundation Trust in the United Kingdom, March 2020. Eurosurveillance 2020; 25: 1–4. [DOI] [PMC free article] [PubMed] [Google Scholar]
- 17. Treibel TA, Manisty C, Burton M, et al. COVID‐19: PCR screening of asymptomatic health‐care workers at London hospital. Lancet 2020; 6736: 19–20. [DOI] [PMC free article] [PubMed] [Google Scholar]
- 18. Office for National Statistics . Coronavirus (COVID‐19) Infection Survey Pilot England. 2020. https://www.ons.gov.uk/peoplepopulationandcommunity/healthandsocialcare/conditionsanddiseases/bulletins/coronaviruscovid19infectionsurveypilot/england14may2020 (accessed 04/06/2020).
- 19. Unwin HJ, Mishra S, Bradley VC, et al. State‐level tracking of COVID‐19 in the United States. 2020. https://www.imperial.ac.uk/mrc-global-infectious-disease-analysis/covid-19/report-23-united-states (accessed 31/05/2020) [DOI] [PMC free article] [PubMed]
- 20. Carenzo L, Costantini E, Greco M, et al. Hospital surge capacity in a tertiary emergency referral centre during the COVID‐19 outbreak in Italy. Anaesthesia 2020; 75: 928–34. [DOI] [PubMed] [Google Scholar]
- 21. Hains DS, Schwaderer AL, Carroll AE, et al. Asymptomatic seroconversion of immunoglobulins to sars‐cov‐2 in a pediatric dialysis unit. Journal of the American Medical Association 2020; 323: 2424–25. [DOI] [PMC free article] [PubMed] [Google Scholar]
Associated Data
This section collects any data citations, data availability statements, or supplementary materials included in this article.
Supplementary Materials
Appendix S1. Additional information regarding the study.