

Abstract
The outbreak of COVID‐19 was first reported from China, and on 19 February 2020, the first case was confirmed in Qom, Iran. The basic reproduction number (R0) of infection is variable in different populations and periods. This study aimed to estimate the R0 of COVID‐19 in Qom, Iran, and compare it with that in other countries. For estimation of the serial interval, we used data of the 51 confirmed cases of COVID‐19 and their 318 close contacts in Qom, Iran. The number of confirmed cases daily in the early phase of the outbreak and estimated serial interval were used for R0 estimation. We used the time‐varying method as a method with the least bias to estimate R0 in Qom, Iran, and in China, Italy and South Korea. The serial interval was estimated with a gamma distribution, a mean of 4.55 days and a standard deviation of 3.30 days for the COVID‐19 epidemic based on Qom data. The R0 in this study was estimated to be between 2 and 3 in Qom. Of the four countries studied, the lowest R0 was estimated in South Korea (1.5–2) and the highest in Iran (4–5). Sensitivity analyses demonstrated that R0 is sensitive to the applied mean generation time. To the best of the authors' knowledge, this study is the first to estimate R0 in Qom. To control the epidemic, the reproduction number should be reduced by decreasing the contact rate, decreasing the transmission probability and decreasing the duration of the infectious period.
Keywords: basic reproduction number, Coronavirus Infections, COVID‐19, disease outbreaks, pandemics
1. INTRODUCTION
On 31 December 2019, the World Health Organization (WHO) was informed of the fourth coronavirus epidemics in Wuhan, the capital city of the Hubei Province, China. Three other coronaviruses, SARS‐CoV, MERS‐CoV in 2012–2013 and MERS‐CoV in 2015, have caused three outbreaks in Guangdong Province of China in 2002 that spread to five continents, in Saudi Arabia in September 2012 that spread to other countries, and in South Korea, respectively (World Health Organization, 2003, 2019). The most common routes of transmission in these outbreaks are person‐to‐person transmission. However, the recently published literature suggested that the COVID‐19 was more contagious than previous coronavirus outbreaks, SARS‐CoV and MERS‐CoV (Bai, Nie, & Wen, 2020; Li et al., 2020a; de Wit, van Doremalen, Falzarano, & Munster, 2016). The basic reproduction number (R0), as the average number of secondary infections produced by an infected case in an entirely susceptible population (Ferguson, Donnelly, Woolhouse, & Anderson, 1999), is known as a key indicator of transmissibility of infectious diseases. On the other hand, we could quantify the effectiveness of preventive and control measures and reduce the magnitude of person‐to‐person transmission by estimating the basic reproduction number (Anderson, Anderson, & May, 1992; Cowling, Ho, & Leung, 2008; Biao Tang et al., 2020; Fraser, Riley, Anderson, & Ferguson, 2004). Previous studies confirmed the effect of two important control measures, effective contact tracing and diminishing the time between symptom onset and isolation, on the transmissibility of an infectious disease (Klinkenberg, Fraser, & Heesterbeek, 2006; Peak, Childs, Grad, & Buckee, 2017). For reproduction number (R), the R > 1 indicates that the number of infected cases is going to increase and the R < 1 indicates that infectious disease will not be able to take hold and is going to decrease (Diekmann, Heesterbeek, & Metz, 1990).
Furthermore, the infectious disease may show a different pattern of transmissibility that results from geographically and temporally different preventive and control measures (Hsieh et al., 2011). Thus, we sought to evaluate and compare the differential transmissibility of COVID‐19 in Qom, a province of Iran, Iran and worldwide.
2. MATERIALS AND METHODS
2.1. Data source
For estimation of the serial interval, we use data of the confirmed cases of COVID‐19 outbreak in Qom, Iran, beginning on 20 February 2020. Information about 51 index cases with laboratory‐confirmed COVID‐19 and their 318 close contacts was used. Confirmed cases were selected from the first cases of the COVID‐19 outbreak in Qom, and we tried to select the confirmed cases with the maximum variety of age, sex and severity of the disease. Anyone who has been in contact with a confirmed case (less than 2 metres away) during his/her symptomatic period, including 4 days before symptom onset, was considered as close contact.
All close contacts were followed up daily by phone calls for 21 days. The symptoms included were fever, cough and respiratory distress, which were asked about from all close contacts at each daily follow‐up. For those who had any of the said symptoms, chest X‐rays and chest CT scans were taken. Due to the limited availability of the PCR (polymerase chain reaction) test, the definitive diagnosis of secondary cases was made based on radiographic findings on chest CT scans, excluding all other known causes. Two radiologists and one infectious disease specialist confirmed the final diagnosis.
Of the 318 close contacts, 37 people were infected (secondary cases). None of the secondary cases had a history of recent travel (within 14 days of the onset of symptoms) to the affected areas. Patients with less than 24‐hr interval between the onset of their symptoms and primary cases were not considered as secondary cases. Serial interval was estimated based on the time from symptom onset in laboratory‐confirmed index cases to symptom onset in corresponding close contacts. Symptom onset was defined as the first day when the subject reported one of the COVID‐19‐related symptoms.
Information about daily reported laboratory‐confirmed COVID‐19 cases in Qom was acquired from the Ministry of Health and Medical Education of Iran. The data used in Iran and Qom contained only domestic case. The daily data from the first day to the eighteenth day of the outbreak were used to estimate R0 in Qom. The moving average/smoothing data with a span of five (2.1.2) were used instead of daily data of Qom confirmed cases. This means that instead of the values of each day, the mean values of the 2 days before, the same day and two days later were used.
We used data from the World Health Organization (WHO) of daily reported cases of COVID‐19 in China, Italy and South Korea (World Health Organization, 2020). The daily data from the first day to the 18th day of the outbreak were used to estimate R0 in China. In South Korea and Italy, data from day 34 to day 47 and data from day 21 to day 34 were used, respectively, as the number of their reported cases of COVID‐19 in the first days was 0 or 1.
2.2. Generation time
The serial interval is the time lag of symptom onset between infected and his/her infector cases (Lipsitch et al., 2003), and the generation time is defined as the time between infections of primary and secondary cases (Nikbakht, Baneshi, & Bahrampour, 2018). Therefore, the difference between serial interval and generation time is related to the fact that the serial interval is observable but the generation time is usually hidden (Kenah, Lipsitch, & Robins, 2008). We used the serial interval as a proxy of the generation time.
In order to find the best‐fitting generation time distribution, we first used est.GT command in the R0 package of the R statistical software.
We also used the EpiEstim package to estimate serial interval distribution. There are several methods such as non‐parametric, parametric, uncertain serial interval, the serial interval from data and the serial interval from sample for identifying the generation time distribution. We used a non‐parametric serial interval and serial interval from the sample in our analysis. In the first method, the serial interval is specified by the user, but in the second method, the serial interval is determined with the Bayesian methodology by using the metropolis algorithm to obtain MCMC samples. In the serial interval from samples, the convergence of MCMC samples is assessed by the Gelman–Rubin statistic. Finally, a sensitivity analysis was conducted using an uncertain serial interval method in which truncated normal distribution is applied to draw the mean and standard deviation of serial interval.
In the next step, we computed the R0 given the specified serial interval using the time‐varying method, which is presented below. For estimating R0 in this method, the incident cases overtime are needed.
2.3. Time‐varying reproduction numbers during epidemics
In the year 2013, Wallinga and Teunis proposed a time‐varying method for estimating the reproduction number (Wallinga & Teunis, 2004). In this method, the transmission networks are defined as the probability that an individual infects another, which is used to estimate reproduction number with below formula:
where Pij represents the probability that an infection at time ti is generated by an infection at time tj . For jth infection, the reproduction number is computed by , so the time‐varying reproduction number for all individuals who have the same onset time can be calculated using
In this method, the confidence interval for Rt can be computed using simulation (Cori, Ferguson, Fraser, & Cauchemez, 2013; Wallinga & Teunis, 2004).
In the time‐varying method, the importation of the cases during the epidemic can be accounted and also this method has the least bias compared with the maximum likelihood, exponential growth and sequential Bayesian methods, which are the advantages of this method (Nikbakht, Baneshi, Bahrampour, & Hosseinnataj, 2019). For an epidemic with a period less than generation time, the time‐varying method does not fit well on the data for estimating R0, which is a limitation of this method, but there is no concern regarding this limitation in our data set (Obadia, Haneef, & Boelle, 2012; Obadia, Haneef, & Boëlle, 2012).
The Research Ethics Committee of the Qom University of Medical Sciences has approved the project (IR.MUQ.REC.1398.158).
3. RESULTS
3.1. COVID‐19 epidemic in Iran, China, South Korea and Italy
On 19 February 2020, the first confirmed 2019‐nCoV cases of the epidemic were notified by a hospital in Qom, Iran. The epidemic curve in Qom Province and the outset of epidemics in Iran, Italy, South Korea and China in the exponential growth phase are depicted in Figure 1. The doubling time (days) in the exponential growth phases in these curves is as follows: Qom, 3.47 (CI: 3.16–3.84); Iran, 1.82 (CI: 1.64–2.05); Italy, 3.37 (CI: 3.03–3.81); South Korea, 1.78 (CI: 1.36– 2.58); and China, 2.55 (CI: 2.25, 2.96).
Figure 1.
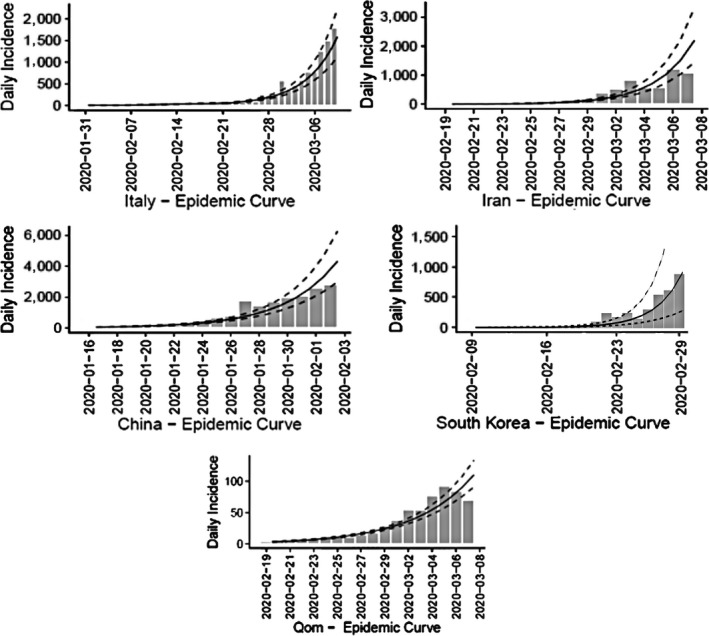
Epidemic curve of 2019‐nCoV during 18 days after the start of epidemic in Qom Province, Iran, and China, South Korea and Italy
3.2. Generation time
To calculate generation time, 51 confirmed cases by PCR and 318 suspected cases in close contact were followed through contact tracing programme by health workers in Qom. There were 37 clinical cases by CT scan in the second generation of transmission. To determine the serial interval, several distributions were fitted on the time interval between primary cases and secondary cases, and the best‐fitting model was a gamma distribution with a mean of 4.55 days and a standard deviation of 3.30 days (Figure 2).
Figure 2.
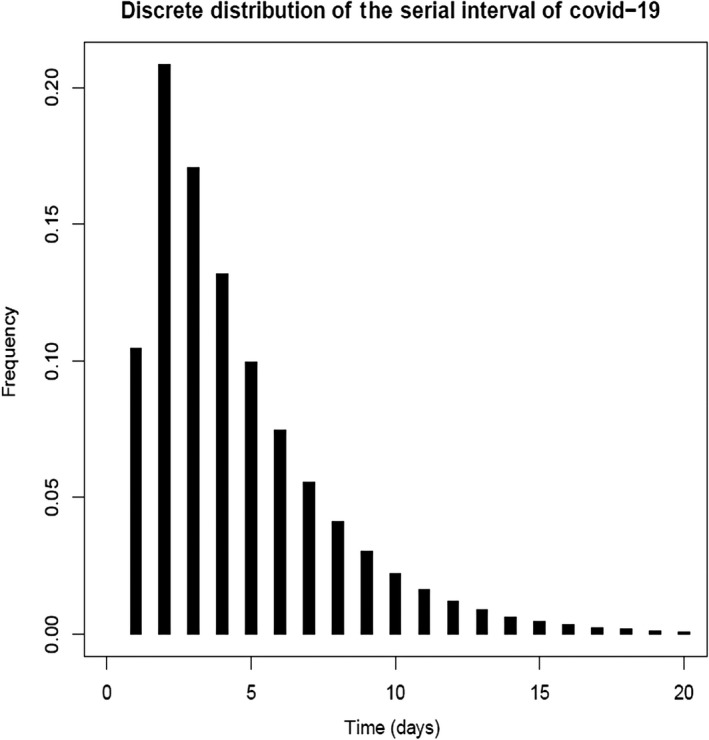
Serial interval of COVID‐19 infection in Qom, Iran
3.3. Reproduction number estimation (R)
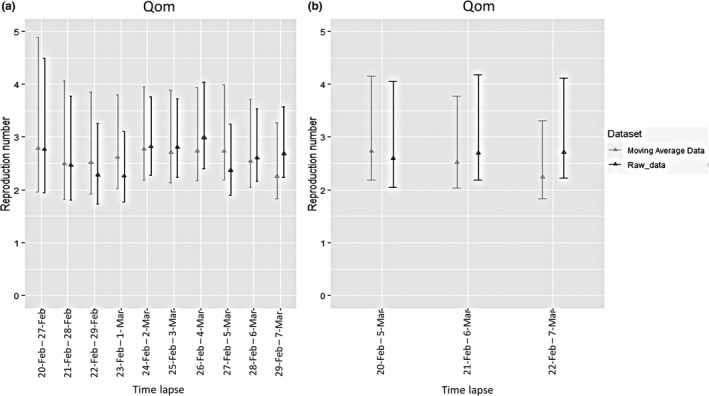
Figure 3a and b shows estimated R values with standard deviations using non‐parametric and MCMC models on different data sets of raw and moving average data in two time lapses of 7 and 14 days. The estimated median R values of 2019‐nCoV before 8 March were ranged from 1.97 to 2.04 in four different statistical models for Qom Province. Accounting for the duration of the time interval, there were more constant Rt values in the time lapse of 14 days. While no significant differences in four models were identified, there was a significant difference in estimated R values in the last week of the study period (29 February to 7 March) using raw versus moving average data in the non‐parametric model. Standard deviations of the non‐parametric model showed decreases in time lapses during the epidemic expansion, while standard deviations of the MCMC model showed lower changes in two sets of time intervals.
Figure 3.
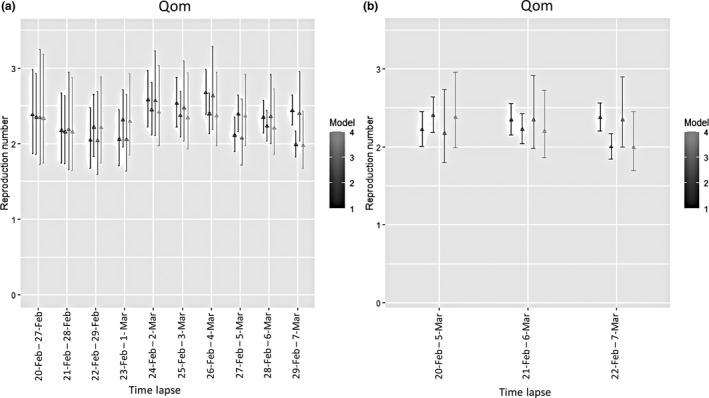
Estimated R values with 95% CI using non‐parametric and MCMC models in time lapses of 7 days (a) and 14 days (b) (Model 1: non‐parametric on raw data, Model 2: non‐parametric on moving average data, Model 3: MCMC on raw data and Model 4: MCMC on moving average data)
3.4. Sensitivity analysis
Two series of sensitivity analyses were conducted to quantify the effect of parameter changes on R value in two different time lapses. Accordingly, parameters of mean and standard deviation of serial interval mean (4.55 and 1, respectively), minimum and maximum of serial interval mean (4.27 and 7.5, respectively), mean and standard deviation of serial interval standard deviation (3.30 and 0.5, respectively), and minimum and maximum of serial interval standard deviation (2 and 4, respectively) were used. Figure 4a depicts sensitivity analysis results in a time lapse of 7 days. Compared with earlier days of the epidemic, the R values of COVID‐19 were robust to the changes in different serial interval means and related standard deviations during a time lapse of 7 days, while homogenous, more robust R values were estimated during different sequences in time lapse of 14 days on either raw or moving average data (Figure 4b).
Figure 4.
Sensitivity analysis of estimated R values with different parameters for generation time on two different data sets. (a) Each date on the x‐axis denotes the 1‐week period ending on that date. (b) Each date on the x‐axis denotes the two‐week period ending on that date
3.5. R values in Iran, China, South Korea and Italy
Figure 5 illustrates the median Rt estimation in four countries, China, South Korea, Italy and Iran, using a non‐parametric model in time lapse of 7 days. The countries passed an exponential growth trend through 18 days of the start of epidemics, while there was a significant difference in estimated Rt values in Iran during earlier days of the epidemic and a tremendous decline in Rt values in South Korea.
Figure 5.
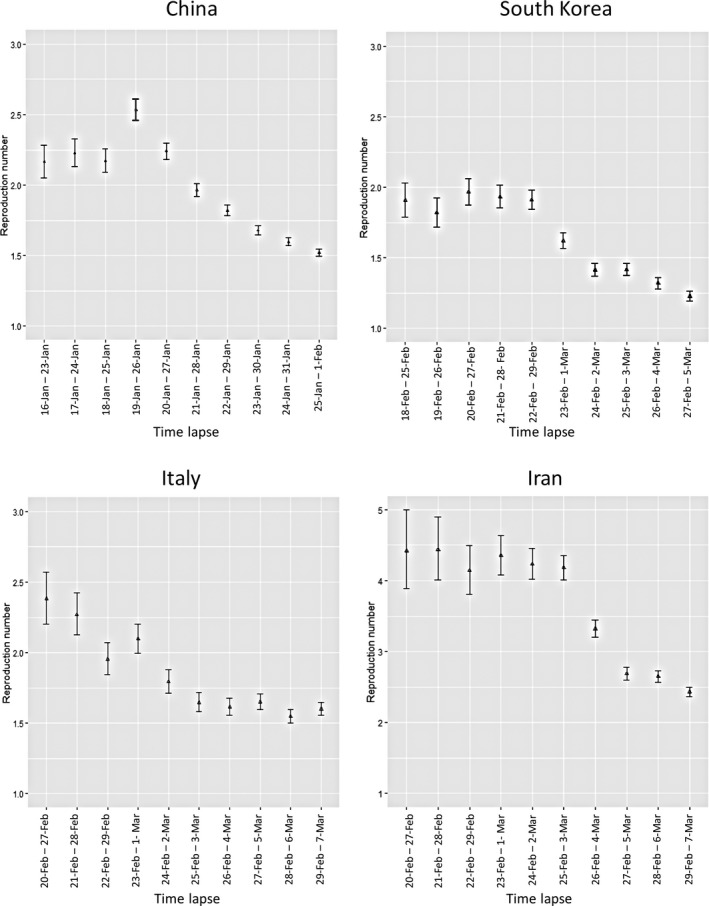
Estimated R values with 95% CI for China, South Korea, Italy and Iran using non‐parametric model
4. DISCUSSION
Despite the decrease in the burden of infectious diseases in the world, there have been several outbreaks of infectious diseases such as Ebola, influenza A (H1N1), SARS, MERS and Zika virus in the world in the last twenty years. The latest major outbreak is COVID‐19. Identification of epidemiological predictors in outbreaks can help control the outbreaks. One of these predictors is R0. Previous studies showed that there is a relationship between the R0 and the final epidemic size (Tildesley & Keeling, 2009). Also, the higher the R0, the harder the control of the epidemic (Sun, 2009).
In order to estimate R0, we used the time‐varying method as a method with the least bias in comparison with maximum likelihood, exponential growth, attack rate and sequential Bayesian methods (Obadia, Haneef, & Boelle, 2012; Obadia, Haneef, & Boëlle, 2012). In addition, the time‐varying method can estimate daily R, while other methods can only estimate overall R0, which is affected by the number of cases during an outbreak. In other words, when the number of cases drops sharply, the R0 will be biased due to the large variance in the daily incident cases. Therefore, one of the strengths of our study is the use of an effective time‐varying method, for estimating R.
In addition, our applied method has some other advantages and disadvantages. Cauchemez et al. (2006) proposed this method to estimate reproduction number in the early phase of epidemic, and they concluded that this method can also account for the yet‐unobserved secondary cases during the epidemic (Cauchemez et al., 2006). For aggregated data with long period of time, the use of the above‐mentioned method leads to a biased estimation of reproduction number, which is a limitation of this method (Nikbakht et al., 2019).
One of the prerequisites for calculating R0 is the measurement of the serial interval. In the present study, the serial interval was estimated with a gamma distribution, a mean of 4.55 days and a standard deviation of 3.30 days for the COVID‐19 epidemic based on Qom data. The results of the present study, based on 37 infector–infected pairs, were similar to those of the Nishiura study. Nishiura et al estimated the mean of the serial interval at 4.7 ± 2.9 days. Nishiura used data of 28 infector–infected pairs from published research articles and case reports (Nishiura, Linton, & Akhmetzhanov, 2020). However, the estimated serial interval value in the present study was much lower than that in Li et al. In Li's study, the serial interval was estimated to be 7.5 (Li et al., 2020b). However, Li et al used data of 6 infector–infected pairs and the results of their study may be affected by the sampling bias.
The number of R0 in the present study was estimated to be between 2 and 3 based on Qom data. Researchers estimated R0 with different values and a wide range (Liu, Hu, et al., 2020; Liu, Gayle, Wilder‐Smith, & Rocklov, 2020; Read, Bridgen, Cummings, Ho, & Jewell, 2020a; Riou & Althaus, 2020; Shen, Peng, Xiao, & Zhang, 2020; Wang et al., 2020; Wu, Leung, & Leung, 2020). WHO has reported the number of R0 to be between 1.4 and 2.5 (WHO, 2020), which is lower than ours. Many of the previous studies estimated the number of R0 to be between 2 and 5 (Imai, Dorigatti, Cori, Riley, & Ferguson, 2020; Liu, Hu, et al., 2020; Liu, Gayle, et al., 2020; Read, Bridgen, Cummings, Ho, & Jewell, 2020b; Riou & Althaus, 2020; Zhao et al., 2020), which is consistent with our results. Few articles reported R0 to be more than 5 (Tang et al., 2020). Variability of the R0 can be due to different populations and time periods; for example, a study conducted during the Chinese New Year reported the largest number of R0 (Tang et al., 2020). On the other hand, different statistical methods can lead to different estimates and there is no standard method to estimate R0.
According to the results of this study, the R0 in Iran was higher than in the other three countries. One of the possible reasons is under‐diagnosis or under‐reporting of asymptomatic or subclinical cases, before the announcement of COVID‐19 outbreak in Iran.
The 4 countries studied in this study passed a homogenous trend through 18 days of the start of epidemics, while there was a significant difference in the estimated Rt values in Iran during earlier days of the epidemic and a tremendous decline in Rt values in South Korea. The cause of the faster decline in Rt in South Korea needs further investigation. Of course, a study of the MERS outbreak in South Korea in 2015 showed that a public health network structure and collaboration was effective in controlling the outbreak (Kim, Andrew, & Jung, 2017).
One of the strengths of the present study is the estimation of the serial interval based on real data. One of the limitations of the present study was the diagnosis of an infected group based on clinical and paraclinical symptoms (chest CT scan) due to the limitation on access to the PCR test in Iran, which was influential in the number of confirmed cases of COVID‐19 in Qom, Iran. In addition, in the present study, the serial interval of COVID‐19 was estimated using only the early‐phase data in Qom Province. However, as there is a certain possibility that possible long serial intervals were not reported yet especially in the exponential phase of the epidemics, estimating the serial interval, without considering the right‐truncation issue, may provide a biased result. We estimated Rt without distinguishing between the imported and domestic cases in South Korea and Italy. However, we used the numbers of reported cases of COVID‐19 in South Korea from day 34 to day 47 and in Italy from day 21 to day 34, and due to travel restrictions between countries, the number of imported cases during these periods is probably very low. However, assuming all cases as domestic cases may cause some biases in the estimated Rt .
In conclusion, to the best of the authors' knowledge, the current study is the first to estimate R0 in Qom, Iran. In order to control the epidemic, the R0 should be reduced by decreasing the contact rate, decreasing the transmission probability and decreasing the duration of the infectious period.
CONFLICT OF INTEREST
The authors declared no conflict of interest.
ETHICAL APPROVAL
The Research Ethics Committee of the Qom University of Medical Sciences has approved the project (IR.MUQ.REC.1398.158). This article does not contain any studies involving human participants performed by any of the authors. This study was in accordance with the ethical standards of the institutional research committee and with the 1964 Helsinki Declaration and its later amendments or comparable ethical standards.
ACKNOWLEDGEMENT
The Qom University of Medical Sciences funded this project (Grant Number: 1259).
Aghaali M, Kolifarhood G, Nikbakht R, Saadati HM, Nazari SSH. Estimation of the serial interval and basic reproduction number of COVID‐19 in Qom, Iran, and three other countries: A data‐driven analysis in the early phase of the outbreak. Transbound Emerg Dis. 2020;67:2860–2868. 10.1111/tbed.13656
DATA AVAILABILITY STATEMENT
Partial data that support the findings of this study are available in the WHO site. However, partial data are available on request from the corresponding author, due to privacy restrictions.
REFERENCES
- Anderson, R. M. , Anderson, B. , & May, R. M. (1992). Infectious diseases of humans: Dynamics and control. Oxford, UK: Oxford University Press. [Google Scholar]
- Bai, Y. , Nie, X. , & Wen, C. (2020). Epidemic prediction of 2019‐nCoV in Hubei province and comparison with SARS in Guangdong province. Retrieved from https://papers.ssrn.com/sol3/papers.cfm?abstract_id=3531427
- Cauchemez, S. , Boëlle, P.‐Y. , Donnelly, C. A. , Ferguson, N. M. , Thomas, G. , Leung, G. M. , … Valleron, A.‐J. (2006). Real‐time estimates in early detection of SARS. Emerging Infectious Diseases, 12(1), 110. [DOI] [PMC free article] [PubMed] [Google Scholar]
- Cori, A. , Ferguson, N. M. , Fraser, C. , & Cauchemez, S. (2013). A new framework and software to estimate time‐varying reproduction numbers during epidemics. American Journal of Epidemiology, 178(9), 1505–1512. [DOI] [PMC free article] [PubMed] [Google Scholar]
- Cowling, B. , Ho, L. , & Leung, G. (2008). Effectiveness of control measures during the SARS epidemic in Beijing: A comparison of the R t curve and the epidemic curve. Epidemiology & Infection, 136(4), 562–566. [DOI] [PMC free article] [PubMed] [Google Scholar]
- de Wit, E. , van Doremalen, N. , Falzarano, D. , & Munster, V. J. (2016). SARS and MERS: Recent insights into emerging coronaviruses. Nature Reviews Microbiology, 14(8), 523. [DOI] [PMC free article] [PubMed] [Google Scholar]
- Diekmann, O. , Heesterbeek, J. A. P. , & Metz, J. A. (1990). On the definition and the computation of the basic reproduction ratio R 0 in models for infectious diseases in heterogeneous populations. Journal of Mathematical Biology, 28(4), 365–382. [DOI] [PubMed] [Google Scholar]
- Ferguson, N. , Donnelly, C. , Woolhouse, M. , & Anderson, R. (1999). Estimation of the basic reproduction number of BSE: The intensity of transmission in British cattle. Proceedings of the Royal Society of London. Series B: Biological Sciences, 266(1414), 23–32. [DOI] [PMC free article] [PubMed] [Google Scholar]
- Fraser, C. , Riley, S. , Anderson, R. M. , & Ferguson, N. M. (2004). Factors that make an infectious disease outbreak controllable. Proceedings of the National Academy of Sciences, 101(16), 6146–6151. [DOI] [PMC free article] [PubMed] [Google Scholar]
- Hsieh, Y.‐H. , Cheng, K.‐F. , Wu, T.‐N. , Li, T.‐C. , Chen, C.‐Y. , Chen, J.‐H. , … Center for Infectious Education and Research Team . (2011). Transmissibility and temporal changes of 2009 pH1N1 pandemic during summer and fall/winter waves. BMC Infectious Diseases, 11(1), 332. [DOI] [PMC free article] [PubMed] [Google Scholar]
- Imai, N. , Dorigatti, I. , Cori, A. , Riley, S. , & Ferguson, N. M. (2020). Estimating the potential total number of novel Coronavirus cases in Wuhan City, China. London, UK: Imperial College London. [Google Scholar]
- Kenah, E. , Lipsitch, M. , & Robins, J. M. (2008). Generation interval contraction and epidemic data analysis. Mathematical Biosciences, 213(1), 71–79. [DOI] [PMC free article] [PubMed] [Google Scholar]
- Kim, K. , Andrew, S. A. , & Jung, K. (2017). Public health network structure and collaboration effectiveness during the 2015 MERS outbreak in South Korea: An institutional collective action framework. International Journal of Environmental Research and Public Health, 14(9), 1064. 10.3390/ijerph14091064 [DOI] [PMC free article] [PubMed] [Google Scholar]
- Klinkenberg, D. , Fraser, C. , & Heesterbeek, H. (2006). The effectiveness of contact tracing in emerging epidemics. PLoS One, 1(1), e12. [DOI] [PMC free article] [PubMed] [Google Scholar]
- Li, Q. , Guan, X. , Wu, P. , Wang, X. , Zhou, L. , Tong, Y. , … Feng, Z. (2020a). Early transmission dynamics in Wuhan, China, of novel coronavirus–infected pneumonia. New England Journal of Medicine. 382(13), 1199–1207. [DOI] [PMC free article] [PubMed] [Google Scholar]
- Li, Q. , Guan, X. , Wu, P. , Wang, X. , Zhou, L. , Tong, Y. , … Feng, Z. (2020b). Early transmission dynamics in Wuhan, China, of novel coronavirus‐infected pneumonia. New England Journal of Medicine, 382(13), 1199–1207. 10.1056/NEJMoa2001316 [DOI] [PMC free article] [PubMed] [Google Scholar]
- Lipsitch, M. , Cohen, T. , Cooper, B. , Robins, J. M. , Ma, S. , James, L. , … Murray, M. (2003). Transmission dynamics and control of severe acute respiratory syndrome. Science, 300(5627), 1966–1970. [DOI] [PMC free article] [PubMed] [Google Scholar]
- Liu, T. , Hu, J. , Kang, M. , Lin, L. , Zhong, H. , Xiao, J. , … Deng, A. (2020). Transmission dynamics of 2019 novel coronavirus (2019‐nCoV). Retrieved from https://ssrn.com/abstract=3526307
- Liu, Y. , Gayle, A. A , Wilder‐Smith, A. , Rocklöv, J. (2020). The reproductive number of COVID‐19 is higher compared to SARS coronavirus. Journal of Travel Medicine, 27(2), taaa021. 10.1093/jtm/taaa021 [DOI] [PMC free article] [PubMed] [Google Scholar]
- Nikbakht, R. , Baneshi, M. R. , & Bahrampour, A. (2018). Estimation of the basic reproduction number and vaccination coverage of influenza in the United States (2017–18). Journal of Research in Health Sciences, 18(4), e00427. [PMC free article] [PubMed] [Google Scholar]
- Nikbakht, R. , Baneshi, M. R. , Bahrampour, A. , & Hosseinnataj, A. (2019). Comparison of methods to Estimate Basic Reproduction Number (R0) of influenza, Using Canada 2009 and 2017‐18 A (H1N1) Data. Journal of Research in Medical Sciences, 24, 67 [DOI] [PMC free article] [PubMed] [Google Scholar]
- Nishiura, H. , Linton, N. M. , & Akhmetzhanov, A. R. (2020). Serial interval of novel coronavirus (COVID‐19) infections. International Journal of Infectious Diseases, 93, 284–286. 10.1016/j.ijid.2020.02.060 [DOI] [PMC free article] [PubMed] [Google Scholar]
- Obadia, T. , Haneef, R. , & Boëlle, P.‐Y. (2012). The R0 package: A toolbox to estimate reproduction numbers for epidemic outbreaks. BMC Medical Informatics and Decision Making, 12(1), 147. [DOI] [PMC free article] [PubMed] [Google Scholar]
- Obadia, T. , Haneef, R. , & Boelle, P. Y. (2012). The R0 package: A toolbox to estimate reproduction numbers for epidemic outbreaks. BMC Medical Informatics and Decision Making, 12, 147. 10.1186/1472-6947-12-147 [DOI] [PMC free article] [PubMed] [Google Scholar]
- Peak, C. M. , Childs, L. M. , Grad, Y. H. , & Buckee, C. O. (2017). Comparing nonpharmaceutical interventions for containing emerging epidemics. Proceedings of the National Academy of Sciences, 114(15), 4023–4028. [DOI] [PMC free article] [PubMed] [Google Scholar]
- Read, J. M. , Bridgen, J. R. , Cummings, D. A. , Ho, A. , & Jewell, C. P. (2020a). Novel coronavirus 2019‐nCoV: Early estimation of epidemiological parameters and epidemic predictions. medRxiv, 2020.2001.2023.20018549, 10.1101/2020.01.23.20018549 [DOI] [PMC free article] [PubMed] [Google Scholar]
- Read, J. M. , Bridgen, J. R. , Cummings, D. A. , Ho, A. , & Jewell, C. P. (2020b). Novel coronavirus 2019‐nCoV: Early estimation of epidemiological parameters and epidemic predictions. medRxiv. [DOI] [PMC free article] [PubMed] [Google Scholar]
- Riou, J. , & Althaus, C. L. (2020). Pattern of early human‐to‐human transmission of Wuhan 2019 novel coronavirus (2019‐nCoV), December 2019 to January 2020. Eurosurveillance, 25(4), 2000058. 10.2807/1560-7917.Es.2020.25.4.2000058 [DOI] [PMC free article] [PubMed] [Google Scholar]
- Shen, M. , Peng, Z. , Xiao, Y. , & Zhang, L. (2020). Modelling the epidemic trend of the 2019 novel coronavirus outbreak in China. bioRxiv. [DOI] [PMC free article] [PubMed] [Google Scholar]
- Sun, Z. (2009). Epidemic spreading survey. Boston, MA: Northeastern University. [Google Scholar]
- Tang, B. , Wang, X. , Li, Q. , Bragazzi, N. , Tang, S. , Xiao, Y. , Wu, J. (2020a). Estimation of the transmission risk of the 2019‐nCoV and its implication for public health interventions. Journal of Clinical Medicine, 9(2), 462. [DOI] [PMC free article] [PubMed] [Google Scholar]
- Tildesley, M. J. , & Keeling, M. J. (2009). Is R(0) a good predictor of final epidemic size: Foot‐and‐mouth disease in the UK. Journal of Theoretical Biology, 258(4), 623–629. 10.1016/j.jtbi.2009.02.019 [DOI] [PMC free article] [PubMed] [Google Scholar]
- Wallinga, J. , & Teunis, P. (2004). Different epidemic curves for severe acute respiratory syndrome reveal similar impacts of control measures. American Journal of Epidemiology, 160(6), 509–516. [DOI] [PMC free article] [PubMed] [Google Scholar]
- Wang, M. , Jiang, A. , Gong, L. , Luo, L. , Guo, W. , Li, C. , … Li, H. (2020). Temperature significant change COVID‐19 Transmission in 429 cities. medRxiv. [Google Scholar]
- WHO (2020). Statement on the meeting of the International Health Regulations (2005) Emergency Committee regarding the outbreak of novel coronavirus (2019‐nCoV). https://www.who.int/news‐room/detail/23‐01‐2020‐statement‐on‐the‐meeting‐of‐the‐international‐health‐regulations‐(2005)‐emergency‐committee‐regarding‐the‐outbreak‐of‐novel‐coronavirus‐(2019‐ncov) [Google Scholar]
- World Health Organization (2003). Summary of probable SARS cases with onset of illness from 1 November 2002 to 31 July 2003 [monograph on the Internet]. 2003 Dec 31 [cited2005 Jan 10]. [Google Scholar]
- World Health Organization (2019). Middle East Respiratory Syndrome Coronavirus (MERS‐CoV). Geneva, Switzerland: World Health Organization. [Google Scholar]
- World Health Organization (2020). Coronavirus disease (COVID‐2019) situation reports. https://www.who.int/emergencies/diseases/novel‐coronavirus‐2019/situation‐reports2020 [Google Scholar]
- Wu, J. T. , Leung, K. , & Leung, G. M. (2020). Nowcasting and forecasting the potential domestic and international spread of the 2019‐nCoV outbreak originating in Wuhan, China: A modelling study. Lancet, 395(10225), 689–697. 10.1016/s0140-6736(20)30260-9 [DOI] [PMC free article] [PubMed] [Google Scholar]
- Zhao, S. , Lin, Q. , Ran, J. , Musa, S. S. , Yang, G. , Wang, W. , … Wang, M. H. (2020). Preliminary estimation of the basic reproduction number of novel coronavirus (2019‐nCoV) in China, from 2019 to 2020: A data‐driven analysis in the early phase of the outbreak. International Journal of Infectious Diseases, 92, 214–217. 10.1016/j.ijid.2020.01.050 [DOI] [PMC free article] [PubMed] [Google Scholar]
Associated Data
This section collects any data citations, data availability statements, or supplementary materials included in this article.
Data Availability Statement
Partial data that support the findings of this study are available in the WHO site. However, partial data are available on request from the corresponding author, due to privacy restrictions.