

Abstract
The novel coronavirus severe acute respiratory syndrome coronavirus 2 (SARS‐CoV‐2) has rapidly spread around the world, causing serious illness and death and creating a heavy burden on the healthcare systems of many countries. Since the virus first emerged in late November 2019, its spread has coincided with peak circulation of several seasonal respiratory viruses, yet some studies have noted limited coinfections between SARS‐CoV‐2 and other viruses. We use a mathematical model of viral coinfection to study SARS‐CoV‐2 coinfections, finding that SARS‐CoV‐2 replication is easily suppressed by many common respiratory viruses. According to our model, this suppression is because SARS‐CoV‐2 has a lower growth rate (1.8/d) than the other viruses examined in this study. The suppression of SARS‐CoV‐2 by other pathogens could have implications for the timing and severity of a second wave.
Keywords: computer modeling, human metapneumovirus, human rhinovirus, influenza virus, respiratory syncytial virus, SARS coronavirus
Highlights
We use a mathematical model of viral coinfections to study SARS‐CoV‐2 coinfections with other respiratory viruses.
We find that SARS‐CoV‐2 has a much slower growth rate than other respiratory viruses.
The slow growth rate of SARS‐CoV‐2 makes it unable to compete for target cells, so its replication is suppressed when in coinfections with other viruses.
1. INTRODUCTION
In the last couple of months of 2020, a novel coronavirus emerged from Wuhan, China and started spreading rapidly around the world. 1 The virus causes an illness called coronavirus disease (COVID‐19) that can result in severe pneumonia and death. 2 , 3 The ease of transmission of the virus has led to a global pandemic, with COVID‐19 cases being found in nearly every country in the world. 4 , 5 As countries struggle to get the current wave of outbreaks under control, 6 , 7 there is mounting worry over the possibility of a second wave in the fall or winter of 2020, 8 , 9 possibly coupled with outbreaks of other seasonal respiratory infections, that could overwhelm healthcare systems in many countries. 10
Before the advent of severe acute respiratory syndrome coronavirus 2 (SARS‐CoV‐2), many studies found respiratory viral coinfection rates of about 40% in patients presenting with influenza‐like illness. 11 , 12 , 13 , 14 , 15 It seems likely, then, that if SARS‐CoV‐2 cocirculates with other respiratory viruses, we will also see coinfections that include SARS‐CoV‐2. However, recent studies found fewer coinfections than expected in adults infected with SARS‐CoV‐2, 16 , 17 , 18 , 19 , 20 although pediatric patients were found to have a 40% rate of SARS‐CoV‐2 coinfection with other respiratory viruses. 21 It is also unclear if these coinfections lead to more severe disease, with one study of SARS‐CoV‐2/influenza coinfections indicating no worse clinical outcome in these patients, 22 another study indicating SARS‐CoV‐2/influenza coinfections lowered mortality, 23 and a third study suggesting higher mortality for patients with SARS‐CoV‐2 coinfections. 24 Thus there is a need to understand how SARS‐CoV‐2 interacts with other respiratory viruses within a host.
There are really only two possible reasons why there are fewer SARS‐CoV‐2 coinfections—either SARS‐CoV‐2 is suppressing replication of most other respiratory viruses or SARS‐CoV‐2 replication is suppressed by the presence of other viruses. We attempt to determine which of these scenarios is occurring through the use of mathematical models. Mathematical models have long been used to improve our understanding of respiratory viral infections 25 and to study different aspects of within‐host dynamics of viral infections, such as drug treatment 26 , 27 and resistance, 28 , 29 , 30 the role of the immune response, 31 , 32 and coinfections. 33 , 34 , 35 Our previous study using mathematical models of coinfections indicated that viruses with a faster growth rate will suppress viruses with a slower growth rate, 33 a dynamic that might provide insight into SARS‐CoV‐2 coinfections with other respiratory viruses.
In this paper, we use our previously published model of viral coinfections 33 to explore SARS‐CoV‐2 coinfections with influenza A virus (IAV), respiratory syncytial virus (RSV), human rhinovirus (hRV), parainfluenza virus (PIV), and human metapneumovirus (hMPV). We find that SARS‐CoV‐2 has a lower growth rate than all of these viruses, and so is suppressed if the infections start simultaneously. If, however, the second infection is initiated some time after the SARS‐CoV‐2 infection is established, the suppression is somewhat mitigated and a coinfection can be detected.
2. METHODS
2.1. Mathematical modeling
We use a previously published model of viral coinfections, 33
In the model, two viruses, V 1 and V 2, compete for a single type of target cell, T, infecting the cells at rates and . Once infected, the target cells move into the eclipse phase (E 1 and E 2) wherein the virus is replicating within the cell, but not yet being released. After times 1/k 1 and 1/k 2, the cells become productively infectious (I 1 and I 2) and after times and , the infectious cells die. Virus is produced by the infectious cells at rates p 1 and p 2 and decays at rates c 1 and c 2. Simulations of the model are performed using the lsode differential equation solver in Octave.
2.2. Parameter values
To find parameters describing the SARS‐CoV‐2 infection, we fit viral load measurements from Patient 8 of the data used in Gonçalves et al. 36 This patient was chosen because the data from that patient has some viral load measurements before the viral peak, so we can get an estimate of the viral growth rate in the patient. We fit the patient data using a single virus model. Fitting is done by minimizing the sum of squared residuals using the Nelder–Mead algorithm implemented in Octave. The initial number of target cells is fixed to 1 and the initial viral load is fixed to 10−3 copies/mL, as in Gonçalves et al. 36 Confidence intervals (CIs) are found by fitting 1000 bootstrap replicates. Parameters for the remaining viruses (IAV, RSV, hRV, PIV, and hMPV) were estimated in Pinky and Dobrovolny 33 and are given in Table 1.
Table 1.
Parameter values for respiratory infections
| Virus | β [(TCID50/mL)−1 d−1] | k [/d] | p [(TCID50/mL) d−1] | δ [/d] | c [/d] |
|---|---|---|---|---|---|
| IAV | 2.85 × 10⁻⁷ | 4.20 | 3.47 × 10⁹ | 4.20 | 4.03 |
| RSV | 2.70 × 10⁻⁵ | 1.27 | 8.71 × 10⁶ | 1.27 | 1.27 |
| hRV | 5.16 × 10⁻⁴ | 0.937 | 3.24 × 10⁷ | 50.5 | 0.920 |
| PIV | 1.74 × 10⁻⁸ | 13.2 | 5.87 × 10⁹ | 13.2 | 0.567 |
| hMPV | 3.00 × 10⁻³ | 0.957 | 4.74 × 10⁶ | 29.4 | 26.2 |
Abbreviations: hMPV, human metapneumovirus; hRV, human rhinovirus; IAV, influenza A virus; PIV, parainfluenza virus; RSV, respiratory syncytial virus.
3. RESULTS
3.1. Parameterizing SARS‐CoV‐2 infection
The single virus model fit to the patient data, along with the best fit parameters is given in Figure 1. It is difficult to compare parameters containing viral units between different experiments, but we can assess the reasonableness of our fit using some calculated values. The infecting time, t inf, represents the average time between the virus leaving one cell and infecting the next and is given be . We find an infecting time of 3.2 hours (0.054‐8.7 hours, 95% CI), which is shorter than the infecting times found in Hernandez–Vargas and Velasco–Hernandez 37 of 16 to 61 hours found in a study of SARS‐CoV‐2 in humans, but longer than the infecting times of 1 to 2 hours found in a study of SARS‐CoV‐2 infections in rhesus macaques. 38 The basic reproduction number, given by for this model, is calculated to be 25 (12‐400, 95% CI) for this patient. This is higher than the R 0 estimates of 2 to 11 found by Hernandez–Vargas and Velasco–Hernandez 37 in humans, but within the range of 12 to 69 found for rhesus macaques. 38
Figure 1.
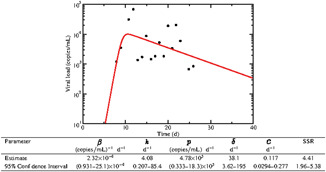
Experimental data and single virus model best fits for a patient infected with severe acute respiratory syndrome coronavirus 2 (SARS‐CoV‐2). Best fit parameters are given in the table
3.2. SARS‐CoV‐2 coinfections
We use the parameters found for SARS‐CoV‐2 in the previous section along with the parameters for other respiratory viruses found in a previous study to predict the dynamics of coinfections involving SARS‐CoV‐2 and other pathogens. We wish to initiate both infections with the same amount of virus (), so the parameters and p are scaled to account for the change in initial viral load. While this is clearly an idealization, and not likely to happen, we first study coinfection dynamics when the viruses are given equivalent starting conditions; differences in initial inocula and starting times are examined in the next sections. Model predictions are shown in Figure 2, where dash‐dot lines show single infections with each of the viruses and solid lines giving the predicted coinfection time courses. It is clear that SARS‐CoV‐2 is suppressed, at least to some extent by each of the other viruses. The least suppression is caused by PIV, where peak viral load is decreased by four orders of magnitude. The remaining viruses keep the level of SARS‐CoV‐2 at very low levels. The SARS‐CoV‐2 peak is also shifted much earlier, from 10 days to 4 days when in coinfection with PIV, and to less than 2 days during coinfections with the remaining viruses. Note that the common respiratory viruses are completely unaffected by the presence of SARS‐CoV‐2. The difference in growth rate between SARS‐CoV‐2 and these viruses is such that, even for PIV—the slowest‐growing virus—they can replicate just as easily as if the SARS‐CoV‐2 were not there.
Figure 2.
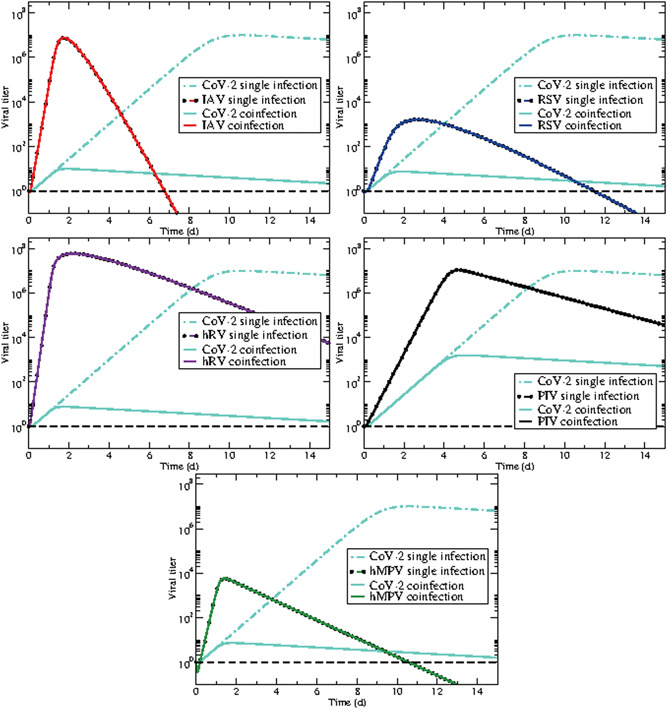
SARS‐CoV‐2 coinfections with other respiratory viruses: (top left) influenza, (top right) respiratory syncytial virus (RSV), (center left) rhinovirus, (center right) parainfluenza virus (PIV), (bottom) human metapneumovirus (hMPV). Dash‐dot lines are each of the viruses in a single infection while solid lines predict the dynamics of the coinfection. The dashed black line indicates a typical threshold of detection
In our previous study on modeling of coinfections, 33 we determined that one virus can suppress another if the growth rate of one virus is larger than the other. Using the approximation derived in Smith et al, 39 we find the growth rate of SARS‐CoV‐2 is 1.8/d (1.6‐10/d, 95% CI). This growth rate is small compared to the growth rates previously found for the other respiratory viruses: 11.9/d for influenza virus, 5.4/d for RSV, 13.6/d for rhinovirus, 4.0/d for parainfluenza virus, and 9.1/d for hMPV. This suggests that SARS‐CoV‐2 can be easily suppressed by many seasonal respiratory viruses.
3.3. Delayed secondary infection
If SARS‐CoV‐2 is so easily suppressed, how is it that we see any coinfections involving SARS‐CoV‐2 at all? Our previous study showed that the disadvantage of having a slow growth rate could be overcome by having a head start. 33 A study of SARS‐CoV‐2 coinfections has suggested that this might be the case, finding more coinfections that start after the SARS‐CoV‐2 infection has been established. 40 We explored this possibility by starting with the SARS‐CoV‐2 infection alone, then starting a second infection with another virus at 1, 5, or 10 days. The predicted dynamics are shown in Figure 3 with solid lines showing coinfection dynamics when the second virus is introduced on day 1, dashed lines showing dynamics when it is introduced on day 5, and dotted lines when it is introduced on day 10. When the second virus is introduced on day 1, the dynamics are similar to simultaneous infection with SARS‐CoV‐2 replication largely suppressed. When the second virus is introduced on day 5, SARS‐CoV‐2 viral load is able to rise to much higher levels, but not to the same level as in a single infection. We also see that the secondary infection curve remains similar to its single infection curve. If the secondary infection is introduced on day 10, near the peak of SARS‐CoV‐2, the second infection cannot take hold since SARS‐CoV‐2 has already infected the majority of cells at that point. Thus there seems to be a “sweet spot” for introduction of the second virus to detect a coinfection—introduce the second virus too early, and SARS‐CoV‐2 is suppressed; introduce it too late, and the second virus is suppressed.
Figure 3.
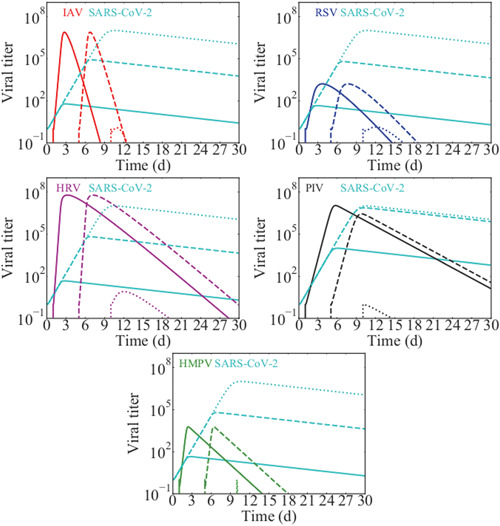
Delayed SARS‐CoV‐2 coinfections with other respiratory viruses: (top left) influenza, (top right) RSV, (center left) rhinovirus, (center right) PIV, (bottom) hMPV. Solid lines show the viral time courses when the second virus is introduced 1 day after SARS‐CoV‐2 infection. Dashed lines show the time courses when the second virus is introduced 5 days after SARS‐CoV‐2 infection and dotted lines show the time courses when the second virus is introduced 10 days after SARS‐CoV‐2 infection. hMPV, human metapneumovirus; PIV, parainfluenza virus; RSV, respiratory syncytial virus; SARS‐CoV‐2, severe acute respiratory syndrome coronavirus 2
3.4. Increased SARS‐CoV‐2 dose
An alternative possibility for the presence of detectable coinfections with SARS‐CoV‐2 is that the viruses do not start with the same initial viral inoculum. Our previous study suggests that slower growing viruses can overcome suppression if there is a difference in initial viral inocula. 33 We explored this possibility for SARS‐CoV‐2 coinfections by starting the coinfections with 102, 104, or 106 times more SARS‐CoV‐2 than the second virus. The results are shown in Figure 4. Interestingly, even at SARS‐CoV‐2 initial doses 106 times larger than the initial inoculum of the second virus, we see little replication of SARS‐CoV‐2 in that the peak of the SARS‐CoV‐2 infection does not rise much above the initial dose. The peak also occurs much earlier for SARS‐CoV‐2 during these coinfections than when SARS‐CoV‐2 infection occurs alone, also suggesting limited SARS‐CoV‐2 replication. We see very little suppression of the second virus even at the highest dose differential, with the exception of coinfection with PIV where the highest initial inoculum of SARS‐CoV‐2 results in a 105 reduction in the peak PIV viral load. Despite the fact that SARS‐CoV‐2 replication is still largely suppressed in these coinfections, coinfections will be detected since the SARS‐CoV‐2 viral load is high and decays slowly.
Figure 4.
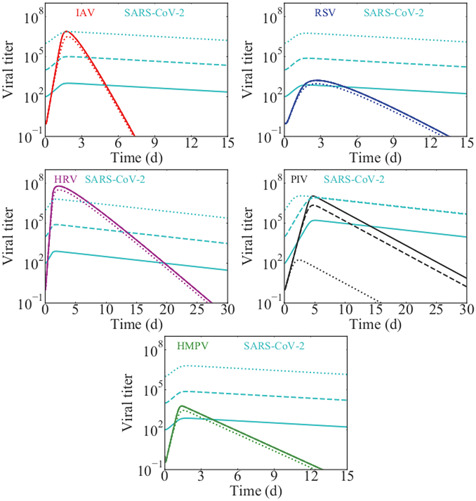
The effect of an increased SARS‐CoV‐2 initial inoculum during coinfection with other viruses: (top left) influenza, (top right) RSV, (center left) rhinovirus, (center right) PIV, (bottom) hMPV. Solid lines show the viral time courses when SARS‐CoV‐2 has an initial dose 100 times larger than the second virus; dashed lines show the time courses when SARS‐CoV‐2 has an initial inocolum 104 times larger than the second virus; and dotted lines show the time courses when SARS‐CoV‐2 has an initial inoculum 106 times larger than the second virus. hMPV, human metapneumovirus; PIV, parainfluenza virus; RSV, respiratory syncytial virus; SARS‐CoV‐2, severe acute respiratory syndrome coronavirus 2
4. DISCUSSION
Our main finding is that SARS‐CoV‐2 has a lower growth rate than other respiratory viruses we have examined. According to our model, then, SARS‐CoV‐2 infections are easily suppressed when initiated simultaneously or after infection with another respiratory virus. This finding could explain why SARS‐CoV‐2 coinfections are less common than other respiratory coinfections. 16 , 17 , 18 , 19 , 20 If the secondary infection is initiated after the SARS‐CoV‐2 infection, the suppression can be somewhat mitigated, consistent with the findings of Zhu et al, 40 who found that many SARS‐CoV‐2 coinfections occur when a second respiratory pathogen takes hold in someone already infected with SARS‐CoV‐2. A larger initial inoculum of SARS‐CoV‐2, however, does not allow SARS‐CoV‐2 to overcome the competitive disadvantage in most cases, and SARS‐CoV‐2 replication is still limited, although the viral load remains high for a long period of time.
This has implications for the potential of a second wave of SARS‐CoV‐2. 41 , 42 , 43 If the second wave occurs while other seasonal respiratory infections are circulating, there might be a protective effect where people infected with influenza, RSV, or the common cold are less susceptible to infection with SARS‐CoV‐2 infection or perhaps will get a milder form of the infection. There also appears to have been a lag in spread of SARS‐CoV‐2 infections in America and Europe, with newly discovered cases of people who died of COVID‐19, likely acquired through community transmission, in both France and California, 44 , 45 much earlier than the first officially recorded COVID deaths in either location. This suggests that the virus was circulating, but not spreading very rapidly early on. Since influenza and other respiratory viruses were also circulating at the same time, our study suggests the possibility that SARS‐CoV‐2 might have had trouble spreading due to the presence of these other viruses.
Our findings also have implications for treatment of these diseases—using antivirals to shorten the duration of influenza, for example, might then leave a patient susceptible to SARS‐CoV‐2, or worse yet, might allow a SARS‐CoV‐2 coinfection that is already present to grow unfettered. It would be prudent to consider testing all patients presenting with influenza‐like illness for a variety of respiratory pathogens along with SARS‐CoV‐2 to make the most informed decision regarding treatment. 19 , 46
While the growth rate calculated here suggests that SARS‐CoV‐2 should be outcompeted by many other common respiratory viruses, it was based on fits to data from a single patient. There can be substantial sources of error in viral load measurements taken from nasal swabs 47 and in this case, the growth phase of the curve consists of only three or four points with data collection starting only on day 8. While caution should be taken in extrapolating too much from single patient measurements, there are other indications that the growth rate of SARS‐CoV‐2 might be slow. The incubation period of the virus is estimated to be a median of ∼5 to 7 days, 48 , 49 , 50 , 51 although some patients have shown incubation periods lasting 12 days or longer. 48 , 49 This is compared to an estimated 1.4 days incubation period for influenza, 52 , 53 1 day for rhinovirus, 54 4.4 days for RSV, 53 and 2.6 days for PIV, 53 so the slow growth rate calculated for this particular patient does not seem unreasonable. Viral load measurements taken earlier in the infection will improve the estimate of the growth rate. Data will also need to be taken from more patients to understand the variability in growth rates in different patients.
We must also keep in mind that the model used here is a highly simplified model. The only interaction between the viruses is through competition for the single resource of target cells, so whichever virus grabs the target cells first will be able to replicate while the losing virus has its replication suppressed. In the real respiratory tract, there are many more possible interactions that could change the outcome of the infection. If the two viruses can both infect the same cell, this sharing of target cells allows both viruses to coexist. 35 There is also the possibility that the viruses have preferences for different types of cells in the respiratory tract, 55 , 56 , 57 , 58 in which case, the competition for resources is not the major driver of coinfection dynamics. Finally, studies have shown that in vivo, the immune response plays a role in interactions between coinfecting viruses, 59 , 60 , 61 changing the expression and availability of receptors and host or viral factors needed for replication. The angiotensin‐converting enzyme 2 (ACE2) has been shown to be crucial for replication of SARS‐CoV‐2. 62 , 63 Then, a possible mechanism of suppression is through interaction of the other respiratory viruses with ACE2—influenza, for example, has been shown to downregulate ACE2. 64 Unfortunately, it has been difficult to incorporate immune responses into viral kinetics models due to the limited data, 31 particularly for some of the viruses examined here where there is little data concerning the immune response even during single infections.
Even with these limitations, we believe our model provides a possible explanation for the unexpectedly low number of coinfections involving SARS‐CoV‐2 observed in several studies. More detailed measurements of viral growth rate in more patients will be necessary to assess how easily SARS‐CoV‐2 can be suppressed by other viruses and whether cocirculation with other respiratory viruses might help slow or minimize a second wave.
Pinky L, Dobrovolny HM. SARS‐CoV‐2 coinfections: Could influenza and the common cold be beneficial? J Med Virol. 2020;92:2623–2630. 10.1002/jmv.26098
REFERENCES
- 1. Lippi G, Sanchis‐Gomar F, Henry BM. Coronavirus disease 2019 (COVID‐19): the portrait of a perfect storm. Ann Trans Med. 2020;8(7):497. 10.21037/atm.2020.03.157 [DOI] [PMC free article] [PubMed] [Google Scholar]
- 2. Govorkova EA, Ilyushina NA, Marathe BM, McClaren JL, Webster RG. Clinical characteristics of covid‐19 in New York City. N Engl J Med. 2020;84:8042‐8050. 10.1128/JVI.00689-10 [DOI] [Google Scholar]
- 3. Jiang F, Deng L, Zhang L, Cai Y, Cheung CW, Xia Z. Review of the clinical characteristics of coronavirus disease 2019 (COVID‐19). J Gen Intern Med. 2020;35:1545‐1549. 10.1007/s11606-020-05762-w [DOI] [PMC free article] [PubMed] [Google Scholar]
- 4. Chinazzi M, Davis JT, Ajelli M, et al. The effect of travel restrictions on the spread of the 2019 novel coronavirus (COVID‐19) outbreak. Science. 2020;368(6489):395‐400. 10.1126/science.aba9757 [DOI] [PMC free article] [PubMed] [Google Scholar]
- 5. Lai CC, Wang CY, Wang YH, Hsueh SC, Ko WC, Hsueh PR. Global epidemiology of coronavirus disease 2019 (COVID‐19): disease incidence, daily cumulative index, mortality, and their association with country healthcare resources and economic status. Int J Antimicrob Agents. 2020;55(4):105946. 10.1016/j.ijantimicag.2020.105946 [DOI] [PMC free article] [PubMed] [Google Scholar]
- 6. Khosrawipour V, Lau H, Khosrawipour T, et al. Failure in initial stage containment of global COVID‐19 epicenters. J Med Virol. 2020. 10.1002/jmv.25883 [DOI] [PMC free article] [PubMed] [Google Scholar]
- 7. Guest JL, del Rio C, Sanchez T. The three steps needed to end the COVID‐19 pandemic: bold public health leadership, rapid innovations, and courageous political will. JMIR Pub Health Surveil. 2020;6(2):4‐7. 10.2196/19043 [DOI] [PMC free article] [PubMed] [Google Scholar]
- 8. Xu S, Li Y. Beware of the second wave of COVID‐19. Lancet. 2020;395(10233):1321‐1322. 10.1016/S0140-6736(20)30845-X [DOI] [PMC free article] [PubMed] [Google Scholar]
- 9. Ali I. COVID‐19: are we ready for the second wave? Disaster Med Public Health Prep. 2020:1‐8. 10.1016/0166-0934(85)90115-6 [DOI] [PMC free article] [PubMed] [Google Scholar]
- 10. Tanne JH, Hayasaki E, Zastrow M, Pulla P, Smith P, Rada AG. Covid‐19: how doctors and healthcare systems are tackling coronavirus worldwide. Brit Med J. 2020;368:m1090. 10.1136/bmj.m1090 [DOI] [PubMed] [Google Scholar]
- 11. Kenmoe S, Tchendjou P, Vernet MA, et al. Viral etiology of severe acute respiratory infections in hospitalized children in Cameroon, 2011‐‐2013. Influenza Other Res Vir. 2016;10(5):386‐393. 10.1111/irv.12391 [DOI] [PMC free article] [PubMed] [Google Scholar]
- 12. Scotta MC, Chakr VC, de Moura A, et al. Respiratory viral coinfection and disease severity in children: a systematic review and meta‐analysis. J Clin Virol. 2016;80:45‐56. 10.1016/j.jcv.2016.04.019 [DOI] [PMC free article] [PubMed] [Google Scholar]
- 13. Asner SA, Rose W, Petrich A, Richardson S, Tran DJ. Is virus coinfection a predictor of severity in children with viral respiratory infections? Clin Microbiol Infect. 2015;21(3):264.e1‐264.e6. [DOI] [PMC free article] [PubMed] [Google Scholar]
- 14. Pretorius MA, Madhi SA, Cohen C, et al. Respiratory viral coinfections identified by a 10‐Plex real‐time reverse‐transcription polymerase chain reaction assay in patients hospitalized with severe acute respiratory illness‐South Africa, 2009‐2010. J Infect Dis. 2012;206(S1):S159‐S165. 10.1093/infdis/jis538 [DOI] [PubMed] [Google Scholar]
- 15. Achten NB, Wu P, Bont L, et al. Interference between respiratory syncytial virus and human rhinovirus infection in infancy. J Infect Dis. 2017;215:1102‐1106. [DOI] [PMC free article] [PubMed] [Google Scholar]
- 16. Nowak MD, Sordillo EM, Gitman MR, Paniz AE. Co‐infection in SARS‐CoV‐2 infected patients: where are influenza virus and rhinovirus/enterovirus? J Med Virol. 2020. 10.1002/jmv.25953 [DOI] [PMC free article] [PubMed] [Google Scholar]
- 17. Siordia JA. Epidemiology and clinical features of COVID‐19: a review of current literature. J Clin Virol. 2020;127:104357. 10.1016/j.jcv.2020.104357 [DOI] [PMC free article] [PubMed] [Google Scholar]
- 18. Kim D, Quinn J, Pinsky B, Shah NH, Brown I. Rates of co‐infection between SARS‐CoV‐2 and other respiratory pathogens. JAMA. 2020. 10.1001/jama.2020.6266 [DOI] [PMC free article] [PubMed] [Google Scholar]
- 19. Xing Q, Li JG, Xing HY, et al. Precautions are needed for COVID‐19 patients with coinfection of common respiratory pathogens. Lancet. 2020. 10.2139/ssrn.3550013 [DOI] [Google Scholar]
- 20. Blasco ML, Buesa J, Colomina J, et al. Co‐detection of respiratory pathogens in patients hospitalized with coronavirus viral disease‐2019 pneumonia. J Med Virol. 2020. 10.1002/jmv.25922 [DOI] [PubMed] [Google Scholar]
- 21. Xia W, Shao J, Guo Y, Peng X, Li Z, Hu D. Clinical and CT features in pediatric patients with COVID‐19 infection: different points from adults. Ped Pulmonol. 2020;55(5):1169‐1174. 10.1002/ppul.24718 [DOI] [PMC free article] [PubMed] [Google Scholar]
- 22. Ding Q, Lu P, Fan Y, Xia Y, Liu M. The clinical characteristics of pneumonia patients coinfected with 2019 novel coronavirus and influenza virus in Wuhan, China. J Med Virol. 2020:1‐7. 10.1002/jmv.25781 [DOI] [PMC free article] [PubMed] [Google Scholar]
- 23. Wang G, Xie M, Ma J, et al. Is co‐infection with influenza virus a protective factor of COVID‐19? Lancet. 2020. 10.2139/ssrn.3576904 [DOI] [Google Scholar]
- 24. Zhang G, Hu C, Luo L, et al. Clinical features and short‐term outcomes of 221 patients with COVID‐19 in Wuhan, China. J Clin Virol. 2020;127:104364. 10.1016/j.jcv.2020.104364 [DOI] [PMC free article] [PubMed] [Google Scholar]
- 25. Baccam P, Beauchemin C, Macken CA, Hayden FG, Perelson AS. Kinetics of influenza A virus infection in humans. J Virol. 2006;80(15):7590‐7599. 10.1128/JVI.01623-05 [DOI] [PMC free article] [PubMed] [Google Scholar]
- 26. González‐Parra G, Dobrovolny HM. Modeling of fusion inhibitor treatment of RSV in African green monkeys. J Theor Biol. 2018;456:62‐73. 10.1016/j.jtbi.2018.07.029 [DOI] [PubMed] [Google Scholar]
- 27. Cao P, McCaw JM. The mechanisms for within‐host influenza virus control affect model‐based assessment and prediction of antiviral treatment. Viruses. 2015;9(8):197. 10.3390/v9080197 [DOI] [PMC free article] [PubMed] [Google Scholar]
- 28. Guo T, Qiu Z, Rong L. A within‐host drug resistance model with continuous state‐dependent viral strains. Appl Math Lett. 2020;104:106223. 10.1016/j.aml.2020.106223 [DOI] [Google Scholar]
- 29. Kanyiri CW, Mark K, Luboobi L. Mathematical analysis of influenza A dynamics in the emergence of drug resistance. Comput Math Meth Med. 2018;2018:2434560. 10.1155/2018/2434560 [DOI] [PMC free article] [PubMed] [Google Scholar]
- 30. Dobrovolny HM, Beauchemin CA. Modelling the emergence of influenza drug resistance: the roles of surface proteins, the immune response and antiviral mechanisms. PLoS One. 2017;12(7):e0180582. 10.1371/journal.pone.0180582 [DOI] [PMC free article] [PubMed] [Google Scholar]
- 31. Dobrovolny HM, Reddy MB, Kamal MA, Rayner CR, Beauchemin CA. Assessing mathematical models of influenza infections using features of the immune response. PLoS One. 2013;8(2):e57088. 10.1371/journal.pone.0057088 [DOI] [PMC free article] [PubMed] [Google Scholar]
- 32. Wethington D, Harder O, Uppulury K, et al. Mathematical modelling identifies the role of adaptive immunity as a key controller of respiratory syncytial virus in cotton rats. J Roy Soc Interface. 2019;16(160):20190389. 10.1098/rsif.2019.0389 [DOI] [PMC free article] [PubMed] [Google Scholar]
- 33. Pinky L, Dobrovolny HM. Coinfections of the respiratory tract: viral competition for resources. PLoS One. 2016;11(5):e0155589. 10.1371/journal.pone.0155589 [DOI] [PMC free article] [PubMed] [Google Scholar]
- 34. Pinky L, Dobrovolny HM. The impact of cell regeneration on the dynamics of viral coinfection. Chaos. 2017;27(6):063109. 10.1063/1.4985276 [DOI] [PubMed] [Google Scholar]
- 35. Pinky L, González‐Parra G, Dobrovolny HM. Superinfection and cell regeneration can lead to chronic viral coinfections. J Theor Biol. 2019;466:24‐38. 10.1016/j.jtbi.2019.01.011 [DOI] [PMC free article] [PubMed] [Google Scholar]
- 36. Gonçalves A, Bertrand J, Ke R, et al. Timing of antiviral treatment initiation is critical to reduce SARS‐CoV‐2 viral load. medRXiv. 2020. 10.1101/2020.04.04.20047886 [DOI] [PMC free article] [PubMed] [Google Scholar]
- 37. Hernandez‐Vargas EA, Velasco‐Hernandez JX. In‐host modelling of COVID‐19 kinetics in humans. medRxiv. 2020. 10.1101/2020.03.26.20044487 [DOI] [PMC free article] [PubMed] [Google Scholar]
- 38. Dobrovolny HM. Quantifying the effect of remdesivir in rhesus macaques infected with SARS‐CoV‐2. submitted to Virology. 2020. [DOI] [PMC free article] [PubMed]
- 39. Smith AM, Adler FR, Perelson AS. An accurate two‐phase approximate solution to an acute viral infection model. J Math Biol. 2010;60(5):711‐726. 10.1007/s00285-009-0281-8 [DOI] [PMC free article] [PubMed] [Google Scholar]
- 40. Zhu X, Ge Y, Wu T, et al. Co‐infection with respiratory pathogens among COVID‐2019 cases. Virus Res. 2020;285:198005. 10.1016/j.virusres.2020.198005 [DOI] [PMC free article] [PubMed] [Google Scholar]
- 41. Friston KJ, Parr T, Zeidman P, et al. Second waves, social distancing, and the spread of COVID‐19 across America. ArXiv. 2020:2004.13017. [DOI] [PMC free article] [PubMed] [Google Scholar]
- 42. Leung K, Wu JT, Liu D, Leung GM. First‐wave COVID‐19 transmissibility and severity in China outside Hubei after control measures, and second‐wave scenario planning: a modelling impact assessment. Lancet. 2020;395(10233):1382‐1393. 10.1016/S0140-6736(20)30746-7 [DOI] [PMC free article] [PubMed] [Google Scholar]
- 43. Aleta A, Martin‐Corral D, y Piontti AP, et al. Modeling the impact of social distancing, testing, contact tracing and household quarantine on second‐wave scenarios of the COVID‐19 epidemic. Complex Dig. 2020. https://cosnet.bifi.es/wp-content/uploads/2020/05/main.pdf [DOI] [PMC free article] [PubMed]
- 44. Yeager A. Doctors date first COVID‐19 case in France to late December. The Scientist. 2020. [Google Scholar]
- 45. Chiu A, Armus T. Autopsies find first U.S. coronavirus death occurred in early February, weeks earlier than previously thought. Washington Post. 2020. [Google Scholar]
- 46. Khaddour K, Sikora A, Tahir N, Nepomuceno D, Huang T. The importance of novel coronavirus disease (COVID‐19) and coinfection with other respiratory pathogens in the current pandemic. Am J Trop Med Hygiene. 2020. 10.4269/ajtmh.20-0266 [DOI] [PMC free article] [PubMed] [Google Scholar]
- 47. Nadimpalli M, Pisanic N, Heaney CD, Stewart J. Equivalence of influenza A virus RNA recovery from nasal swabs when lysing the swab and storage medium versus storage medium alone. J Virol Meth. 2015;217:14‐17. 10.1016/j.jviromet.2015.01.008 [DOI] [PMC free article] [PubMed] [Google Scholar]
- 48. Lauer SA, Grantz KH, Bi Q, et al. The incubation period of coronavirus disease 2019 (COVID‐19) from publicly reported confirmed cases: estimation and application. Ann Internal Med. 2020;172(9):577‐582. 10.7326/M20-0504 [DOI] [PMC free article] [PubMed] [Google Scholar]
- 49. Leung C. The difference in the incubation period of 2019 novel coronavirus (SARS‐CoV‐2) infection between travelers to Hubei and nontravelers: the need for a longer quarantine period. Infect Contr Hosp Epidemiol. 2020;41(5):594‐596. 10.1017/ice.2020.8110 [DOI] [PMC free article] [PubMed] [Google Scholar]
- 50. Backer JA, Klinkenberg D, Wallinga J. Incubation period of 2019 novel coronavirus (2019‐nCoV) infections among travellers from Wuhan, China, 20‐28 January 2020. Eurosurveil. 2020;25(5):10‐15. 10.2807/1560-7917.ES.2020.25.5.2000062 [DOI] [PMC free article] [PubMed] [Google Scholar]
- 51. Ye Q, Wang B, Mao J, et al. Epidemiological analysis of COVID‐19 and practical experience from China. J Med Virol. 2020. 10.1002/jmv.25813 [DOI] [PMC free article] [PubMed] [Google Scholar]
- 52. Park JE, Ryu Y. Transmissibility and severity of influenza virus by subtype. Infect Genetics Evolut. 2018;65:288‐292. 10.1016/j.meegid.2018.08.007 [DOI] [PubMed] [Google Scholar]
- 53. Lessler J, Reich NG, Brookmeyer R, Perl TM, Nelson KE, Cummings DA. Incubation periods of acute respiratory viral infections: a systematic review. Lancet Infect Dis. 2009;9(5):291‐300. 10.1016/S1473-3099(09)70069-6 [DOI] [PMC free article] [PubMed] [Google Scholar]
- 54. Harris J, Gwaltney J. Incubation periods of experimental rhinovirus infection and illness. Clin Infect Dis. 1996;23(6):1287‐1290. 10.1093/clinids/23.6.1287 [DOI] [PubMed] [Google Scholar]
- 55. Matrosovich M, Herrler G, Klenk HD. Sialic acid receptors of viruses. Top Curr Chem. 2015;367:1‐28. 10.1007/128.2013.466 [DOI] [PMC free article] [PubMed] [Google Scholar]
- 56. Mansfield KG. Viral tropism and the pathogenesis of influenza in the mammalian host. Am J Pathol. 2007;171(4):1089‐1092. 10.2353/ajpath.2007.070695 [DOI] [PMC free article] [PubMed] [Google Scholar]
- 57. Vlasak M, Roivainen M, Reithmayer M, et al. The minor receptor group of human rhinovirus (HRV) includes HRV23 and HRV25, but the presence of a lysine in the VP1 HI loop is not sufficient for receptor binding. J Virol. 2005;79(12):7389‐7395. 10.1128/JVI.79.12.7389-7395.2005 [DOI] [PMC free article] [PubMed] [Google Scholar]
- 58. Lehmanna F, Tiralongo E, Tiralongo J. Sialic acid‐specific lectins: occurrence, specificity and function. Cell Mol Life Sci. 2006;63:1331‐1354. 10.1007/s00018-005-5589-y [DOI] [PMC free article] [PubMed] [Google Scholar]
- 59. Dobrescu I, Levast B, Lai K, et al. In vitro and ex vivo analyses of co‐infections with swine influenza and porcine reproductive and respiratory syndrome viruses. Vet Microbiol. 2014;169(1‐2):18‐32. 10.1016/j.vetmic.2013.11.037 [DOI] [PMC free article] [PubMed] [Google Scholar]
- 60. Lin L, Verslype C, van Pelt JF, van Ranst M, Fevery J. Viral interaction and clinical implications of coinfection of hepatitis C virus with other hepatitis viruses. Eur J Gastroenterol Hepatol. 2006;18(12):1311‐1319. 10.1097/01.meg.0000243881.09820.09 [DOI] [PubMed] [Google Scholar]
- 61. Shinjoh M, Omoe K, Saito N, Matsuo N, Nerome K. In vitro growth profiles of respiratory syncytial virus in the presence of influenza virus. Acta Virol. 2000;44(2):91‐97. [PubMed] [Google Scholar]
- 62. Hoffmann M, Kleine‐Weber H, Schroeder S, et al. SARS‐CoV‐2 cell entry depends on ACE2 and TMPRSS2 and is blocked by a clinically proven protease inhibitor. Cell. 2020;181(2):271‐280. 10.1016/j.cell.2020.02.052 [DOI] [PMC free article] [PubMed] [Google Scholar]
- 63. Walls AC, Park YJ, Tortorici MA, Wall A, McGuire AT, Veesler D. Structure, function, and antigenicity of the SARS‐CoV‐2 spike glycoprotein. Cell. 2020;181(2):281‐292. 10.1016/j.cell.2020.02.058 [DOI] [PMC free article] [PubMed] [Google Scholar]
- 64. Liu X, Yang N, Tang J, et al. Downregulation of angiotensin‐converting enzyme 2 by the neuraminidase protein of influenza A (H1N1) virus. Virus Res. 2014;185:64‐71. 10.1016/j.virusres.2014.03.010 [DOI] [PMC free article] [PubMed] [Google Scholar]