

Abstract
Background
Digital breast tomosynthesis (DBT) is increasingly being used for routine breast cancer screening. We projected the long-term impact and cost-effectiveness of DBT compared to conventional digital mammography (DM) for breast cancer screening in the United States.
Methods
Three Cancer Intervention and Surveillance Modeling Network breast cancer models simulated US women ages 40 years and older undergoing breast cancer screening with either DBT or DM starting in 2011 and continuing for the lifetime of the cohort. Screening performance estimates were based on observational data; in an alternative scenario, we assumed 4% higher sensitivity for DBT. Analyses used federal payer perspective; costs and utilities were discounted at 3% annually. Outcomes included breast cancer deaths, quality-adjusted life-years (QALYs), false-positive examinations, costs, and incremental cost-effectiveness ratios (ICERs).
Results
Compared to DM, DBT screening resulted in a slight reduction in breast cancer deaths (range across models 0–0.21 per 1000 women), small increase in QALYs (1.97–3.27 per 1000 women), and a 24–28% reduction in false-positive exams (237–268 per 1000 women) relative to DM. ICERs ranged from $195 026 to $270 135 per QALY for DBT relative to DM. When assuming 4% higher DBT sensitivity, ICERs decreased to $130 533–$156 624 per QALY. ICERs were sensitive to DBT costs, decreasing to $78 731 to $168 883 and $52 918 to $118 048 when the additional cost of DBT was reduced to $36 and $26 (from baseline of $56), respectively.
Conclusion
DBT reduces false-positive exams while achieving similar or slightly improved health benefits. At current reimbursement rates, the additional costs of DBT screening are likely high relative to the benefits gained; however, DBT could be cost-effective at lower screening costs.
Digital mammography (DM) has largely been the standard of care for breast cancer screening in the United States in the 21st century (1). In 2011, the Food and Drug Administration approved digital breast tomosynthesis (DBT) as a new breast imaging modality that reconstructs cross-sectional slices of the breast, minimizing soft-tissue overlap (2,3). Multiple studies of DBT screening performance have observed improved recall rates and cancer detection rates when DBT is used in combination with standard DM (4–10) or synthetic 2-dimensional images reconstructed from the tomosynthesis acquisition (11,12) compared to DM alone. As a result, DBT has been swiftly adopted in clinical practice; in 2015, the Centers for Medicare and Medicaid Services approved reimbursement codes for DBT performed in addition to DM for routine screening, and by mid-2018 approximately 50% of Mammography Quality Standards Act–certified facilities reported having DBT units (13).
Despite the widespread adoption of DBT into clinical practice, it is not yet known how this transition from DM to DBT will affect long-term costs and health benefits. A previous cost-effectiveness analysis demonstrated that the use of biennial DBT screening in women ages between 50 and 74 years with dense breasts is cost-effective (14). However, to our knowledge, no prior studies have used simulation modeling to evaluate the use of DBT in the general screening population. A National Cancer Institute–funded randomized controlled trial is in progress to evaluate whether DBT screening in average-risk women reduces advanced-stage breast cancer incidence compared to DM alone, but long-term results will not be available for many years (15). In the interim, the long-term screening outcomes and cost-effectiveness of the use of DBT for routine screening are uncertain.
We used three established breast cancer microsimulation models from the Cancer Intervention and Surveillance Modeling Network (CISNET) to predict the long-term impact of integrating DBT into breast cancer screening practices in the United States. By incorporating available data on DBT performance, we estimated the incremental effect of DBT on breast cancer mortality, false-positive screens, quality-adjusted life-years (QALYs), costs, and cost-effectiveness. The results provide preliminary information for physicians and policy makers about how the transition to DBT may affect the benefits, harms, and cost-effectiveness of breast cancer screening on a population level.
Methods
This modeling study was determined as “not human subjects research” by the institutional review boards of all participating institutions.
Overview of Models
Three established CISNET models were used for analysis: Model D (Dana-Farber Cancer Institute, Boston, MA), Model GE (Georgetown University Medical Center, Washington, DC, and Albert Einstein College of Medicine, Bronx, NY), and Model W (University of Wisconsin-Madison, Madison, WI, and Harvard Medical School, Boston, MA). Details of the development, structure, and validation of these models have been previously described (16–18), and key natural history parameters are summarized in Table 1. Briefly, each model estimates US breast cancer incidence (invasive and ductal carcinoma in situ) in the absence of screening using age-period-cohort models (19,20). Baseline incidence is then adjusted by age-specific relative risks for breast density category obtained from the Breast Cancer Surveillance Consortium. The effects of actual patterns of screening and treatment use are incorporated to project effects on breast cancer survival. Although the models share many common parameters (21), each model structure is unique with some models simulating tumor growth over time and others modeling progression of breast cancer through discrete clinical stages. In all models, breast cancer survival depends on size and/or stage of tumor at diagnosis and treatment, estrogen receptor and human epidermal growth factor receptor 2 status, and age at diagnosis. Breast cancer screening performance is dependent on age and breast density, and when screening is implemented, breast cancers can be detected at earlier stages before clinical presentation, thereby reducing breast cancer mortality. Women also face age-specific competing mortality risks (22). Model output for age- and stage-specific breast cancer mortality is compared to data reported by the Surveillance, Epidemiology, and End Results (SEER) Program (23) and has been validated with observed clinical trials (24).
Table 1.
Summary of model input parameters for breast cancer natural history, screening dissemination, costs, and utilities*
| Parameter | Description | Data source |
|---|---|---|
| Natural history of breast cancer | ||
| Incidence in the absence of screening | Calibrated to observed SEER Program rates using an age-period-cohort model | Gangon et al., 2018 (22) |
| Stage distribution | Stage distribution among clinically detected and digital screen-detected cancers stratified by age at diagnosis (<50, 50–64, ≥65 years), screening round (first, subsequent), and screening interval (annual, biennial, triennial). | BCSC |
| Sojourn time | Sojourn time by joint ER/HER2 status and age | Munoz et al., 2018 (25) |
| Mean tumor growth rates | Varies by models according to age and/or receptor status | Lee et al., 2018; Schechter et al., 2018; Alagoz et al., 2018 (16–18) |
| Breast cancer screening and diagnosis | ||
| Screening mammography use | Observed patterns of mammography dissemination based on data from NHIS and BCSC | Mandelblatt et al., 2018; Cronin et al., 2005 (21,26) |
| Screening mammography costs | $140.40 for digital mammography, $196.56 for combined digital mammography and digital breast tomosynthesis | CMS 2018 Reimbursement |
| Diagnostic evaluation costs | For true-positive screens at age 40–49 years ($2555.88), 50–64 years ($2399.17), 65–74 years ($2412.47), and 75 years and older ($2034.18); for false-positive screens with imaging only ($157.47 all ages); and for false-positive screens with biopsy performed at age 40–49 years ($1039.93), 50–64 years ($1507.76), 65–74 years ($1515.93), and 75 years and older ($1605.91) | Stout et al., 2006 (27) |
| Breast cancer treatment | ||
| Treatment use | Assume receipt of and adherence to the guideline treatment specific to age, stage, and receptor status | NCCN, 2015; Mariotto et al., 2006 (28,29) |
| Treatment effects | Treatment efficacy estimates from meta-analyses of clinical trials | Peto et al., 2012 (30) |
| Treatment costs | Initial treatment for in situ ($14 440), localized ($23 573), regional ($40 215), and distant staged breast cancer ($54 446); treatment at end of life for breast cancer initially diagnosed in in situ (55 428), localized ($57 912), regional ($62 741), and distant stage ($79 411) | Updated from Mariotto et al., 2011 (personal communication) (31) |
| Quality-of-life adjustments | Calculated as the decrease in utility score for a time period | |
| Screening exams | 0.006 decrease in utility score for 1 week | De Haes et al., 1991 (32) |
| Diagnostic evaluation | 0.105 decrease in utility score for 5 weeks | De Haes et al., 1991 (32) |
| Treatment | In situ/localized (0.1 decrease for 2 years), regional (0.25 decrease for 2 years), and distant staged breast cancer (0.4 decrease until death) | Stout et al., 2006 (27) |
| Mortality risks | ||
| Breast cancer survival | Long-term breast cancer survival before stratified by ER/HER2 receptor status, age group, and AJCC/SEER stage or tumor size | Munoz et al., 2014 (33) |
| Nonbreast cancer mortality | Age- and cohort-specific all-cause mortality rates by year | Gangnon et al., 2018 (22) |
Not all models use all parameters; some models use parameters as direct inputs, and others use them as a target for calibration or other estimation. AJCC = American Joint Committee on Cancer; BCSC = Breast Cancer Surveillance Consortium; BI-RADS = Breast Imaging Reporting and Data System; CMS = Centers for Medicaid and Medicare Services; DCIS = ductal carcinoma in situ; ER = estrogen receptor; HER2 = human epidermal growth factor 2; NCCN = National Comprehensive Cancer Network; NHIS = National Health Interview Survey; SEER = Surveillance, Epidemiology, and End Results.
Screening Use
For this analysis, all models simulated screening use based on observed dissemination data by age and birth cohort (including ages of screening initiation and screening frequency) from the National Health Interview Survey and the Breast Cancer Surveillance Consortium (21,26). For each scenario, the likelihood that a woman participates in mammography screening as well as age at screening initiation are determined based on birth year, with screening frequency (annual, biennial, or irregular) varied based on current age. The proportion of women undergoing screening increased over time after 1982, with approximately 50% of women regularly participating in screening by the year 2000, and 20% of women never having undergone screening (21,26,34). We assumed no difference in screening use behavior by screening modality.
Performance of DBT and DM
Test performance for each modality (DM and DBT) was derived from observational data provided by the Population-Based Research Optimizing Screening through Personalized Regimens (PROSPR) consortium (35,36). Briefly, the data source includes information on nearly 200 000 screening DM and DBT examinations collected by three PROSPR research centers during 2011–2014: University of Vermont, a statewide breast cancer surveillance system; University of Pennsylvania, an integrated health-care system; and Geisel School of Medicine at Dartmouth in conjunction with Brigham and Women’s Hospital, a primary care clinical network. Of note, during this period, all DBT exams were performed in combination with conventional DM.
For the base case analysis, test performance parameters (including sensitivity, specificity, and cancer detection rate) for each modality were estimated by fitting logistic regression models to observed performance data, adjusted for age group (ages 40–49, 50–64, or 65–74) years, breast density, and baseline vs subsequent examination (Table 2). False-positive examinations were calculated based on specificity estimates and defined as screening exams leading to additional imaging evaluation (with or without biopsy) without a subsequent cancer diagnosis in the following year. Because of small sample sizes, breast density was treated as a dichotomous variable comparing nondense (Breast Imaging Reporting and Data System [37] categories “almost entirely fat” and “scattered fibroglandular density”) and dense breasts (Breast Imaging Reporting and Data System categories “heterogeneously dense” and “extremely dense”).
Table 2.
Calibration targets for test performance of digital mammography (DM) and digital breast tomosynthesis (DBT)
| Age group, y | Density† and exam type | Sensitivity, %* |
Specificity, %* |
||
|---|---|---|---|---|---|
| DM | DBT | DM | DBT | ||
| 40–49 | Nondense | ||||
| Baseline | 90.8 | 93.4 | 69.5 | 81.2 | |
| Subsequent | 86.6 | 89.6 | 83.9 | 88.3 | |
| Dense | |||||
| Baseline | 88.2 | 84.3 | 65.5 | 76.6 | |
| Subsequent | 76.8 | 75.0 | 81.3 | 85.1 | |
| 50–64 | Nondense | ||||
| Baseline | 94.9 | 96.8 | 78.6 | 87.5 | |
| Subsequent | 91.2 | 93.7 | 89.4 | 92.4 | |
| Dense | |||||
| Baseline | 91.7 | 92.7 | 75.4 | 84.1 | |
| Subsequent | 86.1 | 84.9 | 87.6 | 90.2 | |
| 65–74 | Nondense | ||||
| Baseline | 95.8 | 96.5 | 84.3 | 91.1 | |
| Subsequent | 92.7 | 94.8 | 92.5 | 94.7 | |
| Dense | |||||
| Baseline | 93.2 | 91.3 | 81.7 | 88.5 | |
| Subsequent | 88.4 | 87.2 | 91.1 | 93.1 | |
Targets estimated by fitting observed data from the Population-Based Research Optimizing Screening through Personalized Regimens consortium to a regression model adjusted for age group, breast density group, and baseline vs subsequent screen.
Nondense includes almost entirely fatty and scattered fibroglandular density. Dense includes heterogeneously dense and extremely dense.
Utilities and Costs
Utilities and costs for this analysis are summarized in Table 1. QALYs were estimated using previously published age-stratified health utilities (38) with decrements applied for screening, diagnostic evaluation after screening recall (32), and stage-specific breast cancer treatment (27). Screening costs for DM and DBT were based on 2018 Medicare reimbursement rates: $140.14 for DM and additional reimbursement of $56.16 for DBT ($196.56 for combination of DM and DBT). Diagnostic costs were based on previously published patterns of use (39), adjusted to 2018 US dollars. We assumed equal costs of diagnostic imaging evaluation in the DBT and DM screening scenarios. We also assumed no change in overall biopsy rates or biopsy costs between the DM and DBT scenarios, because studies that have reported biopsy rates over multiple rounds of DBT screening have shown similar rates compared with DM screening (40,41). Breast cancer treatment costs were based on an updated analysis of Mariotto et al. (31) stage-specific SEER-Medicare costs (Parts A, B, and D) from 2007 to 2013, adjusted for 2018 US dollars (personal communication, A. B. Mariotto).
Analyses
All models simulated US women ages 40 years and older who were undergoing breast cancer screening starting in 2011 and continuing for the expected lifetime of the cohort. Long-term screening outcomes were compared for two screening scenarios: screening with DM alone and screening with DBT in all women participating in breast cancer screening starting in 2011. We assumed that future patterns of screening use, breast density distribution, and adjuvant therapy use and effectiveness remained the same as in 2011.
For each scenario, we estimated lifetime outcomes including breast cancer deaths, life-years, and QALYs. We also projected long-term resource use and harms, including number of false-positive exams and total costs. Cumulative lifetime outcomes were estimated for the entire cohort of women who were ages 40 years and older in 2011 (expressed per 1000 women). Costs and QALYs beyond the year 2010 were discounted at a rate of 3% annually, and incremental cost-effectiveness ratios (ICERs) were calculated using standard methodology (42). Results are reported across all three models to present a range of plausible results given inherent differences in model structures, parameters, and assumptions.
To evaluate the impact of test sensitivity on results, in an alternate scenario we also modeled absolute improvement in sensitivity of DBT of 4% across all age and density groups to reflect the range of improvements in screening sensitivity that have been reported in the literature to date (9,43). Disutilities due to screening and diagnostic recall were also varied from 50% to 150% of the base case values in a one-way analysis because prior cost-effectiveness analyses have demonstrated that ICERs are sensitive to short-term effects of screening on quality of life (27). We also performed a two-way sensitivity analysis to evaluate the combined effects of varying DBT sensitivity and DBT screening cost.
Results
Screening Outcomes
In the base case analysis, breast cancer mortality and life-years were overall consistent between the DBT and DM screening scenarios (Table 3). For example, the reduction in breast cancer mortality with DBT relative to DM ranged across models from 0 to 0.21 deaths per 1000 women screened, and life-years increased from −0.16 to 1.58 years per 1000 women. Small QALY gains were seen with DBT compared to DM, with incremental gains ranging from 1.97 to 3.27 per 1000 women. Compared to the DM scenario, screening with DBT substantially reduced the rate of false-positive examinations by 237–268 per 1000 women (a relative reduction of 24–28%). Assuming an absolute 4% improvement in DBT sensitivity, DBT screening led to small improvements in health outcomes. Breast cancer deaths were reduced by 0.16–0.26 per 1000 women (Table 3). Life-years increased by 2.17–4.36 per 1000 women, and QALYs increased by 3.61–4.97 per 1000 women.
Table 3.
Screening outcomes comparing digital mammography (DM) to digital breast tomosynthesis (DBT) using three simulation models*
| Screening outcomes† | Model | DM | Base case |
Alternative scenario: ↑4% DBT sensitivity |
||
|---|---|---|---|---|---|---|
| DBT | DBT-DM | DBT | DBT-DM | |||
| difference | difference | |||||
| Breast cancer deaths | D | 17.08 | 16.87 | −0.21 | 16.83 | −0.26 |
| GE | 12.42 | 12.41 | −0.02 | 12.27 | −0.16 | |
| W | 14.81 | 14.81 | −0.00 | 14.59 | −0.22 | |
| Life-years | D | 26 258 | 26 259 | 1.58 | 26 261 | 2.68 |
| GE | 27 906 | 27 906 | 0.21 | 27 908 | 2.17 | |
| W | 28 035 | 28 035 | −0.16 | 28 039 | 4.36 | |
| Quality-adjusted life-years | D | 19 297 | 19 300 | 3.27 | 19 301 | 4.11 |
| GE | 20 544 | 20 546 | 2.12 | 20 548 | 3.61 | |
| W | 20 643 | 20 645 | 1.97 | 20 648 | 4.97 | |
| False-positive screens | D | 969 | 732 | −237 | 732 | −237 |
| GE | 911 | 657 | −255 | 657 | −255 | |
| W | 1034 | 767 | −268 | 765 | −269 | |
Screening DBT performance was estimated based on Population-Based Research Optimizing Screening through Personalized Regimens data in Table 1 (base case), and in an alternative scenario, we assumed an absolute 4% increase in sensitivity of DBT. Outcomes are per 1000 simulated US women ages 40–80 years in 2011 followed for the remainder of their lifetimes. Model D = Dana Farber Cancer Institute; Model GE = Georgetown University Medical Center and Albert Einstein College of Medicine; Model W = University of Wisconsin and Harvard Medical School.
Outcomes are undiscounted.
Costs and Cost-Effectiveness
Discounted costs, utilities, and ICERs of DBT relative to DM are shown in Table 4. The transition from DM to DBT increased total costs by $395 553–445 722 per 1000 screening-eligible women. The ICERs for DBT relative to DM ranged from $195 026–270 135 per QALY gained. The cost-effectiveness of DBT screening improved in the alternative scenario of additional gains in sensitivity with DBT; however, the incremental costs per QALY remained high, with ICERs ranging from $130 533 to $156 624 per QALY. Similarly, ICERs improved if higher disutilities were applied for screening and diagnostic evaluation; however, ICERs remained high across the range of disutilities examined, ranging from $301 529 to $530 621 at 50% of the base case values to $144 121–180 820 at 150% of the base case values.
Table 4.
Costs and utilities of digital breast tomosynthesis (DBT) compared to digital mammography (DM) using three simulation models*
| Screening benefits | Model | DM | Base case |
↑4% DBT sensitivity |
||
|---|---|---|---|---|---|---|
| DBT | DBT-DM | DBT | DBT-DM | |||
| difference | difference | |||||
| Quality-adjusted life-years (QALYS) | D | 14 912 | 14 914 | 2.18 | 14 914 | 2.72 |
| GE | 15 683 | 15 685 | 1.67 | 15 685 | 2.46 | |
| W | 15 756 | 15 757 | 1.65 | 15 759 | 3.23 | |
| Costs (US $1 million) | D | $4.60 | $5.03 | $0.43 | $5.03 | $0.42 |
| GE | $4.18 | $4.57 | $0.40 | $4.56 | $0.39 | |
| W | $4.59 | $4.59 | $0.45 | $5.01 | $0.42 | |
| Incremental costs per QALYs gained ($/QALY) | D | — | — | $195 026 | — | $154 865 |
| GE | — | — | $236 858 | — | $156 624 | |
| W | — | — | $270 135 | — | $130 533 | |
Screening DBT performance was estimated based on Population-Based Research Optimizing Screening through Personalized Regimens data in Table 1 (base case), and in an alternative scenario, we assumed an absolute 4% increase in sensitivity of DBT. Outcomes are per 1000 simulated US women ages 40–80 years in 2011 followed for the remainder of their lifetimes. Costs include total costs of breast cancer screening, diagnostic evaluation, and treatment. Outcomes are discounted at 3% annually beginning in 2018. Model D = Dana Farber Cancer Institute; model GE = Georgetown University Medical Center and Albert Einstein College of Medicine; Model W = University of Wisconsin and Harvard Medical School.
The cost-effectiveness of DBT screening was more sensitive to screening costs of DBT, and the value of DBT improved as the cost of a DBT screening exam was lowered from the 2018 Medicare reimbursement rate. For example, when the additional cost of a DBT screening exam relative to a DM examination decreased from $56 to $36, ICERs across all models decreased to $120 613–168 883 per QALY and to $78 731–95 198 when DBT sensitivity was 4% higher. When the additional cost of DBT was lowered to $26, ICERs decreased to $83 087–$118 048 per QALY and to $52 918–65 134 per QALY with 4% higher sensitivity (Figure 1).
Figure 1.
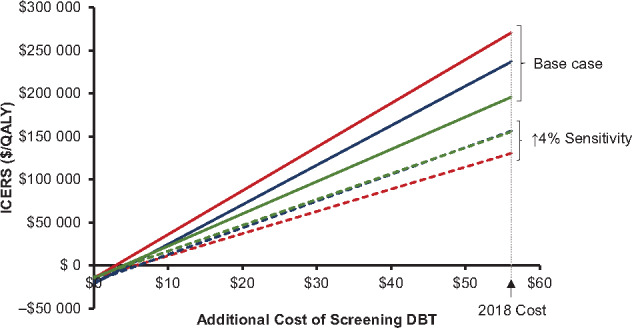
Incremental costs per quality-adjusted life-years (QALYs) gained by digital breast tomosynthesis (DBT) screening relative to digital mammography with varying costs of DBT screening. Additional DBT screening costs relative to digital mammography in 2018 are based on Centers for Medicare and Medicaid Services reimbursement rates (US$56.16). Each model simulated base case scenarios assuming Population-Based Research Optimizing Screening through Personalized Regimens estimates of DBT performance (solid lines) and alternative scenarios assuming 4% improvement in sensitivity with DBT (dashed lines). Green lines = model D; blue lines = model GE; red lines = model W; ICERS = incremental cost-effectiveness ratios.
Discussion
In this comparative modeling analysis, we used three independent, established breast cancer simulation models to project the long-term population impact of transitioning from DM to DBT for routine breast cancer screening in the United States. Our estimates suggest that given current screening patterns in the United States, the use of DBT reduces false-positive examinations while maintaining or slightly improving mortality and quality-of-life outcomes. The additional costs incurred relative to these benefits are high compared with commonly accepted thresholds, although the use of DBT screening could be cost-effective at lower reimbursement rates.
Based on our estimates, the long-term benefits of DBT are driven mostly by improvements in specificity, and the small improvements in cancer detection observed in US studies to date (44) are unlikely to translate to substantial gains in life expectancy or further reductions in breast cancer mortality. Given the modest incremental improvements in sensitivity, the small effects on population-level mortality and life expectancy are not unexpected, because similar findings were observed with the transition from plain film to digital mammography (39). It is important to note that this analysis projected outcomes based on currently observed screening use patterns, which reflect imperfect screening adherence, and these estimates may underestimate mortality benefits compared to more idealized screening conditions. However, although the improvements in breast cancer outcomes are modest, our projected reduction in false-positive examinations (relative reduction of 24–26%) is clinically meaningful. False-positive examinations have been cited as an important screening harm resulting in additional anxiety, time, and costs to women undergoing screening (45). As such, the ability of DBT to improve the specificity of breast cancer screening is an important incentive for its use in routine screening.
Despite these benefits, our analysis suggests that based on current estimates of DBT performance and current reimbursement rates, the shift to using DBT for all routine breast cancer screening may result in a net increase in costs above commonly quoted thresholds of cost-effectiveness, which although controversial have ranged from $50 000 per QALY to $150 000 per QALY (46). It is worth noting that these estimates are specific to current screening patterns and performance in the United States and will vary in other screening settings. For example, in a previous analysis, one CISNET model used in this study found that DBT screening could be cost-effective ($53 893 per QALY) when limited to biennial screening from ages 50 to 74 years for women with dense breasts (14). The incremental costs per QALY are likely higher in the current analysis because we simulated the use of DBT in all women undergoing routine screening in the United States, which includes women with both dense and nondense breasts and women in the 40–49 years age group. In addition, we chose estimates of DBT test performance reflective of data from US studies, which have consistently demonstrated a meaningful reduction in recall rate with the introduction of DBT but have had mixed findings regarding gains in sensitivity and cancer detection rate, many of which have been small and/or statistically nonsignificant (5–8). Interestingly, higher gains in sensitivity and cancer detection with DBT have been reported by prospective European trials (11,43,47), which may reflect differences in screening intervals between Europe, which is predominantly biennial screening, and the United States, which uses a combination of annual and biennial screening (44). Given these differences, incremental costs per QALY gained for DBT screening may be lower in other screening settings. Of note, our estimated ICERs were more sensitive to DBT costs than improvements in test performance, and ICERs decrease to less than $100 000 per QALY when the additional cost of DBT relative to DM is decreased by $20–30.
There are several caveats that should be considered in evaluating our results. First, our model estimates were informed by early observational data of DBT screening performance from the PROSPR consortium, which is one of the largest sources of data for DBT screening performance in the United States. This data source has the advantages of reflecting a mix of community and academic practice settings, as well as data for DBT performance over multiple years of screening rather than a single baseline or prevalence screen. Moreover, screening sensitivity estimates are available because of linkage with state cancer registries. Recently, early performance results from an ongoing randomized, controlled trial in Norway comparing screening with DBT vs DM produced similar findings as observed in the PROSPR consortium, with lower recall rates observed with DBT but no statistically significant difference in sensitivity (48). However, to better understand the magnitude of the effect of DBT, larger observational studies and randomized, controlled trials with long-term follow-up are needed. Until long-term outcomes are available, comparative modeling studies such as ours provide estimates of the long-term impact informed by the available data.
The second limitation is that our estimates for mammography screening use rely on a combination of observed medical record data from the Breast Cancer Surveillance Consortium and self-reported data from the National Health Interview Survey. Mammography use is typically over-reported in survey data compared to observed registry data (49–51), and therefore our modeled scenarios likely overestimate screening use in the population. This is unlikely to influence our cost-effectiveness estimates because we assumed the same screening use between DM and DBT screening scenarios. Additionally, we are unable to perform probabilistic sensitivity analyses to evaluate the uncertainty of all input parameters because of the prohibitively large number of parameters used by the models; instead, by using three independently developed breast cancer models and reporting results across models, our results represent a range of plausible results due to differences in model structure. Finally, we assumed costs of diagnostic evaluation did not differ between the DM and DBT screening scenarios because data for diagnostic workup costs are still limited. Although the cost of diagnostic evaluation in the DBT era may be increased for the diagnostic evaluation using additional DBT views, DBT has also been shown to increase the number of ultrasound-only evaluations and decrease the need for additional mammographic views at the time of diagnostic imaging (52,53). Additional studies are needed to evaluate the impact of DBT on overall costs of diagnostic evaluation.
In conclusion, our comparative modeling analysis suggests that the shift from DM to DBT for routine breast cancer screening in the United States reduces false-positive examinations while achieving modestly improved health benefits. The costs incurred relative to these benefits are likely high based on current US estimates of DBT performance and reimbursement rates; however, DBT screening could be cost-effective at lower reimbursement rates. Given the rapid replacement of DM by DBT in the United States, further exploration is needed to optimize the implementation of DBT in breast cancer screening practices.
Funding
This work was supported by the National Cancer Institute at the National Institutes of Health for CISNET (grant number U01 CA199218), the Population-Based Research Optimizing Screening through Personalized Regimens (PROSPR) Program (grant numbers U54 CA163303, U54 CA163307), and other projects (grant number P30 CA014520), and by a Research Fellow Grant from the Ralph Schlaeger Charitable Foundation (KPL). Data collection for model inputs from the Breast Cancer Surveillance Consortium (BCSC) was supported by National Cancer Institute grant P01 CA154292, contract HHSN261201100031C, and grant U54 CA163303. The collection of BCSC cancer and vital status data used in this study was supported in part by several state public health departments and cancer registries throughout the United States. For a full description of these sources, see https://www.bcsc-research.org/about/work-acknowledgement.
Notes
This work is a collaboration between investigators of the National Cancer Institute-funded CISNET and the National Cancer Institute-funded PROSPR) The modeling work was performed by three independent modeling teams from Georgetown University Medical Center, Lombardi Comprehensive Cancer Center, and A. Einstein College of Medicine (principal investigators [PIs]: Mandelblatt and Schechter), University of Wisconsin-Madison and Harvard Medical School-Harvard Pilgrim Health Care (PIs: Trentham-Dietz, Alagoz, and Stout), and Dana-Farber Cancer Institute (PI: Lee).
The funders had no role in the design of the study; the collection, analysis, and interpretation of the data; the writing of the manuscript; or the decision to submit the manuscript for publication.
Dr Lowry reports a research grant from GE Healthcare through her academic institution. Dr Burnside reports a research grant from Hologic, Inc. Dr Conant reports grant support and consulting work from Hologic, Inc, and iCAD, Inc. Dr Kerlikowske reports grant support from Google Sciences and unpaid consulting with Grail on the STRIVE study. Dr Miglioretti previously served as a member of the Hologic Scientific Advisory Board. Dr Yaffe reports a research collaboration with GE Healthcare and is a shareholder in Volpara Health Technologies.
We would like to acknowledge Angela Mariotto, PhD, for providing SEER-Medicare breast cancer treatment costs, updated from a prior publication: Mariotto AB, Yabroff KR, Shao Y, Feuer EJ, Brown ML. Projections of the cost of cancer care in the United States: 2010–2020. J Natl Cancer Inst. 2011;103(2):117–128.
References
- 1. Siu AL; US Preventive Services Task Force. Screening for breast cancer: U.S. Preventive Services Task Force recommendation statement. Ann Intern Med. 2016;164(4):279–296. [DOI] [PubMed] [Google Scholar]
- 2. Niklason LT, Christian BT, Niklason LE, et al. Digital tomosynthesis in breast imaging. Radiology. 1997;205(2):399–406. [DOI] [PubMed] [Google Scholar]
- 3. Helvie MA. Digital mammography imaging: breast tomosynthesis and advanced applications. Radiol Clin North Am. 2010;48(5):917–929. [DOI] [PMC free article] [PubMed] [Google Scholar]
- 4. Ciatto S, Houssami N, Bernardi D, et al. Integration of 3D digital mammography with tomosynthesis for population breast-cancer screening (STORM): a prospective comparison study. Lancet Oncol. 2013;14(7):583–589. [DOI] [PubMed] [Google Scholar]
- 5. Friedewald SM, Rafferty EA, Rose SL, et al. Breast cancer screening using tomosynthesis in combination with digital mammography. JAMA. 2014;311(24):2499–2507. [DOI] [PubMed] [Google Scholar]
- 6. Haas BM, Kalra V, Geisel J, et al. Comparison of tomosynthesis plus digital mammography and digital mammography alone for breast cancer screening. Radiology. 2013;269(3):694–700. [DOI] [PubMed] [Google Scholar]
- 7. McCarthy AM, Kontos D, Synnestvedt M, et al. Screening outcomes following implementation of digital breast tomosynthesis in a general-population screening program. J Natl Cancer Inst. 2014;106(11):dju316. [DOI] [PMC free article] [PubMed] [Google Scholar]
- 8. Rose SL, Tidwell AL, Bujnoch LJ, et al. Implementation of breast tomosynthesis in a routine screening practice: an observational study. AJR Am J Roentgenol. 2013;200(6):1401–1408. [DOI] [PubMed] [Google Scholar]
- 9. Skaane P, Bandos AI, Gullien R, et al. Comparison of digital mammography alone and digital mammography plus tomosynthesis in a population-based screening program. Radiology. 2013;267(1):47–56. [DOI] [PubMed] [Google Scholar]
- 10. Phi XA, Tagliafico A, Houssami N, et al. Digital breast tomosynthesis for breast cancer screening and diagnosis in women with dense breasts—a systematic review and meta-analysis. BMC Cancer. 2018;18(1):380.. [DOI] [PMC free article] [PubMed] [Google Scholar]
- 11. Bernardi D, Macaskill P, Pellegrini M, et al. Breast cancer screening with tomosynthesis (3D mammography) with acquired or synthetic 2D mammography compared with 2D mammography alone (STORM-2): a population-based prospective study. Lancet Oncol. 2016;17(8):1105–1113. [DOI] [PubMed] [Google Scholar]
- 12. Zuckerman SP, Conant EF, Keller BM, et al. Implementation of synthesized two-dimensional mammography in a population-based digital breast tomosynthesis screening program. Radiology. 2016;281(3):730–736. [DOI] [PMC free article] [PubMed] [Google Scholar]
- 13.U.S. Food and Drug Administration. MQSA National Statistics. https://www.fda.gov/Radiation-EmittingProducts/MammographyQualityStandardsActandProgram/FacilityScorecard/ucm113858.htm. Updated October 1, 2019. Accessed August 9, 2019.
- 14. Lee CI, Cevik M, Alagoz O, et al. Comparative effectiveness of combined digital mammography and tomosynthesis screening for women with dense breasts. Radiology. 2015;274(3):772–780. [DOI] [PMC free article] [PubMed] [Google Scholar]
- 15.U.S. National Library of Medicine. ClinicalTrials.gov. Digital tomosynthesis screening and digital mammography in screening patients for breast cancer. https://clinicaltrials.gov/ct2/show/NCT03233191. Accessed July 31, 2018.
- 16. Lee SJ, Li X, Huang H, et al. The Dana-Farber CISNET model for breast cancer screening strategies: an update. Med Decis Making. 2018;38(suppl 1):44S–53S. [DOI] [PMC free article] [PubMed] [Google Scholar]
- 17. Schechter CB, Near AM, Jayasekera J, et al. Structure, function, and applications of the Georgetown–Einstein (GE) breast cancer simulation model. Med Decis Making. 2018;38(suppl 1):66S–77S. [DOI] [PMC free article] [PubMed] [Google Scholar]
- 18. Alagoz O, Ergun MA, Cevik M, et al. The University of Wisconsin Breast Cancer epidemiology simulation model: an update. Med Decis Making. 2018;38(suppl 1):99S–111S. [DOI] [PMC free article] [PubMed] [Google Scholar]
- 19. Gangnon RE, Sprague BL, Stout NK, et al. The contribution of mammography screening to breast cancer incidence trends in the United States: an updated age-period-cohort model. Cancer Epidemiol Biomarkers Prev. 2015;24(6):905–912. [DOI] [PMC free article] [PubMed] [Google Scholar]
- 20. Holford TR, Cronin KA, Mariotto AB, et al. Changing patterns in breast cancer incidence trends. J Natl Cancer Inst Monogr. 2006;2006(36):19–25. [DOI] [PubMed] [Google Scholar]
- 21. Mandelblatt JS, Near AM, Miglioretti DL, et al. Common model inputs used in CISNET collaborative breast cancer modeling. Med Decis Making. 2018;38(suppl 1):9S–23S. [DOI] [PMC free article] [PubMed] [Google Scholar]
- 22. Gangnon RE, Stout NK, Alagoz O, et al. Contribution of breast cancer to overall mortality for US women. Med Decis Making. 2018;38(suppl 1):24S–31S. [DOI] [PMC free article] [PubMed] [Google Scholar]
- 23.National Cancer Institute Surveillance Epidemiology and End Results SEER 9 Regs Research Data, Nov 2016. Sub (1973–2014). National Cancer Institute, DCCPS, Surveillance Research Program. http://www.seer.cancer.gov. Released April 2017. Accessed December 20, 2018.
- 24. van den Broek JJ, van Ravesteyn NT, Mandelblatt JS, et al. Comparing CISNET breast cancer incidence and mortality predictions to observed clinical trial results of mammography screening from ages 40 to 49. Med Decis Making. 2018;38(suppl 1):140S–150S. [DOI] [PMC free article] [PubMed] [Google Scholar]
- 25. Munoz DF, Plevritis SK.. Estimating breast cancer survival by molecular subtype in the absence of screening and adjuvant treatment. Med Decis Making. 2018;38(suppl 1):32S–43S. [DOI] [PMC free article] [PubMed] [Google Scholar]
- 26. Cronin KA, Yu B, Krapcho M, et al. Modeling the dissemination of mammography in the United States. Cancer Causes Control. 2005;16(6):701–712. [DOI] [PubMed] [Google Scholar]
- 27. Stout NK, Rosenberg MA, Trentham-Dietz A, et al. Retrospective cost-effectiveness analysis of screening mammography. J Natl Cancer Inst. 2006;98(11):774–782. [DOI] [PubMed] [Google Scholar]
- 28.National Comprehensive Cancer Network. NCCN Clinical Practice Guidelines in Oncology: Breast Cancer. 2018. https://www.nccn.org/professionals/physician_gls/pdf/breast.pdf. Accessed December 20, 2018.
- 29. Mariotto AB, Feuer EJ, Harlan LC, et al. Dissemination of adjuvant multiagent chemotherapy and tamoxifen for breast cancer in the United States using estrogen receptor information: 1975-1999. J Natl Cancer Inst Monogr. 2006;2006(36):7–15. [DOI] [PubMed] [Google Scholar]
- 30.Early Breast Cancer Trialists’ Collaborative Group, Peto R, Davies C, Godwin J, et al. Comparisons between different polychemotherapy regimens for early breast cancer: meta-analyses of long-term outcome among 100,000 women in 123 randomised trials. Lancet. 2012;379(9814):432–444. [DOI] [PMC free article] [PubMed] [Google Scholar]
- 31. Mariotto AB, Yabroff KR, Shao Y, et al. Projections of the cost of cancer care in the United States: 2010-2020. J Natl Cancer Inst. 2011;103(2):117–128. [DOI] [PMC free article] [PubMed] [Google Scholar]
- 32. de Haes JC, de Koning HJ, van Oortmarssen GJ, et al. The impact of a breast cancer screening programme on quality-adjusted life-years. Int J Cancer. 1991;49(4):538–544. [DOI] [PubMed] [Google Scholar]
- 33. Munoz D, Near AM, van Ravesteyn NT, et al. Effects of screening and systemic adjuvant therapy on ER-specific US breast cancer mortality. J Natl Cancer Inst. 2014;106(11):dju289. [DOI] [PMC free article] [PubMed] [Google Scholar]
- 34. Tosteson AN, Stout NK, Fryback DG, et al. Cost-effectiveness of digital mammography breast cancer screening. Ann Intern Med. 2008;148(1):1–10. [DOI] [PMC free article] [PubMed] [Google Scholar]
- 35. Conant EF, Barlow WE, Herschorn SD, et al. Association of digital breast tomosynthesis vs digital mammography with cancer detection and recall rates by age and breast density. JAMA Oncol. 2019;5(5):635. [DOI] [PMC free article] [PubMed] [Google Scholar]
- 36. Conant EF, Beaber EF, Sprague BL, et al. Breast cancer screening using tomosynthesis in combination with digital mammography compared to digital mammography alone: a cohort study within the PROSPR consortium. Breast Cancer Res Treat. 2016;156(1):109–116. [DOI] [PMC free article] [PubMed] [Google Scholar]
- 37. D’Orsi CJ, Sickles EA, Mendelson EB, Morris EA, et al. ACR BI-RADS Atlas, Breast Imaging Reporting and Data System. Reston, VA: American College of Radiology; 2013. [Google Scholar]
- 38. Hanmer J, Kaplan RM.. Update to the report of nationally representative values for the noninstitutionalized US adult population for five health-related quality-of-life scores. Value Health. 2016;19(8):1059–1062. [DOI] [PMC free article] [PubMed] [Google Scholar]
- 39. Stout NK, Lee SJ, Schechter CB, et al. Benefits, harms, and costs for breast cancer screening after US implementation of digital mammography. J Natl Cancer Inst. 2014;106(6):dju092.. [DOI] [PMC free article] [PubMed] [Google Scholar]
- 40. McDonald ES, Oustimov A, Weinstein SP, et al. Effectiveness of digital breast tomosynthesis compared with digital mammography: outcomes analysis from 3 years of breast cancer screening. JAMA Oncol. 2016;2(6):737–743. [DOI] [PubMed] [Google Scholar]
- 41. Conant EF, Zuckerman SP, Macdonald ES, et al. Six years of consecutive, population-based screening with digital breast tomosynthesis: outcomes by screening year and by screening round In: Radiological Society of North America Scientific Assembly and Annual Meeting. Chicago, IL; 2018. Abstract 18015610. [Google Scholar]
- 42. Neumann PJ, Sanders GD, Russell LB, et al. Cost Effectiveness in Health and Medicine. 2nd ed New York, NY: Oxford University Press; 2017. [Google Scholar]
- 43. Skaane P, Sebuodegard S, Bandos AI, et al. Performance of breast cancer screening using digital breast tomosynthesis: results from the prospective population-based Oslo Tomosynthesis Screening Trial. Breast Cancer Res Treat. 2018;169(3):489–496. [DOI] [PubMed] [Google Scholar]
- 44. Marinovich ML, Hunter KE, Macaskill P, et al. Breast cancer screening using tomosynthesis or mammography: a meta-analysis of cancer detection and recall. J Natl Cancer Inst. 2018;110(9):942–949. [DOI] [PubMed] [Google Scholar]
- 45. Cullen J, Schwartz MD, Lawrence WF, et al. Short-term impact of cancer prevention and screening activities on quality of life. J Clin Oncol. 2004;22(5):943–952. [DOI] [PubMed] [Google Scholar]
- 46. Neumann PJ, Cohen JT, Weinstein MC.. Updating cost-effectiveness–the curious resilience of the $50, 000-per-QALY threshold. N Engl J Med. 2014;371(9):796–797. [DOI] [PubMed] [Google Scholar]
- 47. Pattacini P, Nitrosi A, Rossi PG, et al. Digital mammography versus digital mammography plus tomosynthesis for breast cancer screening: the Reggio Emilia tomosynthesis randomized trial. Radiology. 2018;288(2):375–385. [DOI] [PubMed] [Google Scholar]
- 48. Hofvind S, Holen AS, Aase HS, et al. Two-view digital breast tomosynthesis versus digital mammography in a population-based breast cancer screening programme (To-Be): a randomised, controlled trial. Lancet Oncol. 2019;20(6):795–805. [DOI] [PubMed] [Google Scholar]
- 49. Carney PA, Goodrich ME, Mackenzie T, et al. Utilization of screening mammography in New Hampshire: a population-based assessment. Cancer. 2005;104(8):1726–1732. [DOI] [PubMed] [Google Scholar]
- 50. Cronin KA, Miglioretti DL, Krapcho M, et al. Bias associated with self-report of prior screening mammography. Cancer Epidemiol Biomarkers Prev. 2009;18(6):1699–1705. [DOI] [PMC free article] [PubMed] [Google Scholar]
- 51. Sprague BL, Bolton KC, Mace JL, et al. Registry-based study of trends in breast cancer screening mammography before and after the 2009 U.S. Preventive Services Task Force recommendations. Radiology. 2014;270(2):354–361. [DOI] [PMC free article] [PubMed] [Google Scholar]
- 52. Lourenco AP, Barry-Brooks M, Baird GL, et al. Changes in recall type and patient treatment following implementation of screening digital breast tomosynthesis. Radiology. 2015;274(2):337–342. [DOI] [PubMed] [Google Scholar]
- 53. Alsheik NH, Dabbous F, Pohlman SK, et al. Comparison of resource utilization and clinical outcomes following screening with digital breast tomosynthesis versus digital mammography: findings from a learning health system. Acad Radiol. 2019;26(5):597–605. [DOI] [PubMed] [Google Scholar]