

SUMMARY
Understanding neural circuit function requires individually addressing their component parts: specific neuronal cell types. However, not only do the precise genetic mechanisms specifying neuronal cell types remain obscure, access to these neuronal cell types by transgenic techniques also remains elusive. Whereas most genes are expressed in the brain, the vast majority are expressed in many different kinds of neurons, suggesting that promoters alone are not sufficiently specific to distinguish cell types. However, there are orders of magnitude more distal genetic cis-regulatory elements controlling transcription (i.e., enhancers), so we screened for enhancer activity in microdissected samples of mouse cortical subregions. This identified thousands of novel putative enhancers, many unique to particular cortical subregions. Pronuclear injection of expression constructs containing such region-specific enhancers resulted in transgenic lines driving expression in distinct sets of cells specifically in the targeted cortical subregions, even though the parent gene’s promoter was relatively non-specific. These data showcase the promise of utilizing the genetic mechanisms underlying the specification of diverse neuronal cell types for the development of genetic tools potentially capable of targeting any neuronal circuit of interest, an approach we call enhancer-driven gene expression (EDGE).
In Brief
Blankvoort et al. identify the enhancers active in microdissected cortical subregions, finding similar numbers of novel and unique putative enhancers as found in entire organs. They use such enhancers to make transgenic mice with expression specific to neurons of the targeted brain region, obtaining specific genetic tools from non-specific genes.
INTRODUCTION
The mammalian brain is arguably the most complex biological structure known, composed of around 1011 neurons in humans [1]. Whereas this number is generally accepted, the same is not true for how many different kinds of neurons exist. Indeed, there is not even a clear consensus as to how to define a neuronal cell type: by morphology; connectivity; gene expression; receptive field type; or some combination of the above? If one takes the expansive view (i.e., all of the above), the numbers quickly become astronomical. For example, current estimates of retinal cell types range between 100 and 150 [2], and dozens of cell types have been proposed for a single hypothalamic area based solely on which genes are expressed [3]. However, gene expression alone is a poor basis for defining cell types, because although most genes are expressed in the adult brain, the vast majority of them are expressed in many different cell types [4]. Identification of neuronal cell types is much more than an issue of taxonomy, it is crucial to understanding brain function. The past two decades have seen the development of revolutionary molecular tools, which allow one to determine the precise connectivity of neurons [5, 6] as well as manipulate [7–9] and observe [10] their activity. Yet, the utility of these powerful tools is often limited by the inability to deliver them at the level of particular neuronal cell types. Almost all existing neuron-specific lines are either made by non-homologous recombination of minimal promoter constructs [5, 11, 12] or knocking the transgene into the native transcript [13, 14], made much easier by the advent of CRISPR/Cas9. Both of these techniques depend upon the specificity of a native promoter, which can recapitulate the expression of the native gene, but that gene will almost always be expressed in multiple neuronal cell types [15–17].
Still, there must be some genetic basis for the remarkable diversity of neuronal cell types. Investigations of eukaryotic transcriptional regulation have revealed that spatiotemporally precise gene expression is achieved by the modular and combinatorial action of a variety of trans-acting factors (i.e., DNA-binding proteins) interacting with cis-regulatory elements (i.e., regions of noncoding DNA termed enhancers) [18]. Whereas the exact number of enhancers remains unknown, estimates run into the millions [19, 20]. This is many times the number of genes or promoters, suggesting that the same gene is expressed in distinct cell types via the activation of different sets of enhancers. Enhancers may therefore enable the generation of molecular genetic tools that are more specific than what is possible using promoter-based methods. Indeed, many of the most specific neuronal driver lines are likely the result of random integration next to a highly specific enhancer [12, 21]. Fortunately, investigators studying the mechanisms of transcription have developed a variety of techniques enabling the identification of the enhancers active in any tissue sample [22–26]. We reasoned that because different cell types are found in different brain regions, enhancers active only in particular brain regions could enable the generation of region- and/or cell-type-specific molecular genetic tools, an approach that we call enhancer-driven gene expression or EDGE (Figure 1).
Figure 1. Experimental Summary of EDGE.

(A) Samples of brain regions of interest are microdissected by hand.
(B) ChIP-seq is performed on these samples, and genome-wide H3K27ac and H3K4me2 signals for each sample are compared to reference signals and signals from the other samples. Bioinformatic analysis algorithms output unique peaks as potential region-specific enhancers (red bar).
(C) Single putative enhancers are cloned into constructs containing a heterologous minimal promoter to drive transgene expression.
(D) Following pronuclear injection of these constructs, the resulting founder mice are crossed to reporter lines and evaluated for desired expression patterns. See also Figure S1.
RESULTS
Enhancer ChIP-Seq of Cortical Subregions Reveals a Striking Diversity of Unique Enhancers
Because promoter-based techniques generally lead to gene expression throughout the telencephalon, we specifically targeted closely related subregions of cortex in the hopes of obtaining regionally specific tools. The following brain regions from two adult (P56) male C57BL6J mice were microdissected (for details, see STAR Methods and Figure S1): the medial entorhinal cortex (MEC); the lateral entorhinal cortex (LEC); the retrosplenial cortex (RSC); and the anterior cingulate cortex (ACC). Each mouse was processed separately, and the samples were used as biological replicates for further analysis. We performed chromatin immunoprecipitation coupled with high-throughput sequencing (ChIP-seq) on homogenized tissue against the active-enhancer-associated histone modifications H3K27ac and H3K4me2 for samples of each of the four brain regions. The regions enriched for H3K27ac reproducibly identified similar numbers of active promoters and distal cis-regulatory sequences between two replicates of each brain subregion (Figure 2A). Nearly 90% of all active promoters were identified in at least two subregions, with the remainder being active in only one subregion (17,032 total; 2,045 unique).
Figure 2. ChIP-Seq Reveals a Striking Diversity of Unique and Novel Enhancers in Different Cortical Subregions.

(A) Pie charts showing the proportions (and numbers) of distinct active genomic elements identified by H2K27ac ChIP-seq of the 4 cortical subregions. These numbers are roughly similar to those found by ChIP-seq of other organs.
(B) Dendrogram (left) and correlation matrix of the H3K27ac signals (right) from replicates of the cortical subregions dissected in this experiment versus those from ENCODE were used for subtraction. Note the relatively high correlation of replicates (except ACC) and clustering of signal from cortical tissues.
(C) Heatmaps showing some of the tissue-specific putative enhancers identified in the microdissected cortical subregions.
When we analyzed more distal sites (>5 kb from a transcriptional start site), we identified a total of 59,372 reproducibly active enhancers in at least one subregion. Of these, 31% were only identified in a single cortical subregion (18,185 unique relative to other subregions). Surprisingly, the number of subregion-specific enhancers in the cortex was similar to the number of total enhancers active in any single tissue in the body thus far investigated [20, 27]. Furthermore, 81% (48,077) of enhancers identified in these subregions were not identified in bulk cortex tissue, presumably due to signal-to-noise ratios. The fact that so many novel and unique enhancers were isolated from a tiny minority of cortical regions demonstrates the potentially vast repertoire of enhancers active in the brain.
Interestingly, when comparing the total number of reproducible peak calls in these 4 cortical subregions (59,372) to the number identified in bulk cortex treated in the same way (13,472), the number of putative active enhancers one obtains from the four cortical subregions is far greater than what one obtains from the entire cortex, even though these four cortical regions compose only a small minority of the entire cortex. Of course, this is comparing 4 pooled samples to a single sample, but each of the individual samples gives numbers similar to bulk cortex (Figure 2). In our view, the most likely explanation for this superficially puzzling result is a reduction in signal-to-noise ratio when pooling heterogeneous sets of tissues for ChIP-seq. This would tend to favor those enhancers that are expressed throughout many cortical subregions at the expense of more specific ones. In support of this, 89% of cortical enhancers were found in one or more cortical subregions, and 78% were found in at least 2 cortical subregions. Compare this to the fact that fully 31% of the enhancers we found in our subregions were specific to that single subregion.
Whereas many of these enhancers identified by peak calls alone are specific to this small number of cortical subregions, the goal of this study was to identify very specific regulatory sequences with limited activity within other regions of the brain as well as the rest of the body. To ensure the identification of such sequences and exclude regions with weak activity else-where, we expanded our comparisons to include a variety of published mouse adult tissues and cultured cell types [27]. We first identified active putative enhancers in these additional mouse samples and merged them to create a unified set of enhancers for consistent comparisons across all samples. We then extracted normalized H3K27ac counts at 108,299 discrete regions from the subregions profiled in this study as well as those from 17 mouse ENCODE samples [27]. Hierarchical clustering of samples revealed two main groups of mouse tissues: neuronal and non-neuronal (Figure 2B). Among non-neuronal tissues, the strongest correlations were observed in developmental stages of heart and tissues that make up the immune system: bone marrow; thymus; and spleen. In neuronal tissues, the four cortical subregions profiled here were well correlated across all enhancers assayed but clustered distinctly from cerebellum, olfactory bulb, and embryonic brain.
We then utilized k-means clustering to identify enhancers that were significantly more active in each cortical region versus each other (Figure 2C) and the other 17 mouse tissues. Those enhancers that were identified as most specifically active in a given cortical subregion were then further filtered to ensure that they were never identified by peak calling in any other mouse tissue. Even though this does not exclude identification of enhancers as unique while they are actually highly enriched, it does increase the specificity and thus the chances of identifying unique enhancers. This stringent analysis yielded 165–1,824 novel and unique putative distal enhancers for each cortical subregion (Figure 2C; Data S1). We then assigned these novel enhancers to putative target genes based upon the GREAT algorithm [28]. Gene ontology analysis suggests these novel enhancers are enriched near genes associated with a variety of neuronal functions (Figure S2). We prioritized these novel putative enhancers based on specificity of the H3K27ac signal relative to other regions and conservation across 30 species. We then cloned a subset of them specific to the entorhinal cortices (ECs) upstream of a heterologous minimal promoter driving the tetracycline transactivator (tTA) [29] for transgenesis (Figure S3).
Region-Specific Enhancers Drive Transgene Expression in Targeted Cortical Subregions
Of course, just because a sequence is identified by ChIP-seq does not mean that it is a valid enhancer, let alone that it can drive region- or cell-type-specific transgene expression. Even a single case of expression in a particular tissue type is not sufficient, because one can obtain specific transgene expression by randomly inserting a construct containing a minimal promoter plus a reporter into the genome. This technique is known as an “enhancer trap,” because it relies upon random insertion near a native enhancer to drive the transgene expression [12, 30]. To ensure that the expression pattern comes from the enhancer construct and not from the insertion site, the standard way to validate a putative enhancer is to show that at least three distinct transgenic embryos (with three distinct random insertion sites) have similar expression patterns [26]. We therefore injected enough oocytes to get at least three genotypically positive founders for each putative enhancer construct. But because our aim was to generate modular genetic tools rather than simply to validate the enhancers, we could not sacrifice the founders to validate the enhancer as is typically done. Instead, the founders were crossed to tTA-dependent reporter mice for visualization of expression patterns.
We selected 8 (notionally) MEC-specific and 2 LEC-specific enhancers for transgenesis. Transgenesis via pronuclear injection is not an efficient process, because it involves random integration into the genome. Whereas one typically only publishes the ones that work, it is worth specifying what issues have to do with transgenesis in general versus using EDGE. When making any transgenic line, some founders do not successfully transmit the transgene to offspring, whereas others fail to express presumably due to negative insertional (a.k.a. positional) effects. For these reasons, only 45 lines derived from 105 genotypically positive founders expressed in the brain when mated to a tetO reporter line, a number that is typical regardless of the injection construct. Notably, nearly all of them (41) expressed the reporter in the EC, including at least one from each of the 10 enhancer constructs (Figure S4; Table S1). Because an enhancer trap would lead to random expression patterns, this alone suggests that the specificity of expression comes from the transgenic enhancer. At least as compelling is the fact that, when we obtained multiple distinct founders with a given enhancer construct, almost all of them had similar expression patterns (see Figure S5 for examples).
Figure 3A shows an example of the results of our bioinformatic analysis for one of the eight MEC enhancers (MEC-13–81; see STAR Methods for nomenclature), which GREAT associated with the gene Kitl. Note that the promoter region (vertical yellow band) is a strong peak in all brain regions, consistent with expression of the Kitl mRNA throughout the brain (Figure 3B). The same is true for other putative enhancers (horizontal black bars). In contrast, the downstream enhancer peak used for transgenesis (MEC-13–81; Figure 3A, blow-up), whereas not as strong as some of the other peak calls, is greatly enriched in MEC. Figure 3C shows the result of crossing the transgenic line MEC-13–81B to a tetO-ArChT payload line [31]. Remarkably, even though the Kitl promoter expresses throughout the brain (including multiple layers of the EC; Figure 3B), the tetO-ArChT payload is confined to layer II of MEC (Figure 3C). In other words, one can obtain highly specific targeted gene expression from regionally specific cis elements of non-specific genes.
Figure 3. The Enhancers of Non-specific Genes Drive Region-Specific Transgene Expression.
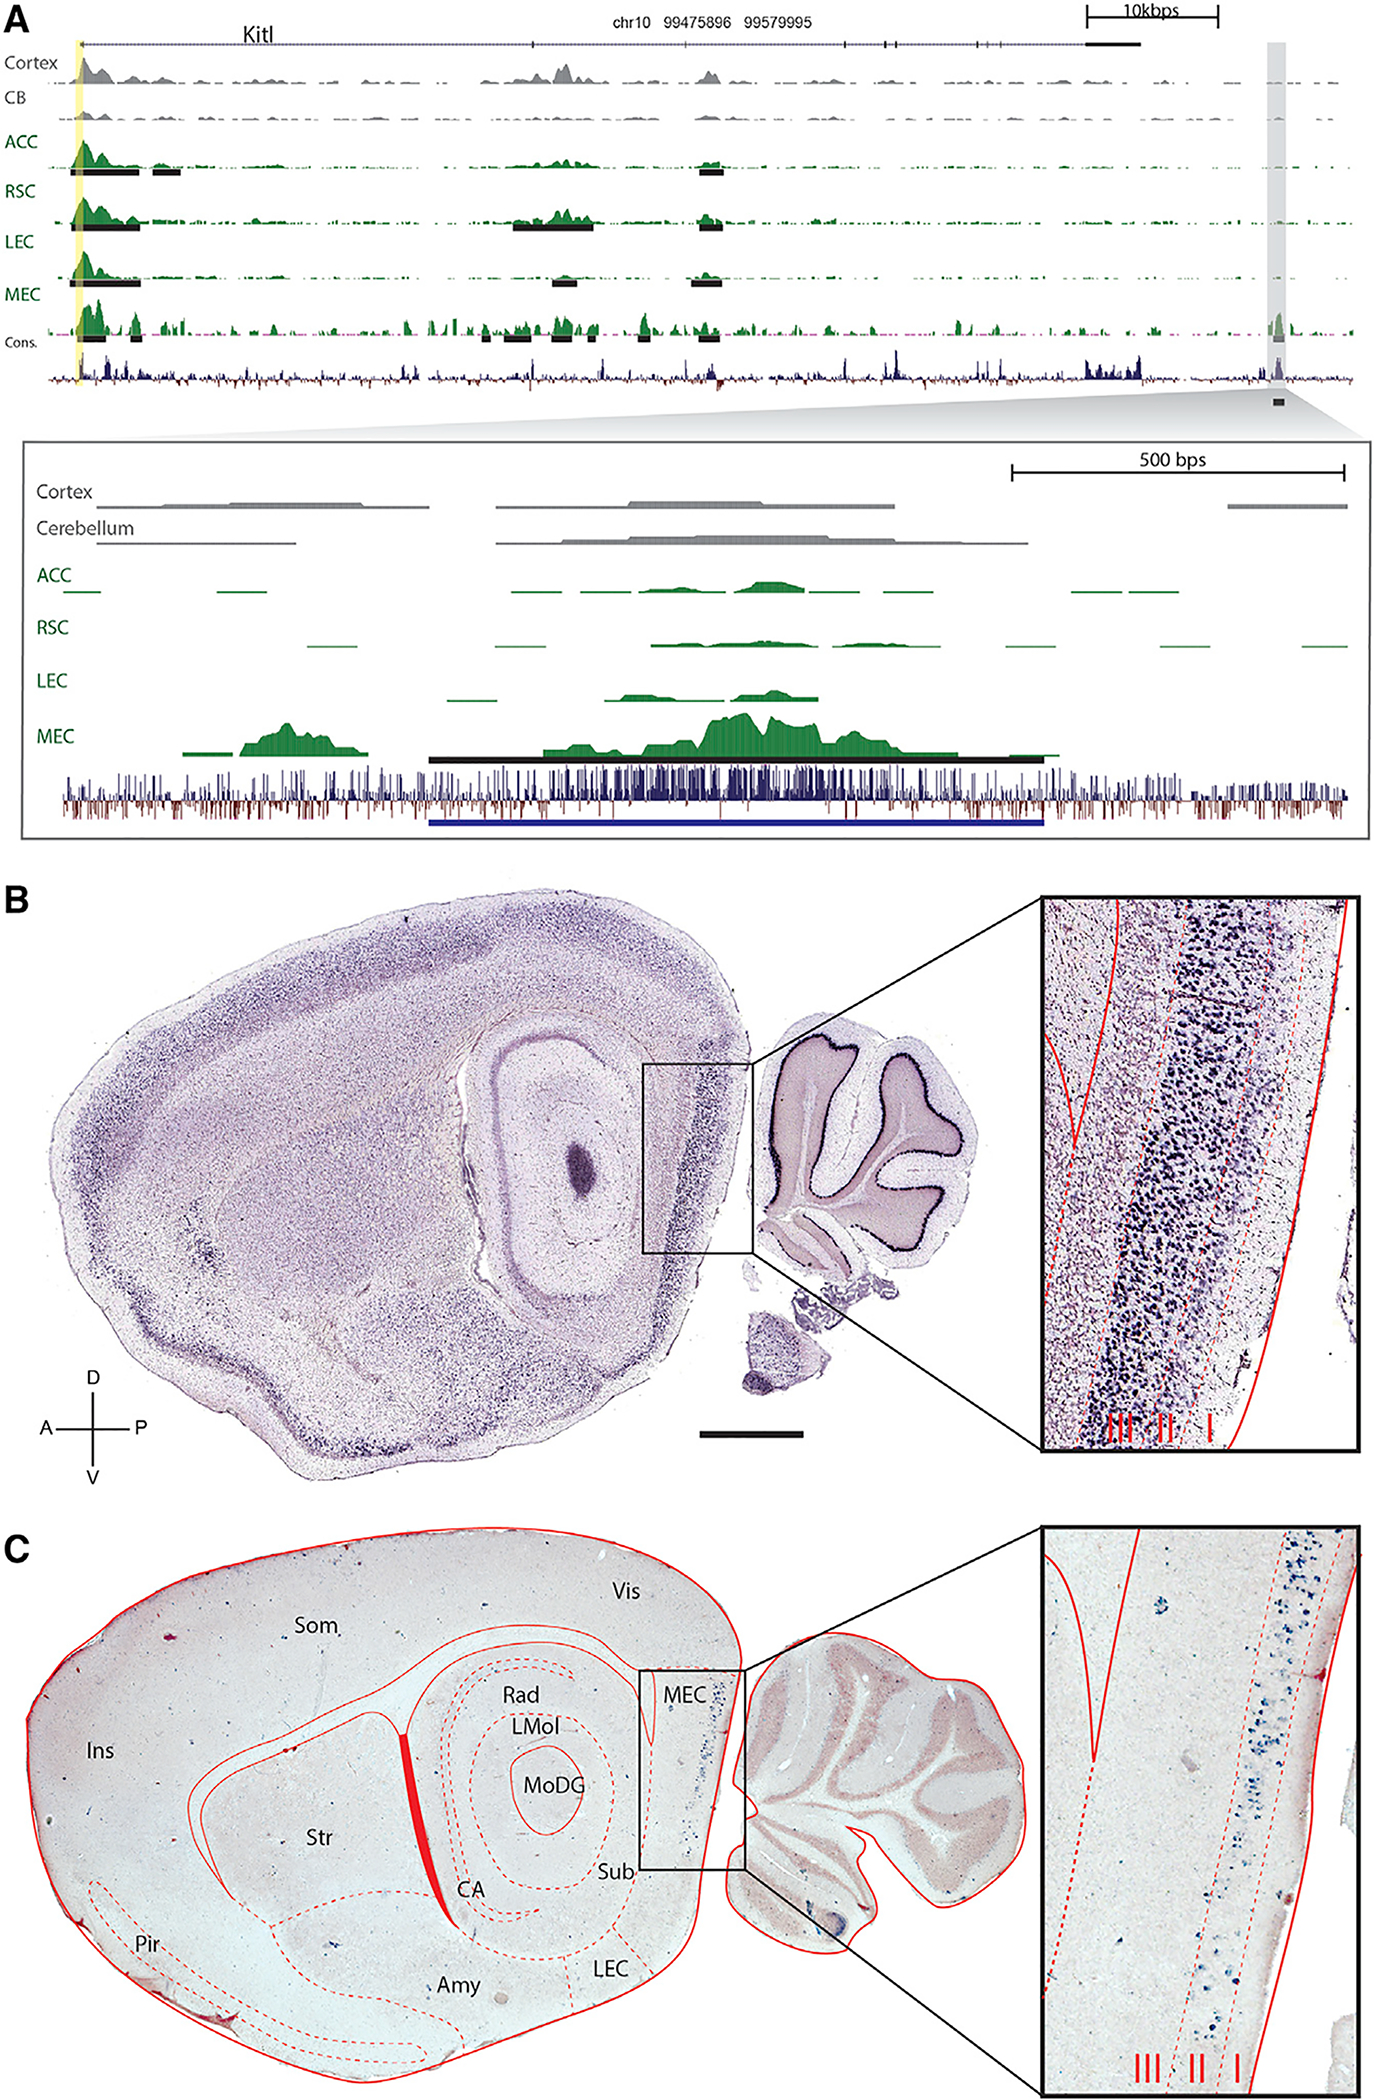
(A) A genomic view of one of the 165 MEC-specific enhancers yielded by ChIP-seq analysis. The top panel indicates the location and coding regions of Kitl as well as H3K27Ac signal for two regions from roadmap epigenome (cortex and cerebellum), the four regions we analyzed (ACC, RSC, LEC, and MEC), and conservation over 30 species. The vertical yellow column indicates the promoter region upstream of the transcriptional start site. Peak calls are denoted by the black horizontal lines. The specific genomic region containing the enhancer (MEC-13–81) is blown up in the bottom panel.
(B) In situ hybridization (ISH) (http://brain-map.org) of Kitl, the gene associated with enhancer MEC-13–81 shows expression throughout cortex, hippocampus, and cerebellum.
(C) tTA-dependent transgene Arch driven by the enhancer (ranked number 81) is expressed in MEC LII. The scale bar represents 1,000 μm. Sagittal plane, dorsal-ventral, and anterior-posterior axes are indicated.
Amy, amygdala and associated regions; CA, both cornu ammonis fields of the hippocampus; Ins, insular cortex; LEC, lateral entorhinal cortex; LMol, molecular layer of the hippocampus; MEC, medial entorhinal cortex; MoDG, molecular layer of the dentate gyrus; Pir, Piriform cortex; Rad, stratum radiatum of the hippocampus; Som, somatosensory cortex; Str, striatum; sub, subiculum; Vis, visual cortex. Layers I, II, and III of the MEC are indicated in the blow-up to the right. See also Figures S3–S6 and Table S1.
The same basic result of highly specific expression from single enhancers of non-specific genes was also true for 4/8 MEC- and 2/2 LEC-specific enhancer constructs we injected, although the correspondence between the ChIP-seq signal and the expression was not always as tight. Figure 4 compares the expression patterns of representative transgenic driver lines made with other injection constructs containing either MEC-specific enhancers (Figures 4A–4C, right column) or LEC-specific enhancers (Figures 4D and 4E, right panel; extended medial-lateral of sections range in Figures S4A–S4F) compared to the expression pattern of the presumed associated native gene (Figure 4, left column). Note that, whereas each associated gene is broadly expressed in the brain, the transgenic lines all express more or less specifically in the brain region the enhancers were isolated from. When crossed with broadly expressing tTA lines (such as CaMKIIa) [11], these tetO payload lines express broadly (see references for published lines and Figure S6 for our as-of-yet unpublished tetO-GCaMP6 line). These data show that one can obtain targeted region-specific (and possibly even cell-type-specific) expression from elements of a non-specific promoter by using one of its region-specific enhancers to drive a heterologous core promoter. Even those enhancers that were less specific still gave rise to lines that were enriched in the EC relative to the expression of the native gene (Figures S4G–S4J). This in effect solves the problem that most genes are expressed in multiple cell types in the brain: using EDGE, one can dissect out the individual genetic components that underlie the expression of a “non-specific” gene in multiple cell types.
Figure 4. Distinct MEC-Specific Enhancers Drive Transgene Expression in Distinct Sets of Cells in MEC.

(A–E) ISH showing expression patterns of the native genes Atp10a (A), Odz3 (B), Trps1 (C), Dok5 (D), Nos1 (E) associated with EC-specific enhancers (left column). ISH shows EC-specific expression of transgenes driven by the corresponding EC-specific enhancers (right column); tTA-driven transgenes are in parentheses. ISH for the native genes is from http://brain-map.org. The scale bar in (A) represents 1,000 μm. See also Figures S4–S6 and Table S1.
Region versus Cell-Type-Specific Expression?
The above results show that subregion-specific expression can result from subregion-specific enhancers. Whether such enhancers drive expression in specific cell types in the targeted brain region is a more difficult question to answer, in large part because there is no consensus as to the number of cell types in the brain or how to classify them. However, there are indications that some of these enhancers can specify particular cell types, at least to the level of granularity current knowledge permits. First, the different EC enhancers tend to drive expression in different layers of the EC (Figures 3, 4, and S7), and neurons in different cortical layers are almost by definition different cell types. By the same logic, some of these enhancers are clearly not cell type specific (Figures S4G–S4J). Because four of the enhancers drive expression in layer II, this raises the question of whether they specify the same cell type or distinct biological subpopulations. We therefore investigated the expression of immunohistochemical markers used to characterize cell types of EC in two layer-II-expressing lines derived from MEC-specific enhancers (Figures 5A, 5B, 6A, and 6B). The underlying logic is that, if the two distinct enhancers drive transgene expression in subsets of the exact same cell type(s), they should both express the same proportions of neurochemical markers. Neither of the two enhancers appear to drive expression in inhibitory neurons (Figures 5I–5L and 6I–6L), so the question becomes whether they express in different types of excitatory neurons. Excitatory neurons in EC layer II are typically further subdivided into reelin-positive cells and calbindin-positive cells [32]. Line MEC-13–53A expressed exclusively in reelin+ neurons (Figures 5C–5H and 5L), whereas line MEC-13–104B roughly corresponds to the relative densities of the two cell types (Figures 6C–6H and 6L). Thus, it appears that MEC-13–53A is a stellate cell-specific enhancer, whereas MEC-13–104B is found in both neurochemical kinds of excitatory cells of layer II described to date. This means that some enhancers specify different subsets of cells even within a single cortical layer, showing the potential of enhancers to distinguish between cell types with a finer granularity than possible with native promoters. Of course, the functional significance, if any, of these subsets of cells remains to be demonstrated.
Figure 5. Single Enhancers Can Drive Expression in Histochemically Defined Subsets of MEC LII Cells.

(A and B) Horizontal section of a mouse cross between MEC-13–53A and TVAG showing MEC (A) and a full hemisphere (B). Immunohistochemical transgene detection with anti-2A antibody (Ab) shows layer II EC-specific expression.
(C, F, and I) Anti-2A histochemistry in sections co-stained against Reelin (C), Calbindin (F), and GAD67 (I).
(D) Anti-reelin.
(G) Anti-calbindin.
(J) Anti-GAD67.
(E, H, and K) Overlays of the two signals co-stained against Reelin (E), Calbindin (H), and GAD67 (K); each row is the same section.
(L) 100% (1,162/1,162 counted cells) of transgenic cells co-localize with reelin, but there is essentially 0% co-localization with calbindin (2/1,151) and GAD67 (0/738).
(M) 49.4% (1,162/2,353) of all reelin-positive cells were positive for the transgene; essentially none of the other cell populations had any transgene-expressing cells. Total numbers of cells are counted in white.
(N) Schematic summary of the data in (C)–(M).
The scale bars represent 1,000 μm in (B), 200 μm in (A), and 50 μm in (C)–(K). In all graphs, bars show the mean ± SEM. See also Figure S7.
Figure 6. Different Single Enhancers Can Drive Expression in Histochemically Distinct Subsets of MEC LII Cells.

(A and B) Horizontal section of a mouse cross between MEC-13–104B and tetO-EGFP showing MEC (A) and a full hemisphere (B). Immunohistochemical transgene detection with anti-GFP Ab shows expression in layer II of the EC.
(C, F, and I) Anti-GFP histochemistry in sections co-stained against Reelin (C), Calbindin (F), and GAD67 (I).
(D) Anti-reelin.
(G) Anti-calbindin.
(J) Anti-GAD67.
(E, H, and K) Overlays of the two signals co-stained against Reelin (E), Calbindin (H), and GAD67 (K); each row is the same section.
(L) 43.1% (741/1,717 counted cells) of transgenic cells in layer II of the EC co-localize with reelin whereas 26% (482/1,855) of them co-localize with calbindin. 0% (0/1,579) co-localize with GAD67.
(M) 43.1% (741/1,721) of all reelin-positive cells in layer II of the EC were positive for the transgene, and 28.5% (482/1,635) of all calbindin-positive cells in layer II of the EC were positive for the transgene, whereas 0% (0/430) of the GAD67-positive population had any transgene-expressing cells. Total numbers of cells are counted in white.
(N) Schematic summary of the data in (C)–(M).
The scale bars represent 1,000 μm in (B), 200 μm in (A), and 50 μm in (C)–(K). In all graphs, bars show the mean ± SEM. See also Figure S7.
DISCUSSION
We demonstrate the existence of thousands of previously undescribed putative enhancers uniquely active in targeted cortical subregions of the adult mouse brain. We took a small subset (10/3,740) of the enhancers that were specific to the EC and combined them with a heterologous minimal promoter to make transgenic mice expressing the tTA transactivator. When crossed to tetO payload lines, we obtained transgene expression specific to the EC and possibly even particular cell types in the targeted region. The genes that these enhancers (presumably) act upon are nowhere near that specific. Most genes express in multiple cell types in the brain. Because there are only around 24,000 genes (and around 46,000 promoters) [19] but estimated millions of putative enhancers [19, 20], this implies that the same gene is expressed in different cell types by using different sets of enhancers acting upon the same promoter (Figure 7). In turn, this suggests that there may be a genetic diversity in the brain beyond most estimates of the number of distinct neuronal cell types in the cortex [33–36]. Moreover, this provides a strategy to make genetic tools with far greater cell type and regional specificity of expression than promoter-based methods, by far the dominant means to generate neuron-specific transgenic animals to date.
Figure 7. Schematic of Putative Genetic Basis for EDGE Technology.

(A) Native gene expression: a gene “X” is expressed in multiple cell types in distinct brain areas. Expression in each cell type is driven by distinct sets of color-coded active enhancers acting upon the native core promoter (pink triangle). Promoter-based methods of transgene expression, such as bacterial artificial chromosome (BAC) transgenesis and knockins, respectively, include several or all of the native enhancers, thereby recapitulating some or all of the expression pattern of the native gene.
(B) Enhancer-driven gene expression: a single active enhancer isolated from a particular brain region drives transgene expression from a heterologous minimal promoter (blue). This leads to transgene expression that is restricted to a particular region-specific subset of the cell types that the native promoter expresses in, greatly increasing the anatomical specificity relative to promoter-based methods or the native gene.
EDGE Is a Method to Create Neuron-Specific Tools for Targeted Brain Regions
Whereas the above discussion illustrates the power of this technique, it is important to be clear about what is and is not novel about what has been presented here. A variety of forms of enhancer ChIP-seq have existed for roughly a decade [22, 26], and the general concept that the same gene is expressed in different tissues by the use of different enhancers is even older [30]. Hundreds of thousands of putative enhancers have already been identified in the mouse genome by dissection of distinct tissues (including cortex) followed by ChIP-seq [20, 27]. Indeed, a molecular geneticist in the transcription field may find the results presented here unsurprising, as generation of a transgenic animal is how putative enhancers are biologically verified, although the transgenic founders are typically killed in the process [22, 25, 26, 37]. In short, we have not invented any novel techniques, but we demonstrate how the application of these existing technologies to the adult brain could potentially provide systems neuroscientists with a means to make cell-type-specific tools for any brain region of interest, greatly facilitating the study of the functional circuitry of the adult brain.
Putting our results into context requires discussing the rich literature that inspired our approach. A variety of recent papers used various techniques to suggest a highly diverse chromatin landscape in the adult brain, indicative of a diversity of enhancers. One group has performed ChIP-seq on 136 different dissected human brain regions, obtaining over 80,000 putative enhancers [38]. Another group has used assay for transposase accessible chromatin coupled with high-throughput sequencing (ATAC-seq) to profile open chromatin in transgenically defined excitatory cells from different layers of the mouse visual cortex [39]. They found a diversity of putative cis-acting sequences even within single layers of a single type of cortex, implying distinct classes of cells. Finally, using single-cell methylomes, Luo et al. [40] have shown that neuron type classification is supported by the epigenomic state of regulatory sequences. Nonetheless, in none of these cases were these putative enhancers biologically verified or used to make molecular genetic tools, which is the point of this paper.
Conversely, many enhancers derived from the developing brain have in fact been biologically verified and even used to make transgenic lines and viruses [41]. Evolutionarily conserved single enhancers demonstrably label specific subsets of cells during development [25, 26, 37, 42], with different subsets active in different developmental epochs [43]. Of particular interest is a pair of papers from the Rubenstein lab examining the activity of enhancers derived from the developing (embryonic day 11.5 [E11.5]) telencephalon. They made CreER lines from the pallium (14 lines) [44] and subpallium (10 lines) [45] to illustrate the fate maps of the telencephalic subdivisions by comparing expression patterns at several time points during development and young adulthood. By examining in vivo transcription factor occupancy, they showed that broadly expressed transcription factors interact with far more specific enhancer elements [44].
Taken together, all these studies provide part of the basis for what is presented here. However, their focus was on the transcriptional and developmental mechanisms of neural cell fate relatively early in development. As these and other studies demonstrated, every neuroepithelial cell present at this time will have many daughter cells that will further differentiate during development into many more neuronal and non-neuronal (e.g., glia) cell types [46, 47]. Presumably, for this reason, these enhancers show relatively broad expression in the adult brain [45]. Subpallial enhancers, as expected, tended to drive expression in GABAergic cells but do not distinguish between the various known subtypes of GABAergic interneurons [41, 48]. Therefore, although these tools are valuable to the elucidation of cell line-ages, they are not necessarily more specific than promoter-based transgenic lines [15], which, as noted earlier, are not always specific enough for the analysis of native neural circuits.
Thus, a seemingly trivial difference in technique results in a large increase in utility for systems neuroscience. Applying the same methods discussed above to microdissected adult cortical subregions allows one to make molecular genetic tools apparently specific to particular cell types of the targeted brain regions. The microdissection is not in fact a trivial feature: by examining four subregions of the cortex separately, we found around four times as many reproducible peak calls as were obtained from the entire cortex [27], even though these four subregions together comprise a small minority of the cortex. This implies that individual cortical subregions contain their own epigenetically distinct cell types, which are washed out when pooled. Similarly, there is relatively little overlap between the enhancers active in the embryonic brain and those we have obtained from adult brain (Figure 2). Hence, it would be interesting to work backward and study the developmental expression of EDGE lines made from subdivisions of the adult brain to investigate the genetic signatures of the pre- and postnatal processes that specify the enormous variety of neuronal cell types present in the fully differentiated adult brain. In sum, we do not claim to have discovered anything novel about transcription in the brain, although the sheer number of novel putative enhancers unique to particular cortical subregions was surprising, or the methods described herein. What we claim is both novel and significant is the application of these methods to the generation of anatomically specific tools, enabling the study of the circuit dynamics of the adult brain [49].
It is worth mentioning that EDGE is not the same as enhancer traps. In enhancer traps [12, 30], one randomly inserts a minimal promoter construct into the genome in the hopes of integrating near a specific enhancer whereas EDGE involves the identification and use of enhancers specific to particular brain regions. The key advantage of EDGE over enhancer traps is anatomical targeting. To illustrate, we can compare our results to those of a recently published enhancer trap study [12] using a lentiviral vector containing the exact same minimal promoter we used. Because we are interested in the EC, we consider the creation of EC-specific lines the goal, as in the current study. The total number of genotypically positive founders that express in the brain are similar (45/105: 43% herein versus 42/151: 28%), and both techniques can yield very specific expression patterns. The key difference is the number of lines expressing in the EC at all (41/45: 91% herein versus 6/42: 14%) and especially those more or less specifically expressing in the EC (16/45: 36% versus 0/42: 0%). This illustrates the difference between the two approaches: enhancer traps result in expression in random cell types throughout the brain (and indeed the entire body), whereas EDGE targets those cell types found in particular brain regions of interest.
Of course, not everyone is interested in the EC. Whereas we subtracted out any enhancers that expressed anywhere but the MEC (or LEC), other investigators interested in other brain regions can use the same strategy to develop tools specifically targeting their brain regions of interest. This process can occur for any brain regions, potentially providing cell-type-specific tools to interrogate any neural circuit. Moreover, the more subdivisions of the brain one collects, the more one can subtract, so therefore the more specific the resulting putative enhancers will be. With this in mind, we have initiated a second round of enhancer ChIP-seq with over 20 brain subregions, which will provide a much more generally useful resource. Finally, the relatively small size of the enhancers means they can fit easily in viral vectors. If EDGE viruses recapitulate the anatomical specificity seen in transgenic mice, this will potentially bring EDGE to bear on any species [41]. This could revolutionize not only systems neuroscience but ultimately provide a novel therapeutic avenue to rectify the circuit imbalances that underlie disorders of the CNS.
Do Enhancers Specify Neuronal Cell Types in the Brain?
One of the most interesting questions in neuroscience is how we should think about the 100 or so billion neurons in our brains—as unique actors or as repeated elements in a printed circuit? The answer is likely somewhere in between. Several investigators have proposed a canonical circuit for the neocortex [50, 51], with regional variations, and there are clearly commonalities in neocortical circuits, particularly with regards to layer-specific connectivity. Yet, within this general canonical theme, there are uniquely specialized cell types in individual cortical subregions. Our results demonstrate that there are thousands of putative enhancers unique to cortical subregions, a number far larger than the number of genes that are specific to these subregions (indeed, to our knowledge, there are no EC-specific genes). Why do the same genes use different enhancers to express in different cortical subregions? There are not yet enough data for a satisfactory answer, but the developmental literature discussed above would suggest a combinatorial code of transcription factors and active enhancers for each unique cell fate. If so, enhancer usage could provide a finer grained differentiation of cell type than gene expression alone. The fact that there are hundreds to thousands of unique enhancers in individual cortical subregions means that the genetic machinery exists to have a similar number of differentiable cell types. In support of this, a recent study of the transcriptome of thousands of individually sequenced neurons from two different cortical regions finds a large number of distinct transcriptional profiles between excitatory, but not inhibitory, neurons [52]. This (as well as the fact that inhibitory neurons are a small minority of cortical neurons) may explain why we only obtained expression in excitatory neurons when we selected region-specific enhancers.
EDGE allows the generation of tools that provide a means to investigate the nature of neuronal cell types. For example, three of the enhancer constructs presented here drive expression in layer II of MEC, two of which (MEC-13–53 and MEC-13–81) exclusively in reelin-positive neurons (Figure 5; data not shown for MEC-13–81). MEC LII reelin-positive neurons are stellate cells, which is arguably a cell type, but neither line expresses in 100% of reelin-positive neurons. There are two possible explanations for this, the first one being that these distinct enhancers drive expression in functionally distinct subsets of stellate cells [52, 53]. The other possibility is that each enhancer drives expression in stellate cells as part of a co-regulated network of enhancers specifying this cell type [38]. If so, the difference in percentage of expression in stellate cells is largely artefactual, resulting from differential penetrance of transgene expression of otherwise identical cells due to mosaicism arising from insertional effects. The exhaustive biochemical, anatomical, and electrophysiological characterization of each line necessary to provide a definitive answer to the relationship between these enhancers and cell types is beyond the scope of this paper. However, the fact that there are so many enhancers unique to specific cortical subregions implies the potential for a more direct connection between the molecular identity of a cell and cell type in other terms. Moreover, it is entirely possible that further subdivisions of the cells specified by these transgenic lines could provide even more specific expression. This could be achieved in a variety of ways, for example, by finer manual microdissection, laser capture microscopy, or even nested ChIP-seq of transgenically labeled cells isolated by a cell sorter from microdissected tissue.
Regardless, our results certainly do not suggest that every enhancer defines a distinct cell type; in fact, several of our lines express in more than one layer. There is not necessarily a one-to-one correspondence between cell types and enhancers: a single cell type could be specified by multiple unique enhancers, i.e., a co-regulated enhancer network [38]. Conversely, different cell types may arise from distinct combinatorial codes of active enhancers, meaning the number of different cell types may conceivably be even larger than the number of unique enhancers. Finally, there are other reasons for differential sets of active enhancers beyond definition of cell type: neural activity changes the chromatin landscape [54]. This means that activity of differential enhancers does not automatically imply different cell types but changes in function of a given cell. Nevertheless, differential enhancer utilization does signify distinct epigenetic signatures, even if their functional significance is currently unclear. We therefore maintain that a powerful way to investigate the relationship of diverse cis-acting elements of the genome to the functional circuitry of the brain is to create and study enhancer-specific tools like those presented here.
STAR★METHODS
Detailed methods are provided in the online version of this paper and include the following:
CONTACT FOR REAGENT AND RESOURCE SHARING
Further information and requests for resources and reagents should be directed to and will be fulfilled by the Lead Contact, Cliff Kentros (clifford.kentros@ntnu.no).
EXPERIMENTAL MODEL AND SUBJECT DETAILS
The experimental model used in this study is the rodent M. musculus. For the microdissection two C57BL/6J mice (Jackson Laboratory, stock no. 000664, P56, one male, one female) were used. For pro-nuclear injection B6D2F1 mice were used. The resulting offspring were backcrossed with C57BL/6J mice and various reporter lines. The mice used for histology were a mix of male and female, taken from several litters when multiple individual mice were investigated, and were at least 6 weeks old.
All mice were kept on a 12-h light/12-h dark schedule in a humidity- and temperature-controlled environment. All experiments in Norway were performed in accordance with the Norwegian Animal Welfare Act and the European Convention for the Protection of Vertebrate Animals used for Experimental and Other Scientific Purposes. All experiments involving animals in Oregon (pronuclear injection and husbandry of the resulting animals) were performed in accordance with guidelines approved by University of Oregon’s Animal Care and Use Committee and the National Institutes of Health Guide for the Care and Use of Laboratory Animals (National Institutes of Health Publications No. 80–23).
METHOD DETAILS
Microdissection
Two C57BL/6J mice (P56) were deeply anesthetized by injection with pentobarbital (100mg/ml in 96% ethanol, Ås produksjon-slab AS). The brains were removed and horizontal or coronal 500 μm sections were cut on a Leica VT 1000 S microtome and kept at 4°C until dissection. Bilateral dissection was performed, while watching the tissue through a dissection microscope with transmitted and reflected white light (Zeiss Discovery V8 stereomicroscope) applying architectonic criteria [61–65] to unstained tissue. The tissue samples were snap-frozen in liquid nitrogen, kept at −80°C and shipped on dry ice.
All dissections avoided border regions (i.e., centered in the identified cortical area). In horizontal sections, MEC is easily recognized by the marked shape of the cortex, the prominent white, opaque lamina dissecans and the radial organization of the layers deep to the lamina dissecans. Layer II neurons are large spherical neurons, which differ markedly in level of opacity from those in layer III. The medial border between MEC and parasubiculum is characterized by the loss of the differentiation between layers II and III, and the border with the laterally adjacent postrhinal cortex is characterized by the loss of the large spherical neurons in layer II [61–65]. We only sampled the more dorsal and central portions of MEC. LEC shares the large layer II neurons with MEC, but the radial organization in layer V is absent. The anterior and dorsal border of LEC with the perirhinal cortex is characterized by the abrupt disappearance of the large layer II neurons. We only sampled the most lateral portions of LEC, as to avoid contamination with ventromedially adjacent components of the amygdaloid complex. ACC and RSC were sampled from the medial wall of the lateral hemisphere above the corpus callosum, avoiding the most anterior part of ACC and the posteroventral part of RCS. Since the border between the two areas coincides with the dorsal-anterior tip of the hippocampal formation, all samples avoided that border region.
In coronal sections, ACC and RSC samples were taken dorsal to the corpus callosum, just below the shoulder of the medial wall of the hemisphere down to, but not touching the corpus callosum, as to avoid inclusion of the indusium griseum. Samples were taken from sections anterior to the most anterodorsal tip of the hippocampal formation in case of ACC and posterior to the tip in case of RSC. Samples of LEC were collected one section after the disappearance of the piriform cortex characterized by a densely packed thick layer II, a polymorph lightly packed deeper cell layer and the presence of the endopiriform nucleus. LEC shows cytoarchitectonic features similar to those described above. We sampled only from the vertical part of LEC, directly below the rhinal fissure. For MEC, samples were collected from more posterior coronal sections, using shape of the section, the presence of the ventral hippocampus and cytoarchitectonic features as described above as our selection criteria.
ChIP-seq
All dissected brain tissues were briefly homogenized and cross-linked with 1% formaldehyde at room temperature with rotation for 15 min. Cross-linking was quenched with glycine (150mM in PBS), then tissue was washed and flash frozen. Chromatin was extracted as previously described [25, 66]. Briefly, nuclei were extracted, lysed and sonicated (30 min, 10 s pulses) to produce sheared chromatin with an average length of ~250 bp. 1–10μg of final soluble chromatin was used for each ChIP and combined with Protein G Dynabeads (Invitrogen, cat# 10004D) prebound with 5μg of antibodies to H3K4me2 (Abcam ab7766) or H3K27ac (Abcam ab4729). Immunoprecipitated chromatin was washed five times with 1mL of wash buffer and once with TE. Immunoprecipiated chromatin was eluted, cross-links were reversed, and DNA was purified. Libraries were prepared for sequencing using NEBNext ChIP-Seq Library Prep reagents and sequenced on the Illumina HiSeq 2000 platform at the Yale Center for Genome Analysis.
Cloning of transgenic constructs
The putative enhancers sequences were cloned from BACs (chori.org) and transferred to pENTRtm/D-TOPO® vectors by TOPO® cloning (Invitrogen, K2400–20). The putative enhancers were transferred to injection plasmids by gateway cloning® (Invitrogen, 11791–019). The resulting plasmids consist of a putative enhancer followed by a mutated heatshock promoter 68 (HSP68), a tTA gene, a synthetic intron and a WPRE element (Figure S3).
Pronuclear injection
The 10 injection plasmids were linearized by enzyme digestion to keep the relevant elements but remove the bacterial elements of the plasmids. Linearized vectors were run on a 1% agarose gel and isolated using a Zymoclean Gel DNA Recovery Kit (Zymo research, D4001). Fertilized eggcells were injected with 1 μl of DNA at concentrations of 0.5 to 1 ng/μl, leading to surviving pups of which 96 were genotypically positive for MEC and 9 were genotypically positive for LEC (Table S1). Pronuclear injections were done at the transgenic mouse facility of the University of Oregon.
Mouse husbandry
Mouse lines were named after the ranked enhancers identified in this study, as specified in Data S1. The nomenclature consists of first the targeted region, second the year of microdissection, third the rank of the enhancer that corresponds with the row in Data S1 and finally a letter for the founder. To illustrate, line MEC-13–53A is based on MEC tissue isolated in 2013, where the particular enhancer was ranked 53 and the founder is specified by the “A.”
All genotypically positive founders based on MEC enhancers were initially mated with histone GFP mice (Jackson laboratory, Tg(tetO-HIST1H2BJ/GFP)47Efu, stocknr. 005104), while those based on LEC enhancers were mated with GCaMP6 mice (in house made). Double positive pups were used for further analysis. Subsequent crosses were done with GCaMP6 mice (in house made), TVAG mice (Line TVAG5 from [55]), ArChT mice [31], tetO-eGFP (Jackson laboratory, C57BL/6J-Tg(tetO-EGFP/Rpl10a)5aReij/J_JAX) and hM3 mice [8].
Genotyping
Genotyping was done on ear tissue using a Kapa mouse genotyping kit (Kapa Biosystems, Cat# KK7302). Primer pairs for the appropriate gene and internal controls (Table S2) are added to the PCR mixture at a final concentration of 10μM. The PCR reaction was done by an initial step of 4 minutes at 95°C, then 20 cycles of 1 minute at 95°C, 30 s at 70°C reduced by 0.5°C each cycle, and 30 s at 72°C. This is followed by 20 cycles of 30 s at 95°C, 30 s at 60°C, and 30 s at 72°C and a final 7 minute step at 72°C. The products are run on a 1% agarose gel along with positive and negative controls.
In situ hybridization
Double positive mice (tTA+/−, reporter gene+/−) were deeply anesthetized with pentobarbital and transcardially perfused with 0.9% saline first and freshly made 4% formaldehyde (in 1x DPBS, thermofisher, Cat# 14200075) second. At least 2 mice from different litters were investigated on consistent expression patterns. Brains were removed and postfixated overnight in 4% paraformaldehyde. Subsequently the brains were dehydrated for at least 24h with 30% sucrose in 1x PBS. The brains were sectioned sagittally at 30μm on a Cryostat, mounted directly (on Fisherbrand Superfrost Plus microscope slides (Fisher Scientific Cat #12-550-15)) and dried overnight at room temperature. Slides were stored at −80°C.
Slides were thawed in closed containers. Sections were outlined with a PAP pen (Sigma, cat# Z377821–1EA). The probe was diluted (usually 0.1–1μgm/ml) in hybridization buffer (1:10 10x salt solution, 50% deionized formamide (sigma, cat# D-4551), 10% dextran sulfate (sigma, cat# D-8906), 1mg/ml rRNA (sigma, Cat#R5636), 1x Denhardt’s (Sigma cat# D-2532). Salt solution (10x) was made with 114 g NaCl, 14.04 g TrisHCl, 1.3g TrisBase, 7.8g NaH2PO4.2H2O, 7.1g Na2HPO4 in H2O to 1000ml with a final concentration of 0.5M EDTA). The probe was denatured for 10 min at 62°C, added to the section and coverslipped (Fisher, cat# 12-548-5P). The slides were incubated overnight at 62°C in a closed box with filter paper wetted in 1x SSC with 50% formamide.
The slides were transferred to polypropylene Coplin jars containing 1x SSC with 50% formamide and 0.1% Tween-20 warmed to 62°C for 10 minutes to allow the coverslips to fall off. The slides were washed 3×30 minutes at 62°C. Then the slides were washed 3×30 minutes in MABT (11.6g Maleic acid (sigma, cat#M0375–1kg), 8.76 g NaCl, 5ml 20% tween, pH 7.5, ddH2O to 1000ml) at room temperature.
The slides were drained (not dried) and re-circled with a PAP pen. Then blocking solution was added (600μl MABT, 200μl sheep serum, 200μl 10% blocking reagent (Roche cat#11 096 176 001)) and slides were incubated in a Perspex box with wetted filter paper at room temperature for 2–3 hours. The slides were drained and 1:5,000 sheep anti-dig AP in blocking solution was added followed by overnight incubation.
4g of polyvinyl alcohol was dissolved into 40ml AP staining buffer (100mM NaCl, 50mM MgCl2, 100mM Tris pH9.5, 0.1% Tween-20) by heat and cooled to 37°C. The slides were washed in MABT 5 times for 4 minutes. And subsequently washed 2×10 minutes in AP staining buffer. Nitroblue tetrazolium chloride (Roche, cat# 11 383 213 001. At 3.5 μl/ml), 5-Bromo-4-chloro-3-indolyl-phosphate, 4-toluidene salt (Roche, cat# 11 383 221 001. At 2.6 μl/ml) and Levamisole (Vector, cat# SP-5000. At 80μl/ml) was added to the cool polyvinyl alcohol solution. This was shaken well and transferred to a Coplin jar. The slides were added to the jar and incubated at 37°C for 3 to 5 hours. The reaction was stopped by washing in 2xPBS with 0.1% Tween-20. The slides were subsequently wash 2X in ddH2O, and dehydrated quickly through graded ethanols from 50%, 70%, 95% to 100% ethanol. Finally the slides were cleared in xylene and coverslipped.
Immunohistochemistry
Double positive mice (tTA+/−, TVAG+/− or eGFP ±) were deeply anesthetized with pentobarbital transcardially perfused with approximately 30ml 0.9% saline and first and approximately 30ml freshly made 4% paraformaldehyde (in 1x DPBS, thermofisher, Cat# 14200075) second. Brains were removed and postfixated for 24 hours in 4% paraformaldehyde. Subsequently the brains were dehydrated with 30% sucrose in 1x PBS. The brains were sectioned horizontally at 50μm and kept in TCS (tissue collection solution, 25% glycerol, 35% ethyl glycol, 50% 1xDPBS) at −20°C.
Immunohistochemistry was done by two initial 10 minute washes in 1xDPBS and subsequent permeabilized by a 60 minute wash in 1% Triton X-100 (Sigma, Cat#T9284) in 1xDPBS. Then the tissue is incubated in primary antibody in 1xDPBS with 1% trition X-100 and 5% donkey serum (Sigma, Cat# D9663) for 48 hours at 4°C. Primary antibodies and dilutions were: Rabbit-anti-2A (1:2000, Millipore, cat#ABS31), Mouse-anti-reelin (1:1000, Millipore, cat# Mab5364), Mouse-anti-GAD67 (1:1000, Millipore, cat# Mab5406), Mouse-anti-calbindin (1:10000, Swant, cat# CB300).
After incubation with primary antibodies, sections were washed 4x in 1xDPBS (10 minutes per wash) and 2x in 1xDPBS with 1% Triton X-100. Then sections were incubated for 6h at room temperature in secondary antibody (all secondary antibodies were raised in Donkey and diluted 1:250). The secondary antibodies were: anti-Rabbit-AF488 (Jackson ImmunoResearch, Cat# 711-545-152) and anti-Mouse-Cytm3 (Jackson ImmunoResearch, Cat# 715-165-151)
The sections were DAPI stained by a single 10 minute wash in 1xDPBS with 0.2μg/ml DAPI (thermofisher, D1306) and finally washed 5x (10 minutes per wash) in 1x DPBS. Sections were mounted on superfrost® plus glass slides (VWR, Cat# 631–9483) and coverslipped with polyvinyl alcohol with 2.5% DABCO (Sigma, Cat# D27802).
Imaging
From mice in the lines MEC-13–53A × TVAG and MEC-13–104B × tetO-eGFP MEC was imaged in sections from three different dorsal-ventral levels with a Zeiss Meta 880 confocal microscope. Two channels were imaged: one for AF488 with maximum excitation wavelength at 488nm and maximum emission wavelength at 528nm and one for Cy3 with maximum excitation wavelength at 561nm and maximum emission wavelength at 595nm.
For display images, sections were imaged on Zeiss Axio.scan Z1 scanners in three preset channels: DAPI, dl488 and dl549.
Image processing
From the Zeiss proprietary file format .lsm, .tiff files were exported. These were processed in Adobe Photoshop and all alterations in levels were made on the entire images. In some cases, images were processed to remove visual artifacts and background.
QUANTIFICATION AND STATISTICAL ANALYSIS
ChIP-seq data analysis
ChIP-Seq data was initially processed as previously described (Reilly et al., 2015). Briefly, reads were aligned to the mm9 version of the mouse genome using bowtie (v1.1.1) [56]. Enriched regions were identified in individual replicates using a sliding window method as previously described [67]. Enriched regions were divided into functional categories based on overlaps with genomic features as annotated by Ensembl v67 using Bedtools (2.19.0) [57]. Reproducibly enriched regions were determined as the union of overlapping regions identified in both biological replicates. Putative enhancer regions from intergenic and intronic portions of the genome were then assigned target genes using GREAT. H3K27ac ChIP-Seq reads were retrieved from Encodeproject.org for 17 mouse tissues [27] and uniformly processed as above. Enhancers for all cell types were combined and merged to generate a uniform annotation of all possible enhancers. H3K27ac counts at each enhancer from each tissue were calculated using mrfQuantifier [58]. Pearson correlations for all enhancer signals were calculated and plotted using R (https://www.r-project.org/). K-means clustering of H3K27ac count matrix was performed using Cluster (v3.0) [59]. Rows were centered on the mean value of the row and normalized, the k parameter was the total number of tissues, and 100 runs were performed. The clustering result was then visualized using Java TreeView [60]. Subregion specific clusters of enhancers were intersected with peak calls from all other tissues to identify enhancers with likely tissue specific function. Subregion specific enhancers were assigned two target genes using GREAT, ranked by H3K27ac signal, and overlapped with vertebrate conserved sequences [68].
Counting
Mice in the lines MEC-13–53A × TVAG and MEC-13–104B × tetO-eGFP MEC was imaged on sections from three different dorsal-ventral levels. For each strain 4 mice from at least 2 litters each were used. For each section, three to seven slices in the Z direction with 1.5μm spacing were taken, with a 20x objective and tiling to cover the entire MEC. Counts were made on the confocal images for single positive cells expressing transgenes, cells expressing native genes (GAD67, Reelin, Calbindin) and cells expressing both. Graphs were made in Microsoft Excel and statistical analysis was done in SPSS (v22, IBM).
DATA AND SOFTWARE AVAILABILITY
No new software was generated in this study. Raw data can be accessed on GEO under accession number GSE112897. Processed data can be viewed here.
Supplementary Material
KEY RESOURCES TABLE
| REAGENT or RESOURCE | SOURCE | IDENTIFIER |
|---|---|---|
| Antibodies | ||
| H3K4me2 | Abcam | Cat# ab7766, RRID:AB_2560996 |
| H3K27ac | Abcam | Cat# ab4729, RRID:AB_2118291 |
| Rabbit-anti-2A | Millipore | Cat# ABS31, RRID:AB_11214282 |
| Mouse-anti-reelin | Millipore | Cat# Mab5364, RRID:AB_2179313 |
| Mouse-anti-GAD67 | Millipore | Cat# Mab5406, RRID:AB_2278725 |
| Mouse-anti-calbindin | Swant | Cat# CB300, RRID:AB_10000347 |
| anti-Rabbit-AF488 | Jackson ImmunoResearch | Cat# 711-545-152, RRID:AB_2313584 |
| anti-Mouse-Cytm3 | Jackson ImmunoResearch | Cat# 715-165-151, RRID:AB_2315777 |
| Biological Samples | ||
| Healthy, adult microdissected brain tissue (mouse) | This paper | N/A |
| Critical Commercial Assays | ||
| NEBNext ChIP-Seq Library Prep | NEB | E6240L |
| Deposited Data | ||
| Raw data | GEO | GSE112897 |
| Processed data | NCBI session | http://genome.ucsc.edu/cgi-bin/hgTracks?hgS_doOtherUser=submit&hgS_otherUserName=Jcotney&hgS_otherUserSessionName=Kavli |
| Experimental Models: Organisms/Strains | ||
| C57BL/6J mice | Jackson Laboratory | Stock no. 000664, RRID: IMSR_JAX:000664 |
| B6D2F1 mice | Jackson Laboratory | Stock no. 100006, RRID:IMSR_JAX:100006 |
| TetO-GCaMP6 mice | This paper | P8966 |
| TetO-histoneGFP mice Tg(tetO-HIST1H2BJ/GFP)47Efu | Jackson laboratory | Stock no. 005104, RRID:IMSR_JAX:005104 |
| TetO-TVAG mice | From [55] | Line TVAG5 |
| TetO-ArChT mice | From [31] | Line tetO-ArchT2 |
| tetO-eGFP mice C57BL/6J-Tg(tetO-EGFP/Rpl10a)5aReij/J_JAX | Jackson laboratory | Stock no. 024898, RRID:IMSR_JAX:024898 |
| TetO-HM3 mice | From [8] | Line TRE-hM3Dq, RRID:IMSR_JAX:014093 |
| MEC-13–32B | This paper | N/A |
| MEC-13–53A | This paper | N/A |
| MEC-13–53B | This paper | N/A |
| MEC-13–53D | This paper | N/A |
| MEC-13–53G | This paper | N/A |
| MEC-13–81A | This paper | N/A |
| MEC-13–104B | This paper | N/A |
| MEC-13–123A | This paper | N/A |
| MEC-13–123B | This paper | N/A |
| MEC-13–123C | This paper | N/A |
| LEC-13–8B | This paper | N/A |
| LEC-13–108A | This paper | N/A |
| Oligonucleotides | ||
| Genotyping primers, Table S2 | This paper | N/A |
| Recombinant DNA | ||
| Injection construct (Gateway destination vector) | This paper | pDest-HSP68-tTA-WPRE |
| Software and Algorithms | ||
| Bowtie (v1.1.1) | [56] | http://bowtie-bio.sourceforge.net/index.shtml |
| Bedtools (2.19.0) | [57] | http://bedtools.readthedocs.io/en/latest/ |
| mrfQuantifier | [58] | http://archive.gersteinlab.org/proj/rnaseq/rseqtools/ |
| GREAT | [28] | http://great.stanford.edu/public/html/ |
| R | R-project | https://www.r-project.org/ |
| Cluster (v3.0) | [59] | http://bonsai.hgc.jp/~mdehoon/software/cluster/software.htm |
| Java TreeView | [60] | http://jtreeview.sourceforge.net/ |
| SPSS statistics v. 22 | IBM | https://www.ibm.com/products/spss-statistics |
| Creative Cloud (photoshop, illustrator) 2017 edition | Adobe | https://www.adobe.com/no/creativecloud.html |
| Excel 2016 | Microsoft | http://www.microsoft.com |
| Other | ||
| Illumina HiSeq 2000 | Illumina | N/A |
Highlights.
Enhancer ChIP-seq of cortical subregions reveals 59,372 putative enhancers
3,740 of these are specific to particular cortical subregions
This reflects the remarkable anatomical diversity of the adult cortex
Unique enhancers provide a means to make targeted cell-type-specific genetic tools
ACKNOWLEDGMENTS
This work was supported by the FRIPRO ToppForsk grant Enhanced Transgenics (90096000) of the Research Council of Norway, the Kavli Foundation, the Centre of Excellence scheme of the Research Council of Norway—Centre for Biology of Memory and Centre for Neural Computation, The Egil and Pauline Braathen and Fred Kavli Centre for Cortical Microcircuits, and the National Infrastructure scheme of the Research Council of Norway—NORBRAIN. We would like to thank Haiyan Wu and Qiangwei Zhang for their help with in situ hybridization, Ute Hostick of the transgenic mouse facility in Eugene, Oregon for her help with pronuclear injection, and Hanne Mali Møllergård for her help with genotyping.
Footnotes
SUPPLEMENTAL INFORMATION
Supplemental Information includes seven figures, two tables, and one data file and can be found with this article online at https://doi.org/10.1016/j.cub.2018.05.015.
DECLARATION OF INTERESTS
C.K., J.C., and S.B. are inventors on US Patent Application no. 62/584,282, Appl. Norwegian University of Science and Technology (NTNU), which is related to this work. The authors have no other competing interests to declare.
REFERENCES
- 1.von Bartheld CS, Bahney J, and Herculano-Houzel S (2016). The search for true numbers of neurons and glial cells in the human brain: A review of 150 years of cell counting. J. Comp. Neurol 524, 3865–3895. [DOI] [PMC free article] [PubMed] [Google Scholar]
- 2.Zeng H, and Sanes JR (2017). Neuronal cell-type classification: challenges, opportunities and the path forward. Nat. Rev. Neurosci 18, 530–546. [DOI] [PubMed] [Google Scholar]
- 3.Bonnavion P, Mickelsen LE, Fujita A, de Lecea L, and Jackson AC (2016). Hubs and spokes of the lateral hypothalamus: cell types, circuits and behaviour. J. Physiol 594, 6443–6462. [DOI] [PMC free article] [PubMed] [Google Scholar]
- 4.Lein ES, Hawrylycz MJ, Ao N, Ayres M, Bensinger A, Bernard A, Boe AF, Boguski MS, Brockway KS, Byrnes EJ, et al. (2007). Genome-wide atlas of gene expression in the adult mouse brain. Nature 445, 168–176. [DOI] [PubMed] [Google Scholar]
- 5.Feng G, Mellor RH, Bernstein M, Keller-Peck C, Nguyen QT, Wallace M, Nerbonne JM, Lichtman JW, and Sanes JR (2000). Imaging neuronal subsets in transgenic mice expressing multiple spectral variants of GFP. Neuron 28, 41–51. [DOI] [PubMed] [Google Scholar]
- 6.Wickersham IR, Lyon DC, Barnard RJ, Mori T, Finke S, Conzelmann KK, Young JA, and Callaway EM (2007). Monosynaptic restriction of transsynaptic tracing from single, genetically targeted neurons. Neuron 53, 639–647. [DOI] [PMC free article] [PubMed] [Google Scholar]
- 7.Boyden ES, Zhang F, Bamberg E, Nagel G, and Deisseroth K (2005). Millisecond-timescale, genetically targeted optical control of neural activity. Nat. Neurosci 8, 1263–1268. [DOI] [PubMed] [Google Scholar]
- 8.Alexander GM, Rogan SC, Abbas AI, Armbruster BN, Pei Y, Allen JA, Nonneman RJ, Hartmann J, Moy SS, Nicolelis MA, et al. (2009). Remote control of neuronal activity in transgenic mice expressing evolved G protein-coupled receptors. Neuron 63, 27–39. [DOI] [PMC free article] [PubMed] [Google Scholar]
- 9.Magnus CJ, Lee PH, Atasoy D, Su HH, Looger LL, and Sternson SM (2011). Chemical and genetic engineering of selective ion channel-ligand interactions. Science 333, 1292–1296. [DOI] [PMC free article] [PubMed] [Google Scholar]
- 10.Mank M, Santos AF, Direnberger S, Mrsic-Flogel TD, Hofer SB, Stein V, Hendel T, Reiff DF, Levelt C, Borst A, et al. (2008). A genetically encoded calcium indicator for chronic in vivo two-photon imaging. Nat. Methods 5, 805–811. [DOI] [PMC free article] [PubMed] [Google Scholar]
- 11.Mayford M, Bach ME, Huang YY, Wang L, Hawkins RD, and Kandel ER (1996). Control of memory formation through regulated expression of a CaMKII transgene. Science 274, 1678–1683. [DOI] [PubMed] [Google Scholar]
- 12.Shima Y, Sugino K, Hempel CM, Shima M, Taneja P, Bullis JB, Mehta S, Lois C, and Nelson SB (2016). A Mammalian enhancer trap resource for discovering and manipulating neuronal cell types. eLife 5, e13503. [DOI] [PMC free article] [PubMed] [Google Scholar]
- 13.Capecchi MR (1989). Altering the genome by homologous recombination. Science 244, 1288–1292. [DOI] [PubMed] [Google Scholar]
- 14.Heintz N (2001). BAC to the future: the use of bac transgenic mice for neuroscience research. Nat. Rev. Neurosci 2, 861–870. [DOI] [PubMed] [Google Scholar]
- 15.Huang ZJ (2014). Toward a genetic dissection of cortical circuits in the mouse. Neuron 83, 1284–1302. [DOI] [PMC free article] [PubMed] [Google Scholar]
- 16.Madisen L, Garner AR, Shimaoka D, Chuong AS, Klapoetke NC, Li L, van der Bourg A, Niino Y, Egolf L, Monetti C, et al. (2015). Transgenic mice for intersectional targeting of neural sensors and effectors with high specificity and performance. Neuron 85, 942–958. [DOI] [PMC free article] [PubMed] [Google Scholar]
- 17.Luo L, Callaway EM, and Svoboda K (2008). Genetic dissection of neural circuits. Neuron 57, 634–660. [DOI] [PMC free article] [PubMed] [Google Scholar]
- 18.Banerji J, Rusconi S, and Schaffner W (1981). Expression of a beta-globin gene is enhanced by remote SV40 DNA sequences. Cell 27, 299–308. [DOI] [PubMed] [Google Scholar]
- 19.ENCODE Project Consortium (2012). An integrated encyclopedia of DNA elements in the human genome. Nature 489, 57–74. [DOI] [PMC free article] [PubMed] [Google Scholar]
- 20.Kundaje A, Meuleman W, Ernst J, Bilenky M, Yen A, Heravi-Moussavi A, Kheradpour P, Zhang Z, Wang J, Ziller MJ, et al. ; Roadmap Epigenomics Consortium (2015). Integrative analysis of 111 reference human epigenomes. Nature 518, 317–330. [DOI] [PMC free article] [PubMed] [Google Scholar]
- 21.Yasuda M, and Mayford MR (2006). CaMKII activation in the entorhinal cortex disrupts previously encoded spatial memory. Neuron 50, 309–318. [DOI] [PubMed] [Google Scholar]
- 22.Heintzman ND, Stuart RK, Hon G, Fu Y, Ching CW, Hawkins RD, Barrera LO, Van Calcar S, Qu C, Ching KA, et al. (2007). Distinct and predictive chromatin signatures of transcriptional promoters and enhancers in the human genome. Nat. Genet 39, 311–318. [DOI] [PubMed] [Google Scholar]
- 23.Visel A, Rubin EM, and Pennacchio LA (2009). Genomic views of distant-acting enhancers. Nature 461, 199–205. [DOI] [PMC free article] [PubMed] [Google Scholar]
- 24.Visel A, Taher L, Girgis H, May D, Golonzhka O, Hoch RV, McKinsey GL, Pattabiraman K, Silberberg SN, Blow MJ, et al. (2013). A high-resolution enhancer atlas of the developing telencephalon. Cell 152, 895–908. [DOI] [PMC free article] [PubMed] [Google Scholar]
- 25.Cotney J, Leng J, Yin J, Reilly SK, DeMare LE, Emera D, Ayoub AE, Rakic P, and Noonan JP (2013). The evolution of lineage-specific regulatory activities in the human embryonic limb. Cell 154, 185–196. [DOI] [PMC free article] [PubMed] [Google Scholar]
- 26.Visel A, Blow MJ, Li Z, Zhang T, Akiyama JA, Holt A, Plajzer-Frick I, Shoukry M, Wright C, Chen F, et al. (2009). ChIP-seq accurately predicts tissue-specific activity of enhancers. Nature 457, 854–858. [DOI] [PMC free article] [PubMed] [Google Scholar]
- 27.Shen Y, Yue F, McCleary DF, Ye Z, Edsall L, Kuan S, Wagner U, Dixon J, Lee L, Lobanenkov VV, and Ren B (2012). A map of the cis-regulatory sequences in the mouse genome. Nature 488, 116–120. [DOI] [PMC free article] [PubMed] [Google Scholar]
- 28.McLean CY, Bristor D, Hiller M, Clarke SL, Schaar BT, Lowe CB, Wenger AM, and Bejerano G (2010). GREAT improves functional interpretation of cis-regulatory regions. Nat. Biotechnol 28, 495–501. [DOI] [PMC free article] [PubMed] [Google Scholar]
- 29.Gossen M, and Bujard H (1992). Tight control of gene expression in mammalian cells by tetracycline-responsive promoters. Proc. Natl. Acad. Sci. USA 89, 5547–5551. [DOI] [PMC free article] [PubMed] [Google Scholar]
- 30.Brand AH, and Perrimon N (1993). Targeted gene expression as a means of altering cell fates and generating dominant phenotypes. Development 118, 401–415. [DOI] [PubMed] [Google Scholar]
- 31.Weible AP, Moore AK, Liu C, DeBlander L, Wu H, Kentros C, and Wehr M (2014). Perceptual gap detection is mediated by gap termination responses in auditory cortex. Curr. Biol 24, 1447–1455. [DOI] [PMC free article] [PubMed] [Google Scholar]
- 32.Witter MP, Doan TP, Jacobsen B, Nilssen ES, and Ohara S (2017). Architecture of the entorhinal cortex a review of entorhinal anatomy in rodents with some comparative notes. Front. Syst. Neurosci 11, 46. [DOI] [PMC free article] [PubMed] [Google Scholar]
- 33.DeFelipe J, López-Cruz PL, Benavides-Piccione R, Bielza C, Larrañaga P, Anderson S, Burkhalter A, Cauli B, Fairén A, Feldmeyer D, et al. (2013). New insights into the classification and nomenclature of cortical GABAergic interneurons. Nat. Rev. Neurosci 14, 202–216. [DOI] [PMC free article] [PubMed] [Google Scholar]
- 34.Taniguchi H (2014). Genetic dissection of GABAergic neural circuits in mouse neocortex. Front. Cell. Neurosci 8, 8. [DOI] [PMC free article] [PubMed] [Google Scholar]
- 35.Tasic B, Menon V, Nguyen TN, Kim TK, Jarsky T, Yao Z, Levi B, Gray LT, Sorensen SA, Dolbeare T, et al. (2016). Adult mouse cortical cell taxonomy revealed by single cell transcriptomics. Nat. Neurosci 19, 335–346. [DOI] [PMC free article] [PubMed] [Google Scholar]
- 36.Briggs F, and Callaway EM (2001). Layer-specific input to distinct cell types in layer 6 of monkey primary visual cortex. J. Neurosci 21, 3600–3608. [DOI] [PMC free article] [PubMed] [Google Scholar]
- 37.Reilly SK, Yin J, Ayoub AE, Emera D, Leng J, Cotney J, Sarro R, Rakic P, and Noonan JP (2015). Evolutionary genomics. Evolutionary changes in promoter and enhancer activity during human corticogenesis. Science 347, 1155–1159. [DOI] [PMC free article] [PubMed] [Google Scholar]
- 38.Vermunt MW, Reinink P, Korving J, de Bruijn E, Creyghton PM, Basak O, Geeven G, Toonen PW, Lansu N, Meunier C, et al. ; Netherlands Brain Bank (2014). Large-scale identification of coregulated enhancer networks in the adult human brain. Cell Rep 9, 767–779. [DOI] [PubMed] [Google Scholar]
- 39.Gray LT, Yao Z, Nguyen TN, Kim TK, Zeng H, and Tasic B (2017). Layer-specific chromatin accessibility landscapes reveal regulatory networks in adult mouse visual cortex. eLife 6, e21883. [DOI] [PMC free article] [PubMed] [Google Scholar]
- 40.Luo C, Keown CL, Kurihara L, Zhou J, He Y, Li J, Castanon R, Lucero J, Nery JR, Sandoval JP, et al. (2017). Single-cell methylomes identify neuronal subtypes and regulatory elements in mammalian cortex. Science 357, 600–604. [DOI] [PMC free article] [PubMed] [Google Scholar]
- 41.Dimidschstein J, Chen Q, Tremblay R, Rogers SL, Saldi GA, Guo L, Xu Q, Liu R, Lu C, Chu J, et al. (2016). A viral strategy for targeting and manipulating interneurons across vertebrate species. Nat. Neurosci 19, 1743–1749. [DOI] [PMC free article] [PubMed] [Google Scholar]
- 42.Prabhakar S, Visel A, Akiyama JA, Shoukry M, Lewis KD, Holt A, Plajzer-Frick I, Morrison H, Fitzpatrick DR, Afzal V, et al. (2008). Human-specific gain of function in a developmental enhancer. Science 321, 1346–1350. [DOI] [PMC free article] [PubMed] [Google Scholar]
- 43.Nord AS, Blow MJ, Attanasio C, Akiyama JA, Holt A, Hosseini R, Phouanenavong S, Plajzer-Frick I, Shoukry M, Afzal V, et al. (2013). Rapid and pervasive changes in genome-wide enhancer usage during mammalian development. Cell 155, 1521–1531. [DOI] [PMC free article] [PubMed] [Google Scholar]
- 44.Pattabiraman K, Golonzhka O, Lindtner S, Nord AS, Taher L, Hoch R, Silberberg SN, Zhang D, Chen B, Zeng H, et al. (2014). Transcriptional regulation of enhancers active in protodomains of the developing cerebral cortex. Neuron 82, 989–1003. [DOI] [PMC free article] [PubMed] [Google Scholar]
- 45.Silberberg SN, Taher L, Lindtner S, Sandberg M, Nord AS, Vogt D, Mckinsey GL, Hoch R, Pattabiraman K, Zhang D, et al. (2016). Subpallial enhancer transgenic lines: a data and tool resource to study transcriptional regulation of GABAergic cell fate. Neuron 92, 59–74. [DOI] [PMC free article] [PubMed] [Google Scholar]
- 46.Merkle FT, and Alvarez-Buylla A (2006). Neural stem cells in mammalian development. Curr. Opin. Cell Biol 18, 704–709. [DOI] [PubMed] [Google Scholar]
- 47.Fogarty M, Grist M, Gelman D, Marín O, Pachnis V, and Kessaris N (2007). Spatial genetic patterning of the embryonic neuroepithelium generates GABAergic interneuron diversity in the adult cortex. J. Neurosci 27, 10935–10946. [DOI] [PMC free article] [PubMed] [Google Scholar]
- 48.Zerucha T, Stühmer T, Hatch G, Park BK, Long Q, Yu G, Gambarotta A, Schultz JR, Rubenstein JL, and Ekker M (2000). A highly conserved enhancer in the Dlx5/Dlx6 intergenic region is the site of cross-regulatory interactions between Dlx genes in the embryonic fore-brain. J. Neurosci 20, 709–721. [DOI] [PMC free article] [PubMed] [Google Scholar]
- 49.Kanter BR, Lykken CM, Avesar D, Weible A, Dickinson J, Dunn B, Borgesius NZ, Roudi Y, and Kentros CG (2017). A novel mechanism for the grid-to-place cell transformation revealed by transgenic depolarization of medial entorhinal cortex layer II. Neuron 93, 1480–1492.e6. [DOI] [PubMed] [Google Scholar]
- 50.Harris KD, and Shepherd GM (2015). The neocortical circuit: themes and variations. Nat. Neurosci 18, 170–181. [DOI] [PMC free article] [PubMed] [Google Scholar]
- 51.Douglas RJ, and Martin KA (2007). Recurrent neuronal circuits in the neocortex. Curr. Biol 17, R496–R500. [DOI] [PubMed] [Google Scholar]
- 52.Tasic B, Yao Z, Smith KA, Graybuck L, Nguyen TN, Bertagnolli D, Goldy J, Garren E, Economo MN, Viswanathan S, et al. (2017). Shared and distinct transcriptomic cell types across neocortical areas. bioRxiv 10.1101/229542. [DOI] [PMC free article] [PubMed] [Google Scholar]
- 53.Fuchs EC, Neitz A, Pinna R, Melzer S, Caputi A, and Monyer H (2016). Local and distant input controlling excitation in layer II of the medial entorhinal cortex. Neuron 89, 194–208. [DOI] [PMC free article] [PubMed] [Google Scholar]
- 54.Malik AN, Vierbuchen T, Hemberg M, Rubin AA, Ling E, Couch CH, Stroud H, Spiegel I, Farh KK-H, Harmin DA, and Greenberg ME (2014). Genome-wide identification and characterization of functional neuronal activity-dependent enhancers. Nat. Neurosci 17, 1330–1339. [DOI] [PMC free article] [PubMed] [Google Scholar]
- 55.Weible AP, Schwarcz L, Wickersham IR, Deblander L, Wu H, Callaway EM, Seung HS, and Kentros CG (2010). Transgenic targeting of recombinant rabies virus reveals monosynaptic connectivity of specific neurons. J. Neurosci 30, 16509–16513. [DOI] [PMC free article] [PubMed] [Google Scholar]
- 56.Langmead B, and Salzberg SL (2012). Fast gapped-read alignment with Bowtie 2. Nat. Methods 9, 357–359. [DOI] [PMC free article] [PubMed] [Google Scholar]
- 57.Quinlan AR, and Hall IM (2010). BEDTools: a flexible suite of utilities for comparing genomic features. Bioinformatics 26, 841–842. [DOI] [PMC free article] [PubMed] [Google Scholar]
- 58.Habegger L, Sboner A, Gianoulis TA, Rozowsky J, Agarwal A, Snyder M, and Gerstein M (2011). RSEQtools: a modular framework to analyze RNA-seq data using compact, anonymized data summaries. Bioinformatics 27, 281–283. [DOI] [PMC free article] [PubMed] [Google Scholar]
- 59.de Hoon MJ, Imoto S, Nolan J, and Miyano S (2004). Open source clustering software. Bioinformatics 20, 1453–1454. [DOI] [PubMed] [Google Scholar]
- 60.Saldanha AJ (2004). Java Treeview–extensible visualization of microarray data. Bioinformatics 20, 3246–3248. [DOI] [PubMed] [Google Scholar]
- 61.Boccara CN, Kjonigsen LJ, Hammer IM, Bjaalie JG, Leergaard TB, and Witter MP (2015). A three-plane architectonic atlas of the rat hippocampal region. Hippocampus 25, 838–857. [DOI] [PubMed] [Google Scholar]
- 62.Sugar J, and Witter MP (2016). Postnatal development of retrosplenial projections to the parahippocampal region of the rat. eLife 5, e13925. [DOI] [PMC free article] [PubMed] [Google Scholar]
- 63.O’Reilly KC, Flatberg A, Islam S, Olsen LC, Kruge IU, and Witter MP (2015). Identification of dorsal-ventral hippocampal differentiation in neonatal rats. Brain Struct. Funct 220, 2873–2893. [DOI] [PubMed] [Google Scholar]
- 64.Jones BF, and Witter MP (2007). Cingulate cortex projections to the parahippocampal region and hippocampal formation in the rat. Hippocampus 17, 957–976. [DOI] [PubMed] [Google Scholar]
- 65.Witter MP (2011). The hippocampus. In The Mouse Nervous System, First Edition, Paxinos G, Puilles L, and Watson C, eds. (Academic; ), pp. 112–139. [Google Scholar]
- 66.Cotney JL, and Noonan JP (2015). Chromatin immunoprecipitation with fixed animal tissues and preparation for high-throughput sequencing. Cold Spring Harb. Protoc 2015, 419. [DOI] [PMC free article] [PubMed] [Google Scholar]
- 67.Mikkelsen TS, Xu Z, Zhang X, Wang L, Gimble JM, Lander ES, and Rosen ED (2010). Comparative epigenomic analysis of murine and human adipogenesis. Cell 143, 156–169. [DOI] [PMC free article] [PubMed] [Google Scholar]
- 68.Siepel A, Bejerano G, Pedersen JS, Hinrichs AS, Hou M, Rosenbloom K, Clawson H, Spieth J, Hillier LW, Richards S, et al. (2005). Evolutionarily conserved elements in vertebrate, insect, worm, and yeast genomes. Genome Res 15, 1034–1050. [DOI] [PMC free article] [PubMed] [Google Scholar]
Associated Data
This section collects any data citations, data availability statements, or supplementary materials included in this article.
Supplementary Materials
Data Availability Statement
No new software was generated in this study. Raw data can be accessed on GEO under accession number GSE112897. Processed data can be viewed here.