Abstract
Background
Deregulation of integrins signaling had been documented to participate in multiple fundamental biological processes, and the aberrant expression of integrin family members were linked to the prognosis of various cancers. However, the role of integrins in predicting progression and prognosis of ovarian cancer patients are still largely elusive. This study is aimed to explore the prognostic values of ITGA and ITGB superfamily members in high grade serous ovarian cancers (HGSOC).
Methods
GSE26712 dataset was used to determine the differential expression of ITGA and ITGB superfamily member between HGSOC and normal counterparts. The Cancer Genome Altas (TGGA) and GSE9891 datasets were used to determine the prognostic values of ITGA and ITGB superfamily members in HGSOC, followed by the development of nomograms predictive of recurrence free survival (RFS) and overall survival (OS).
Results
ITGA6 and ITGB5 expression were significantly downregulated in HGSOC compared with that in normal counterparts. In contrast, ITGA2, ITGA5, ITGA7, ITGA8, ITGA9, ITGA10, ITGB3, ITGB4, ITGB6, and ITGB8 were all significantly upregulated in HGSOC compared with that in normal counterparts. Both univariable and multivariable analysis indicated that ITGB1 was associated with extended RFS. The ITGB1-related nomogram indicated that ITGB1 had the largest contribution to RFS, followed by FIGO stage and debulking status. The C-index for predicting RFS was 0.55 (95% CI 0.50–0.59) in TCGA dataset (training dataset) and 0.65 (95% CI 0.59–0.72) in GSE9891 dataset (validation dataset), respectively. Regarding OS, ITGB8 was associated with reduced survival suggested by both univariable and multivariable analysis. ITGA7 appeared to be associated with improved survival though without reaching statistical significance. The ITGA7/ITGB8-based nomogram showed that age at initial diagnosis had the largest contribution to OS, followed by ITGB8 and ITGA7 expression. The C-index for predicting OS was 0.65 (95% CI 0.60–0.69) in TCGA dataset (training dataset) and 0.59 (95% CI 0.51–0.66) in GSE9891 dataset (validation dataset), respectively.
Conclusion
In conclusion, ITGB1, ITGA7 and ITGB8 added prognostic value to the traditional clinical risk factors used to assess the clinical outcomes of HGSOC.
Keywords: High grade serous ovarian cancer, Integrin, ITGA, ITGB, Prognosis, Nomogram
Background
High grade serous ovarian cancer (HGSOC) is an aggressive and incurable malignancy and most patients with newly diagnosed HGSOC presented with advanced stage [1]. The mainstay of primary treatment is debulking surgery with the aim of complete resection, followed by platinum-based chemotherapy [2]. Despite initial chemosensitivity, only about 30% of the patients were still alive 5 years after initial diagnosis. The prognosis of the patients were closely correlated with the intrinsic and acquired molecular characteristics of ovarian cancer tissues [1, 3]. Especially in the era of precision medicine, an improved understanding of the molecular features of ovarian cancer had led to better stratification of the patient prognosis and subsequent identification of novel therapeutic targets [4]. For example, breast related cancer antigens (BRCA) mutation and homologous recombination deficiency (HRD) status had been exploited to develop poly-adenosine diphosphate (ADP) ribose polymerase (PARP) inhibitors to treat HGSOC patients individually, leading to significant improvement in survival [5–7]. However, some patients with HGSOC still had a poor prognosis despite of novel treatments [8]. It is important to identify new biomarkers to predict HGSOC prognosis, which will subsequently facilitate the development of new personalized treatment strategies [4].
Integrins are heterodimeric transmembrane receptors composed of an alpha subunit and a beta subunit. They are involved in cell adhesion and signaling. Deregulation of integrins signaling had been documented to participate in various processes of cancer, including but not limited to tumor initiation, metastatic cascade, and drug resistance [9]. Given their critical roles in multiple fundamental biological processes, the aberrant expression of integrin family members were linked to the prognosis of various cancers [10–12]. However, the role of integrins in predicting progression and prognosis of HGSOC patients are still largely elusive [13].
In this study, we assessed the prognostic values of ITGA and ITGB, two superfamily of integrins, in HGSOC by resorting to the high-throughput expression data deposited in Gene Expression Omnibus(GEO) database and The Cancer Genome Altas (TCGA) database.
Materials and methods
Datasets used in present study
GSE26172 dataset, GSE9891 dataset, and TCGA dataset were obtained from the “curatedOvarianData” Bioconductor package (version 2.12 for R 3.0.3). GSE26712 dataset was used to determine the differential expression of ITGA and ITGB superfamily members between HGSOC (n = 185) and normal human ovarian surface epithelium (HOSE) (n = 10). The prognostic value of ITGA and ITGB superfamily members were evaluated and validated in TCGA dataset (n = 405) and GSE9891 dataset (n = 135), respectively. The prognostic values of ITGB1 and ITGB8 were further validated using Kaplan–Meier plotter database [14]. The expression of ITGB1 was detected using the mean value of five probes, including 215878_at, 215879_at, 216178_x_at, 211945_s_at and 216190_x_at in Kaplan–Meier plotter database. The expression of ITGB8 was detected using the mean value of two probes, including 205816_at and 211488_s_at in Kaplan–Meier plotter database.
Statistical analysis
Detailed methods of statistical analysis were described in our previous published paper [15]. All the statistical analyses were performed using IBM SPSS Statistics (version 22.0) and R (version 3.5.2). All factors with P values < 0.15 in the univariable analysis were entered into the multivariable Cox regression analysis. Prognostic factors with P values < 0.10 indicated by multivariable analysis, and two established prognostic factors, including FIGO stage and debulking status, were incorporated to develop the prognostic nomogram. P values < 0.05 are considered statistically significant. All reported P values are two-sided.
Results
The differential expression of ITGA and ITGB superfamily members between HGSOC and HOSE
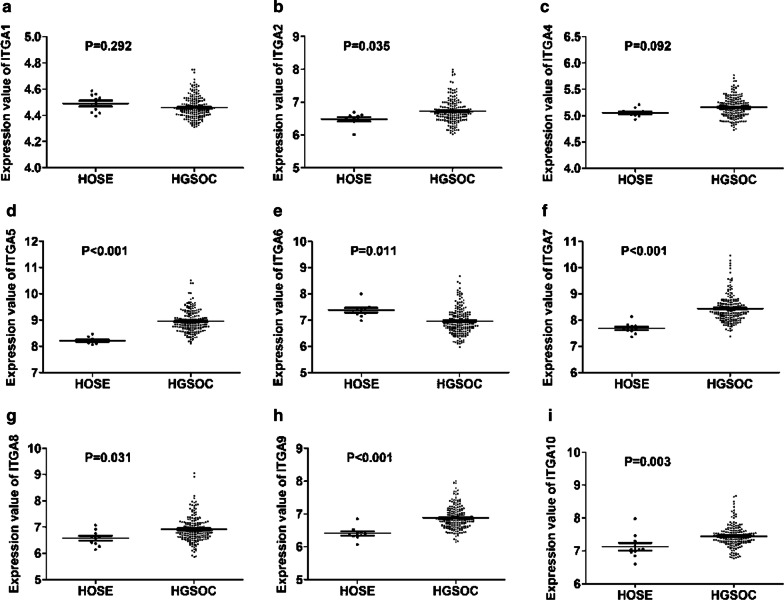
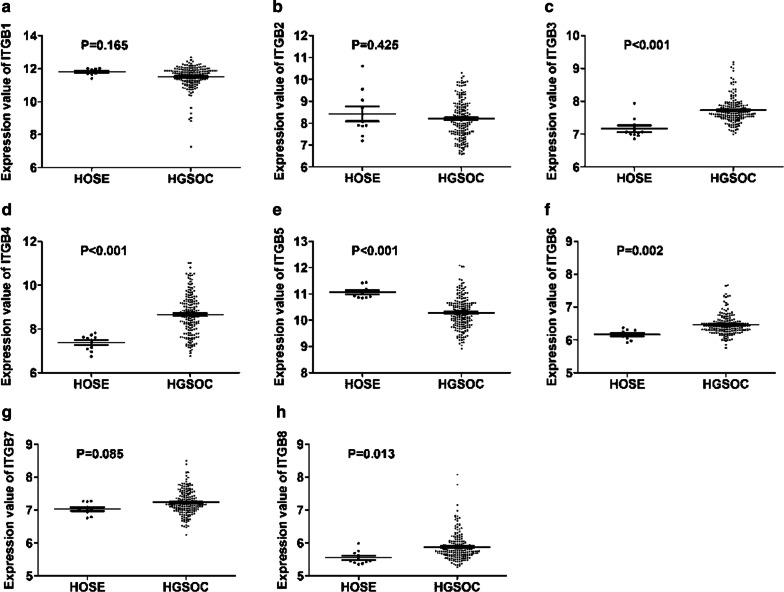
We first determined the differential expression of ITGA and ITGB superfamily members between HGSOC and HOSE using GSE26712 dataset. There was no significant difference in the expression of ITGA1 (Fig. 1a), ITGA4 (Fig. 1c), ITGB1 (Fig. 2a), ITGB2 (Fig. 2b), and ITGB7 (Fig. 2g) between SOCs and HOSE. ITGA2 (Fig. 1b), ITGA5 (Fig. 1d), ITGA7 (Fig. 1f), ITGA8 (Fig. 1g), ITGA9 (Fig. 1h), ITGA10 (Fig. 1i), ITGB3 (Fig. 2c), ITGB4 (Fig. 2d), ITGB6 (Fig. 2f), and ITGB8 (Fig. 2g) expression were significantly increased in HGSOC compared with that in HOSE. In contrast, ITGA6 (Fig. 1e) and ITGB5 (Fig. 2e) were significantly decreased in HGSOC compared with that in HOSE.
Fig. 1.
Differential expression of ITGA superfamily members between HGSOC and normal counterparts. (a–i) There was no significant difference in the expression of ITGA1 (a) and ITGA4 (c) between HGSOC and normal counterparts. ITGA2 (b), ITGA5 (d), ITGA7 (f), ITGA8 (g), ITGA9 (h), and ITGA10 (i) expression were significantly increased in HGSOC compared with that in normal counterparts. In contrast, ITGA6 (e) was significantly decreased in HGSOC compared with that in normal counterparts
Fig. 2.
Differential Expression of ITGB superfamily members between HGSOC and normal counterparts. a–h There was no significant difference in the expression of ITGB1 (a), ITGB2 (b), and ITGB7 (g) between HGSOC and normal counterparts. ITGB3 (c), ITGB4 (d), ITGB6 (f), and ITGB8 (g) were significantly overexpressed in HGSOC compared with that in normal counterparts. In contrast, ITGB5 (e) was significantly downregulated in HGSOC compared with that in normal counterparts
The prognostic value of ITGA and ITGB members for recurrence free survival (RFS) in HGSOC
Next, we determined the prognostic significance of ITGA and ITGB members in predicting RFS in patients with HGSOC using TCGA dataset (Table 1). In univariable analysis, advanced FIGO stage and increased ITGB1 expression were associated with decreased RFS. In multivariable analysis, increased ITGB1 expression were associated with decreased RFS. Advanced FIGO stage tended to be related to decreased RFS though without reaching statistical significance.
Table 1.
The prognostic significance of ITGA and ITGB superfamily members in predicting RFS in HGSOC patients in TCGA dataset
| Variables | Number of patients | Univariate analysis | Multivariate analysis | ||
|---|---|---|---|---|---|
| HR (95% CI) | P value | HR (95% CI) | P value | ||
| Age | 405 | 1.005 (0.993–1.018) | 0.391 | / | / |
| Stage | 0.035 | 0.065 | |||
| Early | 23 | 1 | 1 | ||
| Late | 382 | 2.255 (1.060–4.796) | 2.046 (0.956–4.379) | ||
| Debulking | 0.546 | / | |||
| Optimal | 302 | 1 | / | / | |
| Suboptimal | 103 | 1.100 (0.807–1.501) | / | / | |
| ITGA1 | 405 | 0.882 (0.570–1.362) | 0.570 | / | / |
| ITGA2 | 405 | 0.778 (0.528–1.147) | 0.205 | / | / |
| ITGA4 | 405 | 1.060 (0.679–1.655) | 0.798 | / | / |
| ITGA5 | 405 | 1.152(0.950–1.396) | 0.150 | / | / |
| ITGA6 | 405 | 0.863 (0.723–1.029) | 0.100 | 0.888 (0.739–1.068) | 0.207 |
| ITGA7 | 405 | 1.086 (0.916–1.287) | 0.341 | / | / |
| ITGA8 | 405 | 1.040 (0.714–1.515) | 0.838 | / | / |
| ITGA9 | 405 | 1.054 (0.754–1.451) | 0.788 | / | / |
| ITGA10 | 405 | 0.893 (0.618–1.292) | 0.549 | / | / |
| ITGB1 | 405 | 1.327 (1.002–1.757) | 0.048 | 1.341 (1.018–1.767) | 0.037 |
| ITGB2 | 405 | 1.039 (0.928–1.162) | 0.506 | / | / |
| ITGB3 | 405 | 0.769 (0.451–1.311) | 0.335 | / | / |
| ITGB4 | 405 | 1.054 (0.936–1.186) | 0.385 | / | / |
| ITGB5 | 405 | 1.080 (0.911–1.280) | 0.375 | / | / |
| ITGB6 | 405 | 0.874 (0.659–1.159) | 0.349 | / | / |
| ITGB7 | 405 | 0.834 (0.614–1.133) | 0.245 | / | / |
| ITGB8 | 405 | 1.124 (0.962–1.314) | 0.142 | 0.888 (0.739–1.068) | 0.207 |
Generation and validation of ITGB1-related nomogram predictive of RFS
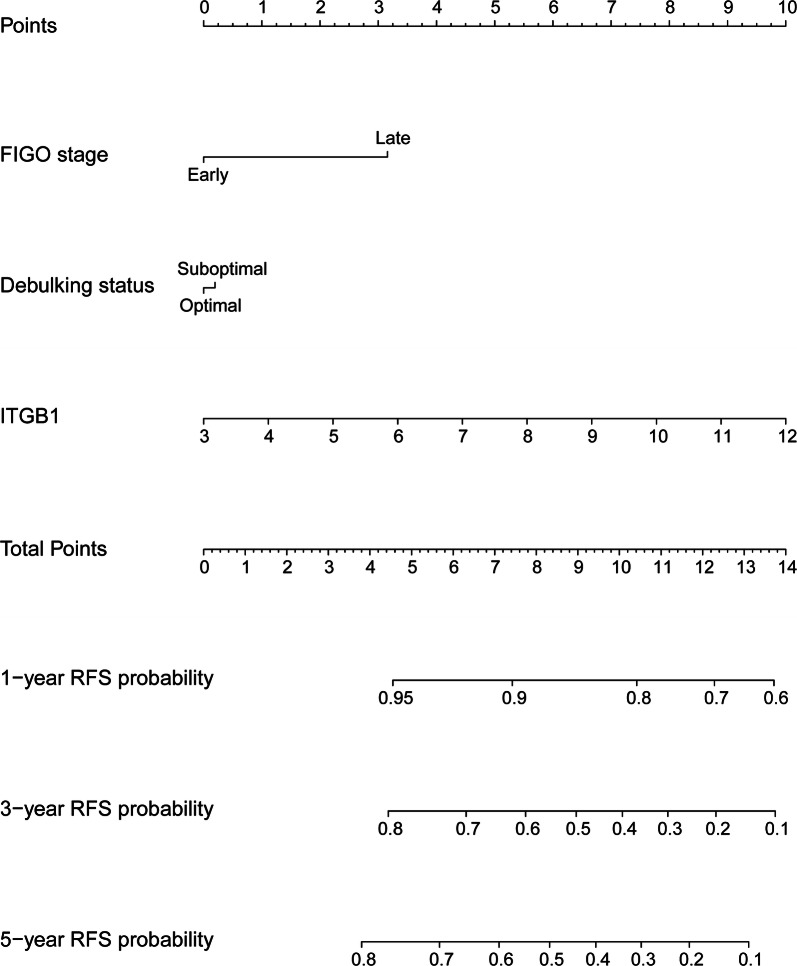
To quantitatively predict the prognosis of HGSOC, a nomogram was generated and validated in the training dataset (TCGA) and validation dataset (GSE9891) respectively. The predictors included FIGO stage, debulking status, and ITGB1 expression. Among these, ITGB1 had the largest contribution to RFS, followed by FIGO stage and debulking status (Fig. 3). The C-index for predicting RFS was 0.55 (95% CI 0.50–0.59) in TCGA dataset (training dataset) and 0.65 (95% CI 0.59–0.72) in GSE9891 dataset (validation dataset), respectively.
Fig. 3.
Generation of ITGB1-related nomogram predictive of RFS. The nomogram illustrated that ITGB1 had the largest contribution to RFS, followed by FIGO stage and debulking status
The prognostic value of ITGA and ITGB members for overall survival (OS) in HGSOC
Next, we assessed the prognostic value of ITGA and ITGB members in predicting OS in patients with HGSOC using TCGA dataset (Table 2). In univariable analysis, elder age, suboptimal debulking, and ITGB8 overexpression were associated with decreased OS. Advanced FIGO stage appeared to be associated with a worse outcome though without reaching statistical significance. In multivariable analysis, elder age and ITGB8 overexpression remained to be independent predictors of decreased OS.
Table 2.
The prognostic significance of ITGA and ITGB superfamily members in predicting OS in HGSOC patients in TCGA dataset
| Variables | Number of patients | Univariate analysis | Multivariate analysis | ||
|---|---|---|---|---|---|
| HR (95% CI) | P value | HR (95% CI) | P value | ||
| Age | 405 | 1.025 (1.013–1.038) | < 0.001 | 1.023 (1.010–1.036) | < 0.001 |
| Stage | 0.078 | 0.116 | |||
| Early | 23 | 1 | 1 | ||
| Late | 382 | 2.079 (0.922–4.685) | 1.934 (0.850–4.403) | ||
| Debulking | 0.017 | 0.230 | |||
| Optimal | 302 | 1 | 1 | ||
| Suboptimal | 103 | 1.430 (1.065–1.920) | 1.209 (0.887–1.649) | ||
| ITGA1 | 405 | 0.745 (0.474–1.170) | 0.202 | / | / |
| ITGA2 | 405 | 1.037 (0.713–1.508) | 0.851 | / | / |
| ITGA4 | 405 | 1.174 (0.777–1.774) | 0.446 | / | / |
| ITGA5 | 405 | 0.922 (0.759–1.120) | 0.416 | / | / |
| ITGA6 | 405 | 0.976 (0.819–1.163) | 0.782 | / | / |
| ITGA7 | 405 | 0.867 (0.729–1.033) | 0.110 | 0.849 (0.712–1.013) | 0.069 |
| ITGA8 | 405 | 0.987 (0.682–1.429) | 0.947 | / | / |
| ITGA9 | 405 | 0.944 (0.660–1.348) | 0.750 | / | / |
| ITGA10 | 405 | 1.107 (0.756–1.622) | 0.601 | / | / |
| ITGB1 | 405 | 1.054 (0.832–1.336) | 0.662 | / | / |
| ITGB2 | 405 | 1.004 (0.901–1.118) | 0.945 | / | / |
| ITGB3 | 405 | 0.850 (0.501–1.441) | 0.546 | / | / |
| ITGB4 | 405 | 0.992 (0.881–1.117) | 0.889 | / | / |
| ITGB5 | 405 | 1.087 (0.916–1.290) | 0.341 | / | / |
| ITGB6 | 405 | 0.975 (0.759–1.253) | 0.844 | / | / |
| ITGB7 | 405 | 0.821 (0.592–1.139) | 0.238 | / | / |
| ITGB8 | 405 | 1.207 (1.045–1.394) | 0.011 | 1.175 (1.014–1.362) | 0.032 |
Generation and validation of ITGA7/ITGB8-related nomogram predictive of OS
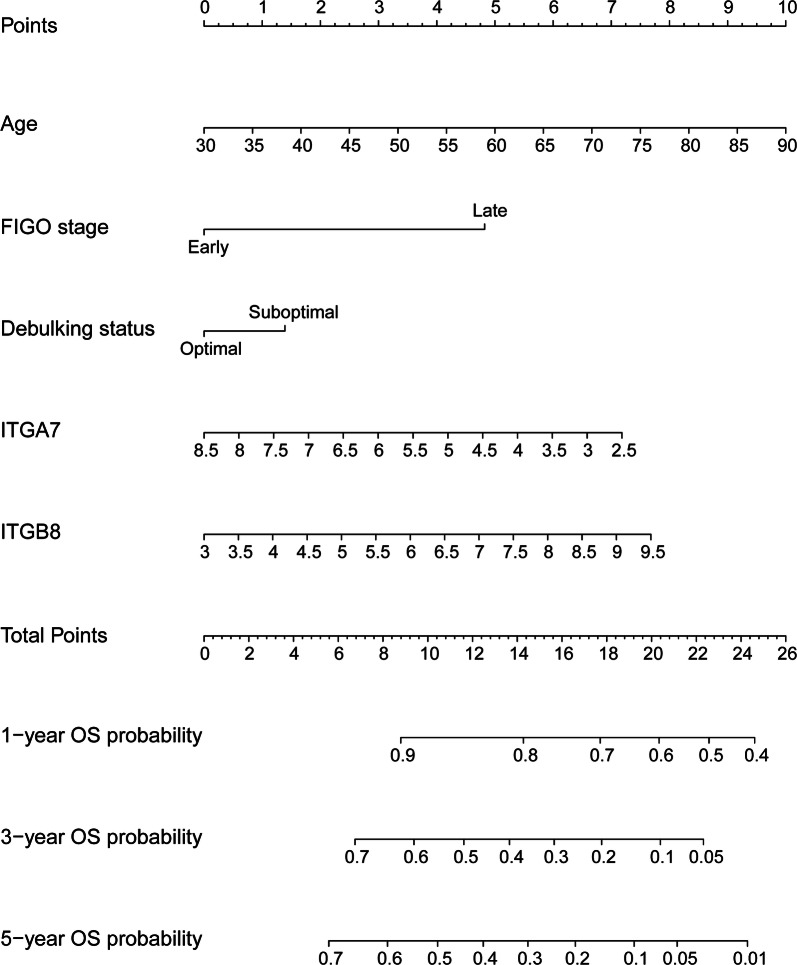
To quantitatively predict the prognosis of HGSOC, a nomogram was generated and validated in the training dataset (TCGA) and validation dataset (GSE9891) respectively. The predictors included age at initial diagnosis, FIGO stage, debulking status, ITGA7 and ITGB8 expression. Among these, age at initial diagnosis had the largest contribution to OS, followed by ITGB8 and ITGA7 expression (Fig. 4). The C-index for predicting OS was 0.65 (95% CI 0.60–0.69) in TCGA dataset (training dataset) and 0.59 (95% CI 0.51–0.66) in GSE9891 dataset (validation dataset), respectively.
Fig. 4.
Generation of ITGA7/ITGB8-related nomogram predictive of OS. The nomogram illustrated that age at initial diagnosis had the largest contribution to OS, followed by ITGB8 and ITGA7 expression
Validation of the prognostic value of ITGB1 and ITGB8 using KM Plotter tool
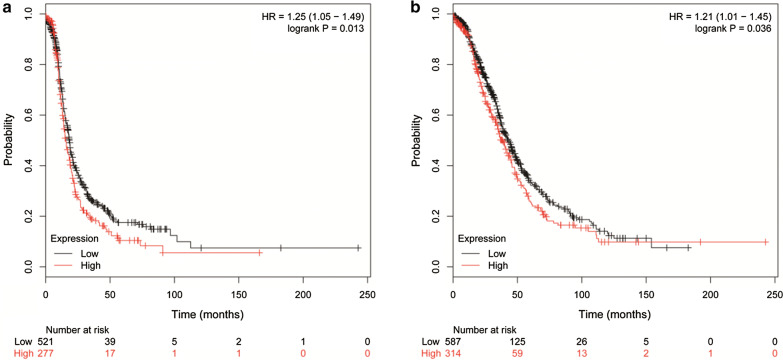
Next, we validated the prognostic value of ITGB1 and ITGB8 using Kaplan–Meier plotter tool. Consistently, increased expression of ITGB1 was associated with decreased progression free survival (PFS) (Fig. 5a; HR, 1.25; 95% CI 1.05–1.49), and elevated level of ITGB8 was associated with decreased OS (Fig. 5b; HR, 1.21; 95% CI 1.01–1.45).
Fig. 5.
Validation of the prognostic value of ITGB1 and ITGB8 using KM Plotter tool. a Increased expression of ITGB1 was associated with decreased PFS; b Elevated level of ITGB8 was associated with decreased OS
Discussion
The present study indicated that increased ITGA7 expression appeared to be associated with improved OS by multivariable analysis though without reaching statistical significance. Both univariable and multivariable analysis indicated that ITGB1 and ITGB8 was an independent predictor of RFS and OS in HGSOC, respectively. For RFS, the ITGB1-related nomogram indicated that ITGB1 had the largest contribution to RFS, followed by FIGO stage and debulking status. For OS, the ITGA7/ITGB8-based nomogram showed that age at initial diagnosis had the largest contribution to OS, followed by followed by ITGB8 and ITGA7 expression. These two nomograms could quantitatively predict the prognosis of HGSOC.
Indeed, the associations between some integrin family members and the clinical outcomes of ovarian cancer patients had been assessed previously. However, these studies usually evaluated the prognostic value of a single integrin member in a relatively small sample size. In contrast, our study assessed and validated the prognostic value of ITGA and ITGB, two superfamily of integrins, in serous ovarian cancer patients in a relatively large sample size by resorting to the high throughput microarray data in both TCGA and GEO datasets. This may yield more reliable results and generalize these findings with reduced doubts.
Since their discovery in the late 1980s, the integrin signaling have been demonstrated to be involved in multiple cellular processes of cancer development and progression [9]. In ovarian cancer, Yang et al. showed that ITGB1 expression was upregulated in ovarian cancer, and overexpression of ITGB1 enhanced the invasion of ovarian cancer cells [16]. Moreover, downregulation of ITGB1 impaired tumor growth and peritoneal spread in in vivo assays [16]. Increased expression of ITGB1 was associated with drug resistance in ovarian cancer cells [17]. This may partly explain the correlation between reduced RFS and ITGB1 overexpression in ovarian cancer patients revealed by our data. Similar findings were observed in other types of cancers [18, 19]. In ovarian cancer, ITGB8 had been demonstrated to be associated with drug resistance. Overexpression of ITGB8 restored cisplatin resistance inhibited by miR-199a-3p in SKOV-3 cells [20]. This may partly explain the association between reduced OS and ITGB8 overexpression in ovarian cancer patients [21]. Indeed, similar findings had been observed in other types of cancers. For example, ectopic expression of ITGB8 enhanced proliferation and invasion of colorectal cancer cells [22]. Consistently, ITGB8 was also upregulated in glioblastoma tissues and its upregulation was associated with worse clinical outcome [23]. ITGB8 inhibition impaired self-renewal ability, stemness, migration, and tumor formation capacity [23]. Collectively, the above findings indicated that ITGB8 functioned as oncogenes in various cancers and may become a potential therapeutic target in cancer treatment.
FIGO stage is a key determinant for prognostic prediction in HGSOC. Even though patients with the same FIGO stage were managed similarly, their clinical outcomes varied greatly. These differences in prognosis might be attributed to the biological heterogeneity of ovarian cancer. In this study, we found that ITGB1 expression had larger contributions to RFS than FIGO stage. Combination of ITGB1, FIGO stage and debulking status could predict RFS more accurately. Similarly, combination of clinical risk factors and ITGB8 expression may also predict OS more accurately.
Conclusions
In conclusion, ITGB1, ITGA7 and ITGB8 added prognostic value to the traditional clinical risk factors used to assess the clinical outcomes of HGSOC. Future works are needed to explore the functions of ITGB1, ITGA7 and ITGB8 in HGSOC.
Acknowledgements
We thank all the researchers who shared their high throughput expression data.
Authors’ contributions
Conception and design: JL, XL, TZ, RC. Collection and assembly of data: JL, TZ, RC. Data analysis and interpretation: All authors. Manuscript writing: JL, TZ. All authors read and approved the final manuscript.
Funding
This study was supported by funding from the National Natural Science Foundation of China (No. 81802596) and Natural Science Foundation of Shanghai (17ZR1403500).
Availability of data and materials
All the data are deposited in TCGA and GEO databases.
Ethics approval and consent for participate
All the GEO and TCGA datasets used in this study had received ethics approval from local department and consent to participate from patients.
Consent for publication
All the authors agreed to publish this article in present form.
Competing interests
The authors declare that there are no conflicts of interest.
Footnotes
Publisher's Note
Springer Nature remains neutral with regard to jurisdictional claims in published maps and institutional affiliations.
Tingting Zhu and Ruifang Chen contributed equally to this work
References
- 1.Integrated genomic analyses of ovarian carcinoma Nature. 2011;474(7353):609–615. doi: 10.1038/nature10166. [DOI] [PMC free article] [PubMed] [Google Scholar]
- 2.Oza AM, Cook AD, Pfisterer J, Embleton A, Ledermann JA, Pujade-Lauraine E, Kristensen G, Carey MS, Beale P, Cervantes A, et al. Standard chemotherapy with or without bevacizumab for women with newly diagnosed ovarian cancer (ICON7): overall survival results of a phase 3 randomised trial. Lancet Oncol. 2015;16(8):928–936. doi: 10.1016/S1470-2045(15)00086-8. [DOI] [PMC free article] [PubMed] [Google Scholar]
- 3.Yang D, Sun Y, Hu L, Zheng H, Ji P, Pecot CV, Zhao Y, Reynolds S, Cheng H, Rupaimoole R, et al. Integrated analyses identify a master microRNA regulatory network for the mesenchymal subtype in serous ovarian cancer. Cancer Cell. 2013;23(2):186–199. doi: 10.1016/j.ccr.2012.12.020. [DOI] [PMC free article] [PubMed] [Google Scholar]
- 4.Lheureux S, Braunstein M, Oza AM. Epithelial ovarian cancer: evolution of management in the era of precision medicine. CA Cancer J Clin. 2019;69(4):280–304. doi: 10.3322/caac.21559. [DOI] [PubMed] [Google Scholar]
- 5.Coleman RL, Oza AM, Lorusso D, Aghajanian C, Oaknin A, Dean A, Colombo N, Weberpals JI, Clamp A, Scambia G, et al. Rucaparib maintenance treatment for recurrent ovarian carcinoma after response to platinum therapy (ARIEL3): a randomised, double-blind, placebo-controlled, phase 3 trial. Lancet. 2017;390(10106):1949–1961. doi: 10.1016/S0140-6736(17)32440-6. [DOI] [PMC free article] [PubMed] [Google Scholar]
- 6.Pujade-Lauraine E, Ledermann JA, Selle F, Gebski V, Penson RT, Oza AM, Korach J, Huzarski T, Poveda A, Pignata S, et al. Olaparib tablets as maintenance therapy in patients with platinum-sensitive, relapsed ovarian cancer and a BRCA1/2 mutation (SOLO2/ENGOT-Ov21): a double-blind, randomised, placebo-controlled, phase 3 trial. Lancet Oncol. 2017;18(9):1274–1284. doi: 10.1016/S1470-2045(17)30469-2. [DOI] [PubMed] [Google Scholar]
- 7.Moore K, Colombo N, Scambia G, Kim BG, Oaknin A, Friedlander M, Lisyanskaya A, Floquet A, Leary A, Sonke GS, et al. Maintenance olaparib in patients with newly diagnosed advanced ovarian cancer. N Engl J Med. 2018;379(26):2495–2505. doi: 10.1056/NEJMoa1810858. [DOI] [PubMed] [Google Scholar]
- 8.Lin KK, Harrell MI, Oza AM, Oaknin A, Ray-Coquard I, Tinker AV, Helman E, Radke MR, Say C, Vo LT, et al. BRCA reversion mutations in circulating tumor DNA predict primary and acquired resistance to the PARP inhibitor rucaparib in high-grade ovarian carcinoma. Cancer Discov. 2019;9(2):210–219. doi: 10.1158/2159-8290.CD-18-0715. [DOI] [PubMed] [Google Scholar]
- 9.Cooper J, Giancotti FG. Integrin signaling in cancer: mechanotransduction, stemness, epithelial plasticity, and therapeutic resistance. Cancer Cell. 2019;35(3):347–367. doi: 10.1016/j.ccell.2019.01.007. [DOI] [PMC free article] [PubMed] [Google Scholar]
- 10.Shen J, Xu J, Chen B, Ma D, Chen Z, Li JC, Zhu C. Elevated integrin alpha6 expression is involved in the occurrence and development of lung adenocarcinoma, and predicts a poor prognosis: a study based on immunohistochemical analysis and bioinformatics. J Cancer Res Clin Oncol. 2019;145(7):1681–1693. doi: 10.1007/s00432-019-02907-1. [DOI] [PMC free article] [PubMed] [Google Scholar]
- 11.Zhao G, Gong L, Su D, Jin Y, Guo C, Yue M, Yao S, Qin Z, Ye Y, Tang Y, et al. Cullin5 deficiency promotes small-cell lung cancer metastasis by stabilizing integrin beta1. J Clin Invest. 2019;129(3):972–987. doi: 10.1172/JCI122779. [DOI] [PMC free article] [PubMed] [Google Scholar]
- 12.Li R, Zhuang C, Jiang S, Du N, Zhao W, Tu L, Cao H, Zhang Z, Chen X. ITGBL1 predicts a poor prognosis and correlates EMT phenotype in gastric cancer. J Cancer. 2017;8(18):3764–3773. doi: 10.7150/jca.20900. [DOI] [PMC free article] [PubMed] [Google Scholar]
- 13.Kobayashi M, Sawada K, Kimura T. Potential of integrin inhibitors for treating ovarian cancer: a literature review. Cancers. 2017;9(7):83. doi: 10.3390/cancers9070083. [DOI] [PMC free article] [PubMed] [Google Scholar]
- 14.Gyorffy B, Lanczky A, Szallasi Z. Implementing an online tool for genome-wide validation of survival-associated biomarkers in ovarian-cancer using microarray data from 1287 patients. Endocr Relat Cancer. 2012;19(2):197–208. doi: 10.1530/ERC-11-0329. [DOI] [PubMed] [Google Scholar]
- 15.Li J, Yue H, Yu H, Lu X, Xue X. Development and validation of SIRT3-related nomogram predictive of overall survival in patients with serous ovarian cancer. J Ovarian RES. 2019;12(1):47. doi: 10.1186/s13048-019-0524-2. [DOI] [PMC free article] [PubMed] [Google Scholar]
- 16.Yang Z, Zhou X, Liu Y, Gong C, Wei X, Zhang T, Ma D, Gao Q. Activation of integrin beta1 mediates the increased malignant potential of ovarian cancer cells exerted by inflammatory cytokines. Anticancer Agents Med Chem. 2014;14(7):955–962. doi: 10.2174/1871520614666140613123108. [DOI] [PubMed] [Google Scholar]
- 17.Huang L, Hu C, Chao H, Wang R, Lu H, Li H, Chen H. miR-29c regulates resistance to paclitaxel in nasopharyngeal cancer by targeting ITGB1. Exp Cell Res. 2019;378(1):1–10. doi: 10.1016/j.yexcr.2019.02.012. [DOI] [PubMed] [Google Scholar]
- 18.Laudato S, Patil N, Abba ML, Leupold JH, Benner A, Gaiser T, Marx A, Allgayer H. P53-induced miR-30e-5p inhibits colorectal cancer invasion and metastasis by targeting ITGA6 and ITGB1. Int J Cancer. 2017;141(9):1879–1890. doi: 10.1002/ijc.30854. [DOI] [PubMed] [Google Scholar]
- 19.Hu C, Ni Z, Li BS, Yong X, Yang X, Zhang JW, Zhang D, Qin Y, Jie MM, Dong H, et al. hTERT promotes the invasion of gastric cancer cells by enhancing FOXO3a ubiquitination and subsequent ITGB1 upregulation. Gut. 2017;66(1):31–42. doi: 10.1136/gutjnl-2015-309322. [DOI] [PubMed] [Google Scholar]
- 20.Cui Y, Wu F, Tian D, Wang T, Lu T, Huang X, Zhang P, Qin L. miR-199a-3p enhances cisplatin sensitivity of ovarian cancer cells by targeting ITGB8. Oncol Rep. 2018;39(4):1649–1657. doi: 10.3892/or.2018.6259. [DOI] [PMC free article] [PubMed] [Google Scholar]
- 21.He J, Liu Y, Zhang L, Zhang H. Integrin subunit beta 8 (ITGB8) upregulation is an independent predictor of unfavorable survival of high-grade serous ovarian carcinoma patients. Med Sci Monit. 2018;24:8933–8940. doi: 10.12659/MSM.911518. [DOI] [PMC free article] [PubMed] [Google Scholar]
- 22.Huang L, Cai JL, Huang PZ, Kang L, Huang MJ, Wang L, Wang JP. miR19b-3p promotes the growth and metastasis of colorectal cancer via directly targeting ITGB8. AM J Cancer Res. 2017;7(10):1996–2008. [PMC free article] [PubMed] [Google Scholar]
- 23.Malric L, Monferran S, Delmas C, Arnauduc F, Dahan P, Boyrie S, Deshors P, Lubrano V, Da MD, Gilhodes J, et al. Inhibiting integrin beta8 to differentiate and radiosensitize glioblastoma-initiating cells. Mol Cancer Res. 2019;17(2):384–397. doi: 10.1158/1541-7786.MCR-18-0386. [DOI] [PubMed] [Google Scholar]
Associated Data
This section collects any data citations, data availability statements, or supplementary materials included in this article.
Data Availability Statement
All the data are deposited in TCGA and GEO databases.


