

Abstract
Transitional B cells must actively undergo selection for self-tolerance before maturing into their resting follicular B cell successors. We found that metabolic quiescence was acquired at the follicular B cell stage in both humans and mice. In follicular B cells, the expression of genes involved in ribosome biogenesis, aerobic respiration, and mammalian target of rapamycin complex 1 (mTORC1) signaling was reduced when compared to that in transitional B cells. Functional metabolism studies, profiling of whole-cell metabolites, and analysis of cell surface proteins in human B cells suggested that this transition was also associated with increased extracellular adenosine salvage. Follicular B cells increased the abundance of the cell surface ectonucleotidase CD73, which coincided with adenosine 5’-monophosphate–activated protein kinase (AMPK) activation. Differentiation to the follicular B cell stage in vitro correlated with surface acquisition of CD73 on human transitional B cells and was augmented with the AMPK agonist, AICAR. Last, individuals with gain-of-function PIK3CD (PI3Kδ) mutations and increased pS6 activation exhibited a near absence of circulating follicular B cells. Together, our data suggest that mTORC1 attenuation may be necessary for human follicular B cell development. These data identify a distinct metabolic switch during human B cell development at the transitional to follicular stages, which is characterized by an induction of extracellular adenosine salvage, AMPK activation, and the acquisition of metabolic quiescence.
INTRODUCTION
Lymphocyte development is best understood in the context of lineage-specific and stage-specific transcriptional regulators (1, 2). However, there is growing awareness of specific metabolic requirements after antigen-driven B cell activation. Germinal center B cells have increased glucose uptake and mitochondrial content compared to their resting follicular (FO) B cell precursors and must mitigate oxidative stress–induced cell damage to withstand a nutrient-depleted environment by modulating the expression of glycogen synthase kinase 3 (GSK3) and glucose transporter 1 (GLUT1) (3–6). In contrast, the contributions of metabolism to antigen-independent B cell development remain poorly explored.
Transitional B cells are the earliest bone marrow emigrants in the B lineage, and they are tolerized to soluble protein antigens in the periphery (7, 8). Distinct transitional B cell stages (T1, T2, and T3) exist in mice (8, 9), which do not exactly correspond to the three stages of transitional B cells described in humans (10–13). It is at the transitional T2 stage in mice that B cells acquire dependence on B cell activating factor for survival and then mature into FO B cells. FO B cells, in contrast, remain relatively inactive until they are engaged by antigen and T cell help. Although the exact signals that dictate transitional to FO B cell maturation remain poorly understood, hyperactivation of mammalian target of rapamycin complex 1 (mTORC1) in the B lineage due to loss of either Pten (14) or TscI (15–17), or Pik3cd hyperactivation (18), arrests development in the periphery between the transitional T1 and FO B cell stages in mice. In humans with primary immunodeficiency and lymphoproliferative end-organ disease, gain-of-function germline mutations in PIK3CD (PI3Kδ) also promote mTORC1 hyperactivation (19, 20). These patients exhibit a relative increase in transitional B cells in circulation, although the underlying basis for this change and the precise developmental stage at which differentiation is affected remain unclear (21, 22).
Here, we found that the induction of metabolic quiescence was central to the maturation of FO B cells. FO B cells exhibited notable decreases in the expression of genes involved in protein biosynthesis, aerobic respiration, and mTORC1 signaling compared to transitional B cells. Profiling of metabolites, whole-gene expression, and cell surface proteins revealed that the switch from transitional to FO B cells in humans was linked to the induction of the extracellular adenosine salvage pathway and the activation of the central mTORC1 antagonist, adenosine 5’-monophosphate–activated protein kinase (AMPK). The switch to the FO B cell stage was abrogated in patients with hyperactive PIK3CD (PI3Kδ) germline mutations in whom there was a discrete block in B cell differentiation at the transitional B cell stage, before the induction of extracellular adenosine salvage. Treatment with the AMPK agonist, 5-aminoimidazole-4-carboxamide ribonucleotide (AICAR), augmented transitional to FO human B cell development in vitro. Last, activating mutations in PIK3CD (PI3Kδ) identified a discrete block in transitional to FO B cell development. Together, these data uncover a metabolic switch that regulates human transitional to FO B cell development.
RESULTS
Acquisition of metabolic quiescence and loss of mTORC1 signaling mark the transitional to FO B cell switch in humans and mice
To identify key signaling pathways that are altered during transitional to FO B cell development, we purified transitional (T1/2 and T3) and FO B cells from the peripheral blood of healthy control human subjects for transcriptomic analyses by RNA sequencing (RNA-seq) (fig. S1A) (10–13). Given the extensive definition of murine B cell subsets by surface marker expression and in terms of developmental potential (8, 9), we also analyzed sorted transitional (T1, T2, and T3) and FO B cell subsets from the mouse (fig. S1B). We identified 901 differentially expressed genes (DEGs) between human B cell subsets, of which 794 DEGs (88.1%) were distinct between T1/2 compared to T3 and FO B cells (Fig. 1A). In contrast, we identified 528 DEGs between murine B cell subsets, of which 316 DEGs (59.8%) were distinct between T1, T2, and T3 compared to FO B cells (Fig. 1B). These data suggested a major transcriptional switch at the transitional T3 B cell stage in human compared to the FO B cell stage in mouse (fig. S2). We further probed transcriptomic pathways that changed during transitional to FO B cell maturation using gene set enrichment analysis. Transitional to FO B cell maturation was associated with a robust decline in the expression of genes linked to protein synthesis, ribosome biogenesis, and aerobic respiration in both humans (Fig. 1A) and mice (Fig. 1B). In particular, reduced expression of genes involved in peptide biosynthesis/translation was highly enriched within FO B cells in both species using the Gene Ontology (GO) database (table S1) (23, 24). Upstream of protein biosynthesis and aerobic metabolism, we observed a robust decline in the expression of genes linked to mTORC1 signaling with FO B cell maturation in both species. This pathway was the most highly enriched pathway found in the mouse using the Molecular Signatures Database Hallmark Gene Set Collection (hallmark) (table S1) (25). In contrast, genes linked to FoxO signaling (PID_FOXO_PATHWAY) were not statistically different between transitional and FO B cells in either human or mouse.
Fig. 1. Expression of genes involved in protein anabolism, aerobic respiration, and mTORC1 signaling decreases with transitional to FO B cell maturation in humans and mouse.
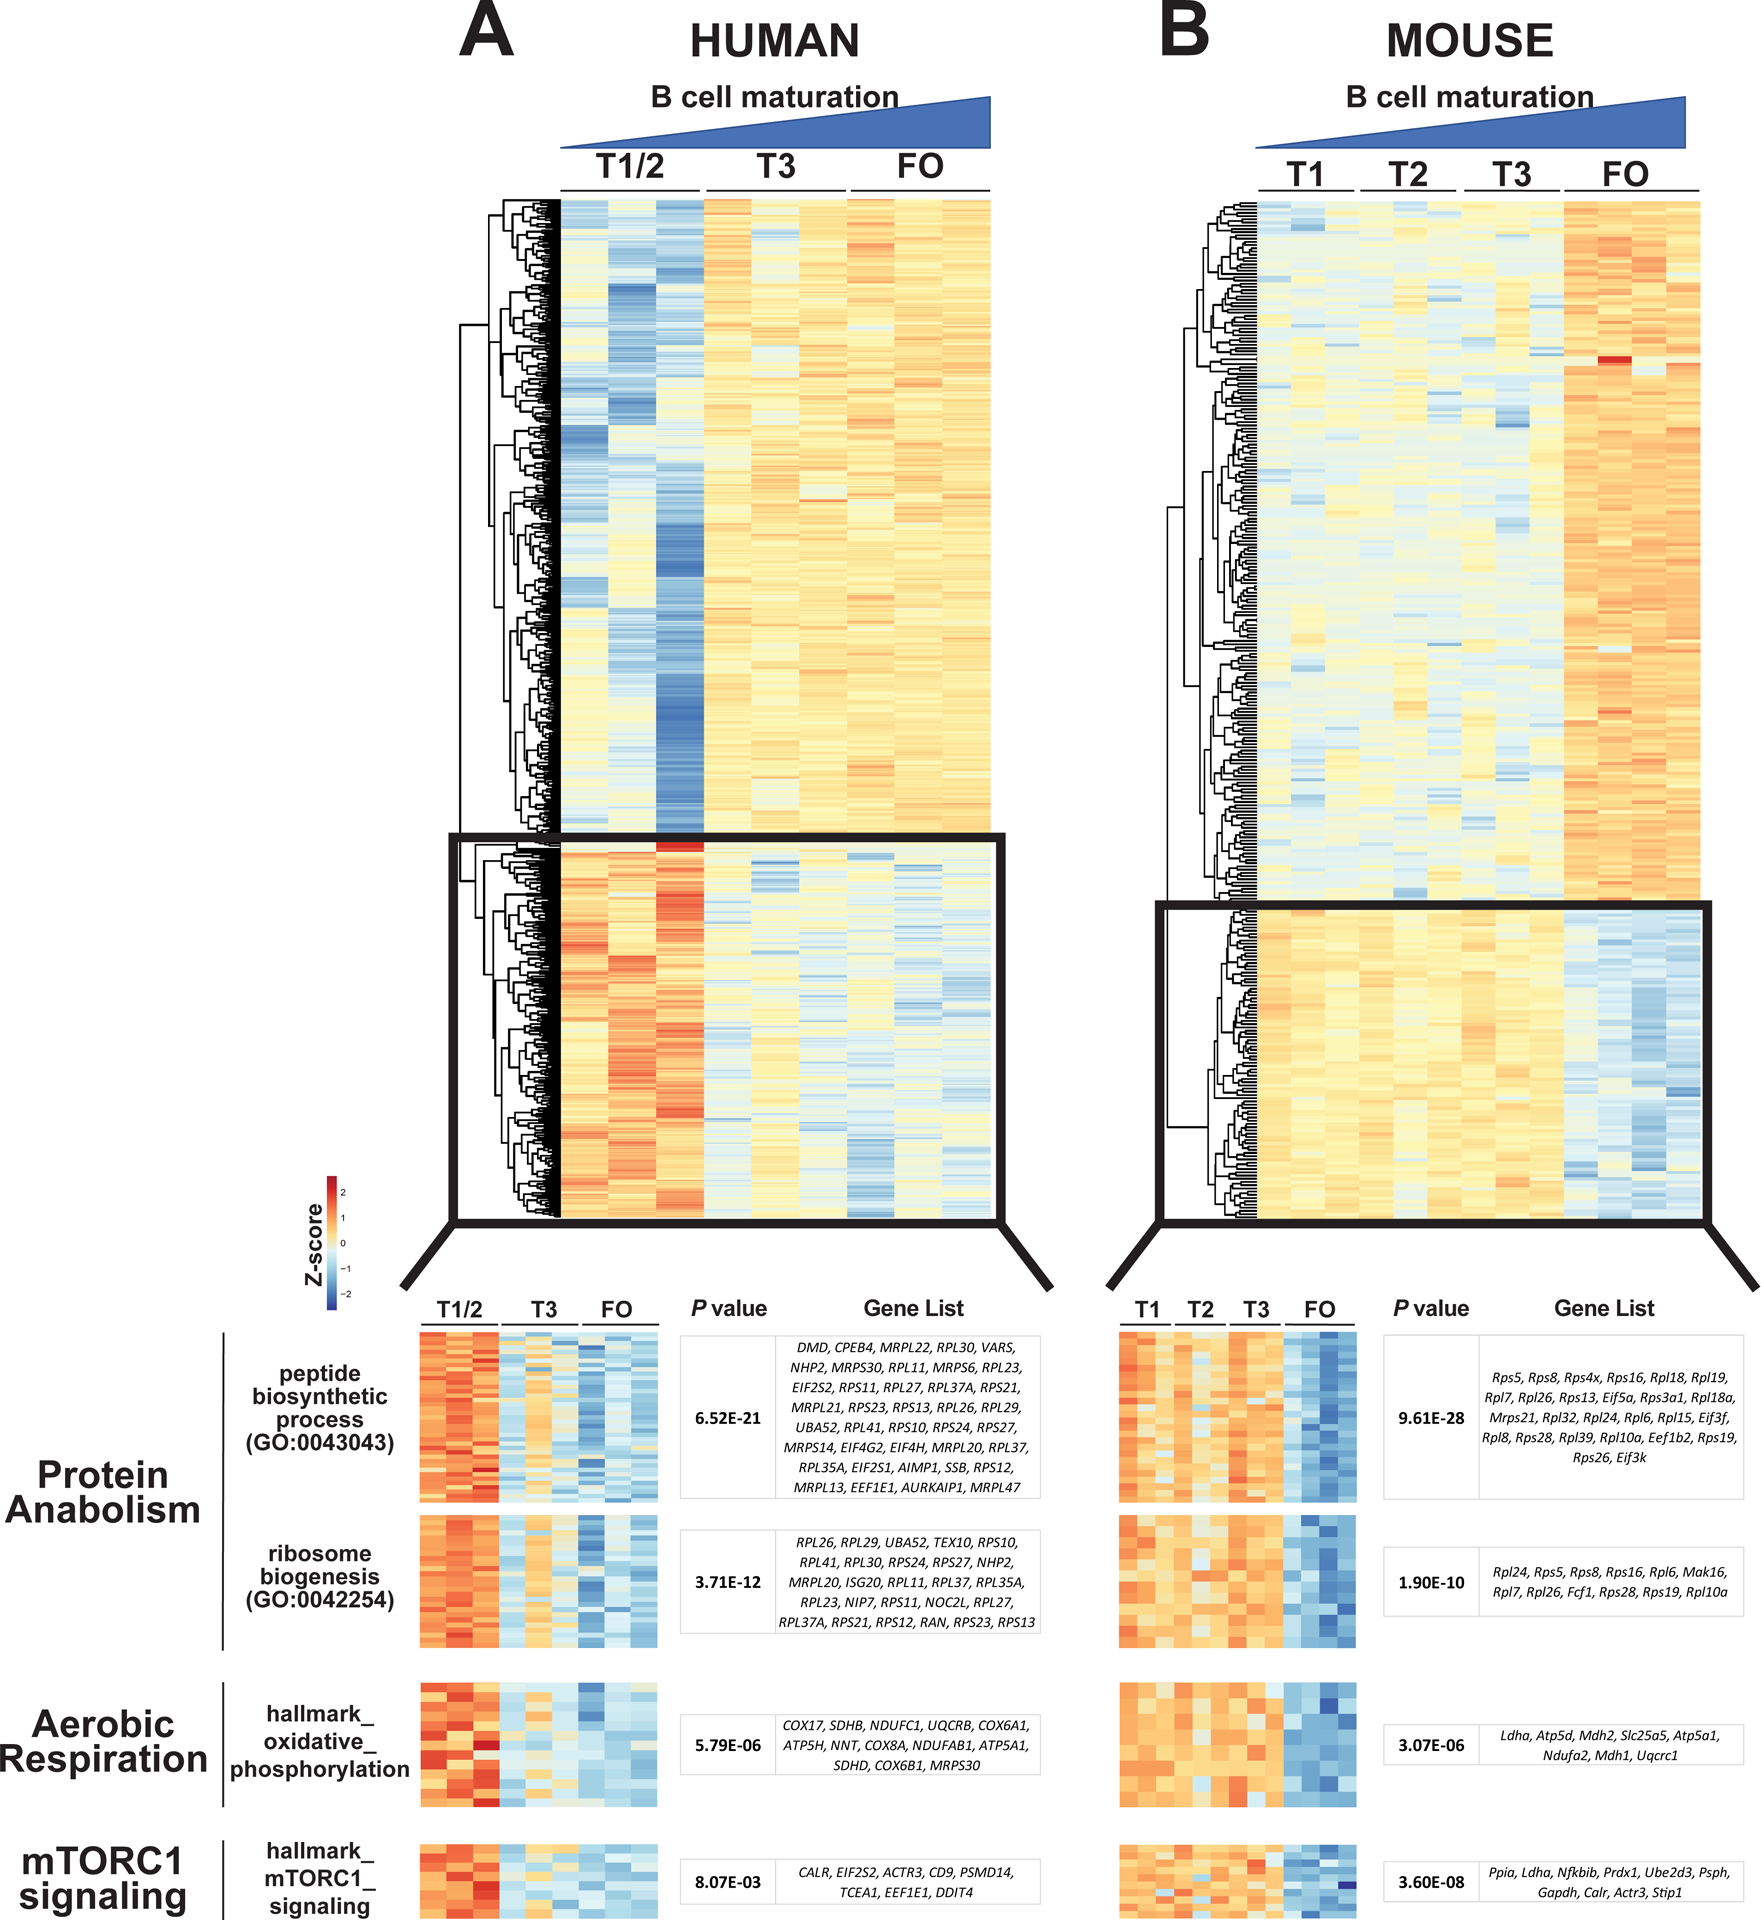
Differentially expressed genes (DEGs) in sorted transitional (T1/2 and T3) and follicular (FO) B cells from human (A) and sorted transitional (T1, T2, and T3) and FO B cells from mouse (B). DEGs between B cell stages defined using empirical Bayes hierarchical modeling (53) (top) and shown in the predominant B cell maturation pattern as heatmap of gene expression by Z scores from three biological replicates for human (794 DEGs) and mouse (316 DEGs). Gene set enrichment (bottom) performed on all DEGs (901 in human and 528 in mouse) using an FDR-adjusted P value <0.01 to define significance. All top pathways of enrichment were in a pattern of decreased expression with B cell maturation (indicated by the black box) and are listed by term, P value, and enriched genes per pathway. All top GO and hallmark gene set enrichment pathways are listed in table S1.
To validate the transcriptomic analyses, we assayed for functional metabolic changes during human transitional to FO B cell differentiation (Fig. 2A). We observed a marked decrease in oxidation of the cell-permeable marker CellROX in FO B cells. The decrease in reactive oxygen species was associated with a lower mitochondrial mass in FO B cells, as measured by the mitochondrial membrane-specific and efflux-independent dye, 10-nonyl bromide acridine orange (NAO). Last, we directly probed glucose uptake using the marker 2-deoxy-2-[(7-nitro-2,1,3-benzoxadiazol-4-yl)amino]-d-glucose (2-NBDG) and discovered a statistically significant maturation-dependent decrease in glucose uptake. In line with these metabolic changes, FO compared to early transitional (T1/2) B cells had lower linear measures of forward and side scatter as flow cytometric approximates of cell size and granularity, respectively. However, surface amounts of the B cell marker CD19 were not statistically different by flow cytometry (fig. S3).
Fig. 2. Human FO B cells decrease aerobic respiration and mTORC1 signaling.
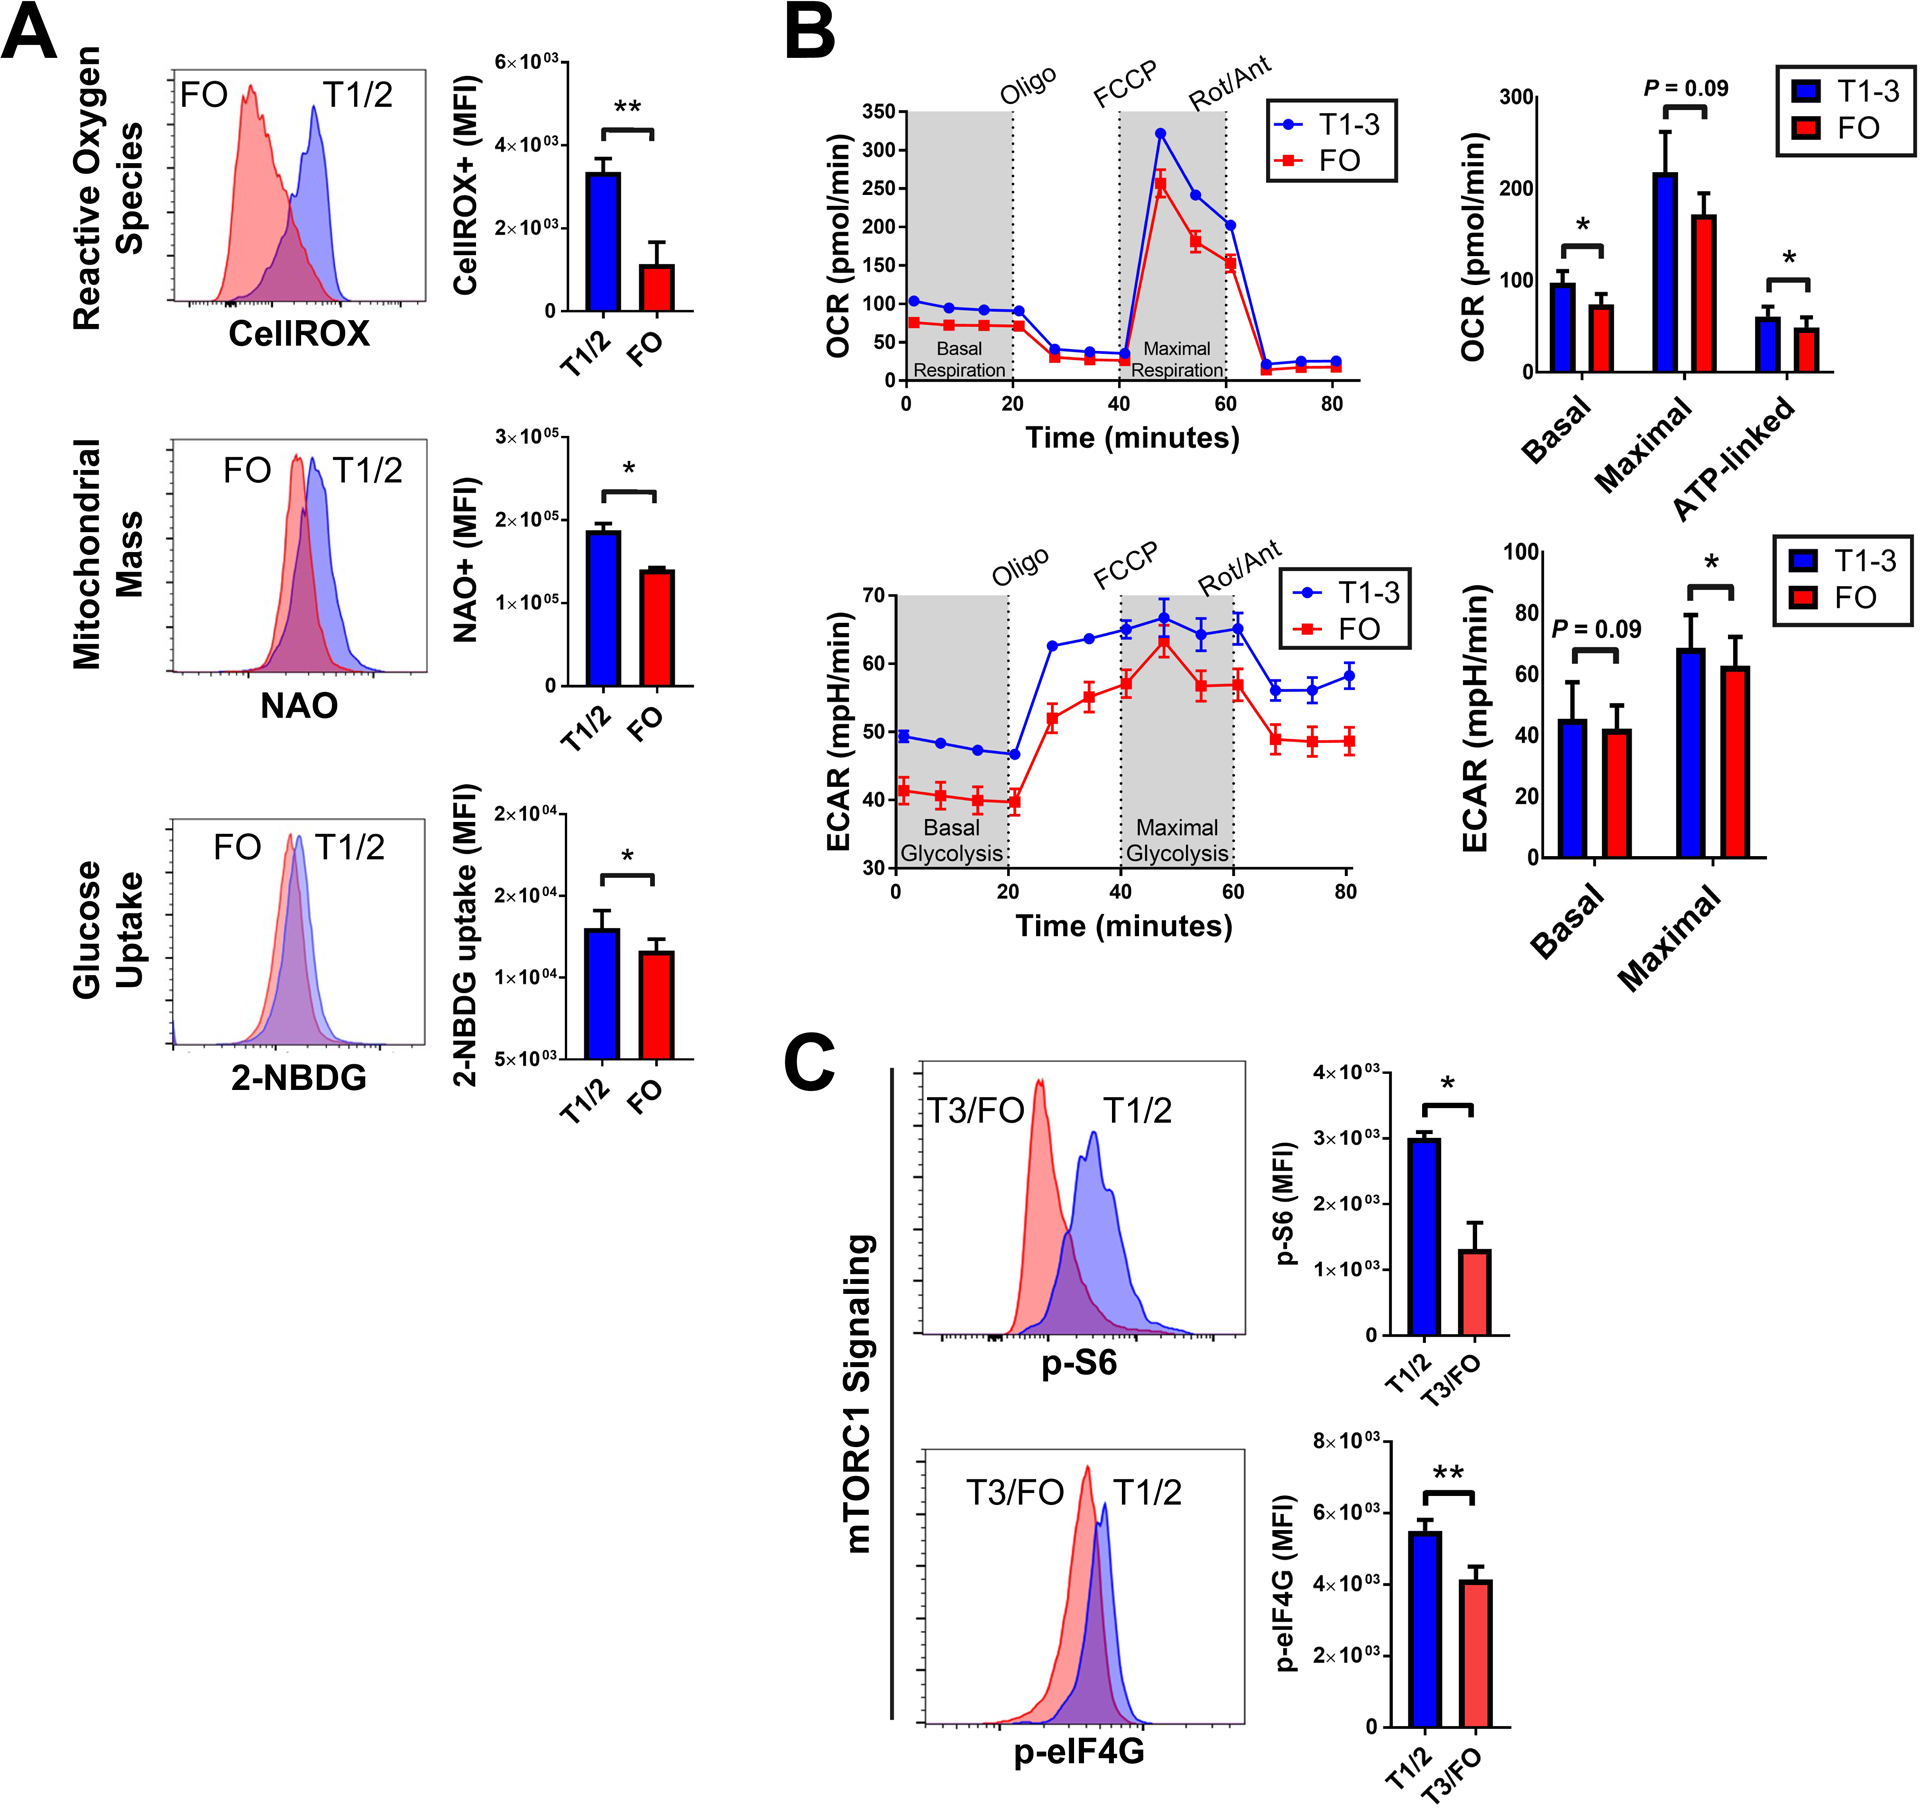
(A) Flow cytometry analysis of reactive oxygen species (top), mitochondrial mass (middle), and glucose uptake (bottom) in T1/2 (blue) and FO (red) B cells. Histograms (left) are representative of three biological replicates. Quantified data (right) are means +/− SD of three biological replicates. (B) Seahorse analysis of oxygen consumption rate (OCR, top) and extracellular acidification rate (ECAR, bottom) in sorted T1 to T3 (blue) and FO (red) B cells. Traces (left) are representative of three biological replicates. Quantified data (right) are means +/− SD of all data. (C) Flow cytometry analysis of pS6 and peIF4G in T1/2 (blue) and T3/FO (red) B cells. Histograms (left) are representative of three biological replicates. Quantified data (right) are means +/− SD of three biological replicates. *P < 0.05 and **P < 0.005 by paired Student’s t test. MFI, median fluorescence intensity.
To assess B cell metabolism more globally, we used the Seahorse platform (Fig. 2B) and observed lower rates of oxygen consumption in FO B cells. This difference occurred at rest and was in part adenosine 5’-triphosphate (ATP) dependent, as revealed by treatment with the ATP synthase inhibitor, oligomycin. Challenge studies with carbonyl cyanide p-trifluoromethoxyphenylhydrazone (FCCP), which dissociates the otherwise obligatory link between electron transport and phosphorylation, further elicited a trend toward lower maximal respiratory potential in FO B cells. The decreased aerobic capacity in human FO B cells was linked to decreased glycolysis as measured by rate of extracellular acidification at the maximal aerobic state. Last, we assayed mTORC1 signaling by probing amounts of S6 and eIF4G phosphorylation, both downstream substrates of mTORC1 (Fig. 2C). We observed lower basal phospho-S6 and phospho-eIF4G amounts in human FO B cells when compared to transitional T1/2 B cells. Together, these data suggested that a metabolic reprogramming occurs between transitional and FO B cells stages in both humans and mice. This switch was marked by down-regulation of mTORC1 signaling and an orchestrated attenuation of its multiple downstream targets including peptide biosynthesis (26), ribosome biogenesis (27), oxidative phosphorylation (28, 29), and glycolysis (30).
Gain-of-function PIK3CD (PI3Kδ) germline mutations are associated with a block human FO B cell development in vivo
Given the observed decline in mTORC1 signaling and its downstream targets after transitional to FO B cell maturation in humans, we hypothesized that mTORC1 inhibition is necessary for the development of FO B cells. In mice with conditional B lineage Pten deletion (14), TscI deletion (15–17), or Pik3cd hyperactivation (18), all of which promote mTORC1 hyperactivation, B cell development is blocked abruptly between transitional T1 and FO B cell stages. We tested whether this phenotype is conserved in humans with inherited primary immunodeficiency owing to gain-of-function germline mutations in PIK3CD (PI3Kδ), which is characterized by mTORC1 hyperactivation in immune cells (19). Patients with activating PI3Kδ syndrome (APDS) have an increase in the frequency of both CD27−CD10+ (22) and IgM/D+CD27−CD38+CD24+ circulating transitional B cells (21). However, the MitoTracker reagent is necessary to distinguish between transitional T3 and FO B cells (10, 11). In previous studies of patients with APDS, transitional T3 and FO B cells were grouped together and, as a result, fairly robust numbers of what were assumed to be only FO B cells were quantitated (21, 22).
We identified three patients with APDS from a 205-patient common variable immunodeficiency cohort followed at the Partners Network Hospitals in Boston (31). A fourth patient came from the University of South Florida. All patients had a clinical presentation of immunodeficiency and lymphoproliferation and an immunophenotype consistent with APDS that included peripheral CD4+ T cell activation and exhaustion (table S2) (21, 32). Mutations were identified by next-generation sequencing and confirmed by Sanger sequencing (fig. S4). Three patients carried the heterozygous germline c.3061G>A, p.E1021K PIK3CD mutation, which is causative for APDS (19, 20). One patient had a previously unidentified heterozygous germline c.181A>G, p.M61V mutation in PIK3CD that localized to the ABD domain, which can also be associated with APDS (33). Consistent with the M61V mutation promoting PI3Kδ hyperactivation, we found greater phosphorylated Akt (pAKT) and pS6 after anti–immunoglobulin M (IgM) activation of patient B cells than control donors, although anti–IgM-mediated Ca2+ flux was similar (fig. S5, A and B). In a human B cell line stably overexpressing mutant M61V, the abundance of pAKT and pS6 were also increased when compared to wild-type (WT) PI3Kδ (fig. S5C).
We examined naive B cell maturation in depth in our patients with APDS. We confirmed that they had an increased frequency of early transitional (T1/2) cells in the periphery using CD24, CD38, and CD10 as previously described (Fig. 3A) (21, 22). When we included MitoTracker, CD21, and CD45RB to distinguish transitional and FO B cell populations with greater resolution, we identified a distinct block in human B cell development between the transitional and FO B cell stages (Fig. 3B and fig. S6). To further resolve this B cell block in an unbiased fashion, we performed single-cell RNA-seq (scRNA-seq) on the total IgD+CD27− B cell compartment from patients with APDS and healthy controls and applied canonical correlation analysis (CCA) to define common sources of variation (34). IgD+CD27− B cells from patients with APDS were separable from healthy controls on the first CC dimension (Fig. 3C) and by using t-distributed Stochastic Neighbor Embedding (t-SNE) for dimensionality reduction (fig. S7). Gene signature analysis using bulk-sorted healthy control transitional and FO B cell subsets as reference transcriptomes identified markedly reduced expression of FO-associated genes in IgD+CD27− B cells from patients with APDS compared to controls. In contrast, the expression of T1/2-associated genes was similar. As expected, APDS IgD+CD27− B cells had a substantially greater expression of genes associated with the mTORC1 signaling pathway as compared to controls. These data, using both biased (flow cytometry) and unbiased (scRNA-seq) approaches, demonstrated a marked and near-total loss of FO B cells in the peripheral blood of patients with gain-of-function mutations in PIK3CD and mTORC1 hyperactivation.
Fig. 3. Gain-of-function PIK3CD (PI3Kδ) mutations block FO B cell development and correlate with mTORC1 hyperactivation.
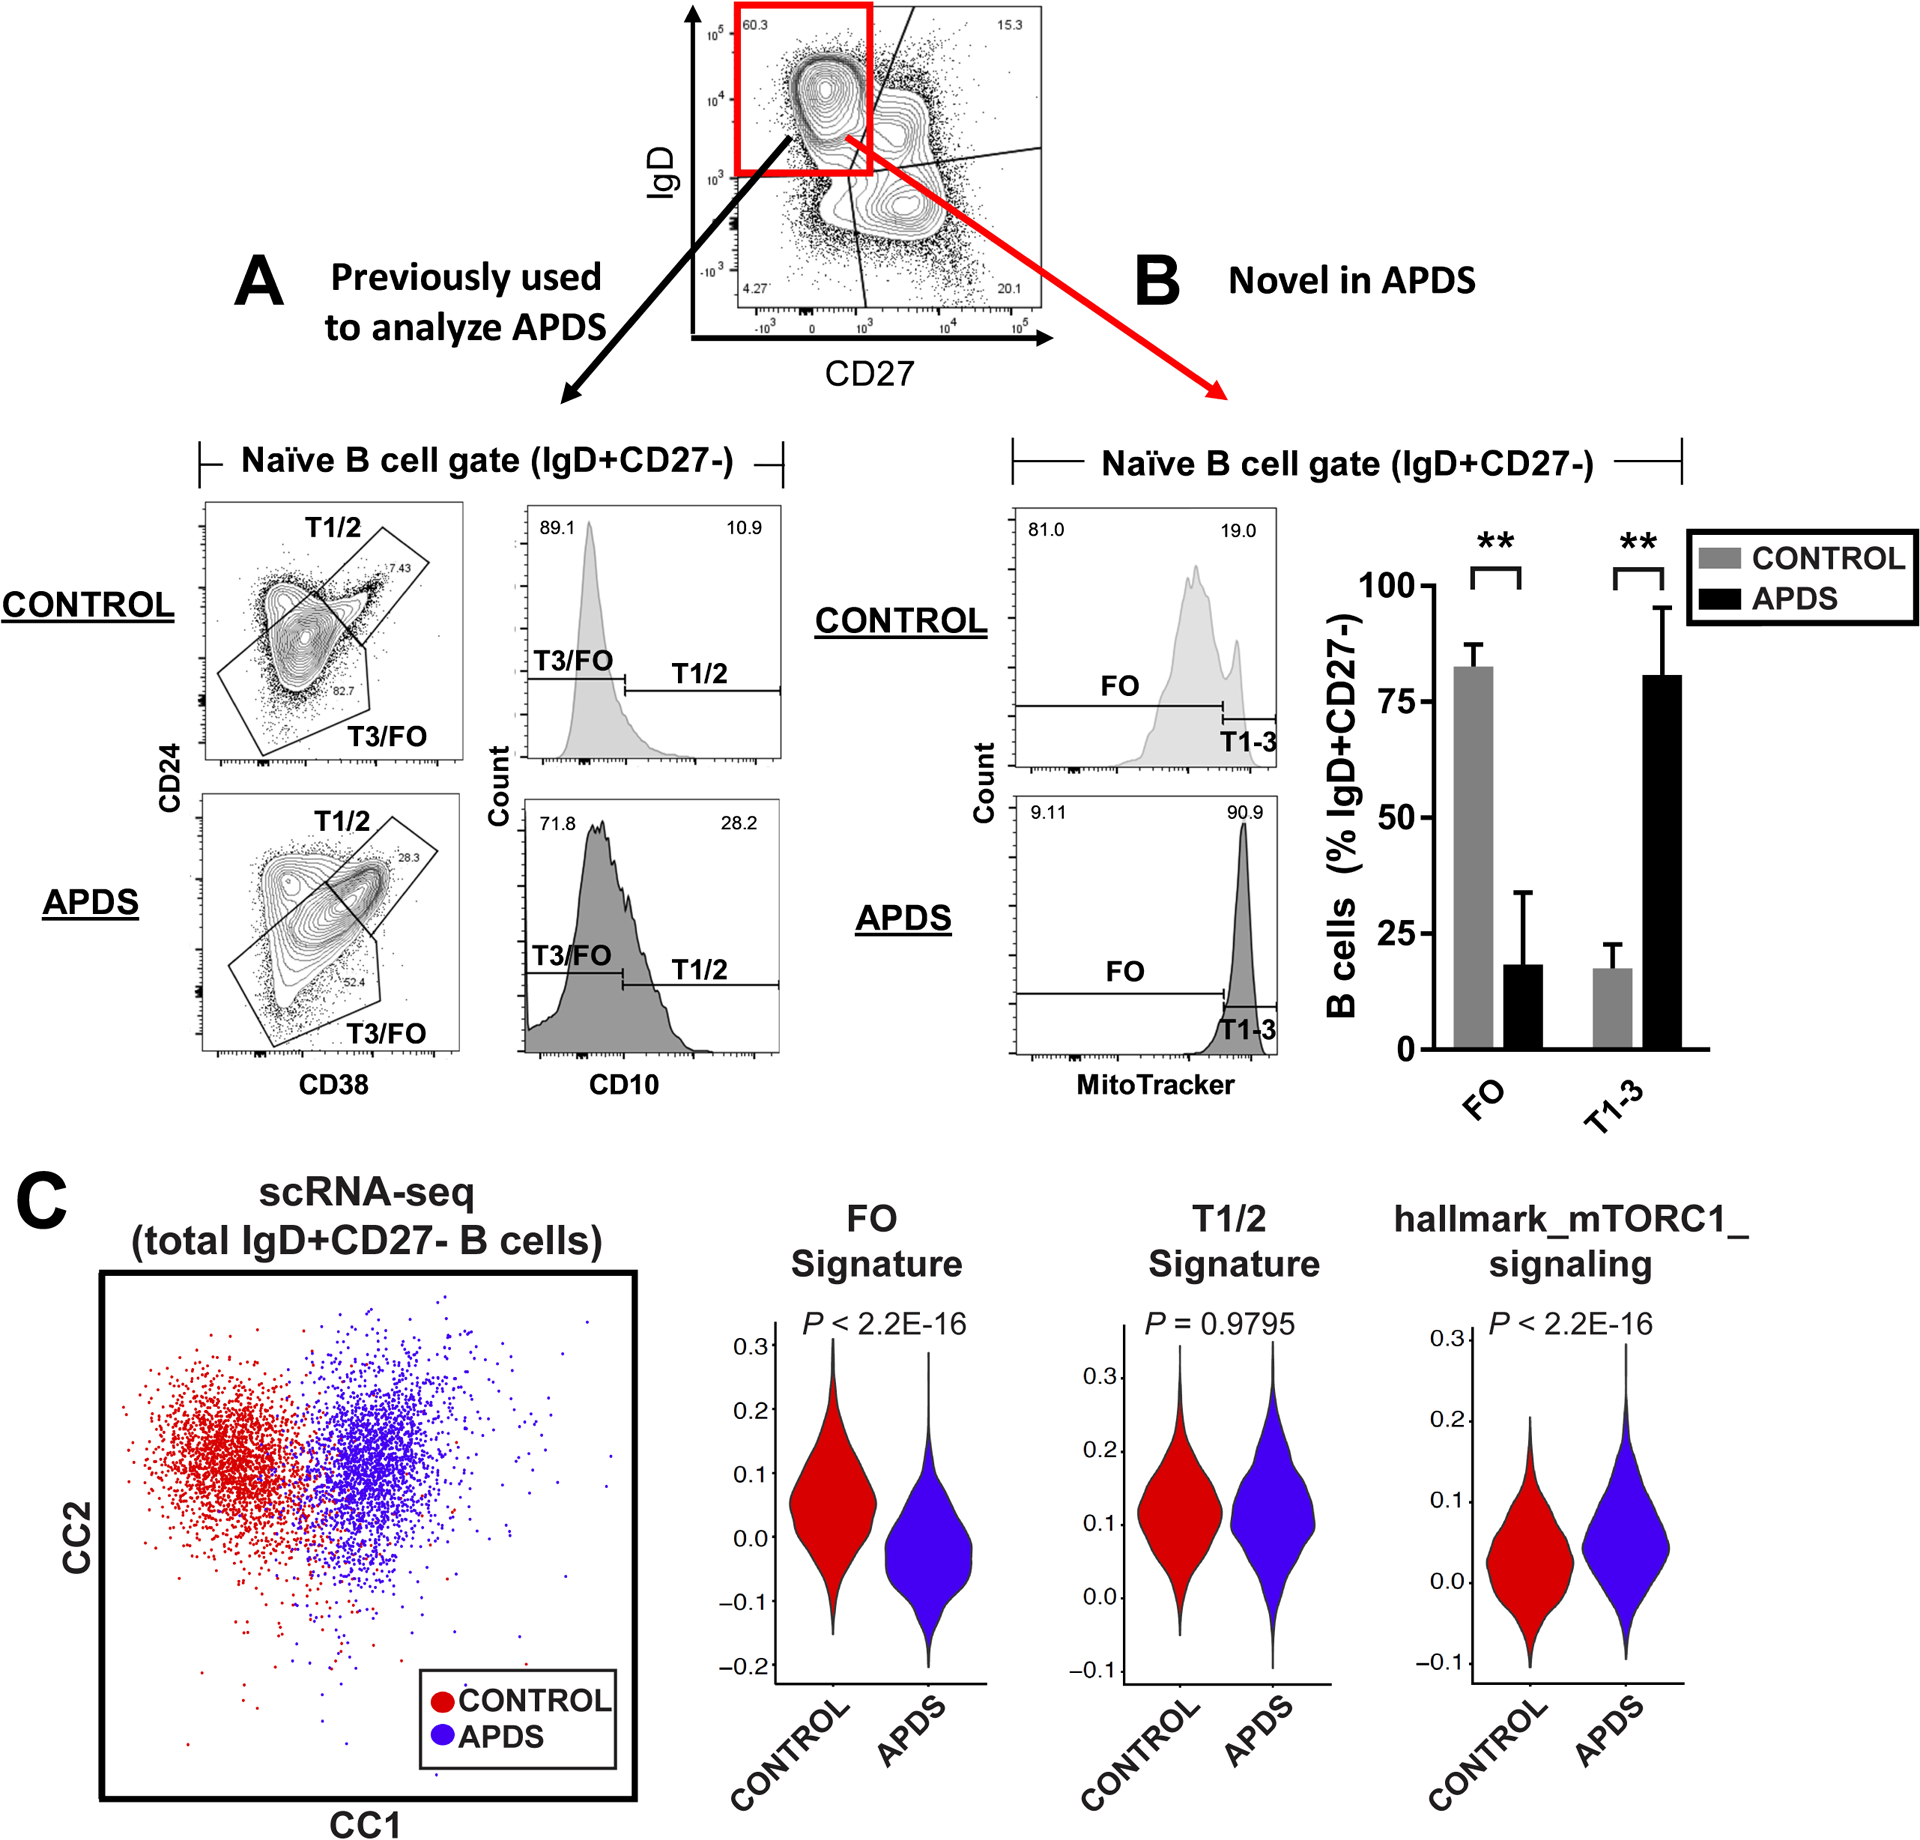
(A and B) Flow cytometry gating strategies for IgD+CD27− T1 to T3 and FO B cell subsets based on CD24, CD38, and CD10 abundance (A) or MitoTracker staining (B) in healthy controls or patients with activating PI3Kδ syndrome (APDS). Plots are representative of at least four biological replicates per group. Quantified data are means +/− SD of all samples. (C) Single-cell RNA sequencing (scRNA-seq) of total IgD+CD27− B cells in healthy controls (red) versus patients with APDS (blue). Cell clustering is shown by canonical correlation analysis (CCA) for two patients with APDS compared to controls (left) and, additionally, by t-SNE for a third patient with APDS compared to controls in fig. S7. Quantified data (right) are FO, T1/2, and mTORC1 signaling module scores shown by violin plot in control (n = 2314 IgD+CD27− B cells) versus APDS (n = 2385 IgD+CD27− B cells). ***P < 0.0001 by unpaired Student’s t test (B) or Wilcoxon rank sum test, as indicated (C).
Acquisition of extracellular adenosine salvage and activation of AMPK mark the transitional to FO B cell switch in humans
Numerous input metabolic pathways regulate the activation of mTORC1, including steady-state amounts of amino acids, oxygen, and free energy (AMP/ATP ratio) (35). To explore potential drivers of mTORC1 inhibition during FO B cell development, we performed metabolite profiling on whole-cell lysates of purified human transitional (T1/2 and T3) and FO B cells using liquid chromatography–tandem mass spectrometry (LC-MS/MS) (Fig. 4A). In keeping with our earlier observation from functional metabolic studies of decreasing glycolytic potential with B cell maturation (Fig. 2B), we found that the tricarboxylic acid (TCA) cycle was the top metabolite pathway enriched in both FO and T3 B cells when compared to T1/2 B cells. Unexpectedly, however, we detected strong increases in key purine metabolism intermediates with B cell maturation. Specifically, inosine monophosphate (IMP) and AMP were the most statistically significantly increased metabolites in FO and T3 B cells, respectively, when compared to T1/2 B cells. Formal pathway analysis further highlighted this enrichment for purine metabolism, which was most evident in FO compared to T1/2 B cells. The identification of IMP (a deamination product of AMP) as the top marker of FO B cells suggested a potential role for adenosine metabolism in transitional to FO B cell development.
Fig. 4. Human FO B cells increase extracellular adenosine salvage and AMPK activation.
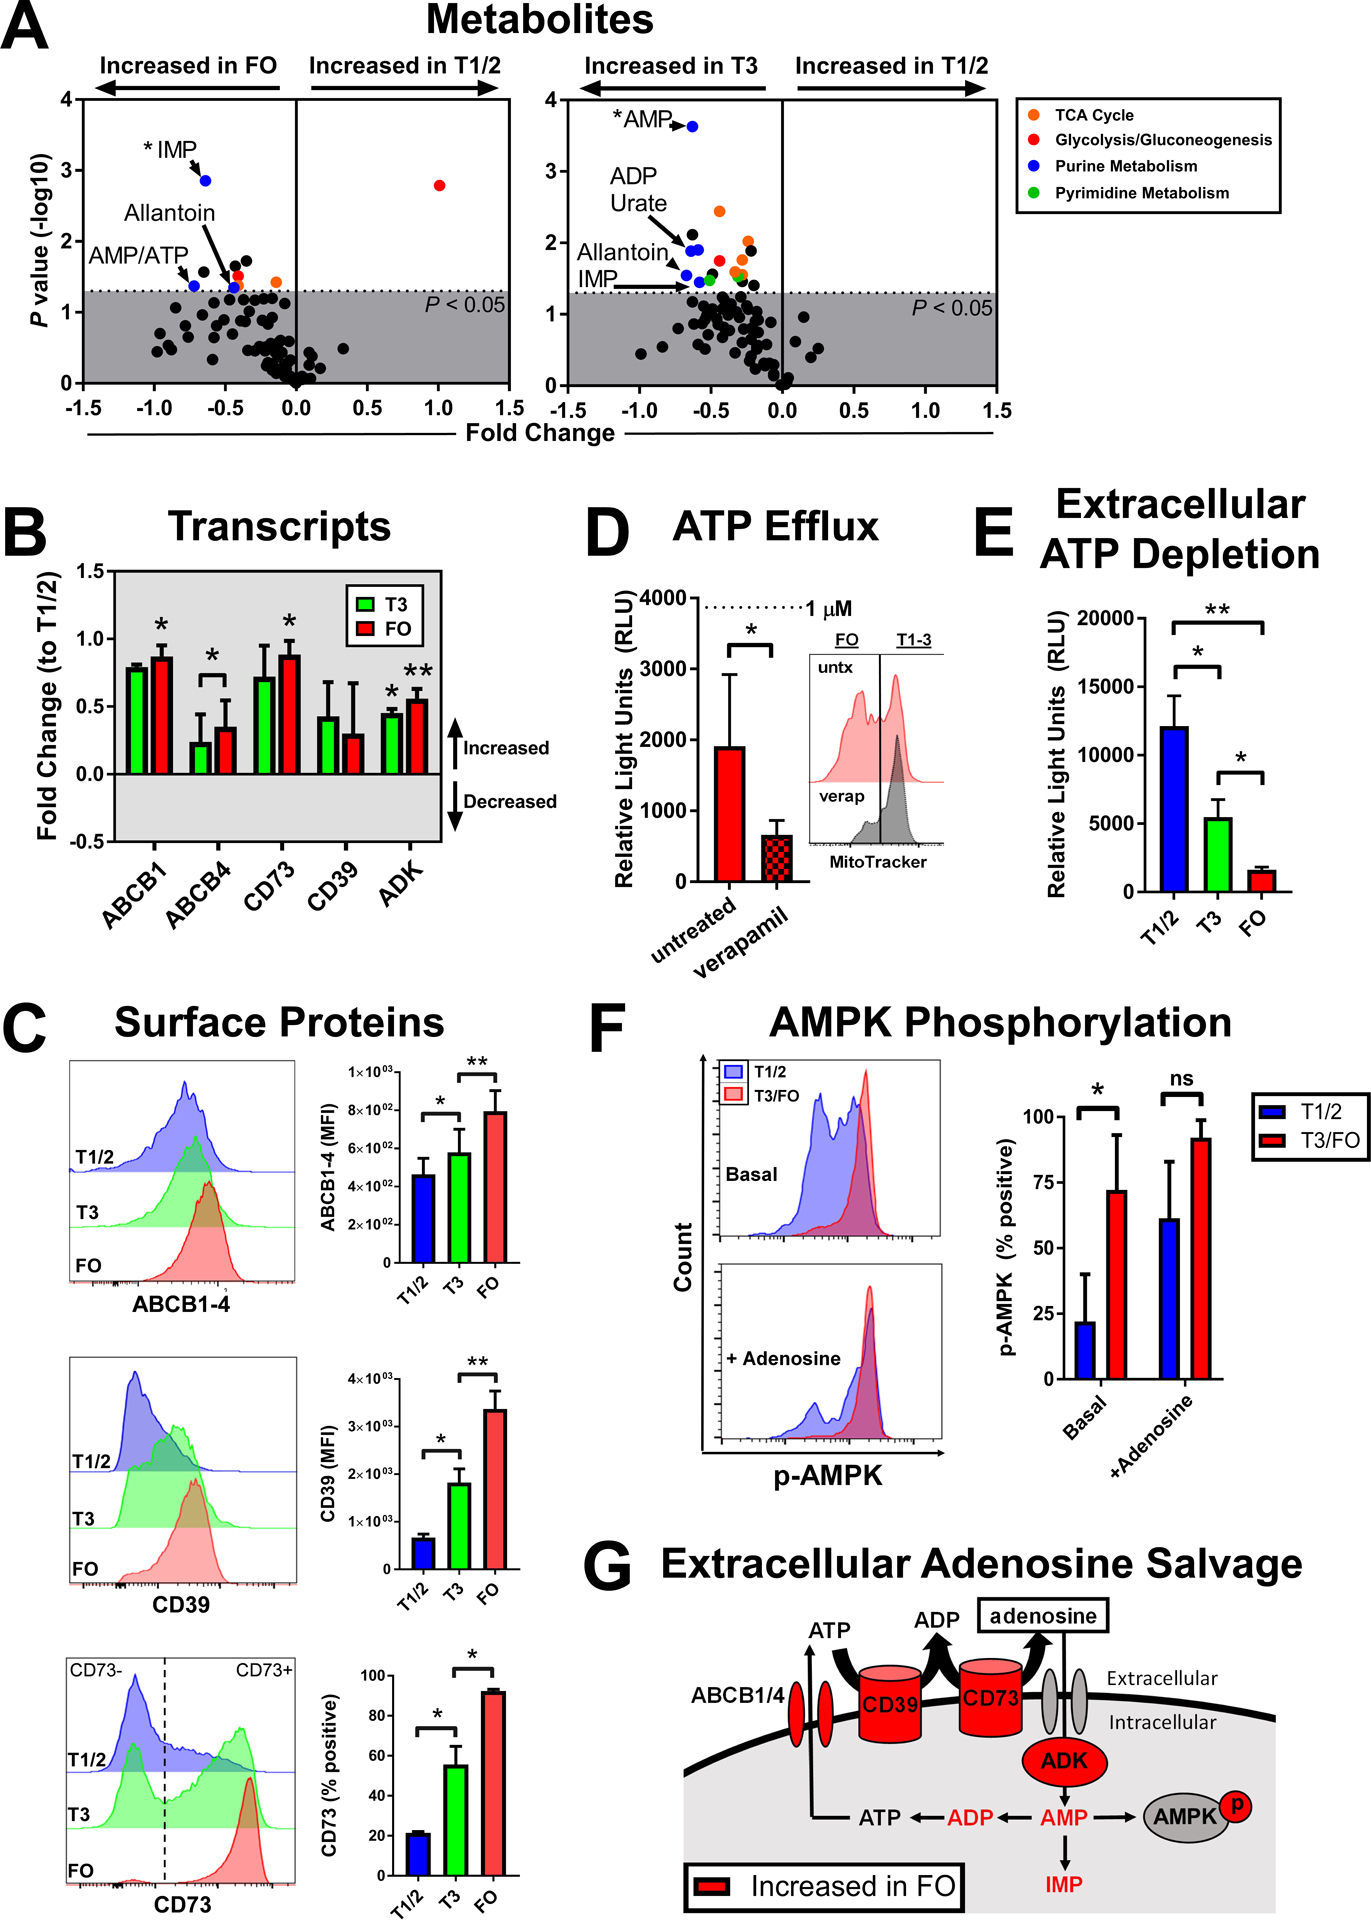
(A) Mass spectrometry analysis of metabolites from sorted T1/2, T3, and FO B cells. Volcano plots of substrates enriched in the indicated pathways (colored) are from four biological replicates. (B) RNA-seq analysis of transcripts involved in extracellular salvage from sorted T1/2, T3, and FO B cells shown as fold change means +/− SD to T1/2 from three biological replicates. (C) Flow cytometry analysis of cell surface proteins involved in extracellular adenosine salvage in T1/2, T3, and FO B cells. Histograms are representative of three biological replicates. Quantified data are means +/− SD of three biological replicates. (D) Luciferase reporter assay of ATP efflux in sorted FO B cells at 1 hour after treatment with the pan-ABC transport inhibitor verapamil as indicated. Histogram of MitoTracker efflux (right) is representative of three biological replicates. Quantified data (left) are means +/− SD from ≥3 biological replicates per group. (E) Luciferase reporter assay of extracellular ATP depletion in sorted T1/2, T3, and FO B cells at 5 hours after ATP treatment. (F) AMPK activation by phospho–flow cytometry amounts in T1/2 versus T3/FO B cells. Histograms (left) are representative of three biological replicates per group. Quantified data (right) are means +/− SD from three biological replicates per group. (G) Schematic of changes in the extracellular adenosine salvage pathway that correlate with B cell maturation to FO (red). *P < 0.05 and **P < 0.005 by FDR-adjusted (A) or paired Student’s t test (B to F). ns, not significant.
To investigate this hypothesis further, we queried our whole-genome expression data and identified increased expression of key extracellular adenosine salvage pathway components in FO B cells when compared to transitional B cells (Fig. 4B). In particular, we observed increased expression of specific ATP-binding cassette (ABC) transporters (ABCB1 and ABCB4), ectonucleotidases (CD73 and CD39), and adenosine kinase (ADK), which mediate extracellular ATP transport (36, 37), breakdown of extracellular ATP to adenosine, and conversion of salvaged adenosine back to AMP, respectively. We confirmed that B cell maturation correlated with increased cell surface amounts of ABCB1–4, CD39, and CD73 (Fig. 4C). Furthermore, we found that ATP efflux was lower in FO B cell cultures treated with the pan-ABC transport inhibitor verapamil (Fig. 4D) (11), consistent with a functional role for ABC transporters in FO B cell ATP export. In addition, depletion of extracellular ATP was more robust in FO compared to transitional B cell cultures (Fig. 4E), which coincided with higher amounts of cell surface ectonucleotidases on FO B cells.
We hypothesized that increased adenosine salvage and a higher AMP/ATP ratio during FO B cell maturation might promote mTORC1 inhibition through activation of the central mTORC1 antagonist, AMPK. Our earlier LC-MS data indicated that the AMP/ATP ratio was increased in FO B cells when compared to T1/2 B cells (Fig. 4A). We directly probed the amounts of pAMPK in T1/2 and FO B cells by phospho–flow cytometry and observed increased basal activation of AMPK in FO B cells, which could be abrogated by exposure to increased amounts of extracellular adenosine (Fig. 4F). Adenosine can alternatively stimulate or inhibit lymphocytes through effects on G protein–coupled receptor (GPCR); however, we did not observe differences in cyclic AMP (cAMP) signaling as measured by phospho–cAMP response element–binding protein (pCREB) amounts in unstimulated or adenosine-treated early transitional (T1/2) compared to FO B cells (fig. S8). Last, similar to other cell types (38), extracellular adenosine was sufficient to block activation of S6, which is an mTORC1 substrate, in transitional T3 and FO B cells (fig. S9). Together, our metabolic, gene expression, flow cytometric, and functional data supported a model whereby the extracellular adenosine salvage pathway is increased at the human transitional to FO B cell juncture, which promoted AMPK activation (Fig. 4G). In contrast, we did not observe any increase in the adenosine salvage pathway components in mouse FO B cells, including direct analysis of surface amounts of CD39 and CD73 by flow cytometry (fig. S10).
AMPK activation can augment human transitional to FO B cell differentiation in vitro
Last, we probed whether increased expression of the adenosine salvage pathway could directly affect transitional to FO B cell maturation. We noted that CD73 was bimodally distributed on transitional T3 B cells (Fig. 4C) and queried whether mTORC1 silencing occurs coincident with CD73 acquisition at the transitional T3 B cell stage by phospho–flow cytometry. We found that, at this stage, there was an increase in basal pS6 amounts in CD73− T3 B cells when compared to CD73+ T3 B cells (Fig. 5A). Next, we asked whether this basal difference in pS6 activation between CD73− versus CD73+ T3 B cells correlated with differential generation of FO B cells in vitro. We sorted transitional (T1/2, T3 CD73−, and T3 CD73+) and FO B cells as control and assayed for FO B cell generation (MitoTraker-CD10−) at only 24 hours in culture to mitigate the need for mitogenic activation to sustain B cell survival in vitro, which differentiates B cells past the FO stage (fig. S11) (39, 40). We observed increased generation of FO B cells from isolated populations of CD73+ compared to CD73− transitional T3 cells (Fig. 5B). To further determine whether FO B cell generation could be augmented before the acquisition of adenosine salvage (at the T1/2 and T3 CD73− stages), we treated with the AMPK agonist, AICAR. AICAR was specifically chosen, given both its stability for extended use in vitro and its lack of dependence on ADK expression for AMPK activation as compared to adenosine (41). We found that FO B cell generation from both T1/2 and T3 CD73− B cell cultures was increased after AICAR treatment (Fig. 5C). Together, these data demonstrated that transitional to FO B cell maturation in vitro correlated with the acquisition of the cell surface ectonucleotidase, CD73, and can be augmented by AMPK activation using AICAR.
Fig. 5. Human transitional to FO B cell differentiation in vitro correlates with acquisition of cell surface CD73 and can be augmented by AMPK agonism.
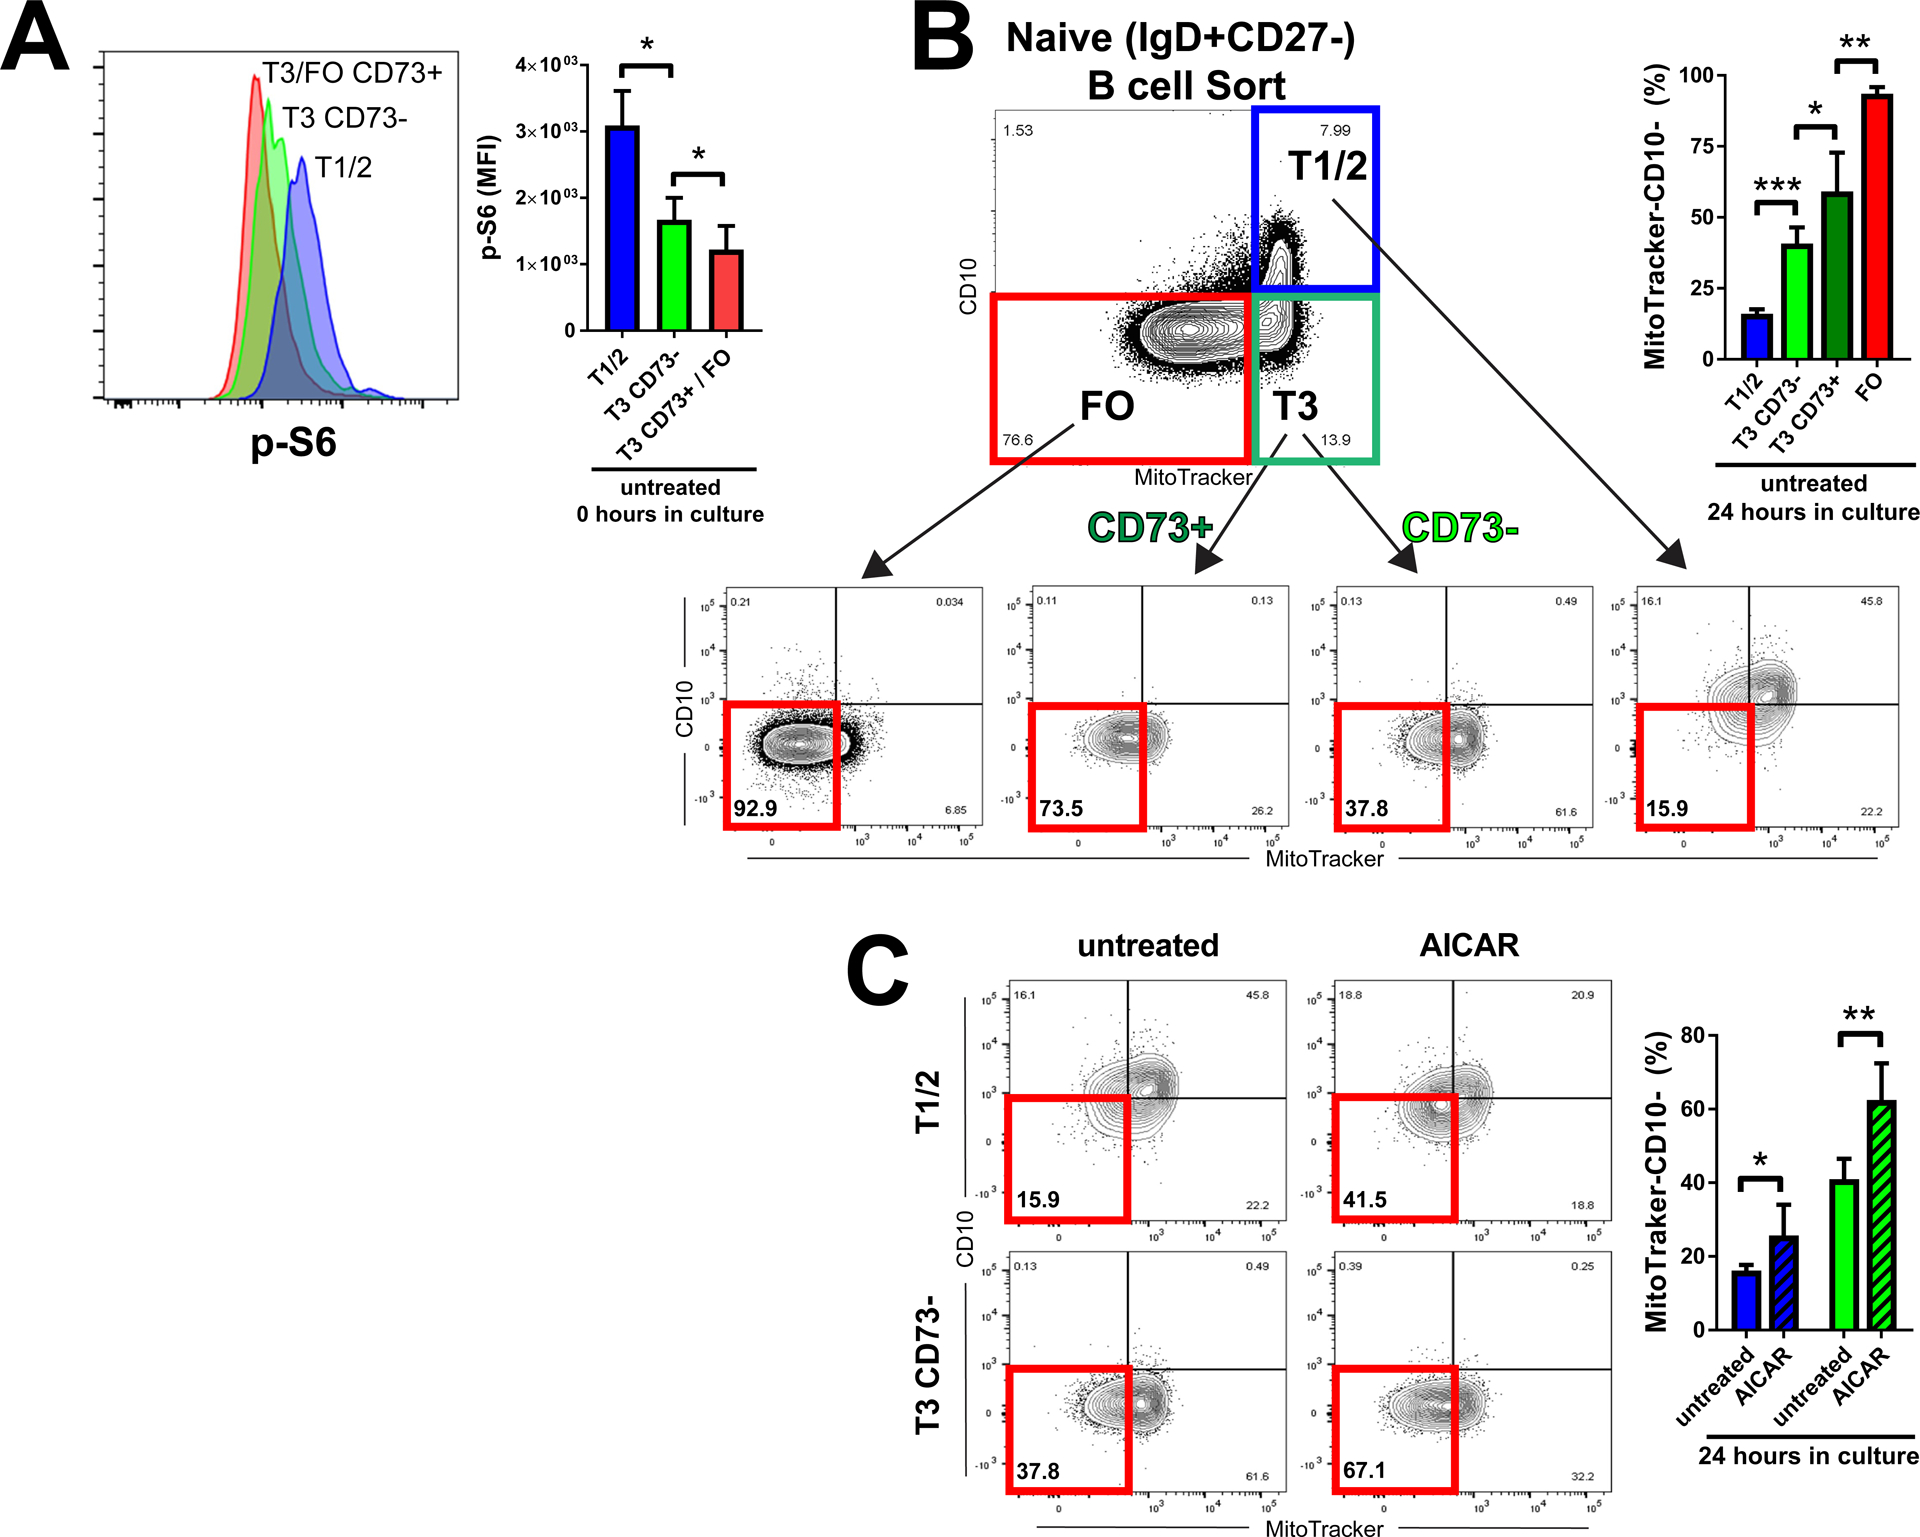
(A) Basal phospho–flow cytometry amounts of pS6 in transitional (T1/2 and T3) and FO B cell subsets, further delineated by cell surface amounts of CD73, as indicated. Histograms (left) are representative of three biological replicates. Quantified data (right) are means +/− SD of three biological replicates. (B and C) In vitro differentiation of sorted transitional (T1/2 and T3) and FO B cell subsets, further delineated by cell surface amounts of CD73, as indicated, and either left untreated (B) or treated with the AMPK agonist, AICAR (C). Differentiation to FO (Mitotracker-CD10−) assessed at 24 hours in culture. Plots (left) are representative of six biological replicates per group. Quantified data (right) are means +/− SD of all data. *P < 0.05, **P < 0.005, and ***P < 0.0001 by unpaired Student’s t test.
DISCUSSION
Our results suggest that the extracellular adenosine salvage pathway is induced at a specific temporal checkpoint during human B cell development, and this is linked to the developmental induction of AMPK activity and the attenuation of mTORC1 signaling at the FO B cell stage (Fig. 6). This metabolic switch may facilitate metabolically active transitional B cells to mature into their quiescent FO B cell successors. Recirculating FO B cells remain quiescent presumably until unique clones recognize epitopes on specific protein antigens in secondary lymphoid organs and are then activated by cognate helper T cells.
Fig. 6. Increased extracellular adenosine salvage and decreased mTORC1 signaling mark the transitional to FO B cell switch in humans.
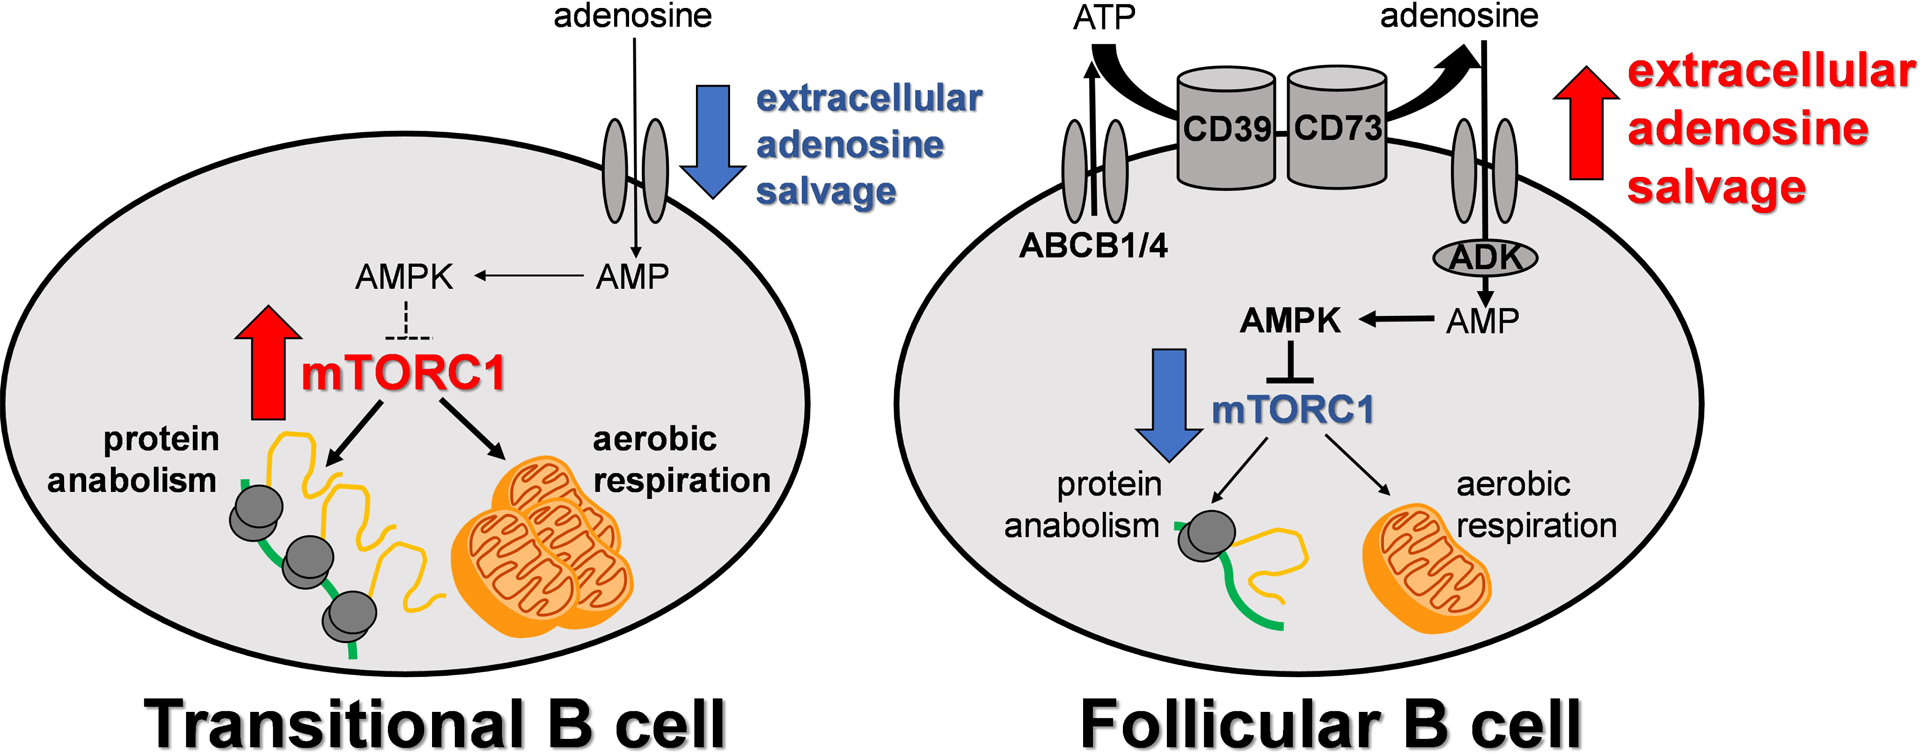
Schematic of maturation-dependent changes in human B cell metabolism.
Using both biased and unbiased molecular approaches, we demonstrated near absence of FO B cells in circulation in patients with gain-of-function germline mutations in PIK3CD. The IgD+CD27− pool is highly heterogeneous, and the identification of naive human FO B cells requires the use of a dye exclusion approach, which distinguishes transitional T3 B cell precursors from FO B cells (10, 11). Patients with gain-of-function PIK3CD mutations have a relative increase in circulating transitional T1/2 B cells (21, 22). We expanded on these reports by identifying a discrete developmental block at the FO B cell stage. We cannot exclude the alternate hypotheses that the absence of FO B cells in circulation in patients with APDS may be driven by alternate B cell trafficking or B cell–extrinsic drivers, including the known preponderance for T cell hyperactivation and early senescence in these patients (21, 32). However, mice with a B lineage–specific E1021K PI3Kδ mutation, which is associated with patients with APDS, have a block in peripheral B cell development at the transitional T1 to FO B cell stage (18). Together, these data support a model where PI3Kδ gain-of-function mutations promote B cell–intrinsic defects in transitional to FO B cell development in both mice and humans. Last, PI3Kδ gain-of-function causes not only increased pS6 activation but also decreased FoxO1 signaling through increased phosphorylation and extra-nuclear sequestering of the transcription factor. FoxO1 promotes B cell development both in the bone marrow and in the germinal center (42, 43). Avery et al. (22) show that patients with APDS have an increase in bone marrow pre-BII and immature B cells, which is consistent with enhanced signaling at the pre–B cell receptor (BCR) checkpoint and possibly earlier. However, Wentink et al. (21) show that APDS mutations do not alter the frequencies of pre-BII and immature bone marrow B cells, though there may be a trend toward an increase in immature B cells. Although these data suggest that B cell development in the bone marrow is normal or increased in patients with APDS, which could be consistent with an increase in transitional B cells in the periphery, they do not explain the notable and specific block in naive FO B cell development that we observed. Moreover, conditional B lineage mTORC1 hyperactivation inhibits transitional to FO B cell development in mice (14–18), which is not recapitulated with conditional B lineage loss of FoxO1, where central B cell maturation is robustly disrupted and transitional B cell counts are decreased in the periphery (44). In addition, we did not observe a notable difference in the expression of genes linked to FoxO signaling between transitional and FO B cells from healthy control humans or mice. Together, these data suggest that downstream of gain-of-function PI3Kδ mutations, increased pS6 activation limits the transitional to FO B cell switch.
Because pS6 activation, which is a downstream effector of mTORC1 signaling, is controlled by many distinct metabolic pathways, we used mass spectrometry as part of an unbiased approach to identify alterations in metabolites that could potentially contribute to transitional B cell maturation into FO B cells. This revealed an unexpected and notable accumulation of purine metabolism intermediates in FO B cells, the most highly enriched of which was IMP, a key component in adenosine biosynthesis. Furthermore, increased extracellular adenosine salvage, as exemplified by increased expression of ABC transporters (B1 and B4), ectonucleotidases (CD39 and CD73), and AMPK activation, correlated with B cell maturation to the FO B cell stage. These maturation-dependent changes favor the processing of extracellular adenosine and import by FO compared to transitional human B cells. However, we did not observe similar changes in the adenosine salvage pathway as measured by surface protein amounts of CD39 and CD73 in FO B cells from mice. These data suggest divergent evolution in the molecular mechanisms that lead to the acquisition of quiescence by FO B cells. In a study mapping similarities in transcriptional coexpression networks between mice and humans, the PI3K network, which includes regulators of mTOR, ranks as a relatively poorly conserved network (45), consistent with the evolutionary divergence of developmental mechanisms in murine and human B cells.
High cell surface amounts of CD39 and CD73 on FoxP3+ T regulatory cells augment the anti-inflammatory function of these cells both in vitro and in vivo (46). In T regulatory cells, extracellular adenosine limits immune cell function by activating GPCRs in an autocrine or paracrine fashion. However, we did not observe changes in the downstream activation of pCREB, which is a target of adenosine-activated GPCRs, by phospho–flow cytometry in FO compared to early transitional (T1/2) B cells. In contrast, consistent with enhanced cellular processing of adenosine by FO B cells, we observed increased intracellular amounts of AMP, ADP, and IMP, and activation of AMPK, which was abrogated upon treatment with surplus extracellular adenosine. Together, these data suggest that increased extracellular adenosine salvage at the FO B cell stage may drive increased basal activation of the mTORC1 inhibitor, AMPK. Last, we found that human transitional to FO B cell differentiation in vitro correlated with surface amounts of CD73 and could be augmented by treatment with the AMPK agonist, AICAR. Together, our data suggest that increased adenosine salvage promotes AMPK activation, which can limit transitional to FO B cell development in humans.
Our data suggest that acquisition of metabolic quiescence is crucial during early antigen-independent B cell development, specifically in humans. Similar to our own results, linking extracellular adenosine salvage to FO B cell maturation in humans, patients with a 5’ ectonucleotidases (CD73) activity defect in lymphocytes exhibit hypogammaglobulinemia (47, 48). In addition, CD73 has a role in B cell antibody class switching, because naive CD73+ compared to CD73− B cells undergo more efficient isotype switching (49). Our studies suggest that these naive CD73+ cells are late transitional T3 and FO B cells because we have more tightly defined them in this study. Last, patients with APDS treated for 12 weeks with the selective oral PI3Kδ inhibitor, leniolisib, normalize both transitional and naive B cell counts (50). Direct mTORC1 inhibition using rapamycin can also ameliorate T cell hyperactivation in patients with APDS (19). It is yet unclear whether mTORC1 inhibition or AMPK activation could provide alternative therapeutic strategies for restoring FO B cells in patients with APDS. As more detailed studies are undertaken of human B cells in health and disease, a strong case can be made for viewing B cell development and activation through the lens of cellular metabolism.
MATERIALS AND METHODS
Recruitment of patients with APDS and mutation analysis
This research was performed in accordance with the Partners Institutional Review Board (protocol no. 2011P000940 and no. 2018P001584). Written informed consent for specimen collection was obtained from all patients included in this study. PIK3CD mutations were initially identified on next-generation sequencing and confirmed by Sanger sequencing using primers PIK3CD_3_4F/R and PIK3CD_23F/R and polymerase chain reaction (PCR) conditions as previously described (19).
Human flow cytometry and cell sorting
Distinction between transitional and FO human B cells was accomplished using ABC transporter efflux profiling as previously described (10, 11). Fresh or frozen peripheral blood mononuclear cells (PBMCs) were incubated in RPMI 1640 media containing MitoTracker Green (MTG) (Thermo Fisher Scientific) at 100-nM concentration for 30 min at 37°C. Subsequently, cells were spun down at 1200 rpm for 6 min and rested in fresh RPMI 1640 media for an additional 30 min at 37°C to allow efflux of the dye in ABC+ cells. In a subset of experiments, ABC transporters were inhibited and efflux was prevented by the addition of 12.5 to 25 μM verapamil (Sigma-Aldrich). In all subsequent steps, cells were incubated in 1× phosphate-buffered saline (PBS) containing 1% bovine serum albumin at 4°C. Cells were blocked for 15 min with human Fc block (BD Biosciences) at a concentration of 2.5 μg per 1 million cells. Cells were surface-stained with optimized concentrations of fluorochrome-conjugated primary antibodies for 30 min. “Naive” B cell panel was as follows: CD3 (HIT3a, BioLegend), CD19 (SJ25C1, BioLegend), CD27 (M-T271, BD Biosciences), IgD (IA6–2, BioLegend), CD38 (HIT2, BD Biosciences), CD24 (ML5, BioLegend), CD10 (HI10a, BioLegend), CD45RB (MEM-55, Thermo Fisher Scientific), and CD21 (B-ly4, BD Biosciences). A subset of experiments required the addition of CD39 (A1, BioLegend), CD73 (AD2, BioLegend), or ABCB1–4 (UIC2, Thermo Fisher Scientific) to this panel. To minimize the interaction of polymeric dyes and improve discrete fluorochrome readout, Brilliant Stain Buffer (BD Biosciences) was included at 50 μl per condition during surface staining. 7-Aminoactinomycin D (Thermo Fisher Scientific) was used to exclude dead cells as per the manufacturer’s instructions. Compensation was performed using VersaComp Antibody Capture Beads (Beckman Coulter) apart from MTG, which required staining of Ramos cells [American Type Culture Collection (ATCC)] with MTG for ≥30 min at 37°C. For analysis, B cells were run on a five-laser LSR Fortessa (BD Biosciences). For sorting, B cells were run on a Special Order Research Products Aria II (BD Biosciences) and collected in RMPI 1640 media supplemented with 20% fetal bovine serum (FBS).
Mouse flow cytometry and cell sorting
Eight-week-old C57BL/6 mice were used for analysis. Cells from total spleen were dispersed by mechanical force. Resulting single-cell suspension was filtered through a 70-mm nylon mesh. Red blood cells were lysed using Ammonium-Chloride-Potassium lysing buffer (Lonza) at 1 ml per spleen for an incubation of 1 min on ice. In all subsequent steps, cells were incubated in 1× PBS containing 1% bovine serum albumin at 4°C and processed similar to the human cells as described above with the following exceptions. Fc block was anti-mouse (BD Biosciences). Primary antibody panel was as follows: CD3 (145–2C11, BD Biosciences), CD19 (1D3, BD Biosciences), CD11b (M1/70, BD Biosciences), CD21 (7G6, BD Biosciences), CD45R (RA3–6B2, Invitrogen), IgM (II/41, BD Biosciences), CD23 (B3B4, BioLegend), IgD (11026C.2a, BioLegend), and CD93 (AA4–1, BD Biosciences). A subset of experiments required the addition of CD39 (DUHA59) and CD73 (TY/118, BioLegend) to this panel.
Phospho–flow cytometry
Basal pS6 and peIF4G amounts (Fig. 2C) were analyzed from fresh healthy donor human PBMCs. Analysis of pAMPK (Fig. 4F), pCREB (fig. S8), and pS6 (fig. S9) amounts in response to isolated B cell treatment required that fresh healthy donor human PBMCs first be sorted to IgD+CD27− B cells (for pAMPK and pCREB analysis; in which T1/2 versus T3/FO were compared) or T1/2, T3, and FO IgD+CD27− B cells (for pS6 analysis; in which T1/2, T3, and FO were compared) using the protocol detailed above. Cells were rested at 37°C for ≥4 hours in RPMI 1640 media supplemented with penicillin/streptomycin (100 U/ml), 2 mM l-glutamine, and 10% FBS. In a subset of experiments, cells were incubated for 60 min in adenosine (0.1 to 1 mM, Sigma-Aldrich) or rapamycin (100 ng/ml, Calbiochem). In all experiments, viability was assayed before permeabilization using LIVE/DEAD (Invitrogen) fixable stain according to the manufacturer’s instruction. Cells were fixed for 5 to 10 min at room temperature in 4% paraformaldehyde fixation buffer (BioLegend). Cells were permeabilized for 30 min at 4°C in PhosFlow Perm Buffer III (BD Biosciences). In all subsequent steps, cells were incubated in 1× PBS containing 1% bovine serum albumin at 4°C. Cells were blocked for 15 min with human Fc block (BD Biosciences) at a concentration of 2.5 μg per 1 million cells. Cells were stained with optimized concentrations of fluorochrome-conjugated primary antibodies for 30 min [the asterisk (*) indicates usage in the basal experiment only]: CD3* (HIT3a, BioLegend), CD19* (SJ25C1, BioLegend), CD27* (M-T271, BD Biosciences), IgD* (IA6–2, BioLegend), CD38 (HIT2, BD Biosciences), CD24 (ML5, BioLegend), CD10 (HI10a, BioLegend), CD45RB (MEM-55, Thermo Fisher Scientific), and CD21 (B-ly4, BD Biosciences), with the addition of pS6 Ser235/236 (rabbit polyclonal, Cell Signaling Technology or monoclonal cupk43k, Thermo Fisher Scientific), peIF4G Ser1108 (unconjugated rabbit polyclonal, Cell Signaling Technology), pAMPK α1 Thr183 or α2 Thr172 (unconjugated rabbit polyclonal, Abcam), or pCREB Ser133 (87G3, Cell Signaling Technology). For pAMPK and peIF4G staining, cells required an additional 30-min incubation in goat anti-rabbit AF488-conjugated secondary (Thermo Fisher Scientific). To minimize the interaction of polymeric dyes and improve discrete fluorochrome readout, we included Brilliant Stain Buffer (BD Biosciences) at 50 μl per condition during staining. Compensation was performed using VersaComp antibody capture beads (mouse species, Beckman Coulter) or protein G antibody binding beads (rabbit and goat species, Bang Laboratories). For analysis, B cells were run on a five-laser LSR Fortessa (BD Biosciences). Of note, MitoTracker is not retained in B cells after fixation and permeabilization; therefore, all phospho–flow cytometry experiments had to rely on the classical gating strategy using CD38, CD24, and CD10 within the naive (IgD+CD27−) B cell gate despite the loss of resolution between transitional T3 and FO B cells.
B cell metabolism by flow cytometry
Fresh healthy donor human PBMCs were incubated with CellROX (Thermo Fisher Scientific), NAO (Thermo Fisher Scientific), or 2-NBDG (Carbosynth) according to the manufacturer’s specifications. For all three conditions, cells were stained during the efflux incubation for MitoTracker and otherwise prepared for flow cytometry using the protocol detailed above with a few exceptions. 2-NBDG and NAO panels required substitution of MitoTracker Orange (Thermo Fisher Scientific). The fluorochrome-conjugated primary antibody panel was as follows: CD3 (HIT3a, BioLegend), CD19 (SJ25C1, BioLegend), CD27 (M-T271, BD Biosciences), IgD (IA6–2, BioLegend), and CD10 (HI10a, BioLegend). Compensation for the functional dyes required the use of Ramos cells (ATCC), incubated with CellROX, 2-NBDG, or NAO, respectively.
B cell metabolism by Seahorse
Fresh healthy donor human leukopacks were sorted to populations of transitional (T1–3: CD3−CD19+IgD+CD27−MTG+) and FO (CD3−CD19+IgD+CD27−CD10-MTG−) B cells. T1 to T3 and FO subsets were loaded as technical replicates for Seahorse analysis at the recommended density of 1 million cells per well. Cells were resuspended in Seahorse medium supplemented with 11 mM glucose and 2 mM pyruvate with pH adjusted to 7.4. Cells were settled on a 96-well assay plate (Seahorse Bioscience) coated with poly-lysine (Sigma-Aldrich). Oxygen consumption rate (OCR) was recorded with the XF96 Extracellular Flux Analyzer. Chemicals used were as follows: 3 μM oligomycin A (Sigma-Aldrich), 5 μM FCCP (Sigma-Aldrich), and 5 μM rotenone (Sigma-Aldrich). Resting extracellular acidification rate (ECAR) from the same assay was plotted.
Mass spectrometry
Fresh healthy donor human leukopacks were sorted to populations of transitional and FO B cell subsets (T1/2, CD3−CD19+IgD+CD27−CD10+MTG+CD24hiCD38hi; T3, CD3−CD19+IgD+CD27−CD10−MTG+CD24loCD38loCD21+CD45RB−; and FO, CD3−CD19+IgD+CD27−CD10−MTG−CD24loCD38lo). Half a million to 1 million T1/2, T3, or FO B cells were rested at 37°C for ≥4 hours in RPMI 1640 media supplemented with penicillin/streptomycin (100 U/ml), 2 mM l-glutamine, and 10% FBS to recover from the sort under physiologic concentrations of glucose (10 mM), washed twice in 1× PBS, and then collected as cell pellets and flash-frozen for subsequent batch analysis. Metabolites were analyzed using LC-MS/MS. Metabolites were extracted using acetonitrile and methanol before separation on a 100 mm by 2.1 mm XBridge Amide column (Waters Corporation, Milford, MA) and analyzed using multiple reaction monitoring in the negative ion mode on an Agilent 6490 Triple Quadrupole mass spectrometer for unambiguous identification. Collectively, 77 endogenous, central metabolites including sugars, sugar phosphates, organic acids, purine, and pyrimidines were measured for comparative analyses. MassHunter Quantitative Analysis software (Agilent) was used for peak integration and manual review of peak quality in a blinded manner before statistical analysis. Peak areas were normalized to an internal standard (l-phenylalanine-d8), and a pooled sample was run after every seven test samples to ensure quality control. Using pooled samples, the mean coefficient of variation for the 77 measured metabolites was 15.1%. Comparisons between T1/2, T3, and FO populations were analyzed using P values from Student’s t tests. Pathway enrichment analysis was performed using Ingenuity Pathway Analysis software build 430520 M (Qiagen, Hilden, Germany).
Extracellular ATP quantification
Fresh healthy donor human PBMCs were sorted to B cell subsets: T1/2 (CD3−CD19+IgD+CD27−CD10+MTG+CD24hiCD38hi), T3 (CD3−CD19+IgD+CD27−CD10−MTG+CD24loCD38loCD21+CD45RB−), or FO (CD3−CD19+IgD+CD27−CD10−MTG−CD24loCD38lo). For the ATP efflux assay, sorted FO B cells were plated in biological triplicate at 30,000 cells/well in 96-well plate in 100 μl of RPMI 1640 media supplemented with penicillin/streptomycin (100 U/ml), 2 mM l-glutamine, and 10% FBS. Cells were treated or not with verapamil (12.5 to 25 μM), and ATP was assayed in 10 μl of culture media at 1 hour. For the ATP depletion assay, sorted T1/2, T3, and FO B cells were plated in biological triplicate at 20,000 cells/well in 96-well plate in 100 μl of RPMI 1640 media supplemented with penicillin/streptomycin (100 U/ml), 2 mM l-glutamine, and 10% FBS. Cells were treated or not with ATP (20 μM), and ATP was assayed in 10 μl of culture media at 5 hours. For both analyses, ATP was quantitated by luciferase assay (ATP Determination Kit, Thermo Fisher Scientific) according to the manufacturer’s specifications.
B cell differentiation in vitro
Fresh healthy donor human leukopacks were sorted to B cell subsets: T1/2 (CD3−CD19+IgD+CD27−CD10+MTG+CD24hiCD38hi), T3 CD73+/− (CD3−CD19+IgD+CD27−CD10−MTG+CD24loCD38loCD21+CD45RB−), or FO (CD3-CD19+IgD+CD27−CD10−MTG−CD24loCD38lo). Cells were plated as biological replicates in RPMI 1640 media supplemented with penicillin/streptomycin (100 U/ml), 2 mM l-glutamine, and 10% FBS. In a subset of experiments, 1 mM AICAR (Sigma-Aldrich) was added to the media. Cells were assayed for differentiation to FO at 24 hours in culture by flow cytometry as outlined above using MitoTracker staining in conjunction with the following primary antibody panel: CD38 (HIT2, BD Biosciences), CD24 (ML5, BioLegend), CD10 (HI10a, BioLegend), CD45RB (MEM-55, Thermo Fisher), and CD21 (B-ly4, BD Biosciences).
Mutant M61V analysis
Phospho–flow cytometry was performed on three separate occasions using 5 million fresh PBMCs from the patient with M61V mutation versus control as described above for phospho-S6 flow cytometry with the addition of a 5- to 10-min incubation step at 37°C for B cell receptor cross-linking using F(ab’)2 anti-IgM (10 μg/ml; Southern Biotechnology Associates) and the addition of pAKT Ser473 (M89–61, BD Biosciences) to the primary fluorophore-conjugated antibody panel.
Calcium flux assay using Fluo-8 dye (Abcam) was performed on three separate occasions according to the manufacturer’s instructions. Five million fresh or frozen PBMCs from the patient with M61V mutation versus control were prepared for flow cytometry as described above using a limited fluorophore-conjugated primary antibody panel intended to gate on total B cells: CD3 (HIT3a, BioLegend) and CD19 (SJ25C1, BioLegend). Subsequent to this staining at room temperature, cells were washed once in 1× Hanks’ balanced salt solution with 20 mM Hepes buffer (pH 7.0) and directly resuspended in the assay buffer containing Fluo-8 for 30 min at 37°C. Cells were analyzed directly on a four-laser LSR Fortessa (BD Biosciences). Fluorescence was recorded in the 530/30 channel at baseline for 1 min, after B cell receptor cross-linking with F(ab’)2 anti-IgM (10 μg/ml; Southern Biotechnology Associates) for 5 min, and after nonspecific activation with ionomycin (Sigma-Aldrich) for 5 min.
Creation of the mutant M61V construct was as follows: The cloning vector pSBbi-GP (Addgene no. 60511) was linearized by PCR using Q5 HiFi 2X Master Mix [New England Biolabs (NEB)] and primers #11 and #12 (table S3). The expression vector pBSFIp110δ (Addgene no. 34893) was linearized by PCR using Q5 HiFi 2X Master Mix (NEB) and primers #1 and #2 (WT), #3 to #6 (E1021K), and #7 to #10 (M61V), respectively (table S3). The resulting PCR fragments were gel-purified using Qiagen’s Gel Extraction Kit (no. 28704) and subsequently ligated using the HiFi DNA Assembly Cloning Kit (NEB #E5520). The resulting plasmids (pSBbi-GP, pSBbi-GP-WT, pSBbi-GP-E1021K, and pSBbi-GP-M61V) were electroporated in combination with the SB100 transposase (Addgene #34879) at 1:10 molar ratio in biological triplicate into Ramos cells using the Neon Transfection System (Thermo Fisher Scientific). Efficiency was checked by green fluorescent protein (GFP) expression at 24 hours after transfection and was >80% in all conditions. Cells were selected in puromycin (1 μg/ml) and otherwise cultured in RPMI 1640 media supplemented with penicillin/streptomycin (100 U/ml), 2 mM l-glutamine, and 10% FBS. At >95% purity by GFP expression, 1 million Ramos cells per condition were stimulated or not with F(ab’)2 anti-IgM (10 μg/ml; Southern Biotechnology Associates) for 5 and 20 min at 37°C and harvested in 1× SDS loading buffer. Cell lysates were denatured for 5 min at 90°C, separated on 10% reducing SDS-polyacrylamide gels, transferred to polyvinylidene difluoride membranes, blocked for 1 hour with Odyssey Blocking Buffer (LI-COR Biosciences), and immunoblotted overnight in primary antibodies at 1:250 dilutions in Odyssey Blocking Buffer as follows: PI3Kδ (29/PI3 Kinase, BD Biosciences), pAKT Ser473 (D9E, Cell Signaling Technology), pS6 Ser235/236 (D57.2.2E, Cell Signaling Technology), AKT (281046, R&D Systems), and glyceraldehyde-3-phosphate dehydrogenase (Poly6314, BioLegend). Blots were washed for 10 min (×4) in 1× PBS containing 1% Tween 20 (PBS-T) and incubated at room temperature in the appropriate anti-mouse or anti-rabbit secondary antibodies at 1:10,000 dilutions in 1× PBS-T (IRDye, LI-COR Biosciences). Blots were washed for 10 min (×4) in 1× PBS-T and immediately visualized on an Odyssey CLx (LI-COR Biosciences).
Bulk RNA-seq
Total RNA was isolated from flow cytometry–sorted cells using the RNeasy plus Micro Kit (Qiagen). RNA-seq libraries were prepared as previously described (51). Briefly, whole transcriptome amplification and tagmentation-based library preparation were performed using the SMART-Seq2 protocol, followed by 35–base pair (bp) paired-end sequencing on a NextSeq 500 instrument (Illumina). Five million to 10 million reads were obtained from each sample and reads were analyzed as detailed below. The data discussed in this publication were deposited in the National Center for Biotechnology Information’s Gene Expression Omnibus (GEO) with accessibility through GEO series accession no. GSE138729.
scRNA-seq with Seq-well
We used the Seq-Well platform for massively parallel scRNA-seq to capture transcriptomes of single cells on barcoded mRNA capture beads. A comprehensive description of the implementation of this platform is available (52). In brief, 20,000 IgD+CD27− fresh or frozen B cells from patients with APDS or healthy controls were sorted and then loaded onto a single array containing barcoded mRNA capture beads (ChemGenes). The arrays were sealed with a polycarbonate membrane (pore size of 0.01 μm), cells were lysed, transcript was hybridized, and the barcoded mRNA capture beads were recovered and pooled for all subsequent steps. Reverse transcription was performed using Maxima H Minus Reverse Transcriptase (Thermo Fisher Scientific EP0753). Exonuclease I treatment (NEB M0293 L) was used to remove excess primers. Second strand synthesis was performed on two patients with APDS and corresponding control samples using a primer of eight random bases to create complementary cDNA strands with SMART handles for PCR amplification. Samples from a third patient with APDS and a control were analyzed using scRNA-seq without an amplification step. Whole transcriptome amplification was carried out using KAPA HiFi PCR Mastermix (Kapa Biosystems KK2602) with 2000 beads per 50-μl reaction volume. Libraries were then pooled in sets of eight (totaling 16,000 beads) and purified using Agencourt AMPure XP beads (Beckman Coulter, A63881) by a 0.6× solid phase reversible immobilization (SPRI) followed by a 0.8× SPRI and quantified using Qubit hsDNA Assay (Thermo Fisher Scientific Q32854). The quality of whole transcriptome amplification (WTA) product was assessed using the Agilent High Sensitivity D5000 Screen Tape System (Agilent Genomics) with an expected peak >800 bp tailing off to beyond 3000 bp and a small/nonexistent primer peak, indicating a successful preparation. Libraries were constructed using the Nextera XT DNA tagmentation method (Illumina FC-131–1096) on a total of 750 pg of pooled cDNA library from 16,000 recovered beads using index primers with format as previously described (52). Tagmented and amplified sequences were purified at a 0.8× SPRI ratio yielding library sizes with an average distribution of 500 to 750 bp in length as determined using the Agilent High Sensitivity D1000 Screen Tape System (Agilent Genomics). Two arrays were sequenced per sequencing run with an Illumina 75 Cycle NextSeq500/550v2 kit (Illumina FC-404–2005) at a final concentration of 2.4 pM. The read structure was paired end with Read 1 starting from a custom Read 1 primer containing 20 bases with a 12-bp cell barcode and 8-bp unique molecular identifier (UMI) and Read 2 containing 50 bases of transcript sequence.
Computational RNA-seq pipelines
For bulk RNA-seq, we aligned raw reads to the University of California, Santa Cruz hg38 reference transcriptome and performed transcript quantification using RSEM v1.25.0. Refseq gene annotations were used. Gene expression level was calculated by normalizing read counts to the library size. DEGs between any two cell types were identified using empirical Bayes hierarchical modeling [EBSeq package in R (53)], and the union of all subsets of DEGs was performed for further analysis. We used the findGO.pl module in Homer (54) to perform functional enrichment test and used a false discovery rate (FDR)–adjusted P value <0.01 to define statistical significance.
For scRNA-seq, computational pipelines and analysis read alignment were performed as previously described (55). Briefly, for each NextSeq sequencing run, raw sequencing data were converted to demultiplexed FastQ files using bcl2fastq2 based on Nextera N700 indices corresponding to individual samples/arrays. Reads were then aligned to hg19 genome using the Galaxy portal maintained by the Broad Institute for Drop-seq Alignment using standard settings. Individual reads were tagged according to the 12-bp barcode sequenced and the 8-bp UMI contained in Read 1 of each fragment. After alignment, reads were binned onto 12-bp cell barcodes and collapsed by their 8-bp UMI. APDS datasets were integrated by the method used for second strand synthesis as described above. Integrated APDS datasets (n = 2) were analyzed and compared to controls using CCA to control for technical variation across frozen and fresh samples and identify common sources of variation. Cells with fewer than 400 genes or 750 UMIs were filtered from the dataset. Remaining cells had a median count of 1039 genes and 2068 UMIs. Seurat’s diagonal implementation of CCA was used to calculate the first 20 CC dimensions (34), and Seurat’s FindModuleScore function was used to calculate scores for T1/2, FO, and hallmark_mTORC1_signaling. T1/2 and FO gene sets were derived from genes defined using differential expression on bulk RNA-seq of B cell subsets. Seurat’s FindConservedMarkers function was used to derive a table of DEGs using a Wilcoxon rank sum test. The unintegrated APDS dataset (n = 1) was analyzed and compared to controls using t-SNE for dimensionality reduction and graph-based clustering. UMI-collapsed data were used as the input into Seurat (56). The JackStraw function in Seurat was used to determine the first four statistically significant principal components to be used in further analysis, including finding clusters and running t-SNE. We used the default parameters in Seurat because they matched well with our data size. Average read count per cell across all arrays was 36,928 reads per cell. The gene cutoffs used were 450 genes per cell with gene expression required in at least 10 cells.
Statistical methods
Statistical analysis was conducted using GraphPad Prism version 7.01.
Supplementary Material
Acknowledgments:
We thank R. Saff for her contribution to patient recruitment and the entire tissue processing core at the Ragon Institute for their outstanding efforts, specifically M. Baladiang and Z. Racenet.
Funding:
S.P. was supported by the National Institutes of Health (NIH) (U19-AI110495) and the Ragon Institute Strategic Initiative. J.R.F. and S.B. were supported by the NIH (T32-HL116275). M.D.B. was supported by the John S. LaDue Memorial Fellowship at Harvard Medical School. V.S.M. was supported by NIH AI113163. M.G. was supported by NIH/NIAID P30 AI060354. A.K.S. was supported by the Searle Scholars Program, the Beckman Young Investigator Program, 5U24AI118672, 1R33CA202820, 2R01HL095791, 2U19AI089992, 1R01HL134539, 1R01AI138546, 1U54CA217377, 1U2CCA23319501, 2RM1HG006193, 2P01AI039671, the Pew-Stewart Scholars, a Sloan Fellowship in Chemistry, and BMGF OPP1139972, OPP1137006, and OPP1116944.
Footnotes
Competing interests:
A.K.S. is a founder and on the scientific advisory board of Honeycomb Biotechnologies, which is developing Seq-Well arrays for commercial use. All other authors declare that they have no competing interests.
Data and materials availability:
All data needed to evaluate the conclusions in the paper are present in the paper or the Supplementary Materials.
SUPPLEMENTARY MATERIALS
stke.sciencemag.org/cgi/content/full/12/604/eaaw5573/DC1
Fig. S1. B cell gating strategy.
Fig. S2. The major transcriptional checkpoint occurs at the transitional T3 B cell stage in human versus the FO B cell stage in mouse.
Fig. S3. Transitional and FO human B cells analyzed by flow cytometry demonstrate comparable B cell surface protein amounts despite differences in forward and side scatter.
Fig. S4. Patients identified with activating mutations in PIK3CD.
Fig. S5. The PIK3CD M61V mutation promotes BCR-stimulated AKT and S6 activation.
Fig. S6. FO B cell development is blocked in patients with gain-of-function PIK3CD (PI3Kδ) mutations.
Fig. S7. APDS naive (IgD+CD27−) B cells cluster unique from healthy controls by scRNA-seq analysis using t-SNE.
Fig. S8. cAMP signaling is similar between early transitional and late transitional/FO B cells.
Fig. S9. Adenosine is sufficient to inhibit pS6 activation in transitional T3 and FO B cells.
Fig. S10. Increased abundance of cell surface ectonucleotidases at the FO B cell stage is not conserved between human and mouse.
Fig. S11. B cell viability in vitro.
Table S1. Top gene set enrichment pathways for transitional to FO B cell development.
Table S2. Characteristics of patients with APDS.
Table S3. Primers used for generating the WT, E1021K, and M61V mutant PI3Kδ constructs.
View/request a protocol for this paper from Bio-protocol.
REFERENCES AND NOTES
- 1.Nutt SL, Kee BL, The transcriptional regulation of B cell lineage commitment. Immunity 26, 715–725 (2007). [DOI] [PubMed] [Google Scholar]
- 2.Recaldin T, Fear DJ, Transcription factors regulating B cell fate in the germinal centre. Clin. Exp. Immunol 183, 65–75 (2016). [DOI] [PMC free article] [PubMed] [Google Scholar]
- 3.Cho SH, Raybuck AL, Stengel K, Wei M, Beck TC, Volanakis E, Thomas JW, Hiebert S, Haase VH, Boothby MR, Germinal centre hypoxia and regulation of antibody qualities by a hypoxia response system. Nature 537, 234–238 (2016). [DOI] [PMC free article] [PubMed] [Google Scholar]
- 4.Abbott RK, Thayer M, Labuda J, Silva M, Philbrook P, Cain DW, Kojima H, Hatfield S, Sethumadhavan S, Ohta A, Reinherz EL, Kelsoe G, Sitkovsky M, Germinal center hypoxia potentiates immunoglobulin class switch recombination. J. Immunol 197, 4014–4020 (2016). [DOI] [PMC free article] [PubMed] [Google Scholar]
- 5.Jellusova J, Cato MH, Apgar JR, Ramezani-Rad P, Leung CR, Chen C, Richardson AD, Conner EM, Benschop RJ, Woodgett JR, Rickert RC, Gsk3 is a metabolic checkpoint regulator in B cells. Nat. Immunol 18, 303–312 (2017). [DOI] [PMC free article] [PubMed] [Google Scholar]
- 6.Akkaya M, Traba J, Roesler AS, Miozzo P, Akkaya B, Theall BP, Sohn H, Pena M, Smelkinson M, Kabat J, Dahlstrom E, Dorward DW, Skinner J, Sack MN, Pierce SK, Second signals rescue B cells from activation-induced mitochondrial dysfunction and death. Nat. Immunol 19, 871–884 (2018). [DOI] [PMC free article] [PubMed] [Google Scholar]
- 7.Meffre E, The establishment of early B cell tolerance in humans: Lessons from primary immunodeficiency diseases. Ann. N. Y. Acad. Sci 1246, 1–10 (2011). [DOI] [PMC free article] [PubMed] [Google Scholar]
- 8.Carsetti R, Kohler G, Lamers MC, Transitional B cells are the target of negative selection in the B cell compartment. J. Exp. Med 181, 2129–2140 (1995). [DOI] [PMC free article] [PubMed] [Google Scholar]
- 9.Allman DM, Ferguson SE, Lentz VM, Cancro MP, Peripheral B cell maturation. II. Heat-stable antigen(hi) splenic B cells are an immature developmental intermediate in the production of long-lived marrow-derived B cells. J. Immunol 151, 4431–4444 (1993). [PubMed] [Google Scholar]
- 10.Palanichamy A, Barnard J, Zheng B, Owen T, Quach T, Wei C, Looney RJ, Sanz I, Anolik JH, Novel human transitional B cell populations revealed by B cell depletion therapy. J. Immunol 182, 5982–5993 (2009). [DOI] [PMC free article] [PubMed] [Google Scholar]
- 11.Wirths S, Lanzavecchia A, ABCB1 transporter discriminates human resting naive B cells from cycling transitional and memory B cells. Eur. J. Immunol 35, 3433–3441 (2005). [DOI] [PubMed] [Google Scholar]
- 12.Tipton CM, Fucile CF, Darce J, Chida A, Ichikawa T, Gregoretti I, Schieferl S, Hom J, Jenks S, Feldman RJ, Mehr R, Wei C, Lee FE-H, Cheung WC, Rosenberg AF, Sanz I, Diversity, cellular origin and autoreactivity of antibody-secreting cell population expansions in acute systemic lupus erythematosus. Nat. Immunol 16, 755–765 (2015). [DOI] [PMC free article] [PubMed] [Google Scholar]
- 13.Descatoire M, Weller S, Irtan S, Sarnacki S, Feuillard J, Storck S, Guiochon-Mantel A, Bouligand J, Morali A, Cohen J, Jacquemin E, Iascone M, Bole-Feysot C, Cagnard N, Weill J-C, Reynaud C-A, Identification of a human splenic marginal zone B cell precursor with NOTCH2-dependent differentiation properties. J. Exp. Med 211, 987–1000 (2014). [DOI] [PMC free article] [PubMed] [Google Scholar]
- 14.Suzuki A, Kaisho T, Ohishi M, Tsukio-Yamaguchi M, Tsubata T, Koni PA, Sasaki T, Mak TW, Nakano T, Critical roles of Pten in B cell homeostasis and immunoglobulin class switch recombination. J. Exp. Med 197, 657–667 (2003). [DOI] [PMC free article] [PubMed] [Google Scholar]
- 15.Iwata TN, Ramirez-Komo JA, Park H, Iritani BM, Control of B lymphocyte development and functions by the mTOR signaling pathways. Cytokine Growth Factor Rev. 35, 47–62 (2017). [DOI] [PMC free article] [PubMed] [Google Scholar]
- 16.Benhamron S, Tirosh B, Direct activation of mTOR in B lymphocytes confers impairment in B-cell maturation and loss of marginal zone B cells. Eur. J. Immunol 41, 2390–2396 (2011). [DOI] [PubMed] [Google Scholar]
- 17.Ci X, Kuraoka M, Wang H, Carico Z, Hopper K, Shin J, Deng X, Qiu Y, Unniraman S, Kelsoe G, Zhong X-P, TSC1 promotes B cell maturation but is dispensable for germinal center formation. PLOS ONE 10, e0127527 (2015). [DOI] [PMC free article] [PubMed] [Google Scholar]
- 18.Stark A-K, Chandra A, Chakraborty K, Alam R, Carbonaro V, Clark J, Sriskantharajah S, Bradley G, Richter AG, Banham-Hall E, Clatworthy MR, Nejentsev S, Hamblin JN, Hessel EM, Condliffe AM, Okkenhaug K, PI3Kdelta hyper-activation promotes development of B cells that exacerbate Streptococcus pneumoniae infection in an antibody-independent manner. Nat. Commun 9, 3174 (2018). [DOI] [PMC free article] [PubMed] [Google Scholar]
- 19.Kuehn HS, Zhao F, Niemela JE, Deenick EK, Palendira U, Avery DT, Moens L, Cannons JL, Biancalana M, Stoddard J, Ouyang W, Frucht DM, Rao VK, Atkinson TP, Agharahimi A, Hussey AA, Folio LR, Olivier KN, Fleisher TA, Pittaluga S, Holland SM, Cohen JI, Oliveira JB, Tangye SG, Schwartzberg PL, Lenardo MJ, Uzel G, Dominant-activating germline mutations in the gene encoding the PI(3)K catalytic subunit p110δ result in T cell senescence and human immunodeficiency. Nat. Immunol 15, 88–97 (2014). [DOI] [PMC free article] [PubMed] [Google Scholar]
- 20.Angulo I, Vadas O, Garcon F, Banham-Hall E, Plagnol V, Leahy TR, Baxendale H, Coulter T, Curtis J, Wu C, Blake-Palmer K, Perisic O, Smyth D, Maes M, Fiddler C, Juss J, Cilliers D, Markelj G, Chandra A, Farmer G, Kielkowska A, Clark J, Kracker S, Debre M, Picard C, Pellier I, Jabado N, Morris JA, Barcenas-Morales G, Fischer A, Stephens L, Hawkins P, Barrett JC, Abinun M, Clatworthy M, Durandy A, Doffinger R, Chilvers ER, Cant AJ, Kumararatne D, Okkenhaug K, Williams RL, Condliffe A, Nejentsev S, Phosphoinositide 3-kinase δ gene mutation predisposes to respiratory infection and airway damage. Science 342, 866–871 (2013). [DOI] [PMC free article] [PubMed] [Google Scholar]
- 21.Wentink M, Dalm V, Lankester AC, van Schouwenburg PA, Scholvinck L, Kalina T, Zachova R, Sediva A, Lambeck A, Pico-Knijnenburg I, van Dongen JJ, Pac M, Bernatowska E, van Hagen M, Driessen G, van der Burg M, Genetic defects in PI3Kδ affect B-cell differentiation and maturation leading to hypogammaglobulineamia and recurrent infections. Clin. Immunol 176, 77–86 (2017). [DOI] [PubMed] [Google Scholar]
- 22.Avery DT, Kane A, Nguyen T, Lau A, Nguyen A, Lenthall H, Payne K, Shi W, Brigden H, French E, Bier J, Hermes JR, Zahra D, Sewell WA, Butt D, Elliott M, Boztug K, Meyts I, Choo S, Hsu P, Wong M, Berglund LJ, Gray P, O’Sullivan M, Cole T, Holland SM, Ma CS, Burkhart C, Corcoran LM, Phan TG, Brink R, Uzel G, Deenick EK, Tangye SG, Germline-activating mutations in PIK3CD compromise B cell development and function. J. Exp. Med 215, 2073–2095 (2018). [DOI] [PMC free article] [PubMed] [Google Scholar]
- 23.The Gene Ontology Consortium, Expansion of the Gene Ontology knowledgebase and resources. Nucleic Acids Res. 45, D331–D338 (2017). [DOI] [PMC free article] [PubMed] [Google Scholar]
- 24.Ashburner M, Ball CA, Blake JA, Botstein D, Butler H, Cherry JM, Davis AP, Dolinski K, Dwight SS, Eppig JT, Harris MA, Hill DP, Issel-Tarver L, Kasarskis A, Lewis S, Matese JC, Richardson JE, Ringwald M, Rubin GM, Sherlock G, Gene ontology: Tool for the unification of biology. The Gene Ontology Consortium. Nat. Genet 25, 25–29 (2000). [DOI] [PMC free article] [PubMed] [Google Scholar]
- 25.Liberzon A, Birger C, Thorvaldsdottir H, Ghandi M, Mesirov JP, Tamayo P, The Molecular Signatures Database (MSigDB) hallmark gene set collection. Cell Syst. 1, 417–425 (2015). [DOI] [PMC free article] [PubMed] [Google Scholar]
- 26.Park Y, Reyna-Neyra A, Philippe L, Thoreen CC, mTORC1 balances cellular amino acid supply with demand for protein synthesis through post-transcriptional control of ATF4. Cell Rep. 19, 1083–1090 (2017). [DOI] [PMC free article] [PubMed] [Google Scholar]
- 27.Iadevaia V, Liu R, Proud CG, mTORC1 signaling controls multiple steps in ribosome biogenesis. Semin. Cell Dev. Biol 36, 113–120 (2014). [DOI] [PubMed] [Google Scholar]
- 28.Schieke SM, Phillips D, Philip McCoy J Jr., Aponte AM, Shen R-F, Balaban RS, Finkel T, The mammalian target of rapamycin (mTOR) pathway regulates mitochondrial oxygen consumption and oxidative capacity. J. Biol. Chem 281, 27643–27652 (2006). [DOI] [PubMed] [Google Scholar]
- 29.Ramanathan A, Schreiber SL, Direct control of mitochondrial function by mTOR. Proc. Natl. Acad. Sci. U.S.A 106, 22229–22232 (2009). [DOI] [PMC free article] [PubMed] [Google Scholar]
- 30.Buller CL, Loberg RD, Fan M-H, Zhu Q, Park JL, Vesely E, Inoki K, Guan K-L, Brosius FC III, A GSK-3/TSC2/mTOR pathway regulates glucose uptake and GLUT1 glucose transporter expression. Am. J. Phys. Cell Physiol 295, C836–C843 (2008). [DOI] [PMC free article] [PubMed] [Google Scholar]
- 31.Farmer JR, Ong MS, Barmettler S, Yonker LM, Fuleihan R, Sullivan KE, Cunningham-Rundles C; USIDNET Consortium, Walter JE, Common variable immunodeficiency non-infectious disease endotypes redefined using unbiased network clustering in large electronic datasets. Front. Immunol 8, 1740 (2018). [DOI] [PMC free article] [PubMed] [Google Scholar]
- 32.Coulter TI, Chandra A, Bacon CM, Babar J, Curtis J, Screaton N, Goodlad JR, Farmer G, Steele CL, Leahy TR, Doffinger R, Baxendale H, Bernatoniene J, Edgar JD, Longhurst HJ, Ehl S, Speckmann C, Grimbacher B, Sediva A, Milota T, Faust SN, Williams AP, Hayman G, Kucuk ZY, Hague R, French P, Brooker R, Forsyth P, Herriot R, Cancrini C, Palma P, Ariganello P, Conlon N, Feighery C, Gavin PJ, Jones A, Imai K, Ibrahim MA, Markelj G, Abinun M, Rieux-Laucat F, Latour S, Pellier I, Fischer A, Touzot F, Casanova JL, Durandy A, Burns SO, Savic S, Kumararatne DS, Moshous D, Kracker S, Vanhaesebroeck B, Okkenhaug K, Picard C, Nejentsev S, Condliffe AM, Cant AJ, Clinical spectrum and features of activated phosphoinositide 3-kinase δ syndrome: A large patient cohort study. J. Allergy Clin. Immunol 139, 597–606.e4 (2017). [DOI] [PMC free article] [PubMed] [Google Scholar]
- 33.Takeda AJ, Zhang Y, Dornan GL, Siempelkamp BD, Jenkins ML, Matthews HF, McElwee JJ, Bi W, Seeborg FO, Su HC, Burke JE, Lucas CL, Novel PIK3CD mutations affecting N-terminal residues of p110δ cause activated PI3Kδ syndrome (APDS) in humans. J. Allergy Clin. Immunol 140, 1152–1156.e10 (2017). [DOI] [PMC free article] [PubMed] [Google Scholar]
- 34.Butler A, Hoffman P, Smibert P, Papalexi E, Satija R, Integrating single-cell transcriptomic data across different conditions, technologies, and species. Nat. Biotechnol 36, 411–420 (2018). [DOI] [PMC free article] [PubMed] [Google Scholar]
- 35.Ben-Sahra I, Manning BD, mTORC1 signaling and the metabolic control of cell growth. Curr. Opin. Cell Biol 45, 72–82 (2017). [DOI] [PMC free article] [PubMed] [Google Scholar]
- 36.Lee JY, Karwatsky J, Ma L, Zha X, ABCA1 increases extracellular ATP to mediate cholesterol efflux to ApoA-I. Am. J. Phys. Cell Physiol 301, C886–C894 (2011). [DOI] [PubMed] [Google Scholar]
- 37.Guidotti G, ATP transport and ABC proteins. Chem. Biol 3, 703–706 (1996). [DOI] [PubMed] [Google Scholar]
- 38.Choi MS, Moon SM, Lee SA, Park BR, Kim JS, Kim DK, Kim YH, Kim CS, Adenosine induces intrinsic apoptosis via the PI3K/Akt/mTOR signaling pathway in human pharyngeal squamous carcinoma FaDu cells. Oncol. Lett 15, 6489–6496 (2018). [DOI] [PMC free article] [PubMed] [Google Scholar]
- 39.Fluckiger A-C, Sanz E, Garcia-Lloret M, Su T, Hao Q-L, Kato R, Quan S, de la Hera A, Crooks GM, Witte ON, Rawlings DJ, In vitro reconstitution of human B-cell ontogeny: From CD34+ multipotent progenitors to Ig-secreting cells. Blood 92, 4509–4520 (1998). [PubMed] [Google Scholar]
- 40.Luo XM, Maarschalk E, O’Connell RM, Wang P, Yang L, Baltimore D, Engineering human hematopoietic stem/progenitor cells to produce a broadly neutralizing anti-HIV antibody after in vitro maturation to human B lymphocytes. Blood 113, 1422–1431 (2009). [DOI] [PubMed] [Google Scholar]
- 41.Kim J, Yang G, Kim Y, Kim J, Ha J, AMPK activators: Mechanisms of action and physiological activities. Exp. Mol. Med 48, e224 (2016). [DOI] [PMC free article] [PubMed] [Google Scholar]
- 42.Sander S, Chu VT, Yasuda T, Franklin A, Graf R, Calado DP, Li S, Imami K, Selbach M, Virgilio MD, Bullinger L, Rajewsky K, PI3 kinase and FOXO1 transcription factor activity differentially control B cells in the germinal center light and dark zones. Immunity 43, 1075–1086 (2015). [DOI] [PubMed] [Google Scholar]
- 43.Dengler HS, Baracho GV, Omori SA, Bruckner S, Arden KC, Castrillon DH, DePinho RA, Rickert RC, Distinct functions for the transcription factor Foxo1 at various stages of B cell differentiation. Nat. Immunol 9, 1388–1398 (2008). [DOI] [PMC free article] [PubMed] [Google Scholar]
- 44.Chen J, Limon JJ, Blanc C, Peng SL, Fruman DA, Foxo1 regulates marginal zone B-cell development. Eur. J. Immunol 40, 1890–1896 (2010). [DOI] [PMC free article] [PubMed] [Google Scholar]
- 45.Monaco G, van Dam S, Casal Novo Ribeiro JL, Larbi A, de Magalhaes JP, A comparison of human and mouse gene co-expression networks reveals conservation and divergence at the tissue, pathway and disease levels. BMC Evol. Biol 15, 259 (2015). [DOI] [PMC free article] [PubMed] [Google Scholar]
- 46.Burnstock G, Boeynaems J-M, Purinergic signaling and immune cells. Purinergic Signal 10, 529–564 (2014). [DOI] [PMC free article] [PubMed] [Google Scholar]
- 47.Johnson SM, North ME, Asherson GL, Allsop J, Watts RW, Webster AD, Lymphocyte purine 5′-nucleotidase deficiency in primary hypogammaglobulinaemia. Lancet 1, 168–170 (1977). [DOI] [PubMed] [Google Scholar]
- 48.Edwards NL, Magilavy DB, Cassidy JT, Fox IH, Lymphocyte ecto-5’-nucleotidase deficiency in agammaglobulinemia. Science 201, 628–630 (1978). [DOI] [PubMed] [Google Scholar]
- 49.Schena F, Volpi S, Faliti CE, Penco F, Santi S, Proietti M, Schenk U, Damonte G, Salis A, Bellotti M, Fais F, Tenca C, Gattorno M, Eibel H, Rizzi M, Warnatz K, Idzko M, Ayata CK, Rakhmanov M, Galli T, Martini A, Canossa M, Grassi F, Traggiai E, Dependence of immunoglobulin class switch recombination in B cells on vesicular release of ATP and CD73 ectonucleotidase activity. Cell Rep. 3, 1824–1831 (2013). [DOI] [PubMed] [Google Scholar]
- 50.Rao VK, Webster S, Dalm VASH, Šediva A, van Hagen PM, Holland S, Rosenzweig SD, Christ AD, Sloth B, Cabanski M, Joshi AD, de Buck S, Doucet J, Guerini D, Kalis C, Pylvaenaeinen I, Soldermann N, Kashyap A, Uzel G, Lenardo MJ, Patel DD, Lucas CL, Burkhart C, Effective “activated PI3Kδ syndrome”-targeted therapy with the PI3Kδ inhibitor leniolisib. Blood 130, 2307–2316 (2017). [DOI] [PMC free article] [PubMed] [Google Scholar]
- 51.Picelli S, Bjorklund AK, Faridani OR, Sagasser S, Winberg G, Sandberg R, Smart-seq2 for sensitive full-length transcriptome profiling in single cells. Nat. Methods 10, 1096–1098 (2013). [DOI] [PubMed] [Google Scholar]
- 52.Gierahn TM, Wadsworth II MH, Hughes TK, Bryson BD, Butler A, Satija R, Fortune S, Love JC, Shalek AK, Seq-Well: Portable, low-cost RNA sequencing of single cells at high throughput. Nat. Methods 14, 395–398 (2017). [DOI] [PMC free article] [PubMed] [Google Scholar]
- 53.Leng N, Dawson JA, Thomson JA, Ruotti V, Rissman AI, Smits BMG, Haag JD, Gould MN, Stewart RM, Kendziorski C, EBSeq: An empirical Bayes hierarchical model for inference in RNA-seq experiments. Bioinformatics 29, 1035–1043 (2013). [DOI] [PMC free article] [PubMed] [Google Scholar]
- 54.Heinz S, Benner C, Spann N, Bertolino E, Lin YC, Laslo P, Cheng JX, Murre C, Singh H, Glass CK, Simple combinations of lineage-determining transcription factors prime cis-regulatory elements required for macrophage and B cell identities. Mol. Cell 38, 576–589 (2010). [DOI] [PMC free article] [PubMed] [Google Scholar]
- 55.Macosko EZ, Basu A, Satija R, Nemesh J, Shekhar K, Goldman M, Tirosh I, Bialas AR, Kamitaki N, Martersteck EM, Trombetta JJ, Weitz DA, Sanes JR, Shalek AK, Regev A, McCarroll SA, Highly parallel genome-wide expression profiling of individual cells using nanoliter droplets. Cell 161, 1202–1214 (2015). [DOI] [PMC free article] [PubMed] [Google Scholar]
- 56.Satija R, Farrell JA, Gennert D, Schier AF, Regev A, Spatial reconstruction of single-cell gene expression data. Nat. Biotechnol 33, 495–502 (2015). [DOI] [PMC free article] [PubMed] [Google Scholar]
Associated Data
This section collects any data citations, data availability statements, or supplementary materials included in this article.