Abstract
The molecular changes that occur with aging are not well understood1–4. Here, we performed longitudinal and deep multiomics profiling of 106 healthy individuals from 29 to 75 years of age and examined how different types of ‘omic’ measurements, including transcripts, proteins, metabolites, cytokines, microbes and clinical laboratory values, correlate with age. We identified both known and new markers that associated with age, as well as distinct molecular patterns of aging in insulin-resistant as compared to insulin-sensitive individuals. In a longitudinal setting, we identified personal aging markers whose levels changed over a short time frame of 2–3 years. Further, we defined different types of aging patterns in different individuals, termed ‘ageotypes’, on the basis of the types of molecular pathways that changed over time in a given individual. Ageotypes may provide a molecular assessment of personal aging, reflective of personal lifestyle and medical history, that may ultimately be useful in monitoring and intervening in the aging process.
Aging is a universal process of physiological and molecular changes that are strongly associated with susceptibility to disease and ultimately death1–5. Despite its importance and extensive analysis in model organisms, a comprehensive view of the molecular changes that occur during aging in humans is not known and understanding of the heterogeneity of the aging process at an individual level and over short actionable timescales is lacking.
Cross-sectional studies have revealed differences in telomeres and DNA methylation associated with age6. The latter has led to a description of a ‘molecular clock’ that is associated with chronological and biological age7,8. Acceleration of the clock has been associated with human diseases. In addition to epigenetic markers, several clinical markers, such as cholesterol and glycosylated hemoglobin (HbA1c) levels, which are associated with metabolic disorders and type 2 diabetes, change with age9,10. However, global monitoring of molecular profiles has not been performed, and thus, a comprehensive understanding of the changes in different pathways that occur within an individual and the ageotypes that exist in humans are not known. Even for individuals with type 2 diabetes and insulin resistance (IR; commonly associated with type 2 diabetes), the full pattern of changes that occur with age and intervention is not known. Understanding both patterns of aging and how IR is associated with age is ultimately important for targeted intervention.
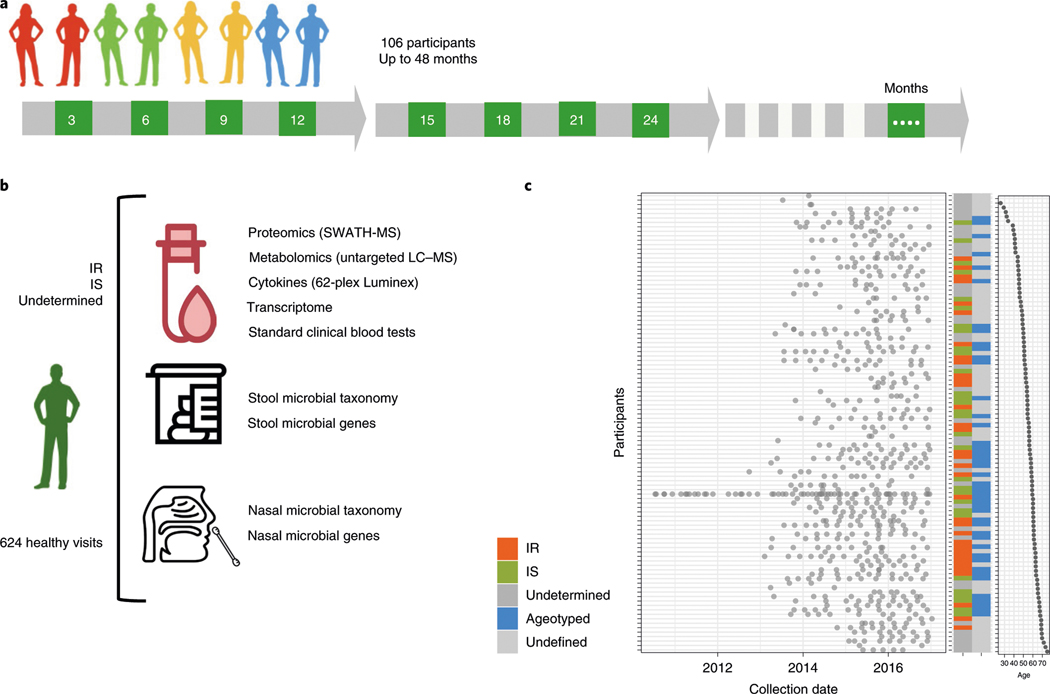
We studied a cohort comprising 106 prediabetic and healthy individuals, extensively characterized for many parameters of glucose dysregulation, including fasting glucose, HbA1c, oral glucose tolerance tests11 and IR using a steady-state plasma glucose (SSPG) test12. The cohort (age range 29–75 years; median 55.74 years) was tracked with quarterly visits for up to 4 years, with additional samples acquired during periods of physiological stress, such as respiratory viral infections. The participants engaged in a total of 1,092 visits and samples were analyzed by seven omics assays (Fig. 1a). For each visit, we performed proteomics and metabolomics on plasma samples, transcriptome analysis on material from peripheral blood mononuclear cells and targeted cytokine assays using serum. Nasal and gut microbiomes were analyzed using 16S rRNA sequencing, providing information at the genus level, and exome sequencing was performed once using DNA from peripheral blood mononuclear cells. In addition, 51 clinical laboratory tests were acquired on each visit. In total, more than 18 million data points were generated (Fig. 1b); the cohort is described by Zhou et al.13 and Schüssler-Fiorenza Rose et al.14. For the purpose of this study, we focused on healthy quarterly visits (n = 624), searching for biological molecules that are associated with age.
Fig. 1 |. integrative Personal Omics Profiling (iPOP) cohort sampling and data collection for aging analyses.
a, Study design. A total of 106 participants were profiled by multiomic assays at their quarterly healthy visits over the course of up to 48 months. The numbers in green boxes indicate the number of months since enrollment for the quarterly visits. b, Graphical illustration of sample collection, multiomic assays and data generation for participants, including 35 participants who were Ir, 31 participants who were IS and 40 participants with an unclassified insulin status. Data from a total of 624 healthy visits were analyzed. Omic assays included proteomics using sequential window acquisition of all theoretical fragment ion spectra mass spectrometry (SWATH-MS), metabolomics using untargeted liquid chromatography mass spectrometry (LC–MS) and transcriptomics and microbial profiling using next-generation sequencing. c, Plot of the collection dates for all participants (left), participant characteristics (middle) and participant age (right). red, Ir; green, IS; dark gray, unknown insulin status; blue, the participant was included in the longitudinal study and was analyzed for personal aging trends (ageotyped); light gray, the participant was not included in the longitudinal cohort owing to insufficient sampling for ageotyping analysis.
To understand aging patterns between and within people, we performed three types of analyses: (1) identification of markers and pathways that cross-sectionally associated with the age of individuals across the cohort; (2) identification of molecular aging differences between participants who were IR and insulin sensitive (IS); and (3) identification of personal markers and pathways that changed with age for each individual and how these differed between individuals (Fig. 1c).
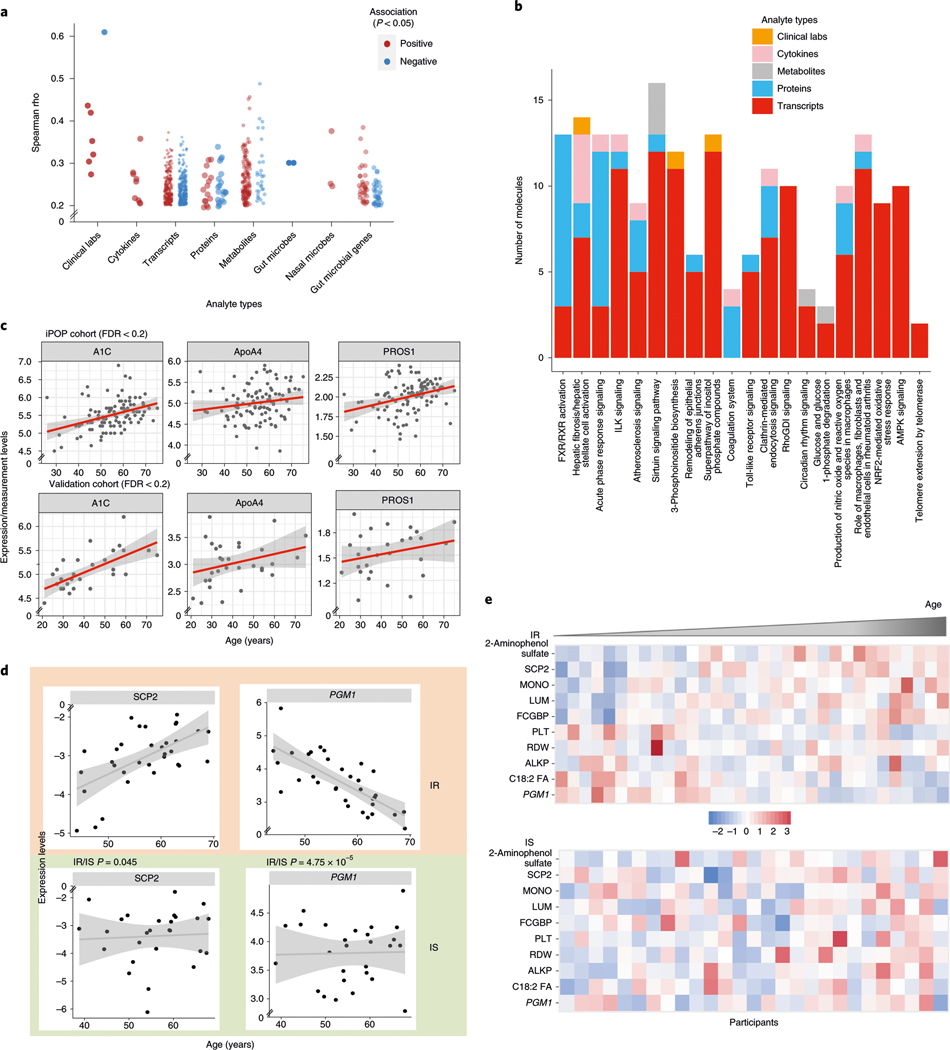
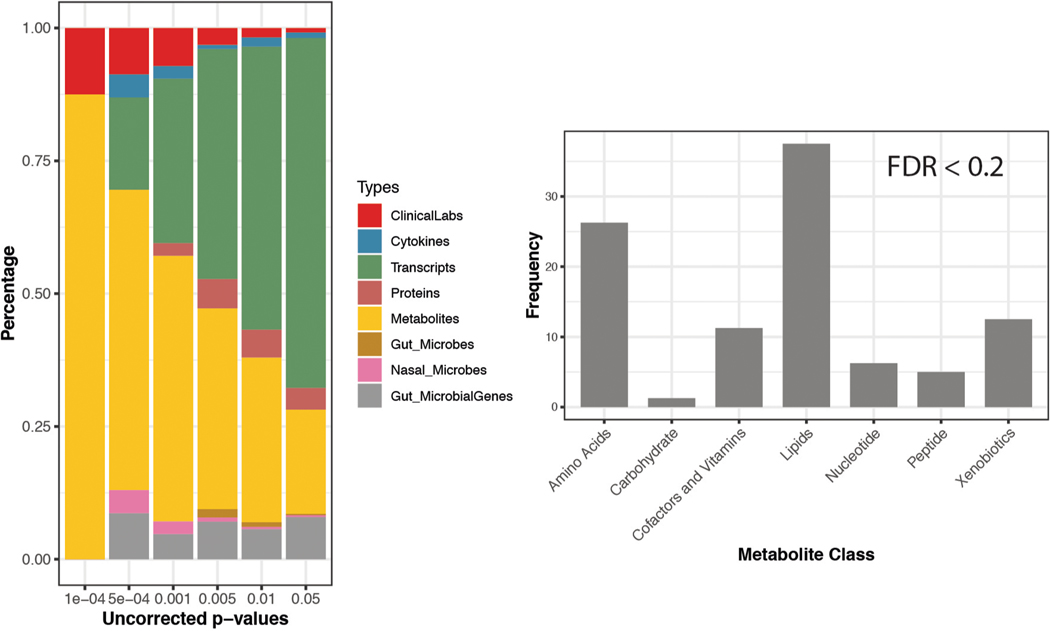
We first systematically searched for markers that strongly correlated with the median age of each participant in the cohort. From the 624 healthy visits, we analyzed the median expression of 10,343 genes, 306 plasma proteins, 722 metabolites, 62 cytokines, 6,909 microbes (at the level of 16S rRNA) and 51 clinical markers and performed Spearman correlation tests with the median age of the participant. After correcting for body mass index (BMI) and sex, we found 184 molecules from different ‘omes’ that showed different trends and levels of association with age (Fig. 2a, Extended Data Fig. 1a and Supplementary Table 1); some were reported previously, whereas many others had not been reported. For example, from the clinical laboratory data, estimated glomerular filtration rate, which is known to decrease with age15, correlated negatively with age in our cohort (Spearman, rho = −0.6, false discovery rate (FDR) = 5.5 × 10⁻⁶). Several growth factors, such as platelet-derived growth factor (PDGF)-BB (Spearman, rho = 0.36, FDR = 0.017) and vascular endothelial growth factor (VEGF)-D (Spearman, rho = 0.26, FDR = 0.128) positively correlated with age. Other isoforms of VEGF and PDGF growth factors have been reported to correlate with age16,17. After multiple-hypothesis corrections, we found 87 biological molecules and microbial features that correlated with age at FDR < 0.1 and 184 molecules and microbes at FDR < 0.2. Among the 184 molecules and microbial features, 160 were metabolites and 40% of these were lipids, a class of molecule known to change with age18 (Extended Data Fig. 1b). Xenobiotics such as hippuric acid, 2-aminophenol sulfate and quinic acid (18%) and amino acids (16%) were other groups of metabolites that correlated with age.
Fig. 2 |. Aging molecules and pathways revealed from cross-sectional analyses.
a, Spearman rho coefficients significantly associated with age for the indicated categories of data. red indicates positive associations and blue indicates negative associations. b, The number of molecules from each of the indicated categories of data (measurement types) belonging to the indicated pathways is shown. The top pathways are shown that were significantly enriched in molecules associated with age. ILK, integrin-linked kinase; rhoGDI, rho GDP-dissociation inhibitor; nrF2, nF-E2 p45-related factor 2; AMPK, AMP-activated protein kinase. c, Scatter-plots showing the correlation trend of molecules (expression level as y axis) with age (x axis) in two independent cohorts (iPOP, n = 106; validation, n = 31). Individuals from each cohort are shown as dots and the linear regression coefficient is noted as the red trend line with a gray confidence interval. d, Examples of associations that are different between participants who were Ir (n = 35) and IS (n = 31). The x axis shows the age of participants and the y axis shows the normalized values of the measurements (median normalization). Individuals are shown as dots and the linear regression coefficient is noted as the trend line with a gray confidence interval. P values indicate a significant difference between the trends associated with age for the Ir and IS groups. e, Heat maps of measurements in participants who were Ir (top) and IS (bottom). Only measurements that were significantly associated with age in the Ir group are presented. In each group, participants are ordered by their age, from left to right. red indicates increased expression and blue indicates decreased expression. MOnO, monocyte count; PLT, platelet count; ALKP, alkaline phosphatase.
Several microbes also correlated with age. These included the gut bacteria Clostridium cluster IV whose abundance increased with age (Spearman, rho = 0.38, FDR = 0.023), consistent with the complex dynamics of different Clostridium bacteria during aging19. The genus Blautia was also positively associated with age, consistent with a recent microbiome study that showed that Blautia hansenii can be used to predict chronological age20.
We sometimes observed that molecules of similar function had different associations with age. For instance, the insulin-related growth factors IGF2R and IGFALS were inversely correlated with age (Spearman, rho = −0.33, FDR = 0.0943 and Spearman, rho = 0.31, FDR = 0.0943, respectively), whereas two other insulin-signaling-related molecules, IGFLR1 and IGFBP7 (Spearman, rho = 0.15 and 0.14, respectively), correlated positively with age. The complexity of insulin growth factors and signaling molecules in aging has been reported previously21. In addition, the inverse correlations of fetuin-B (Spearman, rho = −0.31, FDR = 0.0944) and vitamin K-dependent protein S (PROS1) (Spearman, rho = −0.30, FDR = 0.121) with age are consistent with previous studies22,23.
To understand the biological pathways associated with age, we analyzed significant molecules (Supplementary Table 1) whose level of expression correlated with age at P < 0.05 (including 563 genes) using Ingenuity Pathway Analysis and found that both reported and unreported pathways were associated with age (Fig. 2b and Supplementary Table 2). Acute-phase response signaling, high mobility group box 1 (HMGB1) signaling, Toll-like receptor signaling and the coagulation pathway increased with age, consistent with reported increased levels of inflammation and coagulation pathways with age24. We found that different types of molecules contributed to pathway enrichments, underscoring the importance of systematic profiling of many omes. Analysis of an independent cohort of 31 individuals with clinical and proteomics assays (see Methods) validated the positive age correlation of HbA1c, apolipoprotein A-IV protein (ApoA4) and PROS1 (Fig. 2c). Additionally, 99 transcripts that correlated with age in our study were also identified (Supplementary Table 3) in larger cross-sectional studies25.
Because our cohort was well characterized for IR we explored whether individuals who are resistant and sensitive to insulin age differently (IR: median age = 57.72 years, n = 35; IS: median age = 54.39 years, n = 31). We identified ten molecules that significantly correlated with age in the IR group but not in the IS group (Pearson, FDR < 0.2), and one molecule that significantly correlated with age in the IS group but not in the IR group (Fig. 2d,e and Supplementary Table 4). Of the ten molecules that were significant in the IR and IS groups, nine were also significantly (P < 0.05) different between the two groups. These included IgG Fc-binding protein (FCGBP), lumican (LUM; an extracellular matrix protein of human articular cartilage responsible for tissue homeostasis) and nonspecific lipid transfer protein (SCP2), which significantly associated positively with age in the IR group. The xenobiotic 2-aminophenol sulfate showed a strong positive correlation in individuals who were IR. The phosphoglucomutase 1 gene (PGM1) was one of the genes most frequently observed to have different expression in aging in IR and IS (P = 4.75 × 10⁻⁵, on the basis of the interaction term of the linear model describing different trends in the two groups) and is involved in the breakdown and synthesis of glycogen and the regulation of glucose 1-phosphate and glucose 6-phosphate26. Monocyte counts were positively correlated and platelet counts were negatively correlated with age in individuals who were IR. Alkaline phosphatase showed a significant positive correlation only in the IS group. These results demonstrate that individuals who are IR and IS follow different aging patterns at the molecular level.
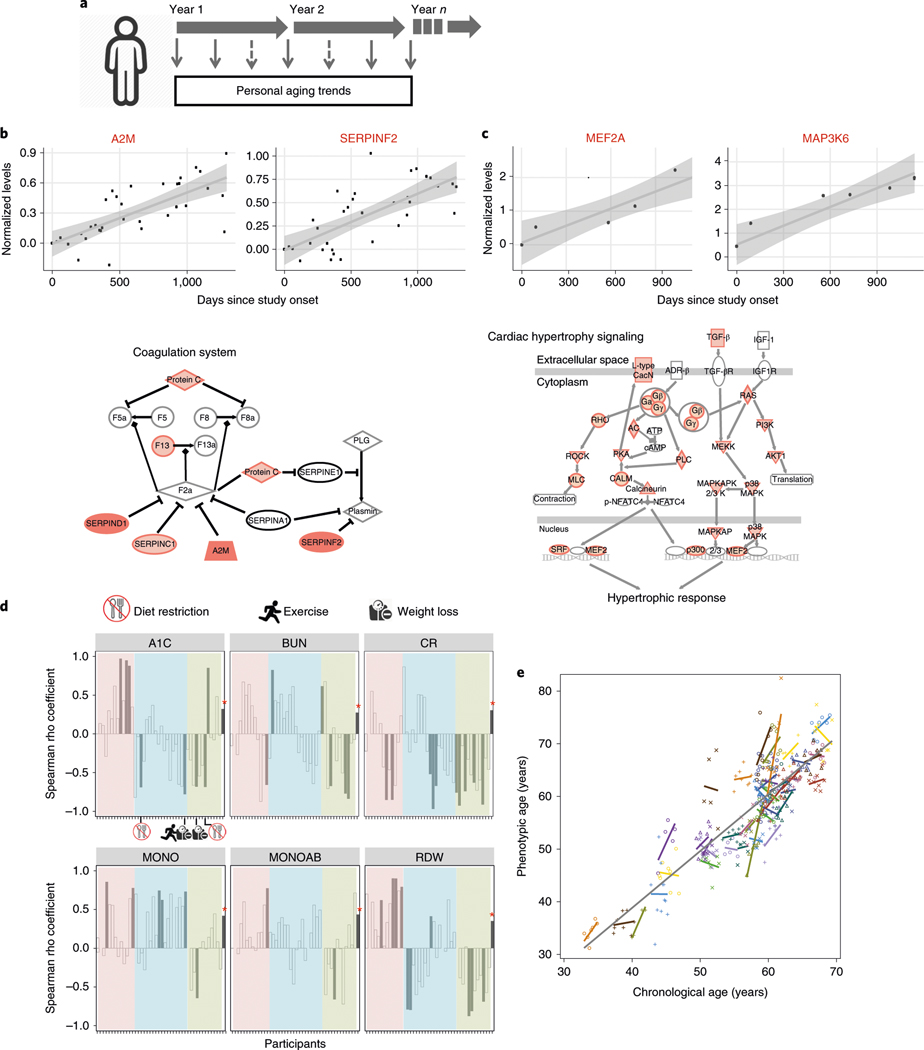
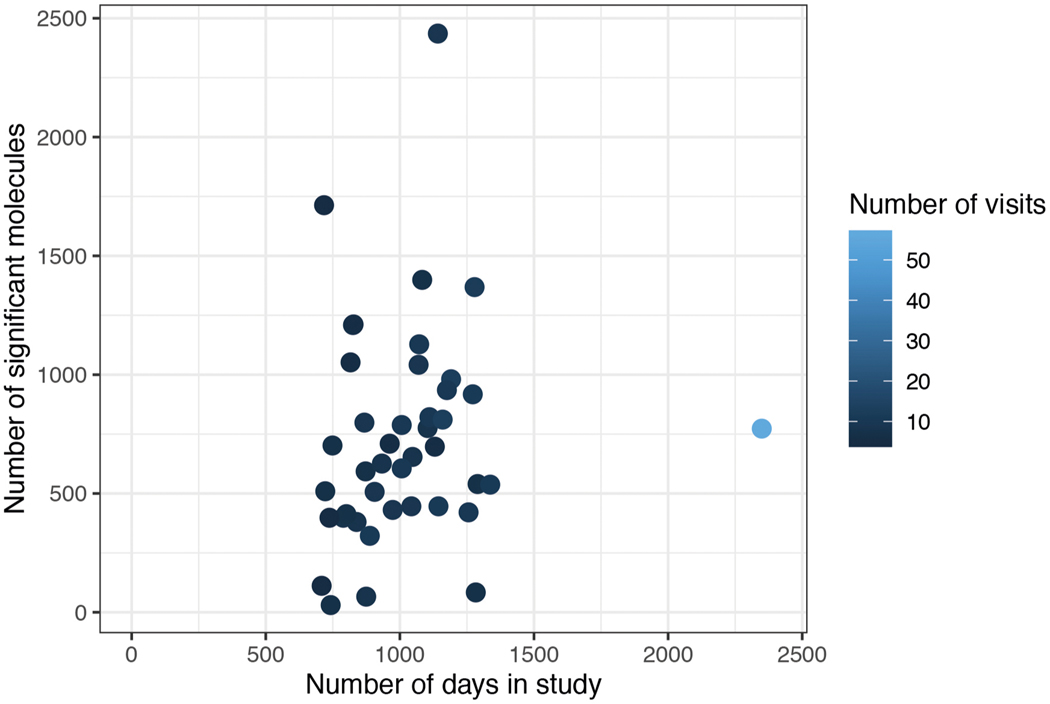
The frequent sampling of individuals over a potentially actionable time frame (Fig. 3a), which we arbitrarily defined as less than 2 years, enabled us to study how individuals change with time at a personal level. We focused on 43 individuals who had at least five healthy visits spanning at least 700 d, which was sufficient for identifying analytes that changed with time (see Supplementary Table 5). Molecules and microbes that significantly associated with age were identified by rank-based linear regression analysis using Spearman correlation of both host and microbial analytes (Supplementary Tables 5 and 6 for analysis by alternative linear mixed-effects models). Within the 1,200-d window, the number of molecules associated with age was independent of the number of sampling days (Extended Data Fig. 2 and Supplementary Table 7). For example, individual ZOZOW1T had 56 visits over 2,349 d and had 775 molecules significantly associated with aging within the 1,200-d period (P < 0.05; Fig. 3b), whereas individual ZN3TBJM had 9 visits over 1,141 d and had 2,438 molecules associated with aging within the 1,200-d period (Fig. 3c).
Fig. 3 |. Personal aging markers show personalized aging patterns that are distinct from those of cross-sectional aging markers.
a, Graphical illustration of the personal aging trend analysis based on longitudinal measurements of analytes in the same individual. b,c, Longitudinal analysis of aging in participants ZOZOW1T (b) and Zn3TBJM (c). Top, representative scatter plots showing longitudinal levels of analytes significantly associated with days elapsed since study onset. Longitudinal measurements of an analyte in one individual are shown as dots and the rank-based linear regression coefficient is noted as the trend line with a gray confidence interval. A2M, α−2-macroglobulin; SErPInF2, serpin family F member 2; MEF2A, myocyte enhancer factor 2A; MAP3K6, mitogen-activated protein kinase 6 (all measurements from transcriptomic rnA-seq). Bottom, examples of enriched pathways identified from aging-associated analytes. Darker shades represent increased levels over the course of the study. d, Spearman rho coefficients comparing personal associations and cross-sectional associations (n = 106) for six clinical laboratory analytes. Participants analyzed for their personal aging trends are displayed along the x axis in the same order for each panel. For each clinical analyte, the Spearman rho coefficient obtained from cross-sectional association is marked with an asterisk. Color coding (pink, blue and green) for groups was based on clustering analysis using coefficients of the six clinical laboratory values. Individuals with changes in diet, exercise and weight management are indicated graphically in the A1C panel. Cr, creatinine; MOnOAB, absolute count of monocytes. e, Phenotypic age regression on the chronological age of individuals (n = 43). The gray trend line is the overall regression line for the cohort. The colored lines are the fitted regression lines for each individual.
Pathway analysis of personal aging molecules in different individuals revealed distinct aging pathways for each individual. For example, individual ZOZOW1T had significant enrichments in LXR/RXR activation, acute-phase response signaling, and complement and coagulation cascade pathways (Fig. 3b and Supplementary Table 8), whereas individual ZN3TBJM had cardiac hypertrophy signaling as one of the top enriched pathways identified on the basis of molecules correlating with aging (Fig. 3c and Supplementary Table 9). Furthermore, different individuals had distinct trends in their gut microbial changes over time. For example, individual ZOZOW1T had 56 significant changes across taxonomy levels in gut microbes, whereas individual ZN3TBJM had only 6 significant changes during this time, 5 of which were not observed in ZOZOW1T (Supplementary Table 5).
To understand how molecules that correlated with age in a population compared to their trends in individuals, we specifically examined clinical laboratory markers that might also provide clinically useful insights (Fig. 3d). For the six clinical markers significantly associated with age at the cross-sectional population level, we observed that these markers did not always associate with aging at an individual level, and often showed associations that were significantly reversed from the population trend. For example, HbA1C correlated positively with aging across the cohort but was only positively correlated in 18 individuals (4 significantly, P < 0.05) and was negatively correlated with aging at the individual level in 24 individuals (4 significantly, P < 0.05). Creatinine also had a positive correlation with aging at the population level, but interestingly had a negative correlation in more than 70% of the individuals we studied. Thus, although molecules can show a significant trend at a population level, at a personal level these trends can be the opposite.
To examine whether variation in aging associations at the personal level could be a result of the individual’s lifestyle, we systematically examined lifestyle and medication changes for people with those records available. Twenty-eight participants logged dietary habits using 25 food categories at each visit (see Methods). Correlation analysis of the food category changes (duration in days in the study) with the age association of clinical markers showed that there was no significant correlation between food intake and time for the food categories, with one exception (Supplementary Table 10), indicating that dietary intakes are generally stable and dietary alteration is not responsible for the longitudinal changes in the clinical markers observed in our cohort. However, one participant had an increase in soft drink intake and decreased blood urea nitrogen (BUN) with increased monocyte levels and red blood cell distribution width (RDW).
We also examined physical activity, medication and BMI changes for the participants. Thirty-one participants filled out the International Physical Activity Questionnaire (IPAQ) with each visit. Changes to medications (diabetic medications and statins) were tracked for all 43 participants through self-reporting and electronic health records. Two of the 31 participants significantly reduced physical activity over time (one with low effect). One individual started metformin and another added a third diabetic medication to their regimen; two individuals started taking statins and one person stopped taking statins. Two of 43 participants lost weight. Thus, the vast majority of participants (96.4%, 93.5% and 88.4%) reported no significant change in diet, activity or medications, respectively. Taking these data together with the food data for the vast majority of participants, it is unlikely that the changes we observed were due to lifestyle or medications.
To determine whether lifestyle could affect age-associated clinical markers directly, we examined whether participants who deviated from the population trend had an alteration in lifestyle, BMI or medication. We found that there were four participants who had a significantly negative correlation of HbA1c with age, indicative of an improvement in glucose metabolism during the study. Two of these had undergone diet restriction and the other two had lost weight, as reflected by their lifestyle surveys (Fig. 3d). Moreover, there were 12 participants with significantly decreased associations with age for BUN or creatinine, suggesting an improvement in kidney function over time, as both of these clinical markers typically increase with age. We found that eight of those individuals were consistently taking statins throughout the entire study, whereas four were not; the fraction of individuals who were on statins and had decreased creatinine was significantly different (P = 0.043) from the fraction of individuals whose creatinine increased with age. Interestingly, one person who lost weight during the study improved in all six clinical markers. These data suggest that, at least in some cases, obvious interventions can improve clinical markers, whereas for other cases, the source of their improvement remains unlcear.
Finally, as an independent examination of age, we used the published phenotypic age formula to assess whether a reported aging metric changes with time at a personal level27,28. Although overall phenotypic age increased with age as expected (slope = 1.07), consistent with the results presented above, the individual phenotypic age slopes differed among the different participants, with 15 participants even showing negative values (Fig. 3e). These results using an independent metric further suggest that individuals are aging at different rates as well as potentially through different biological mechanisms.
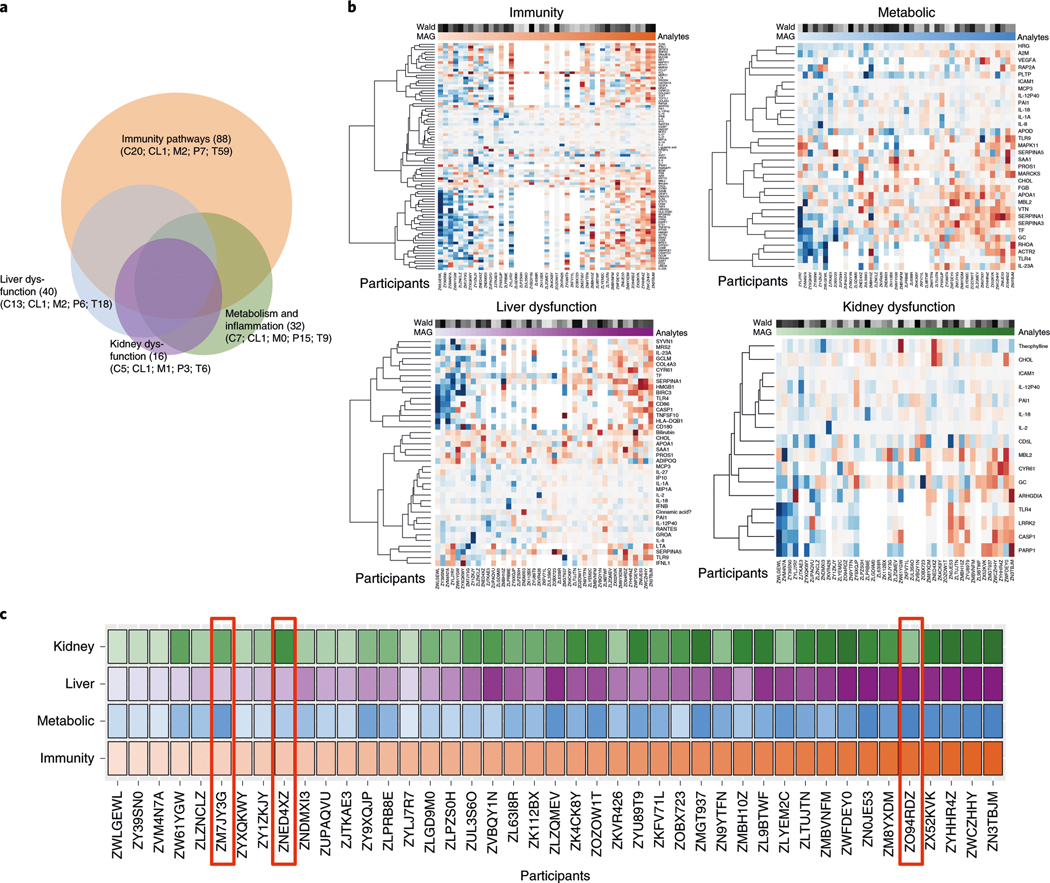
These results indicate that individuals can have distinct aging patterns, or ageotypes. To systematically analyze the individual aging patterns, we further analyzed the 608 molecules that significantly correlated with age in at least six individuals (see Supplementary Tables 6 and 11 for aging trend by alternative linear mixed-effects models). Pathway-enrichment analyses revealed 107 canonical pathways and 147 toxicity pathways (Supplementary Table 12). Grouping pathways that had similar terms (see Methods) revealed four major overlapping pathways—immunity, metabolic, liver dysregulation and kidney dysregulation—associated with aging (Fig. 4a, Supplementary Table 13 and Methods). For each term, we estimated the magnitude of its aging association and the cumulative probability of its association to evaluate the association pattern and significance with aging (in days), respectively (Supplementary Tables 14–17). Under immunity pathways, we observed an increase in immunity-related molecules with age in a number of individuals (e.g., ZN3TBJM and ZWCZHHY; Fig. 4b, upper left). The molecules that increased with age included CCL27 (ref. 29), ORAI1 (ref. 30), IFITM1 (ref. 31) and ITPR2 (ref. 32), which were previously shown to increase with aging or aging-related diseases. However, there were a number of individuals (such as, ZWLGEWL and ZY39SN0), who showed decreased expression of these molecules with age. Notably, individuals showed distinct and sometimes opposite patterns of expression in molecules and pathways (Fig. 4b).
Fig. 4 |. Personal ageotypes defined from four major groups of pathways.
a, Venn diagram showing the number of analytes (C, cytokines; CL, clinical laboratory values; M, metabolites; P, proteins; T, transcripts) in each of the four ageotypes and the overlaps among them. b, Heat maps showing the levels of aging markers in the four major ageotypes for each individual: red, immunity ageotype; blue, metabolic ageotype; purple, liver dysfunction ageotype; green, kidney dysfunction ageotype. The darkness of shading reflects the magnitude of the aging trend, with red denoting a positive correlation and blue denoting a negative correlation. The magnitude (MAG) of the aging association and the Wald score are indicated above the heatmaps (see Methods for details). c, Overall patterns of the four ageotypes for 43 participants in the cohort, ordered by the magnitude of their immunity ageotype. The color-coding scheme is the same as described for b.
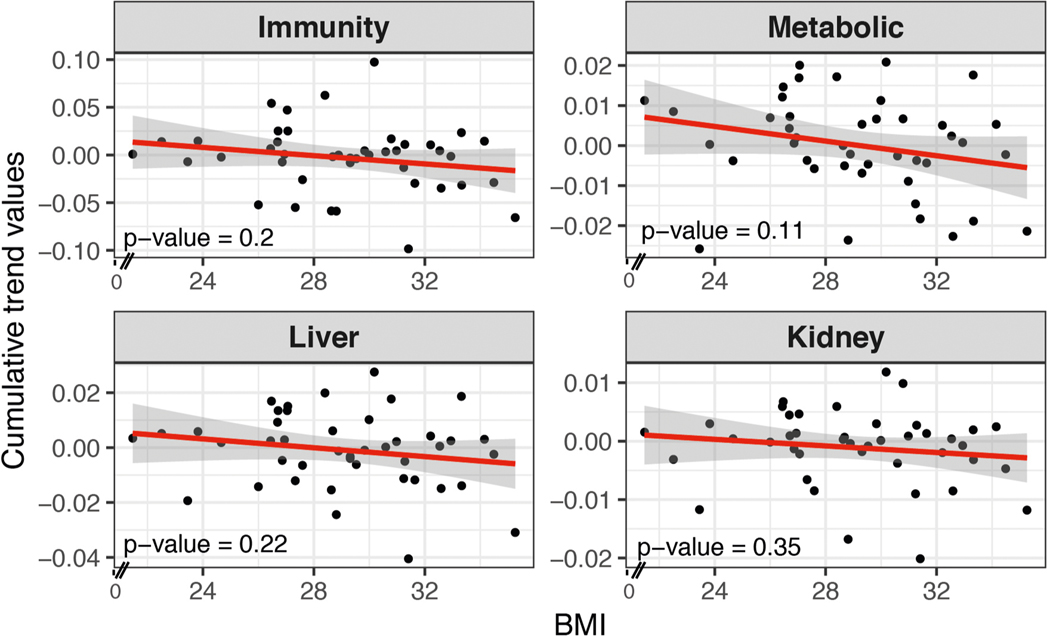
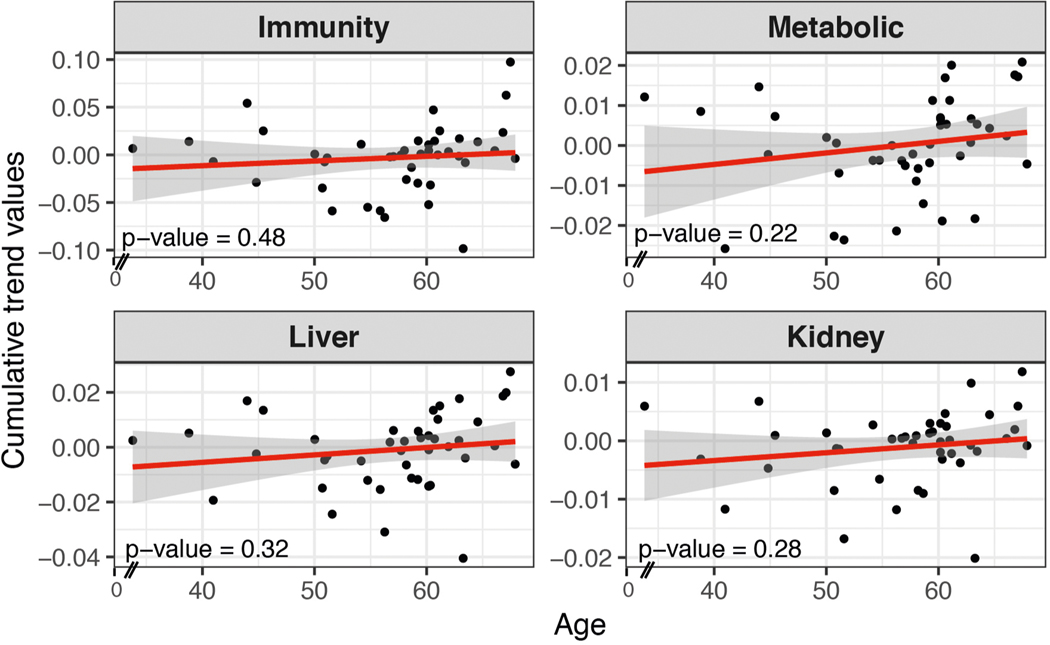
We systematically grouped people into ageotypes, and found that different individuals had distinct ageotypes (Fig. 4c and Supplementary Table 18). For instance, individual ZNED4XZ had relatively strong aging magnitudes in kidney dysfunction pathways, but displayed minor changes in other pathways. ZM7JY3G displayed strong patterns in metabolic pathways and kidney dysfunction, but not in immune or liver dysregulation. Many individuals displayed strong liver, kidney, metabolic and immune ageotypes, indicating that they were aging in all four pathways. We did not observe any association between ageotypes and BMI, chronological age or IR and IS status (Extended Data Figs. 3–5 and Supplementary Table 18).
Human aging is due to a combination of factors from genetics to environmental factors, such as an individual’s lifestyle and exposure, and as such is very heterogeneous33. Our study investigates aging at the individual level by frequent sampling and deep molecular profiling over a time period that is potentially actionable. In contrast to other studies, which have focused on epigenomics and telomeres, we found many more different types of molecules, such as transcripts, proteins and metabolites as well as the microbiome, that were associated with age, including 87 significant molecules (Spearman, FDR < 0.1) and 84 significant pathways (P < 0.05). Immune and inflammation pathways were found to be among the major pathways that change with aging.
We have studied aging patterns of individuals who are IR and IS using multiomics data and identified several molecules that correlate differently in these individuals. Many of these reside in the inflammation and related immune pathways in individuals with IR, suggesting that individuals with IR may experience increased inflammation with age more rapidly than individuals with IS.
This rich multiomic dataset on multiple visits of 43 individuals provided the opportunity to study personal aging markers and patterns. Longitudinal profiling for up to 4 years and with five or more samples per individual provided the required statistical power to help find the markers and pathways that correlate with aging. The general trends of the personal aging markers followed those of the cross-sectional markers; however, detailed analyses of the clinical markers revealed personal differences, with some individuals displaying negative trends of aging markers. Some of these differences were likely due to interventions in the personal life of the individuals, such as lifestyle changes (such as, weight loss), suggesting that these markers are actionable and that lifestyle changes can be used to alter an individual’s aging pattern. In other cases, the source of the improvement in aging markers (such as, the four cases where creatinine was decreased) is not clear.
Here, distinct pathways associated with age in each individual have been revealed. For example, in individual ZOZOW1T, the coagulation pathway was the pathway most strongly correlated with age. However, for individual ZN3TBJM, the cardiac hypertrophy pathway was the pathway most correlated with aging, suggesting alterations in heart function. These differences may be due to individual genetics, personal life habits, medical history or life stresses. We monitored lifestyle (diet and physical activity) and medication for most participants and did not observe obvious changes for most (with the exceptions noted), indicating that differences are either intrinsic or due to more subtle lifestyle changes.
In addition to individual ageotypes, we defined four main pathways enriched with aging using the longitudinal data from 43 individuals. Our analysis shows that some individuals fall strongly into one or more of these aging pathways, suggesting that they have distinct ageotypes. Improvements in lifestyle can presumably affect one or more ageotypes. Indeed, individuals ZL9BTWF and ZK112BX lost weight during the course of our study and improved in multiple clinical markers associated with multiple pathways. It is possible that improvements in ageotype can be targeted at the individual pathway level (such as, immune function or metabolic pathways) using selective interventions (such as, drugs) or in aggregate using broad lifestyle changes. The availability of personal timedependent aging markers potentially enables aging to be acted upon at an individual level.
Online content
Any methods, additional references, Nature Research reporting summaries, source data, extended data, supplementary information, acknowledgements, peer review information; details of author contributions and competing interests; and statements of data and code availability are available at https://doi.org/10.1038/s41591019-0719-5.
Methods
The data supporting the findings of this study are available within the paper and its Supplementary Information files. The study design, participant recruitment, sample preparation, multiomics assay descriptions and data processing methods are documented by Zhou et al.13 and Schüssler-Fiorenza Rose et al.14. This section describes analyses specific to this study.
Validation cohort.
To validate the proteomics and standard clinical tests of the cross-sectional aging study, a cohort of 31 healthy individuals (14 females and 17 males) between the ages of 21 and 75 years (median age of 37 years) was recruited under research study protocol 34563, approved by the Stanford University Institutional Review Board. All participants provided group consent. Participants were recruited through announcements at a scientific conference. This study complies with all relevant ethical regulations and informed written consent was obtained from all participants. Supplementary Table 19 lists information on each individual, such as sex, age, ethnicity, fasting glucose, HbA1c and some of the clinical lipid results. Briefly, plasma and serum were prepared from blood collected from fasted individuals. The plasma samples were profiled using SWATH-MS15 and clinical test results were collected from the serum. Molecules associated with age were identified as described in the next section.
Cross-sectional correlations with aging.
For molecular associations with aging, the median value of each measurement at all healthy baselines per participant was tested for association with median age values. For aging association, Spearman correlation was calculated with the cor.test() function in the R stats package (v.3.5.0).
Individuals in our cohort were classified by an SSPG test into IR and IS groups, in which 35 individuals with SSPG values higher than 150 mg dl−1 were considered as being IR and 31 with an SSPG lower than 150 mg dl−1 were designated as being IS12.
To compare correlations specific to IR and IS subgroups, the median values from 35 participants who were IR and 31 participants who were IS were used, treating BMI as a confounding factor, using the pcor.test() function in the R ppcor package (v.1.1). The IR and IS difference in the aging association was further tested in rank-based linear regression models with an interaction term as implemented in rfit(Exp ~ days × IR/IS) in the Rfit package (v.0.23.0), where Exp represents the normalized value per molecule.
Pathway-enrichment analysis.
Pathway-enrichment analysis was performed using Qiagen Ingenuity Pathway Analysis (IPA). For cross-sectional studies, significant molecules (P < 0.05, before multiple-hypothesis correction) were used for analysis to consider contributions from all omics data types. Fisher’s exact test in the IPA software was used for calculating the FDR and a cutoff of FDR < 0.05 was set for pathways. IPA and interpretation were based on the comprehensive and manually curated content of the Ingenuity Knowledge Base, which organizes biological interactions and functional annotations created from primary literature and public and third-party databases (Qiagen; https://www.qiagenbioinformatics.com/products/ingenuitypathway-analysis).
Linear regression analysis for personal aging trends.
Longitudinal measurements from each ome were linearly transformed before normalizing to a standard distribution N ~ (0,1) across all healthy visits. For each individual, a delta change at each visit was calculated by subtracting measurements from the initial baseline value. Accordingly, the day since onset was calculated as the number of days from the first baseline measurement. For each individual, a rank-based (nonparametric) linear regression was implemented to correlate the change in value versus the day since onset for each analyte. The correlation coefficient rho and P values of Spearman correlation were calculated using the rcorr() function in the R Hmisc package (v.4.1–1). The slope and Wald statistic score of the regression line were calculated using the rfit() function in the R rfit package (v.0.23.0). A Wald score was used to test the general linear hypothesis as follows:
where β is the regression coefficient and M is the data matrix.
For dietary eating habits, a validated short dietary assessment34 was used to collect participants’ food frequency changes on the same day as the visit. We collected more than 300 fully completed instruments for 28 individuals during the study. The frequency responses to 25 food categories were converted to numeric values before downstream analysis. The 25 food categories included were: (1) slices of bread or rolls, (2) biscuits, (3) cakes, scones, sweet pies or pastries, (4) breakfast cereal, (5) fresh fruit, (6) cooked green vegetables, (7) cooked root vegetables, (8) raw vegetables or salad, (9) chips, (10) potatoes, pasta or rice, (11) meat, (12) meat products, (13) poultry, (14) white fish, (15) oil-rich fish, (16) cheese, (17) beans or pulses, (18) sweets or chocolates, (19) ice cream, (20) crisps or savory snacks, (21) fruit juice, (22) soft or fizzy drinks, (23) cakes, scones or sweet pies, (24) pastries and (25) biscuits. The frequencies of 6+ times per day, 4–5 times per day, 2–3 times per day, once per day, 5–6 times per week, 2–4 times per week, once per week, 1–3 times per month and less than once per month were converted to 0–8, respectively. The associations of these eating habits with aging (in days) during the study followed the Spearman correlation analysis as above. In this case, a positive rho indicated a decrease in the frequency of food intake, whereas a negative rho indicated an increase in the frequency of food intake.
To score changes in medications, we specifically examined statins and other cholesterol-lowering medications (including atorvastatin, fluvastatin, Niaspan, cholestyramine, fenofibrate and gemfibrozil), as well as metformin and other glucose-control medications (including insulin, acarbose, albiglutide, alogliptin, dapagliflozin, glimepiride, linagliptin, metformin and sitagliptin). We manually scanned each participant’s electronic health record that aligned with the study window (from the enrollment date of each participant to the last visit analyzed) and examined medication prescription start and end dates to assess changes in medication over the course of the study.
In a second method, we used linear mixed-effects models to account for the dependence within participants. To avoid bias caused by different time windows measured for each individual, we focused on changes that occurred within the first 1,200 d. Results are summarized in Supplementary Table 6. We used rmcor, a method that is close to a null multilevel model of varying intercept and a common slope for each individual, and specifically tests for a common association between variables (expression or abundance of an analyte and number of days since onset) within each participant. rmcorr calculates an effect size to appropriately represent the degree to which each participant’s data is reflected by the common slope of the best-fit parallel lines. The rmcorr method takes a meta-analytic approach and calculates rrm (error degrees of freedom (d.f.)), P value (determined by the F ratio: F(measure d.f. (1), error d.f.)) and a 95% confidence interval (CI) of effect sizes. When the relationship between variables (expression or abundance of an analyte and number of days since onset) varies widely across participants, the rmcorr effect size will be near zero with the CI also near zero. When there is no strong heterogeneity across participants and parallel lines provide a good fit, the rmcorr effect size will be large, with a tight CI. To calculate the intraclass correlation coefficient, we first linearly transformed each analyte (when applicable) and standardized the total variation to 1, before applying the lmer() function from the lme4 R package, with the formula as lmer(Exp ~ 1 + days + A1C + SSPG + FPG + (1|SubjectID), data = dataset, REML = FALSE), in which Exp was linearly transformed and standardized values of each analyte were obtained. FPG was the fasting plasma glucose as one of the clinical lab tests, and restricted maximum likelihood (REML) was one method implemented in the lmer function. We thereby calculated the intraclass correlation coefficient as the proportion of total variation explained by subject structure in the cohort by Vrandom subject/(Vrandom subject + Vrandom residual), where V was the variance from the corresponding component extracted by VarCorr().
Physical activity was assessed using the IPAQ short form, a validated measure of physical activity35. The IPAQ was scored per protocol using an automated scoring Excel worksheet to obtain the estimated total metabolic equivalent of task minutes per week of exercise. Proc reg in SAS 9.4 was used to regress the estimated metabolic equivalent of task minutes per week on time for each individual to determine whether there had been a significant change in physical activity.
Phenotypic age was calculated using the equation provided by Liu et al.27,28 that uses chronological age and nine biomarkers, including albumin, creatinine, glucose, log (C-reactive protein), lymphocyte percent, mean cell volume, RDW, ALKP and white blood cell count. Proc reg in SAS 9.4 was used to regress phenotypic age on age to determine individual slopes. Proc mixed was used to determine the overall sample slope for the model using a linear mixed model that regressed phenotypic age on age and allowed for intercept and age as random effects grouped by participant. We used the maximum-likelihood method of estimation, the between–within degrees of freedom method and an unstructured covariance matrix.
Personal aging pathways, major grouping and ageotypes.
For pathway enrichment for ageotype analysis, 608 molecules (Supplementary Table 11) that were significant in at least six individuals (P < 0.05, before multiple-hypothesis correction) were counted to balance the individual versus group components of the pattern. Pathway-enrichment analysis was performed using Qiagen IPA as above and 107 canonical pathways and 147 toxicity pathways were found to be significantly enriched (P < 0.05; Supplementary Table 12). To group those pathways into superfamilies of pathways, we merged two pathways in a pairwise fashion into one if the two had identical molecules for more than 60% of the pathway of the smaller size. Supplementary Table 13 lists the largest four superfamilies and the components of pathways merged. We defined ageotype patterns on the basis of the four superfamilies of pathways. We calculated the magnitude of the ageotype as the sum of regression coefficients in the linear regression models in which the molecules were associated with aging (in days) from each superfamily. If data were missing, individual molecules were excluded and had no effect on this summed slope. Low magnitudes meant a relatively low (or reserved) magnitude of increased changes over time compared to the highest changes that we observed in the cohort. Furthermore, average Wald scores were calculated as the mean of Wald statistics across all molecules from each superfamily, to test the probability of β, the regression coefficient of any molecule in that superfamily, being different from zero.
Summary of statistics.
The statistical method for each analysis is described in each of the above sections. To summarize, for aging associations, the correlation coefficient and P value were calculated by Spearman correlation and trends of normalized molecular expression to the days since onset were calculated by rank-based linear regression. Multiple-hypothesis testing was performed to count the dimensions of molecules being tested. Additionally, the Wald score was used to test the probability of the regression coefficient being different from zero. Also see the Nature Research Reporting Summary for details of statistics and analysis.
Reporting Summary.
Further information on research design is available in the Nature Research Reporting Summary linked to this article.
Data availability
Raw data included in this study are hosted on the NIH Human Microbiome 2 project site (https://portal.hmpdacc.org) with no restrictions on their use. Exome sequencing data are also available at dbGaP under study accession phs001719. v1.p1. Both raw and processed data are also hosted on the Stanford iPOP site (http://med.stanford.edu/ipop.html). For additional information regarding the study, please contact the corresponding author.
Extended Data
Extended Data Fig. 1 |. Significant analytes associated with aging in the cross-section cohort (n = 106).
Left: number of significant multi-omics molecules correlating with age based on p-value threshold (before multiple hypothesis correction). right: The categories and their corresponding percentage (frequency) of metabolites significantly associated with the age. Significance is based on the Spearman rank tests.
Extended Data Fig. 2 |. Scatter plot of number of significant molecules with the age in longitudinal data of 43 individuals.
(Intentionally blank).
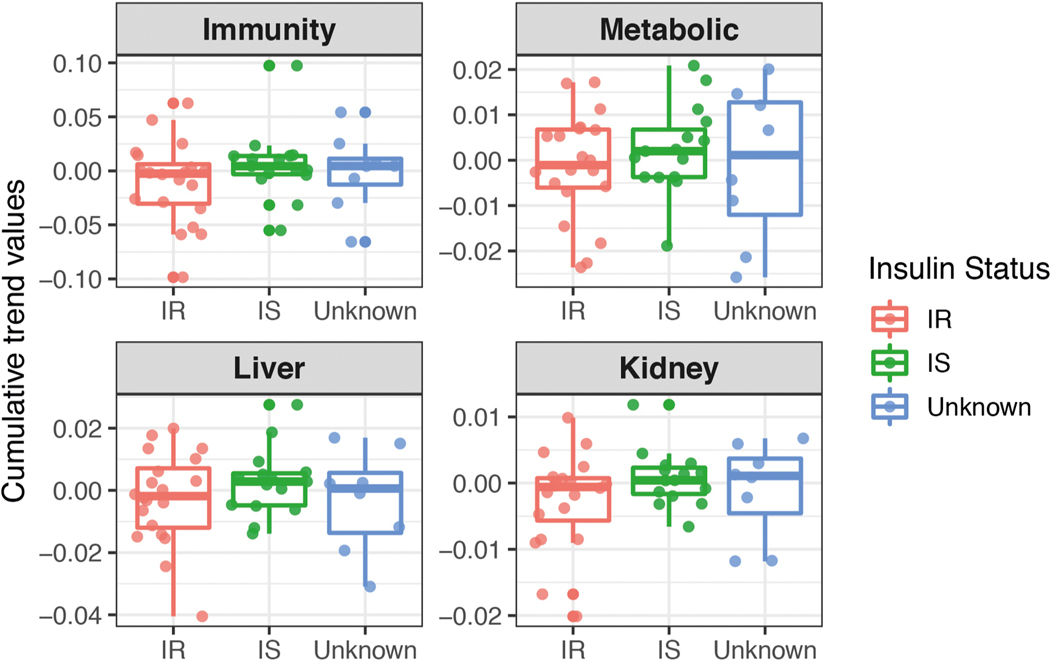
Extended Data Fig. 3 |. Scatter plot showing associations of the magnitude (cumulative trend values of contributing molecules) of each ageotpes with BMi based on 43 individuals.
Associations are not significant. Significance is calculated in the linear regression model.
Extended Data Fig. 4 |. Scatter plot showing associations of the magnitude (cumulative trend values of contributing molecules) of each ageotpes with Age based on 43 individuals.
Associations are not significant. Significance is calculated in the linear regression model.
Extended Data Fig. 5 |. Scatter plot showing associations of the magnitude (cumulative trend values of contributing molecules) of each ageotpes with insulin-resistant/sensitive status based on 43 individuals.
Associations are not significant. Significance is calculated in the linear regression model.
Supplementary Material
Acknowledgements
We thank numerous colleagues who contributed to this study, including all the authors of the Zhou et al. study13. We thank the Stanford Center for Genomics and Personalized Medicine (SCGPM) for providing the computing and data storage resources. We also thank the Jackson Laboratory for Genomic Medicine for contributing to this project. This work was supported by grants from the National Institutes of Health (NIH) Common Fund Human Microbiome Project (U54DK102556), by a grant award to the SCGPM Genome Sequencing Service Center (NIH, S10OD020141), by the Stanford Clinical and Translational Science Award to Spectrum (NIH, UL1TR001085) and by the Diabetes Genomics and Analysis Core of the Stanford Diabetes Research Center (P30DK116074). S.M.S.-F.R. was supported by NIH grant K08 ES028825.
Footnotes
Competing interests
M.S. is a cofounder of Personalis, Qbio, Sensomics, Mirvie, Filtricine, Protos and January. He is on the scientific advisory board of Jungla, Jupiter and Genapsys.
Publisher’s note Springer Nature remains neutral with regard to jurisdictional claims inpublished maps and institutional affiliations.
References
- 1.Lopez-Otin C, Blasco MA, Partridge L, Serrano M & Kroemer G The hallmarks of aging. Cell 153, 1194–1217 (2013). [DOI] [PMC free article] [PubMed] [Google Scholar]
- 2.Aunan JR, Cho WC & Soreide K The biology of aging and cancer: a brief overview of shared and divergent molecular hallmarks. Aging Dis. 8, 628–642 (2017). [DOI] [PMC free article] [PubMed] [Google Scholar]
- 3.Hung CW, Chen YC, Hsieh WL, Chiou SH & Kao CL Ageing and neurodegenerative diseases. Ageing Res. Rev. 9(Suppl. 1), S36–S46 (2010). [DOI] [PubMed] [Google Scholar]
- 4.Kalyani RR & Egan JM Diabetes and altered glucose metabolism with aging. Endocrinol. Metab. Clin. North Am. 42, 333–347 (2013). [DOI] [PMC free article] [PubMed] [Google Scholar]
- 5.Steenman M & Lande G Cardiac aging and heart disease in humans. Biophys. Rev. 9, 131–137 (2017). [DOI] [PMC free article] [PubMed] [Google Scholar]
- 6.Field AE et al. DNA methylation clocks in aging: categories, causes, and consequences. Mol. Cell 71, 882–895 (2018). [DOI] [PMC free article] [PubMed] [Google Scholar]
- 7.Horvath S DNA methylation age of human tissues and cell types. Genome Biol. 14, R115 (2013). [DOI] [PMC free article] [PubMed] [Google Scholar]
- 8.Lu AT et al. DNA methylation GrimAge strongly predicts lifespan and healthspan. Aging 11, 303–327 (2019). [DOI] [PMC free article] [PubMed] [Google Scholar]
- 9.Pani LN et al. Effect of aging on A1C levels in individuals without diabetes: evidence from the Framingham Offspring Study and the National Health and Nutrition Examination Survey 2001–2004. Diabetes Care 31, 1991–1996 (2008). [DOI] [PMC free article] [PubMed] [Google Scholar]
- 10.Bonomini F, Rodella LF & Rezzani R Metabolic syndrome, aging and involvement of oxidative stress. Aging Dis. 6, 109–120 (2015). [DOI] [PMC free article] [PubMed] [Google Scholar]
- 11.Gutch M, Kumar S, Razi SM, Gupta KK & Gupta A Assessment of insulin sensitivity/resistance. Indian J. Endocrinol. Metab. 19, 160–164 (2015). [DOI] [PMC free article] [PubMed] [Google Scholar]
- 12.Knowles JW et al. Measurement of insulin-mediated glucose uptake: direct comparison of the modified insulin suppression test and the euglycemic, hyperinsulinemic clamp. Metabolism 62, 548–553 (2013). [DOI] [PMC free article] [PubMed] [Google Scholar]
- 13.Zhou W et al. Longitudinal of host–microbe dynamics in prediabetes. Nature 569, 663–671 (2019). [DOI] [PMC free article] [PubMed] [Google Scholar]
- 14.Schüssler-Fiorenza Rose SM et al. A longitudinal big data approach for precision health. Nat. Med. 25, 792–804 (2019). [DOI] [PMC free article] [PubMed] [Google Scholar]
- 15.Wetzels JF, Kiemeney LA, Swinkels DW, Willems HL & den Heijer M Age- and gender-specific reference values of estimated GFR in Caucasians: the Nijmegen Biomedical Study. Kidney Int. 72, 632–637 (2007). [DOI] [PubMed] [Google Scholar]
- 16.Edelberg JM, Cai D & Xaymardan M Translation of PDGF cardioprotective pathways. Cardiovasc. Toxicol. 3, 27–35 (2003). [DOI] [PubMed] [Google Scholar]
- 17.Pola R et al. Age-dependent VEGF expression and intraneural neovascularization during regeneration of peripheral nerves. Neurobiol. Aging 25, 1361–1368 (2004). [DOI] [PubMed] [Google Scholar]
- 18.Kolovou G et al. Ageing mechanisms and associated lipid changes. Curr. Vasc. Pharmacol. 12, 682–689 (2014). [DOI] [PubMed] [Google Scholar]
- 19.Biagi E et al. Through ageing, and beyond: gut microbiota and inflammatory status in seniors and centenarians. PLoS ONE 5, e10667 (2010). [DOI] [PMC free article] [PubMed] [Google Scholar]
- 20.Galkin F et al. Human microbiome aging clocks based on deep learning and tandem of permutation feature importance and accumulated local effects. Preprint at bioRxiv 10.1101/507780 (2018). [DOI] [Google Scholar]
- 21.Bonafe M et al. Polymorphic variants of insulin-like growth factor I (IGF-I) receptor and phosphoinositide 3-kinase genes affect IGF-I plasma levels and human longevity: cues for an evolutionarily conserved mechanism of life span control. J. Clin. Endocrinol. Metab. 88, 3299–3304 (2003). [DOI] [PubMed] [Google Scholar]
- 22.Mori K et al. Fetuin-A is associated with calcified coronary artery disease. Coron. Artery Dis. 21, 281–285 (2010). [DOI] [PubMed] [Google Scholar]
- 23.Reiner AP et al. PROC, PROCR and PROS1 polymorphisms, plasma anticoagulant phenotypes, and risk of cardiovascular disease and mortality in older adults: the Cardiovascular Health Study. J. Thromb. Haemost. 6, 1625–1632 (2008). [DOI] [PMC free article] [PubMed] [Google Scholar]
- 24.Franceschi C & Campisi J Chronic inflammation (inflammaging) and its potential contribution to age-associated diseases. J. Gerontol. A Biol. Sci. Med. Sci. 69(Suppl. 1), S4–S9 (2014). [DOI] [PubMed] [Google Scholar]
- 25.Peters MJ et al. The transcriptional landscape of age in human peripheral blood. Nat. Commun. 6, 8570 (2015). [DOI] [PMC free article] [PubMed] [Google Scholar]
- 26.Bae E, Kim HE, Koh E & Kim KS Phosphoglucomutase1 is necessary for sustained cell growth under repetitive glucose depletion. FEBS Lett. 588, 3074–3080 (2014). [DOI] [PubMed] [Google Scholar]
- 27.Liu Z et al. A new aging measure captures morbidity and mortality risk across diverse subpopulations from NHANES IV: a cohort study. PLoS Med. 15, e1002718 (2018). [DOI] [PMC free article] [PubMed] [Google Scholar]
- 28.Liu Z et al. Correction: a new aging measure captures morbidity and mortality risk across diverse subpopulations from NHANES IV: a cohort study. PLoS Med. 16, e1002760 (2019). [DOI] [PMC free article] [PubMed] [Google Scholar]
- 29.Carter TA et al. Mechanisms of aging in senescence-accelerated mice. Genome Biol. 6, R48 (2005). [DOI] [PMC free article] [PubMed] [Google Scholar]
- 30.Ross GR et al. Enhanced store-operated Ca2+ influx and ORAI1 expression in ventricular fibroblasts from human failing heart. Biol. Open 6, 326–332 (2017). [DOI] [PMC free article] [PubMed] [Google Scholar]
- 31.Kreienkamp R et al. A cell-intrinsic interferon-like response links replication stress to cellular aging caused by progerin. Cell Rep. 22, 2006–2015 (2018). [DOI] [PMC free article] [PubMed] [Google Scholar]
- 32.Ma X et al. The nuclear receptor RXRA controls cellular senescence by regulating calcium signaling. Aging Cell 17, e12831 (2018). [DOI] [PMC free article] [PubMed] [Google Scholar]
- 33.Cevenini E et al. Human models of aging and longevity. Expert Opin. Biol. Ther. 8, 1393–1405 (2008). [DOI] [PubMed] [Google Scholar]
- 34.Lean MEJ, Anderson AS, Morrison C & Currall J Evaluation of a dietary targets monitor. Eur. J. Clin. Nutr. 57, 667–673 (2003). [DOI] [PubMed] [Google Scholar]
- 35.Hagströmer M, Oja P & Sjöström M The International Physical Activity Questionnaire (IPAQ): a study of concurrent and construct validity. Public Health Nutr. 9, 755–762 (2006). [DOI] [PubMed] [Google Scholar]
Associated Data
This section collects any data citations, data availability statements, or supplementary materials included in this article.
Supplementary Materials
Data Availability Statement
Raw data included in this study are hosted on the NIH Human Microbiome 2 project site (https://portal.hmpdacc.org) with no restrictions on their use. Exome sequencing data are also available at dbGaP under study accession phs001719. v1.p1. Both raw and processed data are also hosted on the Stanford iPOP site (http://med.stanford.edu/ipop.html). For additional information regarding the study, please contact the corresponding author.


