

Abstract
Background
In recent years, increased attention has been focused on breast muscle yield and meat quality in poultry production. Supplementation with nicotinamide and butyrate sodium can improve the meat quality of broilers. However, the potential molecular mechanism is not clear yet. This study was designed to investigate the effects of supplementation with a combination of nicotinamide and butyrate sodium on breast muscle transcriptome of broilers under high stocking density. A total of 300 21-d-old Cobb broilers were randomly allocated into 3 groups based on stocking density: low stocking density control group (L; 14 birds/m2), high stocking density control group (H; 18 birds/m2), and high stocking density group provided with a combination of 50 mg/kg nicotinamide and 500 mg/kg butyrate sodium (COMB; 18 birds/m2), raised to 42 days of age.
Results
The H group significantly increased cooking losses, pH decline and activity of lactate dehydrogenase in breast muscle when compared with the L group. COMB showed a significant decrease in these indices by comparison with the H group (P < 0.05). The transcriptome results showed that key genes involved in glycolysis, proteolysis and immune stress were up-regulated whereas those relating to muscle development, cell adhesion, cell matrix and collagen were down-regulated in the H group as compared to the L group. In contrast, genes related to muscle development, hyaluronic acid, mitochondrial function, and redox pathways were up-regulated while those associated with inflammatory response, acid metabolism, lipid metabolism, and glycolysis pathway were down-regulated in the COMB group when compared with the H group.
Conclusions
The combination of nicotinamide and butyrate sodium may improve muscle quality by enhancing mitochondrial function and antioxidant capacity, inhibiting inflammatory response and glycolysis, and promoting muscle development and hyaluronic acid synthesis.
Keywords: Stocking density, Broiler, Nicotinamide, Butyrate sodium, Transcriptome
Background
Intensive stocking in the rapidly developing poultry industry worldwide has become a norm. However, high stocking density causes oxidative stress in broilers [1] and reduces the tenderness and increases the drip loss of breast muscle [2, 3]. Oxidation is one of the leading reasons for the deterioration of meat quality [4], and oxidative stress causes protein and lipid peroxidation as well as cellular damage [5, 6] which ultimately affects meat quality [7]. Nicotinamide (NAM) reduces oxidative stress and inhibits reactive oxygen species (ROS) production [8, 9]. Dietary supplementation with NAM has been observed to minimize the formation of carbonylated proteins in the liver of high-fat fed mice [10]. Butyrate sodium (BA) could also improve antioxidant capacity in a human study [11]. Further, the addition of BA can enhance the activities of superoxide dismutase and catalase and reduce the level of malondialdehyde in serum [12]. Butyrate treatment has been reported to decrease the levels of markers of oxidative stress and apoptosis in mice [13]. As treatment with NAM and BA both can elevate antioxidant capacity and muscle function, it may improve the muscle quality of broilers under high stocking density. Dietary supplementation with 60 mg/kg niacin (NAM precursor) reduces the drip loss of breast muscles in broilers [14]. Dietary supplementation with BA can increase broiler weight, decrease abdominal fat percentage [15], and reduce intramuscular fat content [16].
Mitochondrial biogenesis has previously been associated with preservation of muscle mass and beneficial effects on metabolism [17]. Peroxisome proliferator-activated receptor-γ coactivator 1α (PGC1α) is a crucial regulator of mitochondrial biogenesis. Replenishment with nicotinamide adenine dinucleotide (NAD) induces mitochondrial biogenesis by increasing PGC1α expression [18, 19]. NAM is the primary source of NAD which is obtained through the salvage pathway. As a precursor of NAD, treatment with NAM also enhances PGC-1α expression [20]. Impaired intramuscular NAD synthesis compromises skeletal muscle mass and strength over time, which can be quickly restored with an oral NAD precursor [21]. Besides, NAD biosynthesis alleviates muscular dystrophy in a zebrafish model [22] and promotes muscle function in Caenorhabditis elegans [23]. Addition of niacin (precursor of NAM) has been reported to increase the number of oxidative type I fibres in skeletal muscles of growing pigs [24] and induce type II to type I muscle fibre transition in sheep [25]. Further, supplementation with butyrate increases mitochondrial function and biogenesis of skeletal muscle in mice and rats [26, 27]. Further, the intake of BA increases the percentage of type 1 fibres [26, 28] and muscle fibre cross-sectional area in skeletal muscle [13].
Although supplementation with NAM or BA alone can elevate antioxidant capacity and improve the meat quality of broilers, the effect of combined supplementation with NAM and BA on the meat quality of broilers is not clear yet. Therefore, we performed transcriptome sequencing of broiler breast muscles to elucidate the molecular mechanism of the effect of feeding density and nutrient regulation on meat quality.
Results
Production performance and meat quality
There is no significant difference among the H, L and COMB group in corresponding to FI, BW, BWG and FCR (P > 0.05) (Table 1). Compared with the L group, the H group showed significantly increased cooking loss of breast muscle (P < 0.05). The COMB group showed decreased cooking loss compared with the H group (P < 0.05). Besides, the drip loss in the COMB group was lower than that in the L group, as well (P < 0.05) (Fig. 1).
Table 1.
Production performance of broilers
| L | H | COMB | SEM | P-value | |
|---|---|---|---|---|---|
| FI /g | 2843 | 2844 | 2844 | 27.8 | 1.000 |
| BW /g | 2788 | 2745 | 2773 | 25.6 | 0.802 |
| BWG /g | 1610 | 1533 | 1567 | 23.6 | 0.439 |
| FCR | 1.77 | 1.86 | 1.82 | 0.02 | 0.188 |
Production performance included FI (feed intake), BW (body weight), BWG (body weight gain) and FCR (feed conversion ratio)
Fig. 1.

Water holding capacity of breast muscle. Data are shown as the means ± SEM. Different letters a, b indicate that there are significant differences (P < 0.05) among these groups. L, low stocking density (14 birds/m2); H, high stocking density (18 birds/m2); COMB, combination of NAM and BA (18 birds/m2)
The 45-min pH value in the H group was higher than that in the other 2 groups (P < 0.05) while there was no significant difference in 24-h pH values among the groups. Thus, the pH decline during 45 min to 24 h in the H group was significantly higher than that in the other 2 groups, indicating that the H group had rapid pH drop rate, which was attenuated in the COMB group under high stocking density (Fig. 2).
Fig. 2.

The pH values of breast muscle. Data are shown as the means ± SEM. Different letters a, b indicate that there are significant differences (P < 0.05) among these groups. L, low stocking density (14 birds/m2); H, high stocking density (18 birds/m2); COMB, combination of NAM and BA (18 birds/m2)
Anti-oxidant capacity
The stocking density significantly altered the activity of LDH (P = 0.022). The activity of LDH in the H group was higher (P < 0.05) than that in the L group. The COMB group had significantly decreased (P < 0.05) activity of LDH when compared with the H group. However, stocking density had no significant effect on the activities of CK, T-AOC, MDH, anti-superoxide anion and the content of hydroxyproline (Table 2).
Table 2.
Enzyme activities of the breast muscle
| L | H | COMB | SEM | P-value | |
|---|---|---|---|---|---|
| CK /U/mgprot | 2.51 | 2.41 | 2.25 | 0.12 | 0.702 |
| LDH /U/gprot | 450.38a | 724.10b | 383.22a | 56.74 | 0.022 |
| T-AOC /U/mgprot | 100.81 | 82.17 | 86.01 | 8.25 | 0.650 |
| MDH /U/mgprot | 1.37 | 1.21 | 1.53 | 0.08 | 0.252 |
| Anti-superoxide anion /U/gprot | 10.30 | 9.32 | 10.39 | 0.39 | 0.489 |
| Hydroxyproline /μg/mg | 155.56 | 164.22 | 172.01 | 8.51 | 0.755 |
RNA sequencing data and differentially expressed genes (DEGs)
In the principal component analysis (PCA), there was a clear divergence among the H, L and COMB groups. In the Venn diagram, the number of identified genes in the H, L and COMB were 11,777, 12,554 and 11,633, respectively (Fig. 3). Compared with the H group, the number of DEGs in the L group and COMB group were 3752 and 773, respectively (Fig. 4).
Fig. 3.

Principal Component Analysis (PCA) and Wayne (VEEN) analysis of gene sets. For the PCA graph, the distance between each sample point represents the distance of the sample. The closer the distance means higher the similarity between samples; for the VEEN graph, the numbers inside the circle represents the sum of the number of expressed genes in the group. The crossover region represents the number of consensus expressed genes for each group
Fig. 4.

Volcanic map of differential expression genes. The abscissa is the fold change of the gene expression difference between the two samples and the ordinate is the statistical test value of the gene expression. Each dot in the figure represents a specific gene, the red dot indicates a significantly up-regulated gene, the green dot indicates a significantly down-regulated gene, and the grey dot is a non-significant differential gene
The gene sets were produced by DEGS. From Venn analysis of genes sets, we found that there were 1310 genes shared in common between the COMB group and the L group. Nevertheless, there were only 6 genes owed by both the COMB group and the H group. Similarly, from the iPath map of metabolic pathways, there were a total of 830 pathways annotated in common. In contrast, there was only 1 pathway owed by both the COMB group and the H group (Fig. 5).
Fig. 5.

The Veen diagram and the map of Kyoto Encyclopedia of Genes and Genomes (KEGG) pathways analysis of gene sets. For VEEN diagram: the sum of all the numbers inside the circle represents the total gene of the set. The number, circle intersection area represents the number of shared genes among the gene sets. For the map of KEGG metabolic pathway, the red represents the pathway of the common annotation of the genes in the gene sets of two groups. We thank Kanehisa Laboratories for providing the copyright permission of KEGG pathway maps [29]
Up-regulated genes in the H group
Compared with those in the L group, a total of 1894 genes were up-regulated in the H group (Fig. 4), which were mainly involved in muscle contraction, cell localization, ion transport, lipid metabolism, glycolysis, proteolysis, and immune stress (Fig. 6).
Fig. 6.

GO enrichment analysis of up-regulated genes in the H group. The abscissa indicates the GO term, and the ordinate indicates the enrichment ratio. “*“means P < 0.05, “**“means P < 0.01 and “***” means P < 0.001
Muscle contraction-related pathways were enriched in the H group. They involved vital genes including MYLK2, NOS1, TMOD4, and Six1 (Table 3). The H group was enriched for cell-localization-related genes such as KEAP1, CDKN1A, ERBB4, and TMOD4 (Table 3). Additionally, high-density up-regulated ion and amino acid transport-related genes included KCNJ12, KCNA7, SLC38A3 and SLC38A4, which are involved in ion transmembrane transport and transporter activity (Table 4). High-density enriched glycolysis-related pathways included fructose metabolism, fructose-2,6-diphosphate 2-phosphatase activity, and fructose 2,6-diphosphate metabolism (Table 5). The lipid metabolism-related genes such as MID1IP1, ACACB and Lpin1 were up-regulated in H group, which are involved in lipid synthesis and lipid oxidation (Table 5).
Table 3.
Muscle contraction and cell location related pathways
| GO ID | Term Type | Description | P-value | Genes |
|---|---|---|---|---|
| Muscle contraction related pathways | ||||
| GO:0044449 | CC | contractile fiber part | 0.026498 | NOS1; TMOD4 |
| GO:0006936 | BP | muscle contraction | 0.000194 | MYLK2; NOS1 |
| GO:0006941 | BP | striated muscle contraction | 0.000908 | MYLK2; NOS1 |
| GO:0003012 | BP | muscle system process | 0.00051 | MYLK2; NOS1 |
| GO:0051015 | MF | actin filament binding | 0.002704 | TMOD4 |
| GO:0003779 | MF | actin binding | 0.000614 | TMOD4 |
| GO:0008092 | MF | cytoskeletal protein binding | 0.033316 | TMOD4 |
| GO:0004687 | MF | myosin light chain kinase activity | 0.022364 | MYLK2 |
| Cell location related pathways | ||||
| GO:0051235 | BP | maintenance of location | 0.002093 | KEAP1 |
| GO:0051651 | BP | maintenance of location in cell | 0.000837 | KEAP1 |
| GO:0045185 | BP | maintenance of protein location | 0.000645 | KEAP1 |
| GO:0032507 | BP | maintenance of protein location in cell | 0.000486 | KEAP1 |
| GO:1900180 | BP | regulation of protein localization to nucleus | 0.032179 | KEAP1; CDKN1A; ERBB4 |
| GO:2000010 | BP | positive regulation of protein localization to cell surface | 0.044234 | ERBB4 |
| GO:0042306 | BP | regulation of protein import into nucleus | 0.018345 | KEAP1; CDKN1A; ERBB4 |
| GO:1904589 | BP | regulation of protein import | 0.018837 | KEAP1; CDKN1A; ERBB4 |
Table 4.
Ion transport related pathways
| GO ID | Term Type | Description | P-value | Genes |
|---|---|---|---|---|
| Ion transport related pathways | ||||
| GO:0030001 | BP | metal ion transport | 0.015075 | KCNJ12 |
| GO:0002028 | BP | regulation of sodium ion transport | 0.017458 | NOS1 |
| GO:0051365 | BP | cellular response to potassium ion starvation | 0.011244 | SLC38A3 |
| GO:0006813 | BP | potassium ion transport | 0.030866 | KCNJ12 |
| GO:0034220 | BP | ion transmembrane transport | 0.015681 | SLC38A4; SLC38A3; KCNJ12 |
| GO:0010107 | BP | potassium ion import | 0.004526 | KCNJ12 |
| GO:0006813 | BP | potassium ion transport | 0.030866 | KCNJ12 |
| GO:0098655 | BP | cation transmembrane transport | 0.024337 | SLC38A3; KCNJ12 |
| GO:0006812 | BP | cation transport | 0.027707 | SLC38A3; KCNJ12 |
| GO:0098662 | BP | inorganic cation transmembrane transport | 0.046453 | KCNJ12 |
| GO:0015075 | MF | ion transmembrane transporter activity | 0.008902 | KCNA7; SLC38A4; SLC38A3 |
| GO:0046873 | MF | metal ion transmembrane transporter activity | 0.007993 | KCNJ12 |
| GO:0008324 | MF | cation transmembrane transporter activity | 0.01451 | SLC38A3; KCNJ12 |
| GO:0022890 | MF | inorganic cation transmembrane transporter activity | 0.022537 | KCNJ12 |
| GO:0005261 | MF | cation channel activity | 0.045897 | KCNJ12 |
| GO:0005216 | MF | ion channel activity | 0.03925 | KCNA7; KCNJ12 |
| GO:0015276 | MF | ligand-gated ion channel activity | 0.026498 | KCNJ12 |
| GO:0015079 | MF | potassium ion transmembrane transporter activity | 0.029581 | KCNJ12 |
Table 5.
Glycolysis and lipid metabolism related pathways
| GO ID | Term Type | Description | P-value | Genes |
|---|---|---|---|---|
| Glycolysis related pathways | ||||
| GO:0006000 | BP | fructose metabolic process | 0.038812 | PFKFB1 |
| GO:0004331 | MF | fructose-2,6-bisphosphate 2-phosphatase activity | 0.01682 | PFKFB1 |
| GO:0003873 | MF | 6-phosphofructo-2-kinase activity | 0.022364 | PFKFB1 |
| GO:0050308 | MF | sugar-phosphatase activity | 0.038812 | PFKFB1 |
| GO:0008443 | MF | phosphofructokinase activity | 0.038812 | PFKFB1 |
| GO:0006003 | BP | fructose 2,6-bisphosphate metabolic process | 0.022364 | PFKFB1 |
| Lipid metabolism related pathways | ||||
| GO:0003989 | MF | acetyl-CoA carboxylase activity | 0.044234 | ACACB |
| GO:0019217 | BP | regulation of fatty acid metabolic process | 0.016548 | MID1IP1; ACACB |
| GO:0046949 | BP | fatty-acyl-CoA biosynthetic process | 0.03336 | ACACB |
| GO:0019432 | BP | triglyceride biosynthetic process | 0.03336 | Lpin1 |
| GO:0046463 | BP | acylglycerol biosynthetic process | 0.038812 | Lpin1 |
| GO:0046460 | BP | neutral lipid biosynthetic process | 0.038812 | Lpin1 |
| GO:0046322 | BP | negative regulation of fatty acid oxidation | 0.01682 | ACACB |
| GO:0031998 | BP | regulation of fatty acid beta-oxidation | 0.044234 | ACACB |
| GO:0031999 | BP | negative regulation of fatty acid beta-oxidation | 0.011244 | ACACB |
| GO:0045723 | BP | positive regulation of fatty acid biosynthetic process | 0.027877 | MID1IP1 |
| GO:0010884 | BP | positive regulation of lipid storage | 0.044234 | ACACB |
| GO:2001295 | BP | malonyl-CoA biosynthetic process | 0.011244 | ACACB |
| GO:2001293 | BP | malonyl-CoA metabolic process | 0.01682 | ACACB |
| GO:0010565 | BP | regulation of cellular ketone metabolic process | 0.047727 | MID1IP1; ACACB |
Stress response pathways including non-biologically stimulated cellular responses, extracellular stimuli response and nutritional level response were also enriched in the H group. Furthermore, high-density up-regulated proteolysis-related genes include TINAG, USP24, OTUD1, KEAP1, KLHL34, and SMCR8. Also, high-density enriched immune pathways include the regulation of host defence responses to viruses and prostaglandin receptor-like binding (Table 6).
Table 6.
Proteolysis, immune and stress related pathways
| GO ID | Term Type | Description | P-value | Genes |
|---|---|---|---|---|
| Proteolysis related pathways | ||||
| GO:0008234 | MF | cysteine-type peptidase activity | 0.032179 | TINAG; USP24; OTUD1 |
| GO:0031463 | CC | Cul3-RING ubiquitin ligase complex | 0.028791 | KEAP1; KLHL34 |
| GO:0010499 | BP | proteasomal ubiquitin-independent protein catabolic process | 0.03336 | KEAP1 |
| GO:0010508 | BP | positive regulation of autophagy | 0.034688 | SMCR8 |
| GO:1902902 | BP | negative regulation of autophagosome assembly | 0.03336 | SMCR8 |
| GO:1901096 | BP | regulation of autophagosome maturation | 0.011244 | SMCR8 |
| GO:1901098 | BP | positive regulation of autophagosome maturation | 0.011244 | SMCR8 |
| Immune and stress related pathways | ||||
| GO:0031867 | MF | EP4 subtype prostaglandin E2 receptor binding | 0.005638 | FEM1A |
| GO:0031862 | MF | prostanoid receptor binding | 0.005638 | FEM1A |
| GO:0050691 | BP | regulation of defense response to virus by host | 0.031097 | ALKBH5; ALPK1 |
| GO:0002230 | BP | positive regulation of defense response to virus by host | 0.026558 | ALKBH5; ALPK1 |
| GO:0071214 | BP | cellular response to abiotic stimulus | 0.042948 | CDKN1A; SLC38A3 |
| GO:0009991 | BP | response to extracellular stimulus | 0.022488 | ACACB; CDKN1A; SLC38A3 |
| GO:0031667 | BP | response to nutrient levels | 0.018345 | ACACB; CDKN1A; SLC38A3 |
In Kyoto Encyclopedia of Genes and Genomes (KEGG) enrichment analysis, genes involved in calcium signalling pathway (RYR), inflammatory mediator regulation of RTP channels (PLA2) and chemokine signalling pathway (SOS) (Fig. S1, S2 and S3) were enriched in the H group.
Down-regulated genes in the H group
Compared with those in the L group, a total of 1858 genes were down-regulated in the H group (Fig. 4), which were involved in cell adhesion, cell matrix, and cell migration, etc. (Fig. 7).
Fig. 7.

GO enrichment analysis of down-regulated genes in the H group. The abscissa indicates the GO term, and the ordinate indicates the enrichment ratio. “*“means P < 0.05, “**“means P < 0.01 and “***” means P < 0.001
The genes involved in muscle development include muscle fibre assembly and binding (LMOD2, MYOZ2 and ACTN1, etc.) and muscle fibre development (DSG2, LMOD2 and FSCN1, etc.), which were down-regulated in H group (Table 7). High-density also down-regulated genes related to cell-matrix pathways such as MMP9, FBLN1, THBS4, and VCAN. High-density also down-regulated collagen synthesis and collagen binding related genes including ADAMTS3, ADAMTS14, COL1A2, and LUM (Table 8). Besides, the adhesion-associated genes including DSG2, CSTA, THY1, TGFBI, NOV, CDH11 and FN1 were diminished. Additionally, antioxidant genes including MGST2, PTGS2, NCF1, SOD3, and CYBB were also down-regulated (Table 9).
Table 7.
Muscle development related pathway
| GO ID | Term Type | Description | P-value | Genes |
|---|---|---|---|---|
| Muscle development related pathways | ||||
| GO:0030239 | BP | myofibril assembly | 0.021003 | LMOD2; MYOZ2 |
| GO:0043205 | CC | fibril | 0.008763 | FN1; LTBP1 |
| GO:0045214 | BP | sarcomere organization | 0.045011 | LMOD2; ACTN1 |
| GO:0051017 | BP | actin filament bundle assembly | 9.31E-05 | LIMA1; ACTN1; DPYSL3; FSCN1 |
| GO:0061572 | BP | actin filament bundle organization | 0.00013 | LIMA1; ACTN1; DPYSL3; FSCN1 |
| GO:0007015 | BP | actin filament organization | 0.001785 | LIMA1; LMOD2; ACTN1; DPYSL3; FSCN1 |
| GO:0030036 | BP | actin cytoskeleton organization | 0.002238 | LMOD2; MYOZ2; Fgf7; ACTN1; MYL6; CNN2; DOCK2; FSCN1 |
| GO:0031032 | BP | actomyosin structure organization | 0.001641 | LMOD2; MYOZ2; ACTN1; MYL6; CNN2 |
| GO:0003779 | MF | actin binding | 0.000306 | MYH15; LIMA1; LMOD2; MYOZ2; ACTN1; MYL6; CNN2; MYL3; FSCN1 |
| GO:0005523 | MF | tropomyosin binding | 0.006889 | LMOD2; S100A6 |
| GO:0070051 | MF | fibrinogen binding | 0.016237 | FBLN1 |
| GO:0050436 | MF | microfibril binding | 0.032211 | LTBP1 |
| GO:0060537 | BP | muscle tissue development | 0.029507 | DSG2; EYA2; BMP5; ITGA8 |
| GO:0032970 | BP | regulation of actin filament-based process | 0.033864 | DSG2; LIMA1; LMOD2; WNT11; SERPINF2; FSCN1; F2RL1 |
| GO:0030029 | BP | actin filament-based process | 0.003744 | LMOD2; MYOZ2; Fgf7; ACTN1; MYL6; CNN2; DOCK2; FSCN1 |
| GO:0014883 | BP | transition between fast and slow fiber | 0.047928 | TNNI1 |
| GO:1902724 | BP | positive regulation of skeletal muscle satellite cell proliferation | 0.047928 | HGF |
Table 8.
Cellular matrix and collagen related pathway
| GO ID | Term Type | Description | P-value | Genes |
|---|---|---|---|---|
| Cellular matrix related pathways | ||||
| GO:0030198 | BP | extracellular matrix organization | 1.05E-06 | MMP9; TGFBI; ABI3BP; POSTN; FBLN1, etc |
| GO:0044420 | CC | extracellular matrix component | 2.83E-05 | COL1A2; FN1; THBS2; THBS4; LTBP1, etc |
| GO:0005578 | CC | proteinaceous extracellular matrix | 1.71E-11 | FN1; THBS2; ADAMTS3; ADAMTS14; COL12A1, etc |
| GO:0005614 | CC | interstitial matrix | 0.013106 | FN1; ABI3BP |
| GO:0043062 | BP | extracellular structure organization | 1.15E-06 | MMP9; TGFBI; ABI3BP; ADAMTS14; POSTN, etc |
| GO:0005201 | MF | extracellular matrix structural constituent | 0.017449 | MGP; VCAN; FBLN1 |
| GO:0031232 | CC | extrinsic component of external side of plasma membrane | 0.032211 | SERPINE2 |
| GO:0019897 | CC | extrinsic component of plasma membrane | 0.000874 | SERPINE2; S100A6; RGS1; KCNAB1 |
| GO:1990430 | MF | extracellular matrix protein binding | 0.047928 | ITGB8 |
| Collagen related pathways | ||||
| GO:0032964 | BP | collagen biosynthetic process | 0.047928 | ADAMTS3 |
| GO:0032963 | BP | collagen metabolic process | 0.027114 | MMP9; ADAMTS3 |
| GO:0010712 | BP | regulation of collagen metabolic process | 0.023978 | SERPINF2; FAP |
| GO:0010710 | BP | regulation of collagen catabolic process | 0.032211 | FAP |
| GO:0030199 | BP | collagen fibril organization | 0.000216 | ADAMTS14; SFRP2; LUM; SERPINF2 |
| GO:0005518 | MF | collagen binding | 0.00265 | TGFBI; ABI3BP; COMP; LUM |
| GO:0005540 | MF | hyaluronic acid binding | 0.037432 | TNFAIP6; VCAN |
| GO:0005581 | CC | collagen trimer | 0.000699 | COL1A2; COL12A1; COLEC12; LUM; COL14A1 |
| GO:0005583 | CC | fibrillar collagen trimer | 0.001541 | COL1A2; LUM |
| GO:0005539 | MF | glycosaminoglycan binding | 3.59E-09 | MDK; SLIT3; NOV; SERPINE2; JCHAIN, etc |
| GO:1901617 | BP | organic hydroxy compound biosynthetic process | 0.033592 | NR4A2; PLTP; LCAT; AKR1D1 |
Table 9.
Cell adhesion and antioxidant related pathway
| GO ID | Term Type | Description | P-value | Genes |
|---|---|---|---|---|
| Cell adhesion related pathways | ||||
| GO:0007155 | BP | cell adhesion | 3.1E-08 | DSG2; TGFBI; NOV; FN1; THBS2; COMP, etc |
| GO:0098609 | BP | cell-cell adhesion | 0.030671 | DSG2; CSTA; NOV; CDH11; THBS4; BMP5, etc |
| GO:0007160 | BP | cell-matrix adhesion | 0.02187 | FN1; ITGB8; ITGA8 |
| GO:0050839 | MF | cell adhesion molecule binding | 0.000141 | DSG2; THY1; TGFBI; NOV; FN1; THBS4, etc |
| GO:0005911 | CC | cell-cell junction | 0.001091 | DSG2; CD3E; GJA1; NOV; ABCB11; ACTN1, etc |
| GO:0007045 | BP | cell-substrate adherens junction assembly | 0.010838 | THY1; FN1 |
| GO:0045216 | BP | cell-cell junction organization | 2.94E-06 | DSG2; THY1; GJA1; FN1; WNT11; FSCN1 |
| GO:0007043 | BP | cell-cell junction assembly | 0.028627 | WNT11; FSCN1 |
| GO:0034332 | BP | adherens junction organization | 0.048995 | THY1; FN1 |
| GO:0034329 | BP | cell junction assembly | 0.002273 | THY1; FN1; WNT11; FSCN1 |
| GO:0010811 | BP | positive regulation of cell-substrate adhesion | 0.00285 | THY1; FN1; ABI3BP; EDIL3; FBLN1 |
| GO:0034333 | BP | adherens junction assembly | 0.027114 | THY1; FN1 |
| GO:0005178 | MF | integrin binding | 2.56E-07 | THY1; TGFBI; NOV; FN1; THBS4; EDIL3, etc |
| Antioxidant related pathways | ||||
| GO:0016209 | MF | antioxidant activity | 0.040595 | MGST2; PTGS2; SOD3 |
| GO:0004784 | MF | superoxide dismutase activity | 0.047928 | SOD3 |
| GO:0006801 | BP | superoxide metabolic process | 0.00047 | NCF1; SOD3; CYBB |
| GO:1901031 | BP | regulation of response to reactive oxygen species | 0.048995 | HGF |
| GO:0050664 | MF | oxidoreductase activity, acting on NAD(P) H, oxygen as acceptor | 0.01556 | NCF1; CYBB |
| GO:0098869 | BP | cellular oxidant detoxification | 0.040595 | MGST2; PTGS2; SOD3 |
In KEGG enrichment analysis, down-regulated genes in the H group were involved in ECM-receptor interaction (COL1A, THBS1, FN1, TN, ITGA5, ITGA8 and ITGB8), adherens junction (SHP-1, TGFβR, α-Actinin and Slug) and focal adhesion (Actinin and MLC) (Fig. S4, S5 and S6).
Up-regulated genes in the COMB group
Compared with those in the H group, up-regulated genes in the COMB group were involved in muscle development, hyaluronic acid synthesis, mitochondrial function, and redox pathway (Fig. 8).
Fig. 8.

GO enrichment analysis of up-regulated genes in the COMB group. The abscissa indicates the GO term, and the ordinate indicates the enrichment ratio. “*“means P < 0.05, “**“means P < 0.01 and “***” means P < 0.001
The muscle development-related pathways enriched in the COMB group included positive regulation of muscle tissue development and muscle cell decision processes, which involved key genes such as MYF6, LMCD1 and TRPC3. Besides, the COMB group was enriched for mitochondria-associated pathways such as electron transport chains, mitochondrial respiratory chain complex I and mitochondrial protein complex pathways, which involved genes including TOMM6, NDUFV1, NDUFS5, NDUFB2, NDUFA2, LMCD1, ZNF593 and COASY (Table 10). The hyaluronic acid-related genes up-regulated in the COMB group included HYAL1 and HYAL3. Besides, the redox-related genes including LDHD, CPOX, SUOX, NDUFV1, GRHPR, DOHH and NDUFA2 were up-regulated in the COMB group, which were involved in the pathways such as redox process, NAD binding, NADPH binding and NADH dehydrogenase complex (Table 11). In KEGG enrichment analysis, up-regulated genes in the COMB group were involved in oxidative phosphorylation (NDUFS5, NDUFV1, NDUFA2, NDUFA13, NDUFB2, NDUFB7 and NDUFC2) (Fig. S7).
Table 10.
Muscle development and mitochondria related pathway
| Number | GO ID | Term Type | Description | P-value | Genes |
|---|---|---|---|---|---|
| Muscle development related pathways | |||||
| GO:1901741 | BP | positive regulation of myoblast fusion | 0.000717 | MYF6 | |
| GO:0010831 | BP | positive regulation of myotube differentiation | 0.003478 | MYF6 | |
| GO:0014743 | BP | regulation of muscle hypertrophy | 0.00447 | LMCD1; TRPC3 | |
| GO:0048643 | BP | positive regulation of skeletal muscle tissue development | 0.00447 | MYF6 | |
| GO:1901863 | BP | positive regulation of muscle tissue development | 0.020276 | MYF6 | |
| GO:0051149 | BP | positive regulation of muscle cell differentiation | 0.025719 | MYF6 | |
| GO:0048743 | BP | positive regulation of skeletal muscle fiber development | 0.035113 | MYF6 | |
| GO:0045844 | BP | positive regulation of striated muscle tissue development | 0.017276 | MYF6 | |
| GO:0051155 | BP | positive regulation of striated muscle cell differentiation | 0.011102 | MYF6 | |
| GO:0048636 | BP | positive regulation of muscle organ development | 0.017276 | MYF6 | |
| GO:0014744 | BP | positive regulation of muscle adaptation | 0.023546 | TRPC3 | |
| Mitochondria related pathways | |||||
| GO:0042775 | BP | mitochondrial ATP synthesis coupled electron transport | 0.023546 | NDUFV1 | |
| GO:0022904 | BP | respiratory electron transport chain | 0.025719 | NDUFV1 | |
| GO:0022900 | BP | electron transport chain | 0.029237 | NDUFV1 | |
| GO:0098803 | CC | respiratory chain complex | 0.002546 | NDUFV1; NDUFS5; NDUFB2 | |
| GO:0045271 | CC | respiratory chain complex I | 0.000532 | NDUFV1; NDUFS5; NDUFB2 | |
| GO:0005747 | CC | mitochondrial respiratory chain complex I | 0.000532 | NDUFV1; NDUFS5; NDUFB2 | |
| GO:0098798 | CC | mitochondrial protein complex | 0.002727 | TOMM6; NDUFV1; NDUFS5; NDUFB2 | |
| GO:0098800 | CC | inner mitochondrial membrane protein complex | 0.009305 | NDUFV1; NDUFS5; NDUFB2 | |
| GO:0005742 | CC | mitochondrial outer membrane translocase complex | 0.046544 | TOMM6 | |
| GO:0098779 | BP | mitophagy in response to mitochondrial depolarization | 0.04939 | LMCD1; ZNF593 | |
Table 11.
Hyaluronan and redox related pathway
| Number | GO ID | Term Type | Description | P-value | Genes |
|---|---|---|---|---|---|
| Hyaluronan related pathways | |||||
| GO:0030213 | BP | hyaluronan biosynthetic process | 0.023546 | HYAL1 | |
| GO:0030214 | BP | hyaluronan catabolic process | 0.000207 | HYAL3; HYAL1 | |
| GO:0030212 | BP | hyaluronan metabolic process | 0.001519 | HYAL3; HYAL1 | |
| GO:1900106 | BP | positive regulation of hyaluranon cable assembly | 0.017711 | HYAL1 | |
| GO:0004415 | MF | hyalurononglucosaminidase activity | 0.000514 | HYAL3; HYAL1 | |
| GO:0033906 | MF | hyaluronoglucuronidase activity | 0.011842 | HYAL3 | |
| GO:0036117 | CC | hyaluranon cable | 0.011842 | HYAL1 | |
| GO:0050501 | MF | hyaluronan synthase activity | 0.017711 | HYAL1 | |
| GO:0006027 | BP | glycosaminoglycan catabolic process | 0.00122 | HYAL3; HYAL1 | |
| GO:0030203 | BP | glycosaminoglycan metabolic process | 0.039481 | HYAL3; HYAL1 | |
| GO:0006026 | BP | aminoglycan catabolic process | 0.003025 | HYAL3; HYAL1 | |
| GO:1903510 | BP | mucopolysaccharide metabolic process | 0.013602 | HYAL3; HYAL1 | |
| Redox related pathways | |||||
| GO:0055114 | BP | oxidation-reduction process | 0.028445 | LDHD; CPOX; SUOX; NDUFV1; GRHPR; DOHH; NDUFA2 | |
| GO:1990204 | CC | oxidoreductase complex | 0.006475 | NDUFV1; NDUFS5; NDUFB2 | |
| GO:0016491 | MF | oxidoreductase activity | 0.045293 | LDHD; CPOX; SUOX; NDUFV1; GRHPR; DOHH | |
| GO:0016651 | MF | oxidoreductase activity, acting on NAD(P)H | 0.045042 | NDUFV1 | |
| GO:0051287 | MF | NAD binding | 0.031684 | NDUFV1; GRHPR | |
| GO:0070402 | MF | NADPH binding | 0.040845 | GRHPR | |
| GO:0030964 | CC | NADH dehydrogenase complex | 0.000532 | NDUFV1; NDUFS5; NDUFB2 | |
Down-regulated genes in the COMB group
Compared with those in the H group, down-regulated genes in the COMB group were involved in the inflammatory response, acid metabolism, fatty acid metabolism, and glycolysis-related pathways (Fig. 9).
Fig. 9.

GO enrichment analysis of down-regulated genes in the COMB group. The abscissa indicates the GO term, and the ordinate indicates the enrichment ratio. “*“means P < 0.05, “**“means P < 0.01 and “***” means P < 0.001
The inflammatory response-related genes down-regulated in the COMB group included CCR5 and ALOX5 while the immune response-related genes included C1S, BLK, CCR5 and MARCH1 (Table 12). The acid metabolism-related pathways include organic acid synthesis process, oxoacid metabolism process and carboxylic acid synthesis process, which involved genes such as PSAT1, SCD, MAT1A, ALOX5, ST3GAL1 and ALDOB. The genes involved in fatty acid metabolism pathways include SCD and ALOX5. In addition, down-regulated genes in the COMB group were involved in glycolytic and carbohydrate metabolism, which included GALNT16, ST3GAL1, ALDOB and MAT1A (Table 13).
Table 12.
Immune response and inflammatory response related pathways
| Number | GO ID | Term Type | Description | P-value | Genes |
|---|---|---|---|---|---|
| Immune response and inflammatory response related pathways | |||||
| GO:0006954 | BP | inflammatory response | 0.004612 | CCR5; ALOX5 | |
| GO:0002532 | BP | production of molecular mediator involved in inflammatory response | 0.01346 | ALOX5 | |
| GO:0002538 | BP | arachidonic acid metabolite production involved in inflammatory response | 0.008097 | ALOX5 | |
| GO:0002540 | BP | leukotriene production involved in inflammatory response | 0.008097 | ALOX5 | |
| GO:0002253 | BP | activation of immune response | 0.005145 | C1S; BLK | |
| GO:0050778 | BP | positive regulation of immune response | 0.017271 | C1S; BLK | |
| GO:0045087 | BP | innate immune response | 0.005036 | C1S; BLK | |
| GO:0006956 | BP | complement activation | 0.000944 | C1S | |
| GO:0001867 | BP | complement activation, lectin pathway | 7.08E-05 | C1S | |
| GO:0006958 | BP | complement activation, classical pathway | 0.000197 | C1S | |
| GO:0004950 | MF | chemokine receptor activity | 0.047636 | CCR5 | |
| GO:0016493 | MF | C-C chemokine receptor activity | 0.024101 | CCR5 | |
| GO:0090026 | BP | positive regulation of monocyte chemotaxis | 0.024101 | CCR5 | |
| GO:0002495 | BP | antigen processing and presentation of peptide antigen via MHC class II | 0.032008 | MARCH1 | |
| GO:0042287 | MF | MHC protein binding | 0.045049 | MARCH1 | |
Table 13.
Organic acid, faty acid metabolic process, glycolytic and carbohydrate metabolism related pathways
| Number | GO ID | Term Type | Description | P-value | Genes |
|---|---|---|---|---|---|
| Organic acid and faty acid metabolic process related pathways | |||||
| GO:0006082 | BP | organic acid metabolic process | 0.002344 | PSAT1; SCD; MAT1A; ALOX5; ST3GAL1; ALDOB | |
| GO:0016053 | BP | organic acid biosynthetic process | 0.006961 | PSAT1; SCD; ALOX5 | |
| GO:0043436 | BP | oxoacid metabolic process | 0.002254 | PSAT1; SCD; MAT1A; ALOX5; ST3GAL1; ALDOB | |
| GO:0046394 | BP | carboxylic acid biosynthetic process | 0.006961 | PSAT1; SCD; ALOX5 | |
| GO:0019752 | BP | carboxylic acid metabolic process | 0.001555 | PSAT1; SCD; MAT1A; ALOX5; ST3GAL1; ALDOB | |
| GO:0006633 | BP | fatty acid biosynthetic process | 0.012538 | SCD; ALOX5 | |
| GO:0006636 | BP | unsaturated fatty acid biosynthetic process | 0.002054 | SCD; ALOX5 | |
| GO:0016215 | MF | acyl-CoA desaturase activity | 0.002706 | SCD | |
| Glycolytic and carbohydrate metabolism related pathways | |||||
| GO:0030388 | BP | fructose 1,6-bisphosphate metabolic process | 0.01613 | ALDOB | |
| GO:0006000 | BP | fructose metabolic process | 0.018794 | ALDOB | |
| GO:0070061 | MF | fructose binding | 0.010782 | ALDOB | |
| GO:0061609 | MF | fructose-1-phosphate aldolase activity | 0.002706 | ALDOB | |
| GO:0004332 | MF | fructose-bisphosphate aldolase activity | 0.010782 | ALDOB | |
| GO:0005975 | BP | carbohydrate metabolic process | 0.029095 | GALNT16; ST3GAL1; ALDOB | |
| GO:0030246 | MF | carbohydrate binding | 0.041651 | GALNT16; ALDOB | |
In KEGG enrichment analysis, genes involved in the regulation of lipolysis in adipocytes (PLIN), glycolysis/gluconeogenesis (ALDO) and arachidonic acid metabolism (ALOX5) were down-regulated in the COMB group (Fig. S8, S9 and S10).
Transcriptome differential gene verification
The transcriptome differential genes were verified by real-time PCR, and the gene expression pattern was consistent with the transcriptome results (Fig. 10).
Fig. 10.
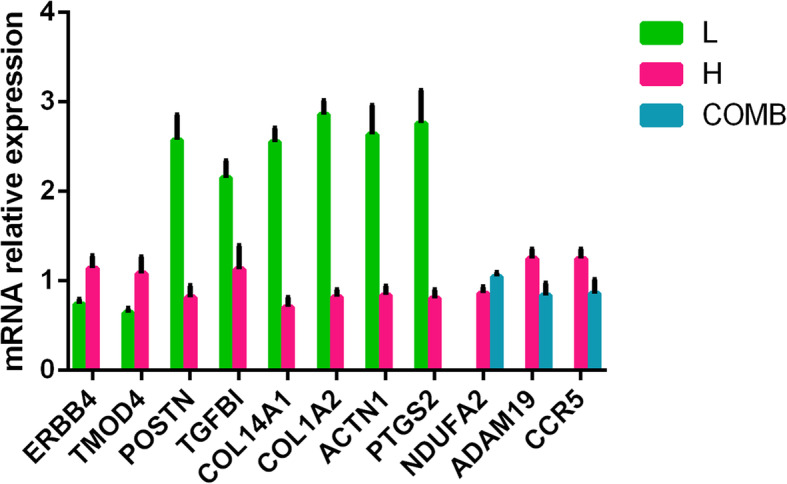
The mRNA relative expression of DEGs quantified by quantitative reverse transcription-PCR. Data presented as means ± SEM
Discussion
In the current study, the H group showed significantly increased cooking loss of breast muscle when compared with the L group. The muscle disease such as PSE (Pale, Soft and Exudative) meat [30] and wooden breast [31] have higher cooking loss than normal meat.
Stress is an essential cause of the decline in meat quality. In this study, the activity of LDH in the H group was higher than that in the L group. In transcriptome analysis, the enriched genes in the H group were involved in stimuli response pathway. In the H group, genes encoding nitric oxide synthase 1 (NOS1), Kelch-Like ECH-associated protein 1 (KEAP1) and cyclin-dependent kinase inhibitor 1A (p21, Cip1) (CDKN1A) were up-regulated. High levels of NO reduce the antioxidant capacity of post-mortem muscles, increasing the accumulation of ROS and reactive nitrogen, resulting in high levels of protein oxidation. Studies have shown that inhibition of nitric oxide synthase can significantly reduce protein carbonyl content and protein oxidation [32]. Inhibition of CDKN1A expression by miRNAs promotes myoblast proliferation [33]. Up-regulation of KEAP1 expression increases the degradation of Nrf2 in cells, making cells more susceptible to free radical damage [34]. Heat stress can reduce the oxidative stability of broiler muscle protein and reduce the strength of the myofibrillar gel, resulting in increased drip loss and cooking loss in broilers [35]. A study has shown that genes involved in the stimulation response pathway are significantly enriched in muscles with high drip loss [36]. Therefore, increased expression of stress pathway-related genes such as KEAP1 and CDKN1A may be one of the causes of muscle quality deterioration.
This study found that the H group had the fastest pH decline rate. The rapid decline in pH is usually accompanied by an increase in the rate of glycolysis and the accumulation of lactic acid, resulting in a decrease of muscle function [37]. In this study, high stocking density led to up-regulation of genes involved in glycolysis and fat metabolism pathways. Anaerobic glycolysis is a vital energy metabolism pathway for post-mortem broilers. Under anaerobic conditions, muscle glycogen degradation occurs through glycolysis, which causes pyruvate to synthesize lactic acid, thus leading to a decrease in muscle pH due to the accumulation of lactic acid [38, 39]. High stocking density in this study also caused up-regulation of striated muscle contraction pathway-related genes such as SIX homeobox 1 (Six1). It has been found that white streak muscles have up-regulated expression of striated muscle contraction-related genes compared with normal meat [40]. Six1 converts slow muscle fibres into fast muscle fibres [41, 42]. The proportion of fast muscle fibres was negatively correlated with post-mortem pH [43]. Besides, the enriched genes in the H group were involved in calcium transport, sodium transport, and cation transport. Importantly, ion balance is the basis for maintaining normal physiological functions. Abnormal metabolism caused by high concentrations of calcium ions may be associated with the incidence of turkey PSE [44]. Furthermore, changes in muscle cation homeostasis may mark the beginning of muscle degeneration [45] and cause a reduction in meat quality [46].
Dietary supplementation with niacin (nicotinamide precursor) at 60 mg/kg was reported to reduce the drip loss of breast muscles in broilers [14]. In our study, the COMB group showed significantly reduced drip loss and cooking loss compared with the H group. Further, the COMB group showed significantly decreased activity of LDH compared to the H group. Besides, the COMB group showed inhibited expression of glycolytic and inflammation genes [37].
In KEGG enrichment analysis, the enriched genes in the H group were involved in inflammatory mediator regulation of RTP channels and chemokine signalling pathway. In contrast, the up-regulated genes in the COMB group were involved in the inflammatory response. Macrophage infiltration in the pectoral muscle might cause muscle damage [47]. The muscle disease such as white striped muscle is usually accompanied by elevated expression of immune-related genes [40]. During tissue degeneration, immune cells immediately enter the site of injury, triggering an inflammatory response, and attracting more immune cells to the damaged area. It can cause phagocytosis of cell debris and release of cytokines, prostaglandins and other signalling proteins, resulting in interstitial spaces [48].
We found that key genes down-regulated in the H group, such as MYOZ2, were involved in muscle development, cell adhesion, cell matrix, collagen, and cytoskeleton. MYOZ2 belongs to sarcomeric family and links calcineurin to alpha-actinin at the Z-line of skeletal muscle sarcomere and can play a role in skeletal muscle differentiation and growth [49]. It was suggested that MYOZ2 knockout mice had neuromuscular disease [50]. Also, genes down-regulated in the H group were involved in cell matrix and collagen pathways. Extracellular matrix (ECM) is a major macromolecule in skeletal muscle and has a substantial effect on meat quality. The remodelling of ECM is mainly regulated by matrix metalloproteinases. The expression of matrix metalloproteinase-1 is negatively correlated with cooking loss and positively correlated with hydraulic performance [51]. Collagen is an abundant connective tissue protein that is an important factor in the tenderness and texture of the meat and is well resistant to physical damage during cooking [52]. The addition of collagen increases the ability of pork [53] and poultry [54] to combine with water and reduces cooking losses. Furthermore, high stocking density downregulates cell adhesion, cytoskeletal and integrin binding-related genes such as integrin subunit alpha 8 (ITGA8), integrin subunit beta 8 (ITGB8) and integrin subunit beta like 1 (ITGBL1). Proteolytic degradation of cell adhesion proteins is associated with the production of drip channels [55]. The cytoskeleton is a highly complex network composed of a large number of connections between myofibrils and myofibrillar membranes. Degradation of the cytoskeleton causes extracellular water to flow into the muscle cells, thereby increasing drip loss [56]. Integrins are heterodimeric cell adhesion molecules that bind the extracellular matrix to the cytoskeleton and play an essential role in controlling cell membrane-cytoskeletal attachment and signalling pathways [57]. The β-chain integrin is responsible for the attachment of the cell membrane to the cytoskeleton [58]. Degradation of β1 integrin promotes the formation of water channels between cells and cell membranes, thereby increasing drip loss [59]. In addition, it has been found that integrins are inversely related to pork drip loss [60].
Compared with the H group, the COMB group showed up-regulation of muscle development, hyaluronic acid levels, mitochondrial function, and the redox pathway. Studies have found that hyaluronic acid is a crucial water-holding molecule [61, 62]. Furthermore, supplementation with antioxidant isoflavones can be achieved by reducing lipid peroxidation and increasing oxidative stability in the pectoral muscles [63]. Therefore, enhanced hyaluronic acid biosynthesis and antioxidant capacity may improve muscle quality.
Additionally, up-regulated genes in the COMB group involved the complex I-related gene NDUFS5. The mitochondrial respiratory chain (MRC) consists of four membrane-bound electron transport protein complexes (I-IV) and ATP synthase (complex V) that produce ATP for cellular processes. Complex I deficiency, NADH ubiquinone oxidoreductase is the most common form of MRC dysfunction and is associated with a variety of diseases [64, 65]. Complex I deficiency leads to various physiological disorders such as ATP depletion, calcium homeostasis, ROS accumulation [66] and induction of apoptosis [67]. A study found that mitochondrial and oxidative phosphorylation-related gene expression was negatively correlated with drip loss. A negative correlation with drip loss means that there is a decrease in the number of mitochondria in muscles with high drip loss [68].
Conclusion
High stocking density may cause oxidative stress, abnormal muscle contraction, and abnormal metabolism of glycolipids; destroy ion channels and cell matrix; reduce muscle strength by inhibiting muscle development, and cell adhesion and collagen synthesis, all of which result in reduced muscle function. Supplementation with NAM and BA in combination can improve mitochondrial function and antioxidant capacity, and inhibit inflammatory response and glycolysis by promoting muscle development and hyaluronic acid synthesis, thereby reducing drip loss of the breast muscle and improving muscle quality (Fig. 11).
Fig. 11.

The graphic description of the normalization effect of nicotinamide and sodium butyrate on breast muscle. This is the original graph drafted by the authors of this article
Methods
Experimental birds, diets, and management
Amount of 300 Cobb broilers (21-day-old) were divided into 3 groups: low stocking density (L, 14 birds/m2), high stocking density (H, 18 birds/m2) and combination of NAM and BA (COMB, 18 birds/m2), with 6 replicates for each group. The stocking densities of this study are referred to Vargas-Galicia et al. [69]. The L and H groups were fed a basal diet. The COMB group was fed basal diet supplemented with 50 mg/kg NAM and 500 mg/kg BA. The dosage 50 mg/kg NAM and 500 mg/kg BA used in this study were based on our previous studies [70, 71]. Experimental diets were designed to meet nutrient requirements of National Research Council (1994) [72]. The nutrient levels and composition of basic diet were shown in Table 14. Broilers in this study were raised from 21-day-old to 42-day-old, and feed and water were provided ad libitum.
Table 14.
The composition and nutrient level of basal diet
| Ingredient | Percent | Nutrients | Percent |
|---|---|---|---|
| Corn | 62.05 | Metabolic energy | 3100 Kcal |
| Soybean meal | 26.90 | Crude Protein | 18.98 |
| Corn Gluten Meal | 4.00 | Lysine | 1.04 |
| Soybean oil | 3.10 | Methionine | 0.49 |
| DL-Methionine | 0.18 | Threonine | 0.74 |
| L-Lysine sulphate | 0.40 | Tryptophan | 0.24 |
| Sodium chloride | 0.30 | Calcium | 0.86 |
| Choline chloride (50%) | 0.15 | Available Phosphorus | 0.32 |
| Vitamin premixb | 0.02 | Met+Cysc | 0.80 |
| Trace mineral premixa | 0.20 | ||
| Dicalcium phosphate | 1.40 | ||
| Limestone | 1.20 | ||
| Phytase | 0.02 | ||
| Antioxidant | 0.03 | ||
| Medical stone | 0.05 |
a The trace mineral premix provided the following per kg of diets: Cu, 16 mg (as CuSO4·5H2O); Zn, 110 mg (as ZnSO4); Fe, 80 mg (as FeSO4·H2O); Mn, 120 mg (as MnO); Se, 0.3 mg (as Na2SeO3); I, 1.5 mg (as KI); Co, 0.5 mg
b The vitamin premix provided the following per kg of diets: vitamin A, 10,000 IU; vitamin D3, 2400 IU; vitamin E, 20 mg; vitamin K3, 2 mg; vitamin B1, 2 mg; vitamin B2, 6.4 mg; VB6, 3 mg; VB12, 0.02 mg; biotin, 0.1 mg; folic acid, 1 mg; pantothenic acid, 10 mg; nicotinamide, 30 mg
c Met+Cys: Methionine+ Cysteine
Production performance determination and sample collection
On 42-day, remove feed for 5 h and record the remaining feed per cage, then weight the body weight (BW) of broilers. Calculate body weight gain (BWG), feed intake (FI) and the feed conversion rate (FCR).
For breast collection, one broiler per replicate was randomly selected and euthanized by intravenous injection of pentobarbital sodium (390 mg/ml) at a dose of 300 mg/kg. The breast muscle was collected for meat quality analysis and further study.
Each group had six replicates for the determination of meat quality, enzyme activities and mRNA relative expression; there were three biology replicates in each group for RNA-sequencing.
Meat quality analysis
The meat quality of right side major pectoral muscle was quickly determined after slaughtering. The drip loss was determined according to Liu et al. [73]. Cooking loss was measured according to the protocol described by Cai et al. [74]. The pH values of the pectoral muscle at 45 min and 24 h were measured by a pH meter (testo 205; Germany). Each sample was tested at 3 different locations (top, middle and bottom) and the average of 3 measurements was calculated.
Enzyme activity determination in breast muscle
The total antioxidant capacity (T-AOC, cat#A015), anti-superoxide anion (cat#A052), the activities of creatine kinase (CK, cat#A032), lactate dehydrogenase (LDH, cat#A020–2), malic dehydrogenase (MDH, cat#A021–2), and the content of hydroxyproline (cat# A030–2) in breast muscle were measured by commercial analytical kits (Jian Cheng Bioengineering Institute, Nanjing, China).
RNA extraction, library preparation and Illumina Hiseq X ten sequencing
Total RNA from the breast muscle was extracted by TRIzol® Reagent (Invitrogen, Carlsbad, CA, USA). The RNA quality was then measured by 2100 Bioanalyser (Agilent Technologies, Santa Clara, CA, USA) and quantified using the ND-2000 (Nanodrop Technologies, Wilmington, Delaware).
RNA-seq library was constructed according to TruSeqTM RNA sample preparation Kit from Illumina (San Diego, CA, USA), then was sequenced with the Illumina HiSeq X Ten (2 × 150 bp read length).
Read mapping, differential expression analysis and functional enrichment
SeqPrep and Sickle were applied to process raw paired-end reads. Then use TopHat version2.0.0 [75] software to align the clean reads to the reference genome.
FRKM method was applied to identify differentially expressed genes (DEGs). RSEM [76] was used to quantify gene abundances. Differential gene expression was analyzed by R statistical package software EdgeR [77]. Goatools and KOBAS [78] were applied for KEGG pathway enrichment and GO functional analysis.
The mRNA expression of muscle developmental genes
Several differentially expressed genes involved muscle development were validated by real-time PCR analysis. The mRNA expression of muscle was determined as we previously described [71]. The primer sequences of target gene and housekeeping gene beta-actin were shown in Table 15. The results of gene expression were analyzed and compared using 2-ΔΔCT.
Table 15.
Real time PCR primer sequence
| Gene | Primer sequence (5′-3′) | Size | Accession NO. |
|---|---|---|---|
| GAPDH | Forward: GGTAGTGAAGGCTGCTGCTGATG | 200 | NM_204305.1 |
| Reverse: AGTCCACAACACGGTTGCTGTATC | |||
| ERBB4 | Forward: ATCACCAGCATCGAGCACAACAG | 114 | NM_001030365.1 |
| Reverse: CAGGTTCTCCAGTGGCAGGTATTC | |||
| TMOD4 | Forward: GATGGAGATGGCGACGATGCTG | 135 | NM_204774.1 |
| Reverse: TTCTTCTGCTTGCGACGGAGTTC | |||
| PTGS2 | Forward: ACTGCTGGCCGCTCTCCTTG | 121 | NM_001167719.1 |
| Reverse: CCTCGTGCAGTCACATTCATACCG | |||
| COL1A2 | Forward: TCCTCCTGGTAACAACGGTCCTG | 85 | NM_001079714.2 |
| Reverse: GAGACCATTGCGACCATCCTTACC | |||
| POSTN | Forward: CAGCCGCATCTGCTCACTATGAC | 200 | NM_001030541.1 |
| Reverse: CTTCATGTAGCCAGGACAGCACTC | |||
| COL14A1 | Forward: CCAACTCAGCCACCAACTTCTCC | 107 | NM_205334.1 |
| Reverse: TCCACTAGGAACACCAGGTCAGC | |||
| TGFBI | Forward: ACCACCACGAACAGCATTCAGC | 87 | NM_205036.1 |
| Reverse: GTTGAGGTCAGAAGCAGCCACAG | |||
| ACTN1 | Forward: GCGTGGAACAGATTGCTGCTATTG | 88 | NM_204127.1 |
| Reverse: ATCTTCTGGCACCTGGCATTGAC | |||
| NDUFA2 | Forward: CATCGAGCAGCACTACGTGACTC | 159 | NM_001302137.1 |
| Reverse: TTGGCAACTTCATCCACACTGAGG | |||
| ADAM19 | Forward: GACAGGACAAGCACGGACCATC | 166 | NM_001195122.1 |
| Reverse: AGGAAGCGGCTCCAGGACATAG | |||
| CCR5 | Forward: GAGATGCGCTGTGCCGGATTC | 159 | NM_001271141.1 |
| Reverse: TGCTGGTGAGGATGCCGTAGG |
Statistical analysis
The results are expressed as means with their standard error mean (SEM). SPSS 20.0 for Windows (SPSS Inc. Chicago, IL) was applied for One-way ANOVA analysis. Significant difference was considered at P < 0.05.
Supplementary information
Additional file 1: Figure S1. Inflammatory mediator regulation of RTP channels pathway analysis. Differential expressed genes that are involved in the inflammatory mediator regulation of RTP channels [map 04750], are highlighted. We thank Kanehisa Laboratories for providing the copyright permission of KEGG pathway maps [29].
Additional file 2: Figure S2. Chemokine signaling pathway analysis. Differential expressed genes that are involved in the chemokine signaling pathway [map 04062], are highlighted. We thank Kanehisa Laboratories for providing the copyright permission of KEGG pathway maps [29].
Additional file 3: Figure S3. Calcium signaling pathway analysis. Differential expressed genes that are involved in the calcium signaling pathway [map 04020], are highlighted. We thank Kanehisa Laboratories for providing the copyright permission of KEGG pathway maps [29].
Additional file 4: Figure S4. ECM-receptor interaction pathway analysis. Differential expressed genes that are involved in the inflammatory mediator regulation of RTP channels [map 04512], are highlighted. We thank Kanehisa Laboratories for providing the copyright permission of KEGG pathway maps [29].
Additional file 5: Figure S5. Adherens junction pathway analysis. Differential expressed genes that are involved in the adherens junction [map 04520], are highlighted. We thank Kanehisa Laboratories for providing the copyright permission of KEGG pathway maps [29].
Additional file 6: Figure S6. Focal adhesion pathway analysis. Differential expressed genes that are involved in the focal adhesion [map 04510], are highlighted. We thank Kanehisa Laboratories for providing the copyright permission of KEGG pathway maps [29].
Additional file 7: Fig. S7. Oxidative phosphorylation pathway analysis. Differential expressed genes that are involved in the oxidative phosphorylation [map 00190], are highlighted. We thank Kanehisa Laboratories for providing the copyright permission of KEGG pathway maps [29].
Additional file 8: Figure S8. Regulation of lipolysis in adipocytes pathway analysis. Differential expressed genes that are involved in the Regulation of lipolysis in adipocytes [map 04923], are highlighted. We thank Kanehisa Laboratories for providing the copyright permission of KEGG pathway maps [29].
Additional file 9: Figure S9. Glycolysis/Gluconeogenesis pathway analysis. Differential expressed genes that are involved in the Glycolysis/Gluconeogenesis [map 00010], are highlighted. We thank Kanehisa Laboratories for providing the copyright permission of KEGG pathway maps [29].
Additional file 10: Figure S10. Arachidonic acid metabolism pathway analysis. Differential expressed genes that are involved in the arachidonic acid metabolism [map 00590], are highlighted. We thank Kanehisa Laboratories for providing the copyright permission of KEGG pathway maps [29].
Acknowledgments
We would like to thank Dr. Adam John Rose from Monash University for his critical revision and suggestions.
Abbreviations
- L
Low stocking density group
- H
High stocking density group
- COMB
A combination of nicotinamide and sodium butyrate group
- NAM
Nicotinamide
- ROS
Reactive oxygen species
- BA
Butyrate sodium
- PGC1α
Peroxisome proliferator-activated receptor-γ coactivator 1α
- NAD
Nicotinamide adenine dinucleotide
- T-AOC
Total antioxidant capacity
- LDH
Lactate dehydrogenase
- CK
Creatine kinase
- MDH
Malic dehydrogenase
- DEGs
Differentially expressed genes
- NOS1
Nitric oxide synthase 1
- KEAP1
Kelch-Like ECH-associated protein 1
- CDKN1A
Cyclin-dependent kinase inhibitor 1A
Authors’ contributions
JMY conceived and designed the experiment; YQW, YLW, DFY performed the experiments. YQW analyzed RNA Sequencing data and drafted the manuscript. TM and JMY reviewed and edited the manuscript. All authors critically revised the manuscript for important intellectual content and all approved the final version of this manuscript.
Funding
This research was funded by the National Key Research and Development Program of China (Project Number: 2016YFD0500509–9) and the System for Poultry Production Technology, Beijing Agriculture Innovation Consortium (Project Number: BAIC04–2019). The funder had no role in study design, data collection and analysis, data interpretation or preparation of the manuscript.
Availability of data and materials
All the sequencing data are deposited in SRA under the Bioproject accession number PRJNA558637.
Ethics approval and consent to participate
All procedures used in our experiments were approved by the Institutional Animal Care and Use Committee of the China Agricultural University (Beijing, China, permit number SYXK20130013).
Consent for publication
Not applicable.
Competing interests
The authors declare that they have no competing interests.
Footnotes
Publisher’s Note
Springer Nature remains neutral with regard to jurisdictional claims in published maps and institutional affiliations.
Supplementary information
Supplementary information accompanies this paper at 10.1186/s12864-020-06827-0.
References
- 1.Najafi P, Zulkifli I, Jajuli NA, Farjam AS, Ramiah SK, Amir AA, O'Reily E, Eckersall D. Environmental temperature and stocking density effects on acute phase proteins, heat shock protein 70, circulating corticosterone and performance in broiler chickens. Int J Biometeorol. 2015;59(11):1577–1583. doi: 10.1007/s00484-015-0964-3. [DOI] [PubMed] [Google Scholar]
- 2.Zhang YR, Zhang LS, Wang Z, Liu Y, Li FH, Yuan JM, Xia ZF. Effects of stocking density on growth performance, meat quality and tibia development of Pekin ducks. Anim Sci J. 2018;89(6):925–930. doi: 10.1111/asj.12997. [DOI] [PubMed] [Google Scholar]
- 3.Patria C, Afnan R, Arief II. Physical and microbiological qualities of kampong-broiler crossbred chickens meat raised in different stocking densities. Media Peternakan. 2016;39(3):141–147. [Google Scholar]
- 4.Falowo AB, Fayemi PO, Muchenje V. Natural antioxidants against lipid-protein oxidative deterioration in meat and meat products: a review. Food Res Int. 2014;64:171–181. doi: 10.1016/j.foodres.2014.06.022. [DOI] [PubMed] [Google Scholar]
- 5.Zhang L, Yue HY, Wu SG, Xu L, Zhang HJ, Yan HJ, Cao YL, Gong YS, Qi GH. Transport stress in broilers. II. Superoxide production, adenosine phosphate concentrations, and mRNA levels of avian uncoupling protein, avian adenine nucleotide translocator, and avian peroxisome proliferator-activated receptor-gamma coactivator-1alpha in skeletal muscles. Poult Sci. 2010;89(3):393–400. doi: 10.3382/ps.2009-00281. [DOI] [PubMed] [Google Scholar]
- 6.Selman C, McLaren JS, Himanka MJ, Speakman JR. Effect of long-term cold exposure on antioxidant enzyme activities in a small mammal. Free Radic Biol Med. 2000;28(8):1279–1285. doi: 10.1016/s0891-5849(00)00263-x. [DOI] [PubMed] [Google Scholar]
- 7.Zhang C, Yang L, Zhao X, Chen X, Wang L, Geng Z. Effect of dietary resveratrol supplementation on meat quality, muscle antioxidative capacity and mitochondrial biogenesis of broilers. J Sci Food Agric. 2018;98(3):1216–1221. doi: 10.1002/jsfa.8576. [DOI] [PubMed] [Google Scholar]
- 8.Choi HJ, Jang SY, Hwang ES. High-dose Nicotinamide suppresses ROS generation and augments population expansion during CD8(+) T cell activation. Mol Cells. 2015;38(10):918–924. doi: 10.14348/molcells.2015.0168. [DOI] [PMC free article] [PubMed] [Google Scholar]
- 9.Kwak JY, Ham HJ, Kim CM, Hwang ES. Nicotinamide exerts antioxidative effects on senescent cells. Mol Cells. 2015;38(3):229–235. doi: 10.14348/molcells.2015.2253. [DOI] [PMC free article] [PubMed] [Google Scholar]
- 10.Mitchell SJ, Bernier M, Aon MA, Cortassa S, Kim EY, Fang EF, Palacios HH, Ali A, Navas-Enamorado I, Di Francesco A, et al. Nicotinamide Improves Aspects of Healthspan, but Not Lifespan, in Mice. Cell Metab. 2018;27(3):667–676.e4. doi: 10.1016/j.cmet.2018.02.001. [DOI] [PMC free article] [PubMed] [Google Scholar]
- 11.Jahns F, Wilhelm A, Jablonowski N, Mothes H, Greulich KO, Glei M. Butyrate modulates antioxidant enzyme expression in malignant and non-malignant human colon tissues. Mol Carcinog. 2015;54(4):249–260. doi: 10.1002/mc.22102. [DOI] [PubMed] [Google Scholar]
- 12.Zhang WH, Jiang Y, Zhu QF, Gao F, Dai SF, Chen J, Zhou GH. Sodium butyrate maintains growth performance by regulating the immune response in broiler chickens. Brit Poultry Sci. 2011;52(3):292–301. doi: 10.1080/00071668.2011.578121. [DOI] [PubMed] [Google Scholar]
- 13.Walsh ME, Bhattacharya A, Sataranatarajan K, Qaisar R, Sloane L, Rahman MM, Kinter M, Van Remmen H. The histone deacetylase inhibitor butyrate improves metabolism and reduces muscle atrophy during aging. Aging Cell. 2015;14(6):957–970. doi: 10.1111/acel.12387. [DOI] [PMC free article] [PubMed] [Google Scholar]
- 14.Jiang RR, Zhao GP, Chen JL, Zheng MQ, Zhao JP, Li P, Hu J, Wen J. Effect of dietary supplemental nicotinic acid on growth performance, carcass characteristics and meat quality in three genotypes of chicken. J Anim Physiol Anim Nutr (Berl) 2011;95(2):137–145. doi: 10.1111/j.1439-0396.2010.01031.x. [DOI] [PubMed] [Google Scholar]
- 15.Panda A, Rao S, Raju M, Sunder GS. Effect of butyric acid on performance, gastrointestinal tract health and carcass characteristics in broiler chickens. Asian-Australas J Anim Sci. 2009;22(7):1026–1031. [Google Scholar]
- 16.Xiong J, Qiu H, Bi Y, Zhou H, Guo S, Ding B. Effects of dietary supplementation with Tributyrin and coated sodium butyrate on intestinal morphology, Disaccharidase activity and intramuscular fat of lipopolysaccharide-challenged broilers. Braz J Poult Sci. 2018;20(4):707–716. [Google Scholar]
- 17.Wenz T, Rossi SG, Rotundo RL, Spiegelman BM, Moraes CT. Increased muscle PGC-1alpha expression protects from sarcopenia and metabolic disease during aging. Proc Natl Acad Sci U S A. 2009;106(48):20405–20410. doi: 10.1073/pnas.0911570106. [DOI] [PMC free article] [PubMed] [Google Scholar] [Retracted]
- 18.Mouchiroud L, Houtkooper RH, Moullan N, Katsyuba E, Ryu D, Canto C, Mottis A, Jo YS, Viswanathan M, Schoonjans K, et al. The NAD(+)/Sirtuin pathway modulates longevity through activation of mitochondrial UPR and FOXO signaling. Cell. 2013;154(2):430–441. doi: 10.1016/j.cell.2013.06.016. [DOI] [PMC free article] [PubMed] [Google Scholar]
- 19.Zhang H, Ryu D, Wu Y, Gariani K, Wang X, Luan P, D'Amico D, Ropelle ER, Lutolf MP, Aebersold R, et al. NAD(+) repletion improves mitochondrial and stem cell function and enhances life span in mice. Science. 2016;352(6292):1436–1443. doi: 10.1126/science.aaf2693. [DOI] [PubMed] [Google Scholar]
- 20.Hathorn T, Snyder-Keller A, Messer A. Nicotinamide improves motor deficits and upregulates PGC-1alpha and BDNF gene expression in a mouse model of Huntington's disease. Neurobiol Dis. 2011;41(1):43–50. doi: 10.1016/j.nbd.2010.08.017. [DOI] [PMC free article] [PubMed] [Google Scholar]
- 21.Frederick DW, Loro E, Liu L, Davila A, Jr, Chellappa K, Silverman IM, Quinn WJ, 3rd, Gosai SJ, Tichy ED, Davis JG, et al. Loss of NAD homeostasis leads to progressive and reversible degeneration of skeletal muscle. Cell Metab. 2016;24(2):269–282. doi: 10.1016/j.cmet.2016.07.005. [DOI] [PMC free article] [PubMed] [Google Scholar]
- 22.Goody MF, Kelly MW, Reynolds CJ, Khalil A, Crawford BD, Henry CA. NAD+ biosynthesis ameliorates a zebrafish model of muscular dystrophy. PLoS Biol. 2012;10(10):e1001409. doi: 10.1371/journal.pbio.1001409. [DOI] [PMC free article] [PubMed] [Google Scholar]
- 23.Vrablik TL, Wang W, Upadhyay A, Hanna-Rose W. Muscle type-specific responses to NAD+ salvage biosynthesis promote muscle function in Caenorhabditis elegans. Dev Biol. 2011;349(2):387–394. doi: 10.1016/j.ydbio.2010.11.014. [DOI] [PMC free article] [PubMed] [Google Scholar]
- 24.Khan M, Ringseis R, Mooren FC, Kruger K, Most E, Eder K. Niacin supplementation increases the number of oxidative type I fibers in skeletal muscle of growing pigs. BMC Vet Res. 2013;9:177. doi: 10.1186/1746-6148-9-177. [DOI] [PMC free article] [PubMed] [Google Scholar]
- 25.Khan M, Couturier A, Kubens JF, Most E, Mooren FC, Kruger K, Ringseis R, Eder K. Niacin supplementation induces type II to type I muscle fiber transition in skeletal muscle of sheep. Acta Vet Scand. 2013;55:85. doi: 10.1186/1751-0147-55-85. [DOI] [PMC free article] [PubMed] [Google Scholar]
- 26.Gao Z, Yin J, Zhang J, Ward RE, Martin RJ, Lefevre M, Cefalu WT, Ye J. Butyrate improves insulin sensitivity and increases energy expenditure in mice. Diabetes. 2009;58(7):1509–1517. doi: 10.2337/db08-1637. [DOI] [PMC free article] [PubMed] [Google Scholar]
- 27.Huang Y, Gao S, Jun G, Zhao R, Yang X. Supplementing the maternal diet of rats with butyrate enhances mitochondrial biogenesis in the skeletal muscles of weaned offspring. Br J Nutr. 2017;117(1):12–20. doi: 10.1017/S0007114516004402. [DOI] [PubMed] [Google Scholar]
- 28.Henagan TM, Stefanska B, Fang Z, Navard AM, Ye J, Lenard NR, Devarshi PP. Sodium butyrate epigenetically modulates high-fat diet-induced skeletal muscle mitochondrial adaptation, obesity and insulin resistance through nucleosome positioning. Br J Pharmacol. 2015;172(11):2782–2798. doi: 10.1111/bph.13058. [DOI] [PMC free article] [PubMed] [Google Scholar]
- 29.Kanehisa M, Goto S. KEGG: Kyoto encyclopedia of genes and genomes. Nucleic Acids Res. 2000;28(1):27–30. doi: 10.1093/nar/28.1.27. [DOI] [PMC free article] [PubMed] [Google Scholar]
- 30.Van Laack RL, Liu CH, Smith MO, Loveday HD. Characteristics of pale, soft, exudative broiler breast meat. Poult Sci. 2000;79(7):1057–1061. doi: 10.1093/ps/79.7.1057. [DOI] [PubMed] [Google Scholar]
- 31.Mudalal S, Lorenzi M, Soglia F, Cavani C, Petracci M. Implications of white striping and wooden breast abnormalities on quality traits of raw and marinated chicken meat. Animal. 2015;9(4):728–734. doi: 10.1017/S175173111400295X. [DOI] [PubMed] [Google Scholar]
- 32.Zhang W, Marwan AH, Samaraweera H, Lee EJ, Ahn DU. Breast meat quality of broiler chickens can be affected by managing the level of nitric oxide. Poult Sci. 2013;92(11):3044–3049. doi: 10.3382/ps.2013-03313. [DOI] [PubMed] [Google Scholar]
- 33.Wang J, Song C, Cao X, Li H, Cai H, Ma Y, Huang Y, Lan X, Lei C, Ma Y, et al. MiR-208b regulates cell cycle and promotes skeletal muscle cell proliferation by targeting CDKN1A. J Cell Physiol. 2019;234(4):3720–3729. doi: 10.1002/jcp.27146. [DOI] [PubMed] [Google Scholar]
- 34.Kensler TW, Wakabayashi N, Biswal S. Cell survival responses to environmental stresses via the Keap1-Nrf2-ARE pathway. Annu Rev Pharmacol Toxicol. 2007;47:89–116. doi: 10.1146/annurev.pharmtox.46.120604.141046. [DOI] [PubMed] [Google Scholar]
- 35.Wang RR, Pan XJ, Peng ZQ. Effects of heat exposure on muscle oxidation and protein functionalities of pectoralis majors in broilers. Poult Sci. 2009;88(5):1078–1084. doi: 10.3382/ps.2008-00094. [DOI] [PubMed] [Google Scholar]
- 36.Wimmers K, Murani E, Ponsuksili S. Functional genomics and genetical genomics approaches towards elucidating networks of genes affecting meat performance in pigs. Brief Funct Genomics. 2010;9(3):251–258. doi: 10.1093/bfgp/elq003. [DOI] [PubMed] [Google Scholar]
- 37.Huang JC, Yang J, Huang M, Zhu ZS, Sun XB, Zhang BH, Xu XL, Meng WG, Chen KJ, Xu BC. Effect of pre-slaughter shackling and wing flapping on plasma parameters, postmortem metabolism, AMPK, and meat quality of broilers. Poult Sci. 2018;97(5):1841–1847. doi: 10.3382/ps/pey019. [DOI] [PubMed] [Google Scholar]
- 38.Zeferino CP, Komiyama CM, Pelicia VC, Fascina VB, Aoyagi MM, Coutinho LL, Sartori JR, Moura AS. Carcass and meat quality traits of chickens fed diets concurrently supplemented with vitamins C and E under constant heat stress. Animal. 2016;10(1):163–171. doi: 10.1017/S1751731115001998. [DOI] [PubMed] [Google Scholar]
- 39.Huang JC, Yang J, Huang F, Huang M, Chen KJ, Xu XL, Zhou GH. Effect of fast pH decline during the early postmortem period on calpain activity and cytoskeletal protein degradation of broiler M. pectoralis major. Poult Sci. 2016;95(10):2455–2463. doi: 10.3382/ps/pew206. [DOI] [PubMed] [Google Scholar]
- 40.Marchesi J, Ibelli A, Peixoto JO, Cantao ME, Pandolfi J, Marciano C, Zanella R, Settles ML, Coutinho LL, Ledur MC. Whole transcriptome analysis of the pectoralis major muscle reveals molecular mechanisms involved with white striping in broiler chickens. Poult Sci. 2019;98(2):590–601. doi: 10.3382/ps/pey429. [DOI] [PubMed] [Google Scholar]
- 41.Wu W, Huang R, Wu Q, Li P, Chen J, Li B, Liu H. The role of Six1 in the genesis of muscle cell and skeletal muscle development. Int J Biol Sci. 2014;10(9):983–989. doi: 10.7150/ijbs.9442. [DOI] [PMC free article] [PubMed] [Google Scholar]
- 42.Sakakibara I, Wurmser M, Dos Santos M, Santolini M, Ducommun S, Davaze R, Guernec A, Sakamoto K, Maire P. Six1 homeoprotein drives myofiber type IIA specialization in soleus muscle. Skelet Muscle. 2016;6(1):30. doi: 10.1186/s13395-016-0102-x. [DOI] [PMC free article] [PubMed] [Google Scholar]
- 43.Ryu YC, Lee MH, Lee SK, Kim BC. Effects of muscle mass and fiber type composition of longissimus dorsi muscle on postmortem metabolic rate and meat quality in pigs. J Muscle Foods. 2006;17(3):343–353. [Google Scholar]
- 44.Strasburg GM, Chiang W. Pale, soft, exudative Turkey--the role of ryanodine receptor variation in meat quality. Poult Sci. 2009;88(7):1497–1505. doi: 10.3382/ps.2009-00181. [DOI] [PubMed] [Google Scholar]
- 45.Sandercock DA, Mitchell MA. The role of sodium ions in the pathogenesis of skeletal muscle damage in broiler chickens. Poult Sci. 2004;83(4):701–706. doi: 10.1093/ps/83.4.701. [DOI] [PubMed] [Google Scholar]
- 46.Sandercock DA, Barker ZE, Mitchell MA, Hocking PM. Changes in muscle cell cation regulation and meat quality traits are associated with genetic selection for high body weight and meat yield in broiler chickens. Genet Sel Evol. 2009;41(1):8. doi: 10.1186/1297-9686-41-8. [DOI] [PMC free article] [PubMed] [Google Scholar]
- 47.Nierobisz LS, Felts JV, Mozdziak PE. Apoptosis and macrophage infiltration occur simultaneously and present a potential sign of muscle injury in skeletal muscle of nutritionally compromised, early post-hatch turkeys. Comp Biochem Physiol B Biochem Mol Biol. 2009;153(1):61–65. doi: 10.1016/j.cbpb.2009.01.015. [DOI] [PubMed] [Google Scholar]
- 48.Kääriäinen M, Järvinen T, Järvinen M, Rantanen J, Kalimo H. Relation between myofibers and connective tissue during muscle injury repair. Scand J Med Sci Sports. 2000;10(6):332–337. doi: 10.1034/j.1600-0838.2000.010006332.x. [DOI] [PubMed] [Google Scholar]
- 49.Braun T, Gautel M. Transcriptional mechanisms regulating skeletal muscle differentiation, growth and homeostasis. Nat Rev Mol Cell Biol. 2011;12(6):349–361. doi: 10.1038/nrm3118. [DOI] [PubMed] [Google Scholar]
- 50.Schiaffino S, Sandri M, Murgia M. Activity-dependent signaling pathways controlling muscle diversity and plasticity. Physiology (Bethesda) 2007;22:269–278. doi: 10.1152/physiol.00009.2007. [DOI] [PubMed] [Google Scholar]
- 51.Qi YX, Zhang XH, Wang YQ, Pang YZ, Zhang ZB, Zhang TL, Zhang ZX. Expression of MMP-1, −2, and −8 in longissimus dorsi muscle and their relationship with meat quality traits in cattle. Genet Mol Res. 2016;15(1):15017593. doi: 10.4238/gmr.15017593. [DOI] [PubMed] [Google Scholar]
- 52.Weston A, Rogers R, Althen TG. The role of collagen in meat tenderness. Prof Anim Sci. 2002;18(2):107–111. [Google Scholar]
- 53.Schilling MW, Mink LE, Gochenour PS, Marriott NG, Alvarado CZ. Utilization of pork collagen for functionality improvement of boneless cured ham manufactured from pale, soft, and exudative pork. Meat Sci. 2003;65(1):547–553. doi: 10.1016/S0309-1740(02)00247-4. [DOI] [PubMed] [Google Scholar]
- 54.Daigle SP, Schilling MW, Marriott NG, Wang H, Barbeau WE, Williams RC. PSE-like Turkey breast enhancement through adjunct incorporation in a chunked and formed deli roll. Meat Sci. 2005;69(2):319–324. doi: 10.1016/j.meatsci.2004.08.001. [DOI] [PubMed] [Google Scholar]
- 55.Huff-Lonergan E, Lonergan SM. Mechanisms of water-holding capacity of meat: the role of postmortem biochemical and structural changes. Meat Sci. 2005;71(1):194–204. doi: 10.1016/j.meatsci.2005.04.022. [DOI] [PubMed] [Google Scholar]
- 56.Kristensen L, Purslow PP. The effect of ageing on the water-holding capacity of pork: role of cytoskeletal proteins. Meat Sci. 2001;58(1):17–23. doi: 10.1016/s0309-1740(00)00125-x. [DOI] [PubMed] [Google Scholar]
- 57.Hynes RO. Integrins: versatility, modulation, and signaling in cell adhesion. Cell. 1992;69(1):11–25. doi: 10.1016/0092-8674(92)90115-s. [DOI] [PubMed] [Google Scholar]
- 58.van der Flier A, Sonnenberg A. Function and interactions of integrins. Cell Tissue Res. 2001;305(3):285–298. doi: 10.1007/s004410100417. [DOI] [PubMed] [Google Scholar]
- 59.Lawson MA. The role of integrin degradation in post-mortem drip loss in pork. Meat Sci. 2004;68(4):559–566. doi: 10.1016/j.meatsci.2004.05.019. [DOI] [PubMed] [Google Scholar]
- 60.Zhang WG, Lonergan SM, Gardner MA, Huff-Lonergan E. Contribution of postmortem changes of integrin, desmin and μ-calpain to variation in water holding capacity of pork. Meat Sci. 2006;74(3):578–585. doi: 10.1016/j.meatsci.2006.05.008. [DOI] [PubMed] [Google Scholar]
- 61.Oh JH, Kim YK, Jung JY, Shin JE, Kim KH, Cho KH, Eun HC, Chung JH. Intrinsic aging- and photoaging-dependent level changes of glycosaminoglycans and their correlation with water content in human skin. J Dermatol Sci. 2011;62(3):192–201. doi: 10.1016/j.jdermsci.2011.02.007. [DOI] [PubMed] [Google Scholar]
- 62.Pinheiro MC, Mora OA, Caldini EG, Battlehner CN, Joazeiro PP, Toledo OM. Ultrastructural, immunohistochemical and biochemical analysis of glycosaminoglycans and proteoglycans in the mouse pubic symphysis during pregnancy. Cell Biol Int. 2005;29(6):458–471. doi: 10.1016/j.cellbi.2004.11.025. [DOI] [PubMed] [Google Scholar]
- 63.Jiang S, Jiang Z, Zhou G, Lin Y, Zheng CJJIA. Effects of dietary isoflavone supplementation on meat quality and oxidative stability during storage in lingnan yellow broilers. J Integr Agr. 2014;13(2):387–393. [Google Scholar]
- 64.Loeffen JL, Smeitink JA, Trijbels JM, Janssen AJ, Triepels RH, Sengers RC, van den Heuvel LP. Isolated complex I deficiency in children: clinical, biochemical and genetic aspects. Hum Mutat. 2000;15(2):123–134. doi: 10.1002/(SICI)1098-1004(200002)15:2<123::AID-HUMU1>3.0.CO;2-P. [DOI] [PubMed] [Google Scholar]
- 65.Smeitink J, van den Heuvel L. Human mitochondrial complex I in health and disease. Am J Hum Genet. 1999;64(6):1505–1510. doi: 10.1086/302432. [DOI] [PMC free article] [PubMed] [Google Scholar]
- 66.Distelmaier F, Koopman WJ, van den Heuvel LP, Rodenburg RJ, Mayatepek E, Willems PH, Smeitink JA. Mitochondrial complex I deficiency: from organelle dysfunction to clinical disease. Brain. 2009;132(Pt 4):833–842. doi: 10.1093/brain/awp058. [DOI] [PubMed] [Google Scholar]
- 67.Perier C, Tieu K, Guégan C, Caspersen C, Jackson-Lewis V, Carelli V, Martinuzzi A, Hirano M, Przedborski S, Vila M. Complex I deficiency primes Bax-dependent neuronal apoptosis through mitochondrial oxidative damage. Proc Natl Acad Sci U S A. 2005;102(52):19126–19131. doi: 10.1073/pnas.0508215102. [DOI] [PMC free article] [PubMed] [Google Scholar]
- 68.Ponsuksili S, Jonas E, Murani E, Phatsara C, Srikanchai T, Walz C, Schwerin M, Schellander K, Wimmers K. Trait correlated expression combined with expression QTL analysis reveals biological pathways and candidate genes affecting water holding capacity of muscle. BMC Genomics. 2008;9:367. doi: 10.1186/1471-2164-9-367. [DOI] [PMC free article] [PubMed] [Google Scholar]
- 69.Vargas-Galicia AJ, Sosa-Montes E, Rodríguez-Ortega LT, Pro-Martinez A, Ruiz-Feria CA, González-Cerón F, Gallegos-Sánchez J, Arreola-Enríquez J, Bautista-Ortega J. Effect of litter material and stocking density on bone and tendon strength, and productive performance in broilers. Can J Anim Sci. 2017;97(4):673–682. [Google Scholar]
- 70.Wu Y, Wang Y, Yin D, Wu W, Sun X, Zhang Y, Guo X, Chen J, Yuan J. Effect of supplementation of nicotinamide and sodium butyrate on the growth performance, liver mitochondrial function and gut microbiota of broilers at high stocking density. Food Funct. 2019;10(11):7081–7090. doi: 10.1039/c9fo00904c. [DOI] [PubMed] [Google Scholar]
- 71.Wu Y, Wang Y, Wu W, Yin D, Sun X, Guo X, Chen J, Mahmood T, Yan L, Yuan J. Effects of nicotinamide and sodium butyrate on meat quality and muscle ubiquitination degradation genes in broilers reared at a high stocking density. Poult Sci. 2020;99(3):1462–1470. doi: 10.1016/j.psj.2019.10.070. [DOI] [PMC free article] [PubMed] [Google Scholar]
- 72.National Research Council . Nutrient requirements of poultry. 9. Washington, DC: National Academy Press; 1994. [Google Scholar]
- 73.Liu Y, Yuan JM, Zhang LS, Zhang YR, Cai SM, Yu JH, Xia ZF. Effects of tryptophan supplementation on growth performance, antioxidative activity, and meat quality of ducks under high stocking density. Poult Sci. 2015;94(8):1894–1901. doi: 10.3382/ps/pev155. [DOI] [PubMed] [Google Scholar]
- 74.Cai K, Shao W, Chen X, Campbell YL, Nair MN, Suman SP, Beach CM, Guyton MC, Schilling MW. Meat quality traits and proteome profile of woody broiler breast (pectoralis major) meat. Poult Sci. 2018;97(1):337–346. doi: 10.3382/ps/pex284. [DOI] [PubMed] [Google Scholar]
- 75.Trapnell C, Pachter L, Salzberg SL. TopHat: discovering splice junctions with RNA-Seq. Bioinformatics. 2009;25(9):1105–1111. doi: 10.1093/bioinformatics/btp120. [DOI] [PMC free article] [PubMed] [Google Scholar]
- 76.Li B, Dewey CN. RSEM: accurate transcript quantification from RNA-Seq data with or without a reference genome. BMC Bioinformatics. 2011;12:323. doi: 10.1186/1471-2105-12-323. [DOI] [PMC free article] [PubMed] [Google Scholar]
- 77.Robinson MD, McCarthy DJ, Smyth GK. edgeR: a bioconductor package for differential expression analysis of digital gene expression data. Bioinformatics. 2010;26(1):139–140. doi: 10.1093/bioinformatics/btp616. [DOI] [PMC free article] [PubMed] [Google Scholar]
- 78.Xie C, Mao X, Huang J, Ding Y, Wu J, Dong S, Kong L, Gao G, Li CY, Wei L. KOBAS 2.0: a web server for annotation and identification of enriched pathways and diseases. Nucleic Acids Res. 2011;39(Web Server issue):W316–W322. doi: 10.1093/nar/gkr483. [DOI] [PMC free article] [PubMed] [Google Scholar]
Associated Data
This section collects any data citations, data availability statements, or supplementary materials included in this article.
Supplementary Materials
Additional file 1: Figure S1. Inflammatory mediator regulation of RTP channels pathway analysis. Differential expressed genes that are involved in the inflammatory mediator regulation of RTP channels [map 04750], are highlighted. We thank Kanehisa Laboratories for providing the copyright permission of KEGG pathway maps [29].
Additional file 2: Figure S2. Chemokine signaling pathway analysis. Differential expressed genes that are involved in the chemokine signaling pathway [map 04062], are highlighted. We thank Kanehisa Laboratories for providing the copyright permission of KEGG pathway maps [29].
Additional file 3: Figure S3. Calcium signaling pathway analysis. Differential expressed genes that are involved in the calcium signaling pathway [map 04020], are highlighted. We thank Kanehisa Laboratories for providing the copyright permission of KEGG pathway maps [29].
Additional file 4: Figure S4. ECM-receptor interaction pathway analysis. Differential expressed genes that are involved in the inflammatory mediator regulation of RTP channels [map 04512], are highlighted. We thank Kanehisa Laboratories for providing the copyright permission of KEGG pathway maps [29].
Additional file 5: Figure S5. Adherens junction pathway analysis. Differential expressed genes that are involved in the adherens junction [map 04520], are highlighted. We thank Kanehisa Laboratories for providing the copyright permission of KEGG pathway maps [29].
Additional file 6: Figure S6. Focal adhesion pathway analysis. Differential expressed genes that are involved in the focal adhesion [map 04510], are highlighted. We thank Kanehisa Laboratories for providing the copyright permission of KEGG pathway maps [29].
Additional file 7: Fig. S7. Oxidative phosphorylation pathway analysis. Differential expressed genes that are involved in the oxidative phosphorylation [map 00190], are highlighted. We thank Kanehisa Laboratories for providing the copyright permission of KEGG pathway maps [29].
Additional file 8: Figure S8. Regulation of lipolysis in adipocytes pathway analysis. Differential expressed genes that are involved in the Regulation of lipolysis in adipocytes [map 04923], are highlighted. We thank Kanehisa Laboratories for providing the copyright permission of KEGG pathway maps [29].
Additional file 9: Figure S9. Glycolysis/Gluconeogenesis pathway analysis. Differential expressed genes that are involved in the Glycolysis/Gluconeogenesis [map 00010], are highlighted. We thank Kanehisa Laboratories for providing the copyright permission of KEGG pathway maps [29].
Additional file 10: Figure S10. Arachidonic acid metabolism pathway analysis. Differential expressed genes that are involved in the arachidonic acid metabolism [map 00590], are highlighted. We thank Kanehisa Laboratories for providing the copyright permission of KEGG pathway maps [29].
Data Availability Statement
All the sequencing data are deposited in SRA under the Bioproject accession number PRJNA558637.