Figure 4.
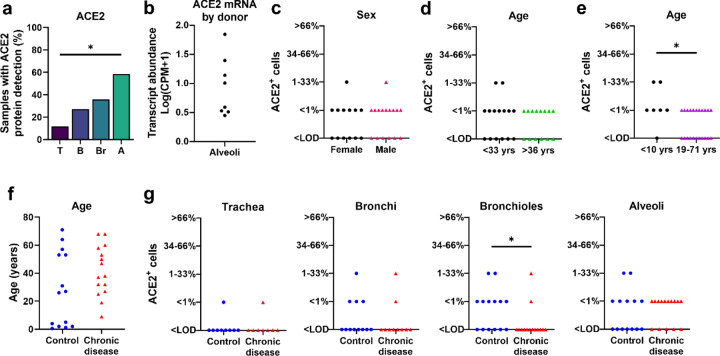
ACE2 distribution and scores in respiratory tissues. a) ACE2 protein had progressively increased detection between donors in tissues from trachea (T), bronchi (B), bronchioles (Br), to alveoli (A), (P=0.0009, Cochran-Armitage test for trend). b) Single-cell RNA sequencing reanalyses of ACE2 mRNA transcript abundance in the alveoli shows variation between donors (23). c-d) ACE2 protein scores from lung donors showed no differences based on sex or lower vs. upper ages (using median age as a cut-off) (A, P=0.7338 and B, P=0.7053, Mann-Whitney U test). e) ACE2 protein scores were elevated in young children (<10 yrs) compared to the remaining subjects (19–71 yrs) (P=0.0282 Mann-Whitney U test). f) Control and chronic disease groups did not have any significant differences in age (P=0.1362 Mann-Whitney U test). g) ACE2 protein scores for trachea, bronchi, bronchiole, and alveoli in control versus chronic disease groups (P= >0.9999, 0.6263, 0.0433, and 0.7359, respectively, Mann-Whitney U test). Each symbol represents one donor. CPM: counts per million. LOD: Limit of detection.

