

Abstract
Network embedding is a method to learn low-dimensional representations of nodes in networks, which aims to capture and preserve network structure. Most of the existing methods learn network embedding based on distributional similarity hypothesis while ignoring adjacency similarity property, which may cause distance bias problem in the network embedding space. To solve this problem, this paper proposes a unified framework to encode distributional similarity and measure adjacency similarity simultaneously, named DDNE. The proposed DDNE trains a siamese neural network which learns a set of non-linear transforms to project the node pairs into the same low-dimensional space based on their first-order proximity. Meanwhile, a distance constraint is used to make the distance between a pair of adjacent nodes smaller than a threshold and that of each non-adjacent nodes larger than the same threshold, which highlight the adjacency similarity. We conduct extensive experiments on four real-world datasets in three social network analysis tasks, including network reconstruction, attribute prediction and recommendation. The experimental results demonstrate the competitive and superior performance of our approach in generating effective network embedding vectors over baselines.
Keywords: Network embedding, Social network, Metric learning
Introduction
Network embedding, as one of network representation learning methods, has been successfully applied in a wide variety of network-based analysis tasks, such as link prediction, network reconstruction, node classification, etc. Different from traditional adjacency matrix representation, which suffers from high dimensionality and data sparsity, network embedding aims to represent each node in a given network as a vector in a low-dimensional latent space.
In order to well preserve the structure of a given network, existing researches encode local proximity, and inherent properties to learn network embedding [1, 6, 8]. Typically, Node2vec, DeepWalk and Line [2, 7, 9] approximate nodes’ local proximity, including the first- and second-order proximity, via random walks or neural network models with specific objective functions. The essence is to learn the vector representation of a node by predicting its neighborhood, which is inspired by the word embedding principle. Based on this principle, the vector representation satisfies the distributional similarity property of network, i.e. nodes with similar neighborhoods are closer in the network embedding space.
In practical applications, there is another fundamental property of network besides distributional similarity, called adjacency similarity. adjacency similarity means that a pair of nodes are similar in some aspects. For example, in the link prediction task, node pairs with higher similarity are more likely to be considered as adjacent nodes. In the label propagation task, the adjacent nodes are considered sharing the common labels. So, adjacent nodes should be closer than non-adjacent ones in the network embedding space. However, in most of previous embedding learning methods, this adjacency similarity is ignored, which may generate distance bias in the network embedding space [4].
Figure 1 shows an example of what is the distance bias. In Fig. 1(a), node  and
and  share the same neighbors, but there is no link between them. In contrast, we add a link between node
  and
and  in Fig. 1(b). As a result of previous method (taking DeepWalk as an example), the distance between
  and
and  in Fig. 1(a) is smaller than that in Fig. 1(b) in the network embedding space (shown in Fig. 1(c)). However, if adjacency similarity is taken into consideration, the distance between
  and
and  in Fig. 1(a) would be larger than that in Fig. 1(b) (shown in Fig. 1(e)). We call this inaccurate estimation of distance between two nodes as a distance bias problem.
Fig. 1.

Global adjacency similarity and distance bias: Figure 1(a) and Fig. 1(b) are the small part of the given network. Figure 1(c) to Fig. 1(f) are the embedding visualization of Figure 1(a) and Fig. 1(b). Each point indicates one neighbor of ego-node (triangle).
To address the distance bias problem, we propose a novel node embedding method to simultaneously preserve the distributional similarity and adjacency similarity property of the network. This model consists of two modules: the Node Encoder and the Distance Metric-learner. For a given network, Node-encoder encodes the first-order proximity of the nodes using a neural network model. In the input layer, each node is represented as a sequence of its neighbors, and then it goes through multiple non-linear transformation in hidden layers. Because different neighbors contribute to similarity measurement differently, we adopt the attention mechanism to adaptively assign weight to different neighbors. The output is node embedding representation, and nodes with common neighbors will gain similar encoding. The Distance Metric-learner measures the distance of pair-wise node embedding vectors, which aims to assign the adjacent nodes-pair a smaller distance to highlight the adjacency similarity. For this purpose, we use a well-designed objective function to pull the node toward its neighbors, and push non-adjacent nodes further away. Based on this, the structure of the network would be preserved better in the embedding space.
To verify the effectiveness of our approach, we conduct experiments through network reconstruction, attribute prediction and recommendation tasks on four real-world datasets. We take five state-of-the-art embedding algorithms as comparative methods. The experimental results show that our approach is able to not only solve the distance bias problem, but also outperform comparative methods in all above tasks, especially in network reconstruction.
In summary, the main contributions of this paper are as follows:
We analyze the distance bias problem in traditional network embedding methods, which is induced by disregarding the adjacency similarity property.
We propose a discriminative distance metric learning method to preserve the adjacency similarity property of networks and improve the effectiveness of node representations.
We evaluate our method on three tasks over four datasets and experimental results show that our approach achieves a significant improvement.
Proposed Approach
In this section, we present the details of the proposed network embedding based on neural network and attention mechanism. Firstly, we briefly introduce the definition of the problem. Then we discuss the details of the proposed discriminative distance metric learn model DDNE. Finally, we present some discussion and implementation of our objective function.
Preliminaries
Notations. Given a network  ,
,  represents the set of nodes and
  represents the set of edges. We define the adjacency matrix of G as
  , where
  if
if  and
and  linked by an edge, otherwise,
  . Accordingly, given a node pair
  in the network,
  is also the adjacency relation label of this node pair. D is a diagonal matrix, where
  represents the degree of
  .
.
Distributional Similarity. In this paper, the distributional similarity describes the relationship between node and its first-order proximity. For a node  ,
,  denotes a set of nodes directly connected to
  . The distributional similarity of
  is generated by its neighbors
  , which means that nodes with similar neighborhoods are closer in the network embedding space.
Adjacency Similarity. In the network embedding space, the learned embedding vectors of two nodes are expected closer if they are adjacent. Accordingly, for each node pair, if  , there exists a larger adjacency similarity than those without adjacency relation.
Network Embedding. Given a network denoted as  , network embedding aims to learn a mapping function
  , where
  . The objective of our method is to make the distance between adjacent node pair closer than those node pairs without adjacency relation in the embedding space, while the distance between node pairs with similar neighbors(distributional similarity) is also closer in this space.
DDNE
Framework. In this paper, we propose a Discriminative Distance metric learning framework to perform Network Embedding (DDNE), as shown in Fig. 2. In details, this framework consists of two modules: Node Encoder and Distance Metric-learner. Node-encoder encodes each node into embedding vector based on its first-order proximity, while the Distance Metric-learner measure the distance of pair-wise node embedding vectors with some constraints to eliminate the distance bias problem.
Fig. 2.
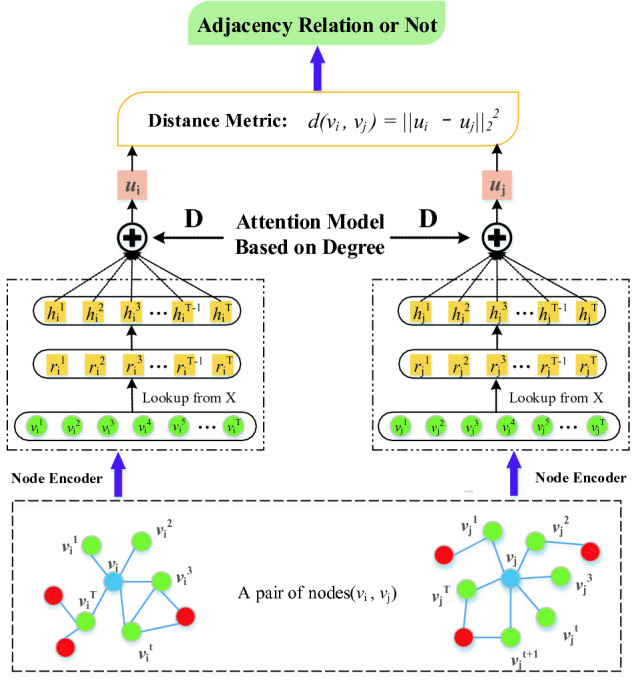
Framework of the DDNE model.
Node Encoder. Formally, for ego-node  with T neighbors
  , his neighbors can be modelled as a sequence which is the input vector of neural network:
 |
where  denotes network structure information about
  th neighbor, which is lookup from the adjacency matrix of network X. For a given node
  , the output of hidden layer
  encode the representation of
  ’s t-th neighbor.
 |
1 |
where k denotes the k-th layer of our neural network,  . Then the first-order proximity of node
  is:
is:
 |
The embedding vector of node is a sum of its first-order proximity elements, which makes sure that nodes with common neighbors will gain similar encoding (local distributional similarity). As different neighbors contribute to similarity measurement differently, as assumed in Sect. 1, we adopt the attention mechanism to adaptively assign weight to different neighbors.
 |
2 |
 |
3 |
 |
4 |
where  is a trained projection matrix;
  and
and  are the degree of node
  and
and  , and
, and  is the embedding vector of node
In the attention phase, we calculate the weight  of neighbor
  by Eq. (3), which makes sure that the weight is larger when the degree of
  is comparable with
  . Node embedding vector
  is computed by Equation (4). The advantage of our attention model is that it can dynamically learn the weight of each neighbor according to its degree with the ego-node (same, large or low).
Distance Metric-Learner. Embedding vectors generated by distributional similarity based methods may generate distance bias problem. That is to say, the distance between non-adjacent nodes is closer than adjacent nodes, which does not conform with reality. In order to eliminate this problem, we measure the adjacency similarity using distance metric learning method, which aims to pull the distance between adjacent nodes-pair closer to highlight the adjacency similarity. For this purpose, we propose a distance constraint to restrict the distance margin between node pair with adjacency relation (positive node pair) and node pair without adjacency relation (negative node pair). Based on this, the adjacency similarity would be measured and the distance bias problem in the embedding space would be eliminated, as shown in Figure 3.
Fig. 3.
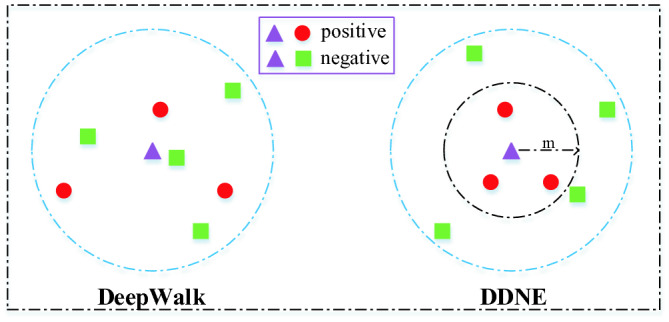
Distance Constraint: there are two embedding spaces which are generated by DeepWalk and DDNE respectively. We sample seven nodes in each space, where one of them is the ego-node (purple triangle) and others are the neighbors (red circle) or non-adjacent nodes (green rectangle) of the ego-node. In DDNE, a distance constraint is used to make the distance between a pair of adjacent nodes smaller than a threshold and that of each non-adjacent nodes larger than the same threshold. Under this constraint, our method eliminates the bias problem existed in DeepWalk. (Color figure online)
Distance Constraint: The distance between positive pair should be smaller than a pre-specified margin m ( ) and the negative pair should be larger than m. Thus, the constraint between margin m and
  is that:
 |
5 |
where  is
is
 |
Objective Function. Formally, we transform the above distance constraint into the following optimization problem:
 |
6 |
where m and  are represent the distance margin and the distance between
  and
and  , respectively. The loss function of Eq. (5) pulls the nodes toward
  ’s neighbor, and pushes non-adjacent nodes further away.
Accordingly, for all node pairs, the objective function of DDNE is that
 |
7 |
Experiment
In this section, we firstly introduce datasets and baseline methods in this work. We then evaluate our proposed methods in three network analysis tasks: network reconstruction, attribute prediction and recommendation. Finally, we analyze the quantitative experimental results and investigate the sensitivity across parameters.
Datasets and Baseline Methods
Datasets. We conduct our experiments on four networks, including two social networks, one citation network and one recommendation network. Table 1 shows the detailed information about those four networks. The description of those four networks are shown as following:
Google+1 is one of social networks. In which, nodes represent users and each has gender, university title, job title, last-name and workspace as its attribute.
Sina2 is the social network. In this network, users have attributes such as following number, self-introduction, constellation, age and location.
DBLP3 is a citation network in which nodes refer to papers and edges represent the citation relationship among papers. Each paper has attributes like title, authors, publication venue and abstract.
Movieslens4 is a recommendation network in which nodes refer to users and movies respectively and edges represent viewing record between users and movies. Each user has age, gender and occupation as its attribute information.
Table 1.
The statistic of datasets
| Data | Nodes | Edges | Categories |
|---|---|---|---|
| Google+ | 3,126 | 22,829 | 7 |
| Sina | 29,418 | 800,174 | 8 |
| DBLP | 244,021 | 4,354,534 | 9 |
| Movieslens | 943 | 100,000 | 4 |
Baseline Methods. We compare DDNE with the following baseline methods:
SDNE [13] is the best topology-only network embedding method, which introduces an auto-encoder algorithm to learn the node embedding vector and considers the first-order and second-order proximities information.
LINE [9] is a popular topology-only network embedding method, which also considers the first-order and second-order proximities information.
DeepWalk [7] is a topology-only network embedding method, which introduces the Skip-gram algorithm to learn the node embedding vector.
GraphGAN [10] is a topology-only network embedding method, which introduces the GAN network to learn the node embedding vector.
DDNE is our proposed method using neural network (NN or LSTM) to model the distributional similarity and distance metric learning to model the adjacency similarity, which include
 and
and  .
.Sigmoid: In this method nodes are represented by the local proximity through neural network (NN or LSTM) and the network structure is preserved through the sigmoid loss function, which includes
 and
and  .
.
Parameter Setup. For all datasets, the dimension of the learned node embedding vector d is set to 128. In SDNE method, parameters are set to the same as given in the original paper. In DeepWalk method, the parameters are set as following: window size  , walks per node
  and walk length
  . In LINE, we set
  and
and  million. And in DDNE method the parameters are set as
  and learning rate
  .
.
Distance Bias Analysis
We utilize the embedding space generated by various network embedding methods to analyze the distance bias problem. Then we sample 100 positive node pairs in each network dataset and 100 negative node pairs. The average Euclidean distance is used to evaluate the performance of each embedding methods, as shown in Fig. 4.
Fig. 4.
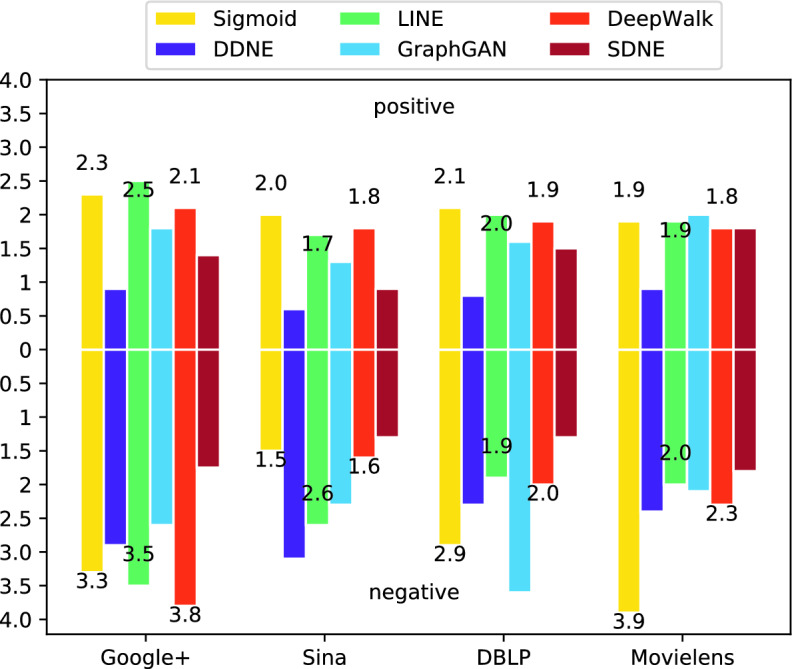
Average Euclidean distance on networks.
From Fig. 4, we can see some phenomenon:
Compared with baselines, DDNE can guarantee consistency of the phenomenon that the distance between positive node pairs is closer than the distance between negative node pairs on different datasets. For example, with the sigmoid method, the distance between positive node pairs on Sina dataset is 2.0 but the distance between negative node pairs is 1.5, this distance bias is obviously contrary to cognition. Similarly, LINE and SDNE on DBLP, DeepWalk on Sina will also result in distance bias.
In contrast, the distances between positive node pairs with DDNE are smallest on all datasets, which means that the embedding vectors obtained by DDNE can better reflect the network structure.
Network Reconstruction
As the embedding of a network, the learned embedding feature space is expected to well reconstruct the network. Generally, a good network embedding method should ensure that the learned node’s embedding vectors can preserve the original network structure. That is also the reason why we conduct this experiment. We use a social network Sina and a paper citation network DBLP as embedding networks. Given a network, we use different network embedding methods to learn the node embedding vectors in feature space  . The network reconstruction task is reconstructing the network edges based on distances between nodes in the feature space
  . We denote the probability of existing edges between
  and
and  is that:
 |
8 |
Besides, a threshold  is pre-defined and an edge
  will be created if
  . As the existing edges in the original network are known and can serve as the positive label-data, while the equal amount node pairs which do not exist edges are generated and can serve as the negative label-data. We can evaluate the reconstruction performance of different embedding methods. The accuracy is used as the evaluation metrics and the result is presented in Fig. 5.
Fig. 5.

Precision of network reconstruction on Sina and DBLP.
From Fig. 5, we can see that DDNE achieves the best performance when  , which improves the accuracy by
  at most comparing to the best baseline SDNE. In addition, our method is more sensitive to the pre-defined threshold
  , which indicates that DDNE preserves the network structure better than other methods because there is a clearly distance margin between positive node pairs and negative node pairs in the embedding space generated by DDNE.
Parameter Sensitive Analysis. DDNE has two major parameters: the dimension of embedding vector d and the margin m. We only present the result on Sina and DBLP and omit others due to space limitation. In this experiment, d varies from 10 to 300 and m varies from 0.1 to 2. Figure 6(a) and 6(b) show the accuracy resulted by our method with different embedding dimension. When the embedding dimensions grow, the performance firstly increases significantly, and then does not change drastically for both  and
and  as the dimension rose to
  . Besides, on DBLP, the accuracy even increases significantly when the embedding dimensions increases. The figure also shows that
  beat the best performance and is able to obtain a fairly better accuracy when
  .
.
Fig. 6.

DDNE parameter analysis
The margin m also influence the attribute prediction performance, as shown in Fig. 6(c) and 6(d). The  is more sensitive to the margin value m. This is largely due to the fact that in
  , the local proximity is encoded by the neural network but not the sequence model. The former could encode local proximity better because, for the neighborhood, the sequence characteristics do not obvious. Thus, the influence of m is manifested in the
  .
.
Attribute Prediction
We utilize the vectors generated by various network embedding or social network embedding methods to preform profile prediction task. User always cancel their attribute information or no attributes were filled in because personal attributes often involve users’ privacy issues, which results in a problem that user’s essential information can not be obtained directly. Thus, attribute prediction task can solve this problem and we treat this task as a classification problem. In our experiment, the embedding vector of each node (user) is treated as its feature vector, and then we use a linear support vector machine model to return the most likely category(value) of the missing attribute. For each dataset, we predict occupation. The training dataset consists of  - portion nodes which are randomly picked from the network, and the rest of users are the test data.
Occupation Prediction. We make the experiment about occupation prediction. The result of this experiment is shown in Table 2.
Table 2.
Precision of occupation prediction (%)
| Methods |  |
SDNE | DeepWalk | LINE | GraphGAN |  |
 |
 |
 |
|---|---|---|---|---|---|---|---|---|---|
| Google+ | 30% | 52.3 | 46.8 | 40.9 | 52.2 | 54.6 | 54.3 | 51.4 | 51.3 |
| 40% | 51.9 | 46.2 | 50.1 | 55.4 | 56.3 | 55.9 | 53.1 | 53.2 | |
| Sina | 30% | 62.9 | 61.9 | 64.8 | 65.4 | 65.4 | 63.9 | 61.8 | 61.5 |
| 40% | 65.3 | 63.1 | 66.2 | 67.1 | 68.3 | 67.5 | 65.2 | 66.0 | |
| Movieslens | 30% | 56.4 | 53.9 | 55.6 | 57.3 | 59.2 | 58.7 | 56.1 | 56.2 |
| 40% | 58.5 | 55.2 | 57.8 | 59.9 | 61.3 | 60.5 | 58.2 | 58.9 |
One can see that DDNE also outperforms other embedding methods. Comparing to the best baseline GraphGAN, our method improve the accuracy by  at most. Besides, DDNE performs better than Sigmoid which demonstrates that the effective of our distance metric leaning objective function can help preserve the network structure better.
Recommendation
In this section, we concentrate on the recommendation task and conduct the experiment on Movieslens and DBLP datasets. Given a snapshot of the current network, recommendation tasks refers to recommend new item (movies or papers) that will be picked by users or added in the future time. In order to process this recommendation task, we remove a portion of existing links from the input network. Based on the residual network, nodes embedding vectors are learned by different embedding methods respectively. Node pairs in the remove edges are considered as the positive samples. We also randomly sample the same number of the node pairs which are not connected as the negative samples. Positive and negative samples form the balanced data set. Given a node pair in the sample dataset, we compute the cosine similarity as the score function. The higher node pair score, the greater the possibility of being recommended. Area Under Cur (AUC) is used to evaluate the consistency between the labels and the similarity scores of the samples.
From Table 3, we can see that DDNE performs best in both movies and papers recommendation. Compared to the SDNE, DDNE improves the AUC score by  in Movieslens and
  in DBLP, which demonstrates the effectiveness of DDNE in learning good node embedding vectors for the task of recommendation.
Table 3.
AUC of recommendation
| Methods | SDNE | DeepWalk | LINE | GraphGAN |  |
 |
 |
 |
|---|---|---|---|---|---|---|---|---|
| Movieslens | 65.9 | 62.3 | 63.6 | 64.8 | 79.8 | 78.9 | 71.2 | 71.9 |
| DBLP | 78.7 | 75.2 | 76.1 | 76.8 | 88.9 | 88.2 | 81.0 | 80.6 |
Related Work
Network embedding aims to learn a distributed representation vector for each node in a network. Most of existing works can be categorized into three categories: matrix factorization based, random walking based and deep learning based methods. Matrix factorization based methods first express the input network with a affinity matrix into a low-dimensional space using matrix factorization techniques, including singular value decomposition which seeks a low-dimensional projection of the input matrix, and spectral decomposition (eigen-decomposition) [3] which uses a spectral decomposition of the graph Laplacian to compute the low-dimensional representation of input data. However, matrix factorization based methods rely on the decomposition of the affinity matrix, which is time-consuming when the data is large real-world networks.
Random Walk is an optimization algorithm in Graph, which can compute the globally optimal solution. As the first attempt, DeepWalk [7] introduces the word2vec algorithms(skip-gram) into learn the embedding of nodes in graph. Another famous work is Node2vec [2], which is a variant of Deepwalk. The most difference between those two is that node2vec changes random walk into biased random walk, and then it can select the next node in an heterogeneous way.
The last category is Deep learning based methods. Tang et al. propose LINE [9], which optimizes a carefully designed objective function through maximizing edge reconstruction probability. SDNE [13] is a deep network embedding method based on auto-encoder, which captures the highly non-linear network structure and exploits the first-order and second-order proximities to preserve the network structure. GraphGAN [10] is a framework that unifies generative and discriminative thinking for network embedding. DKN [12] learns knowledge graph embedding by TransX. The author used a CNN framework for combining word embedding and entity embedding and present an attention-based CTR prediction model meanwhile. SHINE [11] is a network embedding on signed heterogeneous information network, which is also based on auto-encoder.
Conclusion
In this paper, we introduce discriminative distance metric learning method to solve the distance bias problem. To adopt the adjacency similarity property, our model is able to preserve the network structure more efficiently. Experiments on three network analysis tasks verified the effectiveness of our approach. In the future work, we will research more deeply on the node encoder. On one hand, we will compare with other deep neural network models, such as CNN or deep RNN. On the other hand, we will try to integrate distributional similarity and adjacency similarity simultaneously in the node encoding phase.
Acknowledgement
This work was sponsored by the National Key R&D Program of China (NO. 2018 YFB1004704), the National Natural Science Foundation of China (U1736106).
Footnotes
Contributor Information
Valeria V. Krzhizhanovskaya, Email: V.Krzhizhanovskaya@uva.nl
Gábor Závodszky, Email: G.Zavodszky@uva.nl.
Michael H. Lees, Email: m.h.lees@uva.nl
Jack J. Dongarra, Email: dongarra@icl.utk.edu
Peter M. A. Sloot, Email: p.m.a.sloot@uva.nl
Sérgio Brissos, Email: sergio.brissos@intellegibilis.com.
João Teixeira, Email: joao.teixeira@intellegibilis.com.
Xiaoxue Li, Email: lixiaoxue@iie.ac.cn.
Yangxi Li, Email: liyangxi@outlook.com.
Yanmin Shang, Email: shangyanmin@iie.ac.cn.
Lingling Tong, Email: tonglong300@sina.com.
Fang Fang, Email: fangfang@iie.ac.cn.
Pengfei Yin, Email: yinpengfei@iie.ac.cn.
Jie Cheng, Email: chengjie@sgcc.com.cn.
Jing Li, Email: jingli@sgcc.com.cn.
References
- 1.Farnadi, G., Tang, J., Cock, M.D., Moens, M.: User profiling through deep multi modal fusion. In: Proceedings of the Eleventh ACM International Conference on Web Search and Data Mining, WSDM 2018, Marina Del Rey, CA, USA, 5–9 February 2018, pp. 171–179 (2018)
- 2.Grover, A., Leskovec, J.: node2vec: scalable feature learning for networks. In: Proceedings of the 22nd ACM SIGKDD International Conference on Knowledge Discovery and Data Mining, San Francisco, CA, USA, 13–17 August 2016, pp. 855–864 (2016) [DOI] [PMC free article] [PubMed]
- 3.Kipf, T.N., Welling, M.: Semi-supervised classification with graph convolution networks. CoRR (2016). abs/1609.02907
- 4.Feng, R., Yang, Y., Hu, W., Wu, F., Zhang, Y.: Representation learning for scale-free networks. In: Proceedings of the Thirty-Second AAAI Conference on Artificial Intelligence, New Orleans, Louisiana, USA, 2–7 February 2018 (2018)
- 5.Levy, O., Goldberg, Y.: Neural word embedding as implicit matrix factorization. In: Advances in Neural Information Processing Systems 27: Annual Conference on Neural Information Processing Systems 8–13 December 2014, Montreal, Quebec, Canada, pp. 2177–2185 (2014)
- 6.Li C, et al. PPNE: property preserving network embedding. In: Candan S, Chen L, Pedersen TB, Chang L, Hua W, et al., editors. Database Systems for Advanced Applications; Cham: Springer; 2017. pp. 163–179. [Google Scholar]
- 7.Perozzi, B., Al-Rfou, R., Skiena, S.: Deepwalk: online learning of social representations. In: The 20th ACM SIGKDD International Conference on Knowledge Discovery and Data Mining, KDD 2014, New York, NY, USA 24–27 August 2014, pp. 701–710 (2014)
- 8.Ribeiro, L.F.R., Saverese, P.H.P., Figueiredo, D.R.: struc2vec: learning node representations from structural identity. In: Proceedings of the 23rd ACM SIGKDD International Conference on Knowledge Discovery and Data Mining, Halifax, NS, Canada, 13–17 August 2017, pp. 385–394 (2017)
- 9.Tang, J., Qu, M., Wang, M., Zhang, M., Yan, J., Mei, Q.: LINE: large-scale in formation network embedding. In: Proceedings of the 24th International Conference on World Wide Web, WWW 2015, Florence, Italy, 18–22 May 2015, pp. 1067–1077 (2015)
- 10.Wang, H., et al.: Graphgan: graph representation learning with generative adversarial nets. In: Proceedings of the Thirty-Second AAAI Conference on Artificial Intelligence, New Orleans, Louisiana, USA, 2–7 February 2018 (2018)
- 11.Wang, H., Zhang, F., Hou, M., Xie, X., Guo, M., Liu, Q.: SHINE: signed heterogeneous information network embedding for sentiment link prediction. In: Proceedings of the Eleventh ACM International Conference on Web Search and Data Mining, WSDM 2018, Marina Del Rey, CA, USA, 5–9 February 2018, pp. 592–600 (2018)
- 12.Wang, H., Zhang, F., Xie, X., Guo, M.: DKN: deep knowledge-aware network for news recommendation. In: Proceedings of the 2018 World Wide Web Conference on World Wide Web, WWW 2018, Lyon, France, 23–27 April 2018, pp. 1835–1844 (2018)
- 13.Wang, D., Cui, P., Zhu, W.: Structural deep network embedding. In: Proceedings of the 22nd ACMSIGKDD International Conference on Knowledge Discovery and Data Mining, San Francisco, CA, USA, 13–17 August 2016, pp. 1225–1234 (2016)