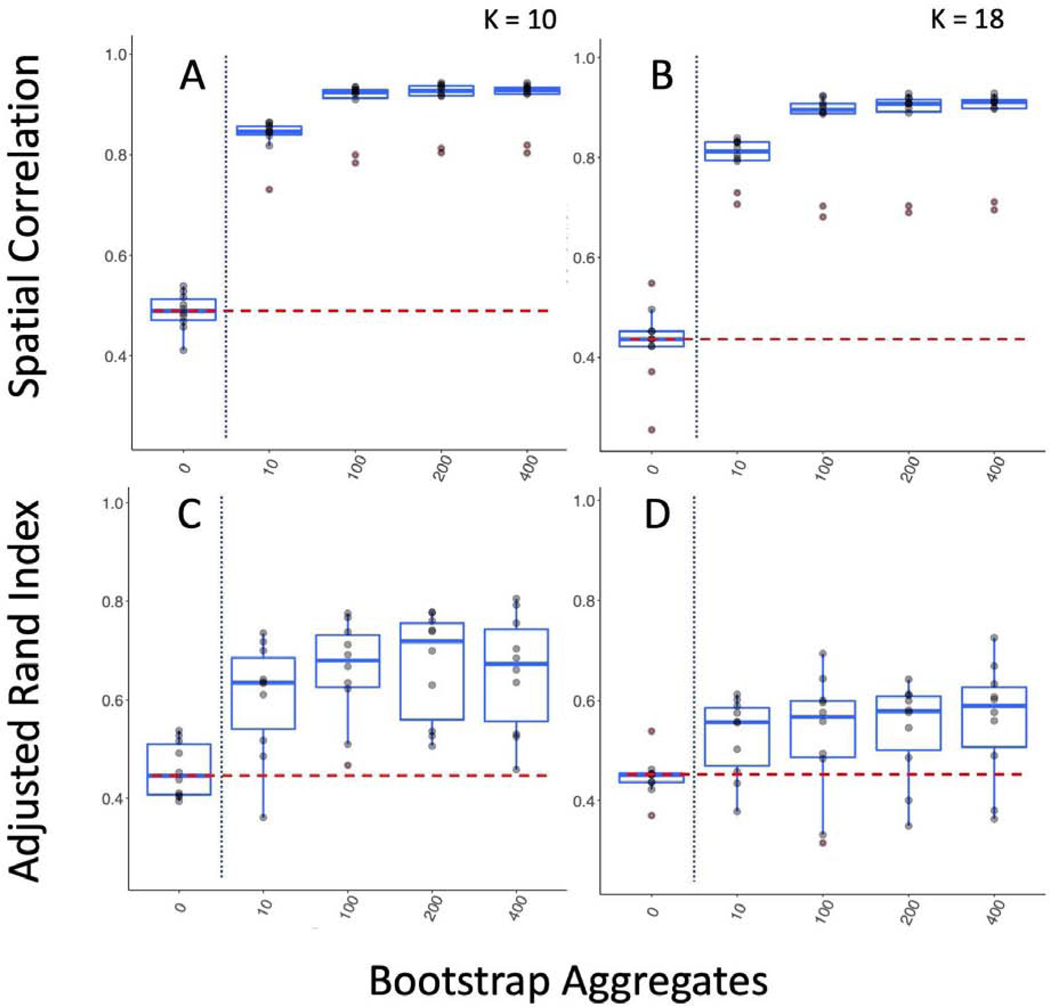
Figure 7-.
Bagging Improves Reproducibility of Group Level Within Sample/Between Scan Subcortical Parcellations. We split the 300 participants of the GSP dataset into 10 groups of 30 and compare the parcellations of their first and second functional scan to one another. The vertical dotted blue line marks the standard clustering approach on the left, and the bagging approach on the right. The horizontal dashed red line shows the highest mean reproducibility of the standard parcellation approach. A & B show the improvement in bagged parcellations measured by spatial correlation of the group mean adjacency matrix for 10 and 18 clusters respectively. C & D show the improvement in bagged parcellations measured by the ARI of the cluster labels for 10 and 18 clusters respectively.

