Abstract
Objectives:
To validate the fatigue lifetime of a reduced-diameter dental implant system predicted by three-dimensional finite element analysis (FEA) by testing physical implant specimens using an accelerated lifetime testing (ALT) strategy with the apparatus specified by ISO 14801.
Methods:
A commercially-available reduced-diameter titanium dental implant system (Straumann Standard Plus NN) was digitized using a micro-CT scanner. Axial slices were processed using an interactive medical image processing software (Mimics) to create 3D models. FEA analysis was performed in ABAQUS, and fatigue lifetime was predicted using fe-safe® software. The same implant specimens (n=15) were tested at a frequency of 2 Hz on load frames using apparatus specified by ISO 14801 and ALT. Multiple step-stress load profiles with various aggressiveness were used to improve testing efficiency. Fatigue lifetime statistics of physical specimens were estimated in a reliability analysis software (ALTA PRO). Fractured specimens were examined using SEM with fractographic technique to determine the failure mode.
Results:
FEA predicted lifetime was within the 95% confidence interval of lifetime estimated by experimental results, which suggested that FEA prediction was accurate for this implant system. The highest probability of failure was located at the root of the implant body screw thread adjacent to the simulated bone level, which also agreed with the failure origin in physical specimens.
Significance:
Fatigue lifetime predictions based on finite element modeling could yield similar results in lieu of physical testing, allowing the use of virtual testing in the early stages of future research projects on implant fatigue.
1. Introduction
In recent decades, dental implants have been widely used as an effective method to replace missing teeth and improve the patient’s quality of life. According to the facts and figures provided by the American Academy of Implant Dentistry, over 5.5 million dental implants had been placed by United States dentists as of 2006. Although most of the clinical studies reported overall five-year success rates of 93% to 97% for dental implants, biological and technical complications are still frequently observed [1–5]. Technical complications of dental implants include abutment screw loosening or fracture, implant body fracture, and abutment and superstructure fracture [6]. In some cases, surgical intervention is required to remove the implant [7]. Mechanical fatigue is widely recognized as a major reason associated with the technical complications for metal dental implants because they are subjected to repeated masticatory load in the oral environment throughout the whole service life [8]. Fatigue failure manifests as three distinct stages: microscopic cracks initiated from the small imperfections in the area of stress concentration, subcritical crack growth, and final catastrophic failure after a crack reaches the critical stress intensity factor. Among these three stages, the crack initiation stage consumes up to 90 % of the total fatigue lifetime of titanium and its alloys, yet there is usually no early sign to be noticed or detected during this stage until the final rapid fracture happens [9]. This can partially explain that technical complications are rarely observed in early implant failures but more frequently occur for the late failures. It is also worthy to note that the incidence of implant fracture is likely to be underestimated because long-term clinical studies for dental implants are limited, and a significant sponsorship bias has been detected in this area of the literature [10]. Since the significance of fatigue study of dental implants is widely recognized, a standardized fatigue testing protocol was developed in 2003 by the Organization for International Standardization (ISO 14801:2003) and revised in 2007. The ISO standard requires that the testing should be conducted at 2 Hz and carried out until failure or two million cycles in liquid media or conducted at 15 Hz until 5 million cycles in dry conditions [11]. By following this standard, testing for a single specimen could take approximately 11.5 days. Additionally, a relatively large sample size is needed for cyclic fatigue testing because lifetime data usually show much more variation than strength data. Apparently, fatigue testing of dental implants is very expensive in terms of both testing time and procurement of specimens, especially considering that the market develops so quickly, and there is less and less time for a new design to be finished and launched.
The finite element (FE) method is an efficient and well-established tool for mechanical study. It is a numerical method for stress and deformation analysis by discretizing a continuous structure into a finite number of elements. This method provides great capability to solve problems with complex geometry, which could not be solved properly by classical analytical methods, for example, anatomical structures of the human body [12–14]. For dental implants, FE analysis has been used to evaluate the biomechanical performance of various prostheses and loading conditions, investigate the stress distribution in the supporting bone tissue, and provide case-specific surgical planning and clinical outcome prediction [15–18]. In addition to the static stress distribution, the cyclic fatigue lifetime can also be possibly predicted with the help of a fatigue post-processor using the stress and strain results of FE analysis at a given load. This method has been frequently used in the automotive industry for fatigue design, durability analysis, prototype assessment, component testing and whole vehicle test control over the past 20 years. Modern fatigue models include stress-based life analyses such as von Mises analysis and maximum principal stress analysis, as well as local strain life algorithms such as maximum principal strain analysis, maximum shear strain, and Brown-Miller combined strain analysis [19]. Although FE-based fatigue analysis is commonly used for reliability studies in engineering, it has been relatively rare to be applied in the biomedical fields. Those FE-based fatigue studies which were validated by cyclic fatigue tests of physical biomedical specimens are even fewer. Oh et al. calculated the characteristic failure load of three-unit fixed partial dentures with different connector designs by using a finite element software (ANSYS, ANSYS, Inc.) in conjunction with a ceramic analysis and reliability estimation software (CARES/Life, NASA Lewis Research Center, Cleveland, OH) using the finite element results [20]. It was found that the experimentally measured rapid-fracture failure loads correlated well with those predicted by finite element simulation. Fischer et al. predicted the lifetime for dental ceramic bridges by using ANSYS for FE analysis and CARES/Life and suggested that it is a suitable tool to evaluate the lifetime expectations for different dental ceramic materials and bridge designs [21]. For dental implants, there have been several FEA-based fatigue analysis studies, but these results were not correlated with the cyclic fatigue data of physical specimens [22–24]. On the other hand, a few experimental studies were done to predict the lifetime of dental implant systems, but only failure location or strain were correlated with the results of the finite element models, not the lifetime data [25, 26]. Therefore, in this study, we hypothesized that the lifetime of a reduced-diameter titanium implant system could be successfully predicted by using FE analysis with a fatigue post-processor. A comparison between the FE-based lifetime data and the cyclic fatigue data of this implant system under similar testing conditions was performed to test this hypothesis.
2. Materials and methods
2.1. Finite Element Modeling
A commercial 3.3-mm diameter titanium dental implant system (Standard Plus Implant NN, Straumann, Basel, Switzerland) was scanned using an X-ray micro-computed tomography (micro-CT) scanner (Skyscan1172, Micro Photonics Inc., Allentown, PA) with the pixel size of 4.25 μm. This implant system is made of CP grade 4 titanium with an external hex connection and a 3.5-mm implant/abutment platform. Fig. 1(a) shows the X-ray projection image of an implant specimen. Fig. 1(b) shows the transverse view of the CT scan after reconstruction. Transverse sections (n=5882) were generated and processed using medical image modeling software (Mimics X64 v13.1, Materialise, Leuven, Belgium). The dimensions of the specimen components (implant body, abutment, abutment screw, cylindrical base, and hemispherical loading cap) were measured using the medical image modeling software, and then the CAD module of finite element analysis software (ABAQUS CAE v6.8–4, Simulia, Johnston, RI) was used to make 3D geometrical models of components having the measured dimensions. The components were assembled according to ISO 14801 to make the numerical study comparable to the experimental study. An 11-mm moment arm was modeled from the central point of the loading cap to the simulated bone level. FE analysis was performed with a 30-degree off-axis loading. The volume meshes were generated by seeding and meshing the parts in ABAQUS CAE (Simulia, Johnston, RI). The element type was C3D4 (tetrahedral element with four nodes) for all of the components. Successive iterations of global mesh refinement were conducted until the maximum strain predicted was no longer changing with increasing mesh density. The final number of elements for each component are listed in the Table 1. Young’s modulus of 104 GPa and Poisson’s ratio of 0.34 as found in the literature [27] were assigned to the Grade 4 CP Ti implant components in the model. Young’s modulus of 16 GPa and Poisson’s ratio of 0.39 were assigned to the holder block material. The specimen holder was a glass fiber-phenolic resin composite material (G10, Piedmont Plastics, Charlotte, NC), and its elastic constants were determined using ultrasonic pulse method. The method was described previously [28]. The mean and standard deviation (n=3) determined for the properties of G10 were 15.9 ± 0.3 GPa for Young’s modulus and 0.397 ± 0.006 for Poisson’s ratio. The materials of all the components were considered to be homogeneous, linearly elastic, and isotropic in this study. The nodes on the bottom surface of the holder block were constrained with displacement as zero in three directions. Fig. 2 shows the FE models of separated components and the whole specimen. Finally, the meshed models were submitted and analyzed in ABAQUS.
Fig. 1.
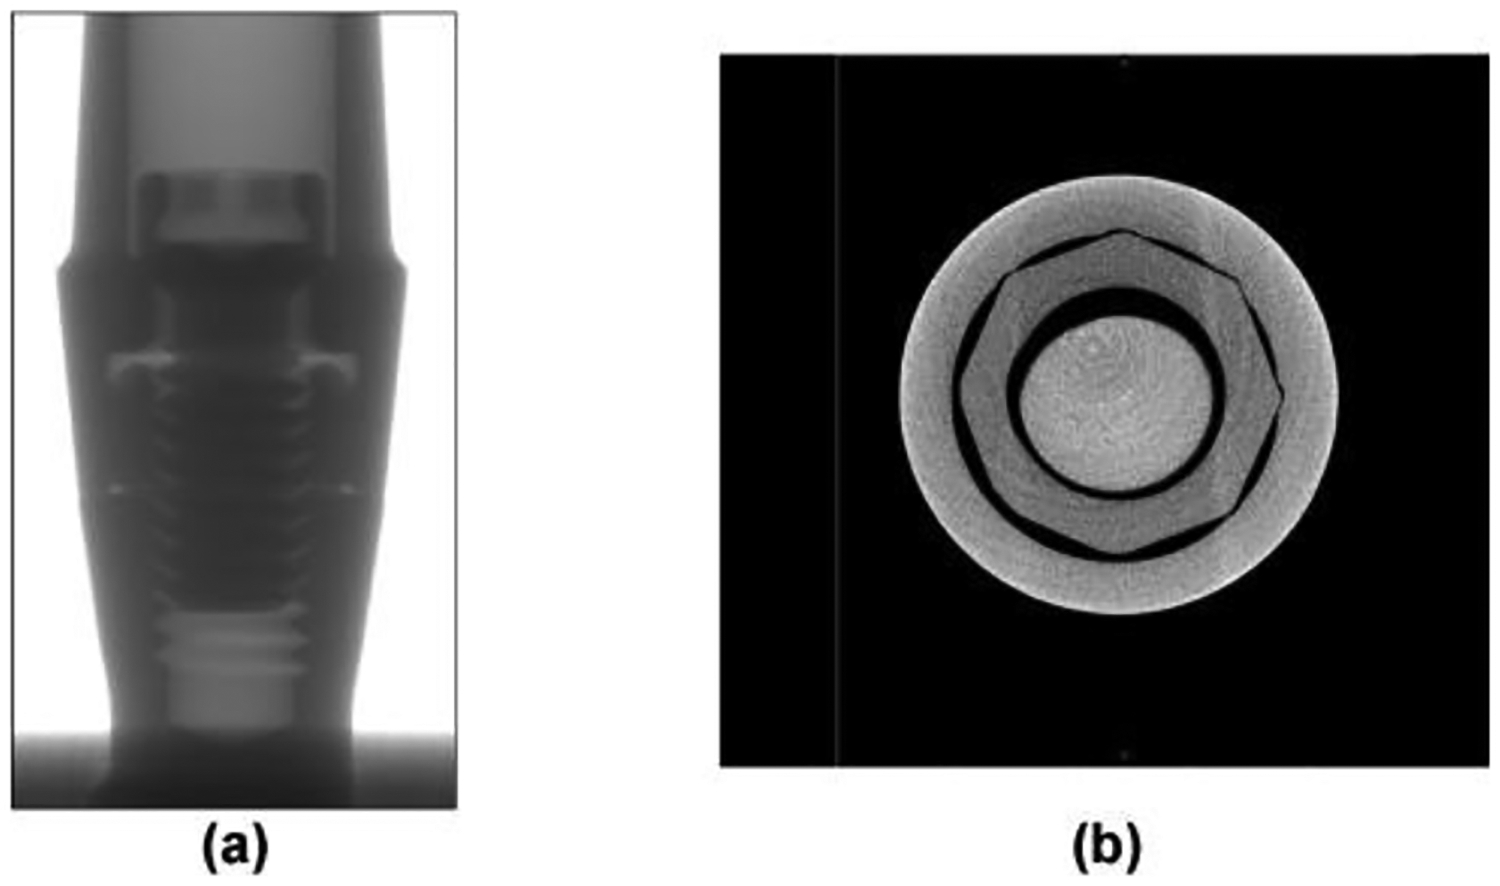
(a) Projection image of dental implant by micro-CT (before reconstruction); (b) Transverse view of CT scanning (after reconstruction).
Table 1.
Number of elements for each component.
| Loading cap | Abutment | Abutment screw | Implant body | Specimen holder |
|---|---|---|---|---|
| 25,212 | 77,970 | 116,352 | 172,028 | 50,577 |
Fig. 2.
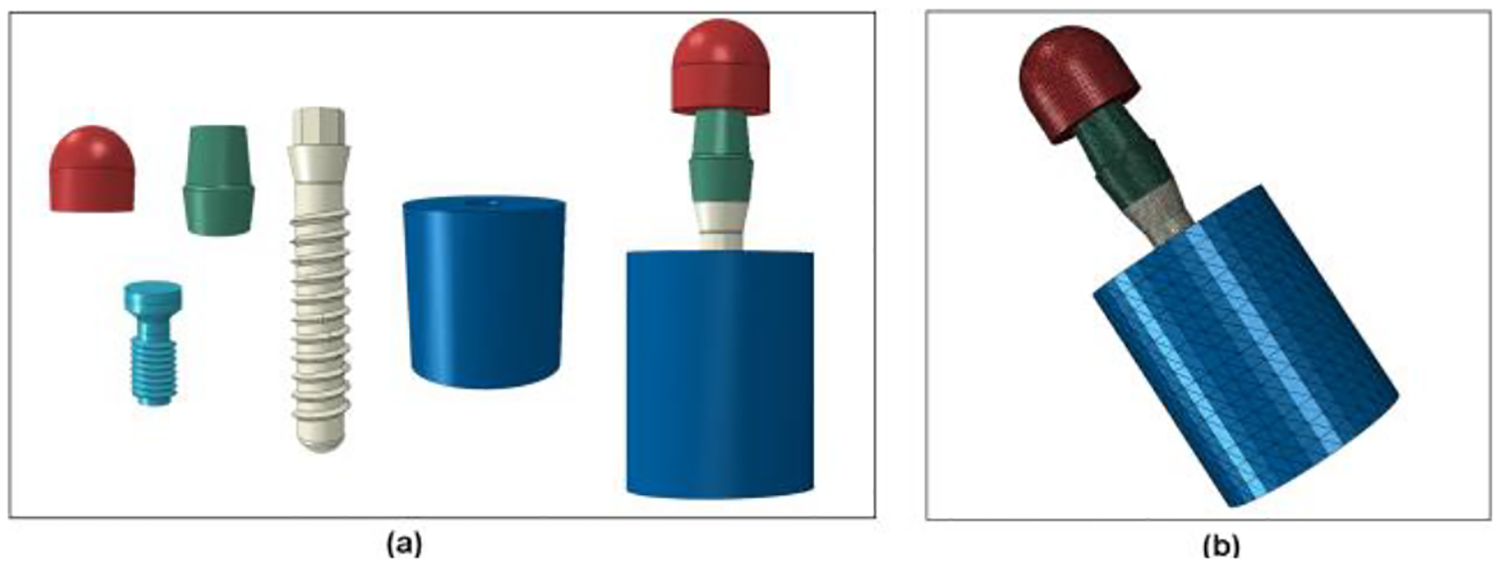
FE model of dental implant system. (a) Separate parts and final assembly; (b) Whole model with contour of FE elements.
2.2. FE-based lifetime prediction
Finite life fatigue assessment was performed in a commercial fatigue analysis program (fe-safe®, Safe Technology, Sheffield, UK). The stress and strain distribution results were pre-scanned and loaded by fe-safe® as an ODB file. Test loading was set as a cyclic load with a stress ratio (R) of 0.1. This stress ratio was required by ISO 14801 to simulate the physiological chewing condition. Brown-Miller criteria with Morrow mean stress correction was used for the lifetime calculation in this study. This algorithm uses the strain-life curve defined by the following equation [29]:
| (1) |
Where σN,m is the mean normal stress on the critical plane, 2Nf is the number of reversals to crack initiation, γ/2 is the shear strain amplitude, ΔεN is the normal strain on the critical plane, σf′ is fatigue strength coefficient, εf′ is normal fatigue ductility coefficient, E is the elastic modulus, c is the fatigue ductility exponent, and b is the fatigue strength exponent. The fatigue ductility exponent and coefficient are derived from Coffin-Manson law:
| (2) |
where εp is the plastic strain. The fatigue strength exponent and coefficient come from Basquin’s law:
| (3) |
Where εe is the elastic component of the cyclic strain amplitude, and σa is the cyclic stress amplitude. The material properties are approximated using Seeger’s method with the help of the re-scaling conventional monotonic ultimate tensile stress (UTS) [30]. The UTS value in this study for cold worked CP Ti Grade 4 was defined as 931 MPa [31, 32]. Table 2 shows the values of all relative parameters for titanium by Seeger’s method.
Table 2.
Material parameters by Seeger’s method.
| σ′f (MPa) | εf′ | b | c | |
|---|---|---|---|---|
| Value | 1,554.71 | 0.35 | −0.095 | −0.69 |
After processing, the lifetime results were written to the output file, and a copy of the original ODB file was created, onto which a new step containing the fatigue results was appended. This new ODB file could be displayed in the post-processor of ABAQUS. In a second experiment to determine the effect of the Young’s modulus of the holder material on the lifetime of the specimen, three different Young’s modulus values (4, 16 and 30 GPa) for specimen holder material were also applied in the analysis. The lowest value investigated represents the minimum necessary to satisfy the requirement of ISO 14801 that the holder have “a modulus of elasticity higher than 3 GPa”. The middle value represents the G10 composite used to simulate bone in the present study and lies in the range most commonly reported for cortical bone according to a previous literature review [33]. The highest value investigated represents the highest values reported for elastic modulus of bone rounded upwards to one digit of precision [33].
2.3. Mechanical test
Physical specimens were tested (n=15, 2 Hz, R=0.1) until fracture in deionized water at 37°C using multiple servo-hydraulic load frames with a digital controller (Flextest 60, MTS, Eden Prairie, MN). The specimens were oriented in the fixture according to ISO 14801, which were same geometry and load conditions as in the FE model. First, cylindrical cavities (3.2 mm in diameter) were prepared in glass-fiber reinforced acrylic blocks (G10, Piedmont Plastics, Charlotte, NC) by a drill press. Implants were then placed into the cavities using an implant driver and torque wrench according to the instruction of manufacturer. The abutment was installed with a torque of 35 Ncm by following the instructions of manufacturer. The top of the implant restorative platform was kept 3 mm above the top surface of block to simulate bone crest resorption according to ISO 14801. All specimens had moment arm of 11 mm. Nylon caps were seated on the abutment and bonded using a cold-cure acrylic (QuickSet Acrylic, Allied High Tech Products, Rancho Dominguez, CA). Specimens were subjected to cyclic fatigue until fracture using a sine loading wave with a frequency of 2 Hz and a load ratio of 0.1. A customized fixture was used to stabilize the specimen and maintain a 30-degree off-axis loading according to the ISO standard. Fig. 3 shows the apparatus for cyclic fatigue testing.
Fig. 3.
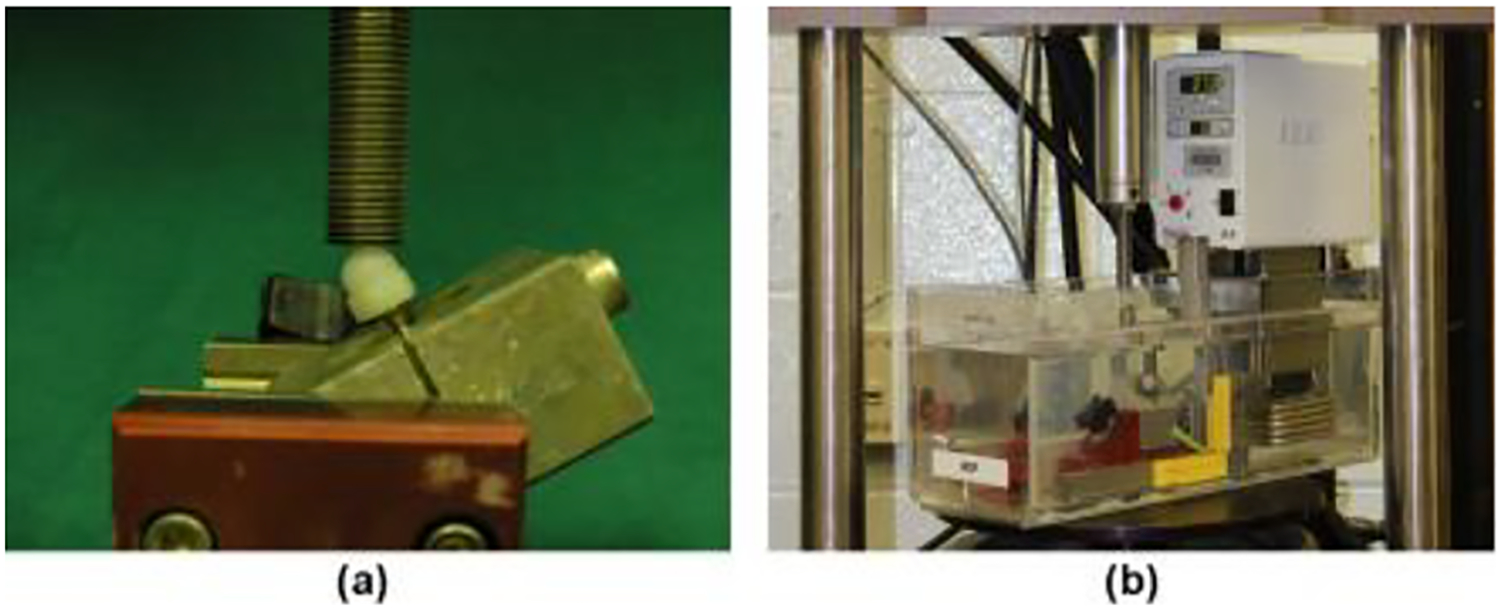
(a) The test apparatus of dental implant; (b) The experimental test on hydraulic machine.
Step-stress method was used in this study. This method was first developed by Nelson [34] as a strategy for testing specimens as rapidly as possible while still ensuring that their treatments span a broad range on which one may base precise lifetime forecasting. It has the following assumptions: that the relationship between survival lifetime and load amplitude follows an inverse power law (IPL) and that the damage caused in different time periods at different load amplitudes are additive. Based on these assumptions, each specimen was subjected to an increasing load amplitude over time, so that every specimen experienced multiple load amplitudes. Load profiles with various levels of aggressiveness were applied strategically based on the results of previous specimens in the study. The cumulative damage model was fit to the data after each specimen failure was recorded. In each iteration, the next specimen was tested at greater or lesser aggressiveness (rate of load amplitude increase) in order to spread the range of failure times. This generally resulted in decreasing aggressiveness as the experiment progressed because the initial specimens failed at approximately 500,000 cycles, and a range extending at least to 2,000,000 cycles was desired. Fig. 4 and Table 3 show the load amplitude versus time for the load profiles used in the study. Finally, the lifetime data were fit to a cumulative damage model with inverse power law relationship between load amplitude and lifetime using ALTA PRO software (Reliasoft, Tucson, AZ). The Weibull distribution was used to model the variability of lifetime data.
Fig. 4.
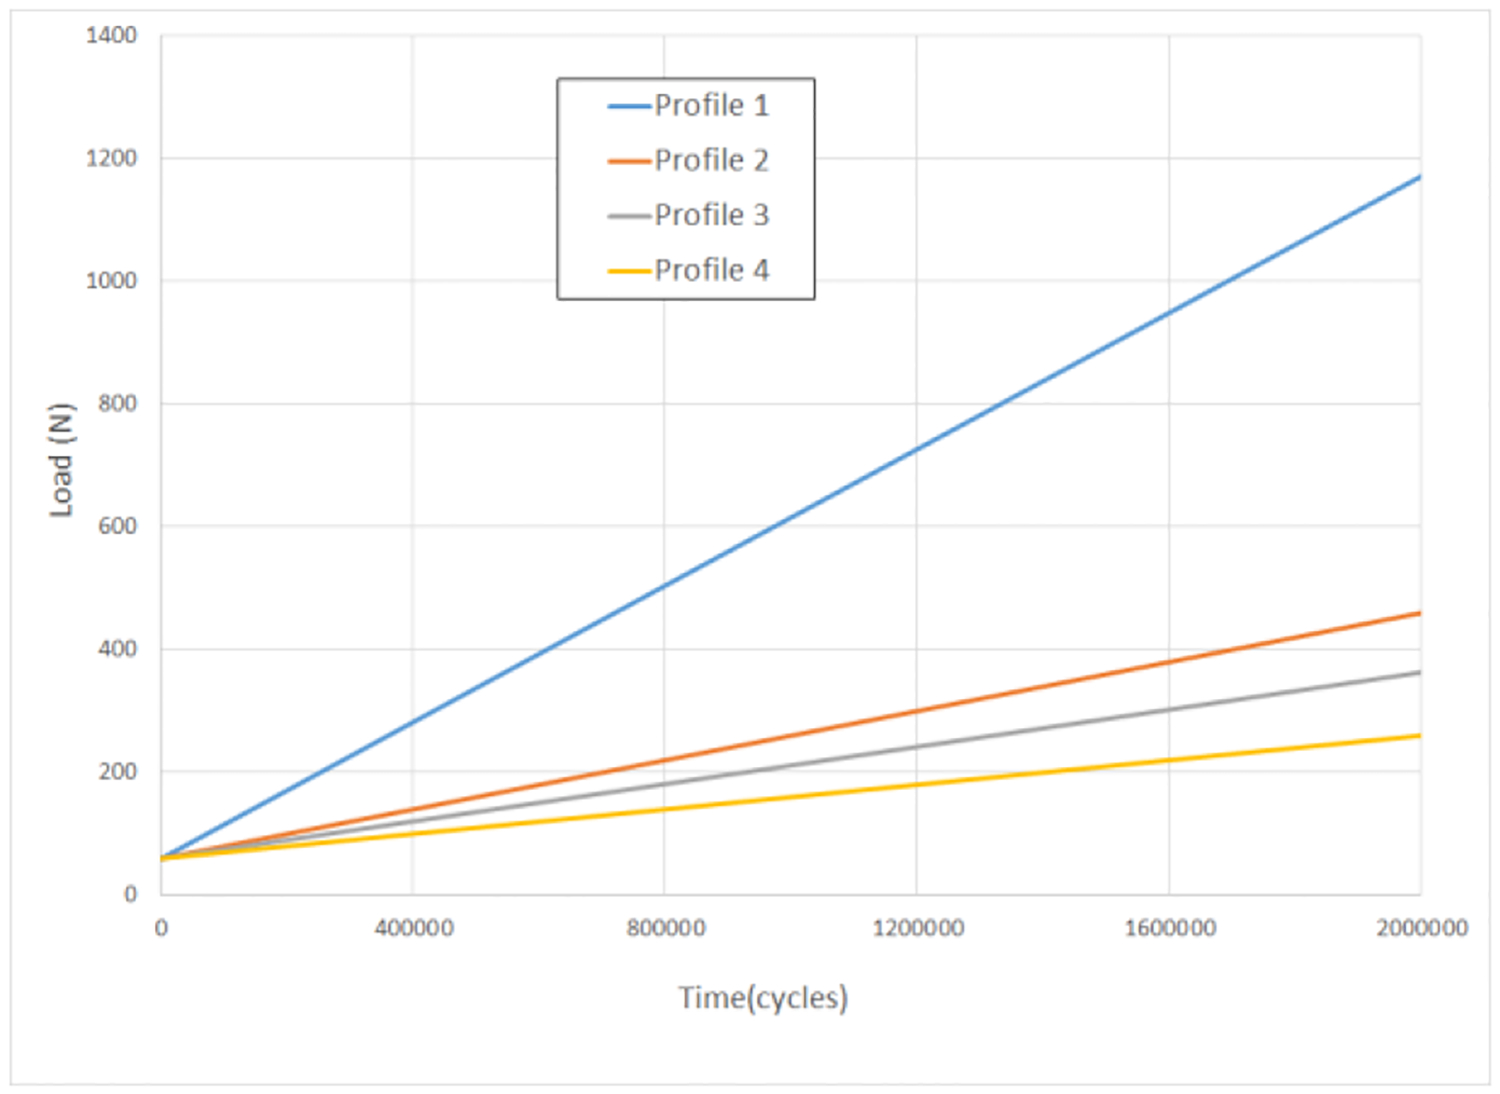
Load profiles for fatigue test.
Table 3.
Individual testing profiles, their levels of aggressiveness, fatigue lifetime, and status of implant specimens
| Load profile | Aggressiveness | Number of Specimens using this profile* | Load amplitude | Cycles | Status (Failed or Suspended) |
|---|---|---|---|---|---|
| 1 | Most | 2 | 1 N increase in every 1,800 cycles Testing load = Initial load + testing cycles/1,800 | 495,956 | F |
| 492,821 | F | ||||
| 2 | Second | 3 | 1 N increase in every 5,000 cycles Testing load = Initial load + testing cycles/5,000 | 1,314,210 | F |
| 1,251,674 | F | ||||
| 1,358,568 | S | ||||
| 3 | Third | 3 | 1 N increase in every 6,600 cycles Testing load = Initial load + testing cycles/6,600 | 2,040,350 | F |
| 1,671,143 | F | ||||
| 405,614 | F | ||||
| 4 | Least | 4 | 1 N increase in every 10,000 cycles Testing load = Initial load + testing cycles/10,000 | 2,388,383 | F |
| 2,190,996 | F | ||||
| 2,493,513 | F | ||||
| 1,836,838 | F | ||||
| 5 | Constant stress | 1 | 200 N for first 1,000,000 cycles and then 250 N until fracture | 1,543,160 | F |
| 6 | Constant stress | 1 | 250 N for 53,195 cycles (premature failure**) | 53,195 | S |
One specimen failed prematurely due to machine/operator errors at the beginning of the test.
One specimen failed prematurely due to machine/operator errors. However it was tested for 53,195 cycles before fracture therefore was treated as a suspended data point in the statistical analysis.
2.4. Fractographic analysis
All of the fractured specimens were carefully collected and cleaned using a sonicator in deionized water (Aquasonic 150T, VWR International, Radnor, PA). The specimens were gold-coated using a plasma arc gold coater (Hummer II, Ladd Research, Williston, VT) to improve the contrast and image quality since both the composite resin specimen holder and nylon cap had poor electrical conductivity. The specimens were first examined using a digital optical microscope (VHX-1000, Keyence, Osaka, Japan) to roughly determine the fracture location and the relative position from the simulated bone. Then, the specimens were examined using Scanning Electronic Microscopy (SEM) (Supra 40, Carl Zeiss, Jena, Germany) and fractographic technique to determine the failure mode.
3. Results
3.1. FE analysis
The model was created successfully and had good similarity with the physical specimens. Fig. 5(a–c) shows the distributions of von Mises stress, first principal stress, and first principal strain in the coronal sectional view with red representing high value and blue for low value. It showed that the maximum stress was located at the root of the second screw thread of the implant body, which is adjacent to the simulated bone crest level in this case. The maximum von Mises stress was 35.22 MPa. Fig. 5(d) shows the fatigue life contour from the fe-safe® analysis. The highest probability of failure was at the same location. The predicted mean lifetime at a load amplitude of 110 N was 1,007,356 cycles, which is equivalent to the chewing cycles of 5 years in vivo [35]. The lifetime predictions corresponding to different Young’s modulus values for the specimen holder and the same loading amplitude are given in the Table 4. The results showed that, with the increase of the Young’s modulus of the holder material, the maximum principal strain in the implant increased. This produced a rapidly decreasing lifetime predicted by the Brown-Miller model, so that predicted lifetime for implants decreased with the increasing elastic modulus of the simulated bone holder material.
Fig. 5.
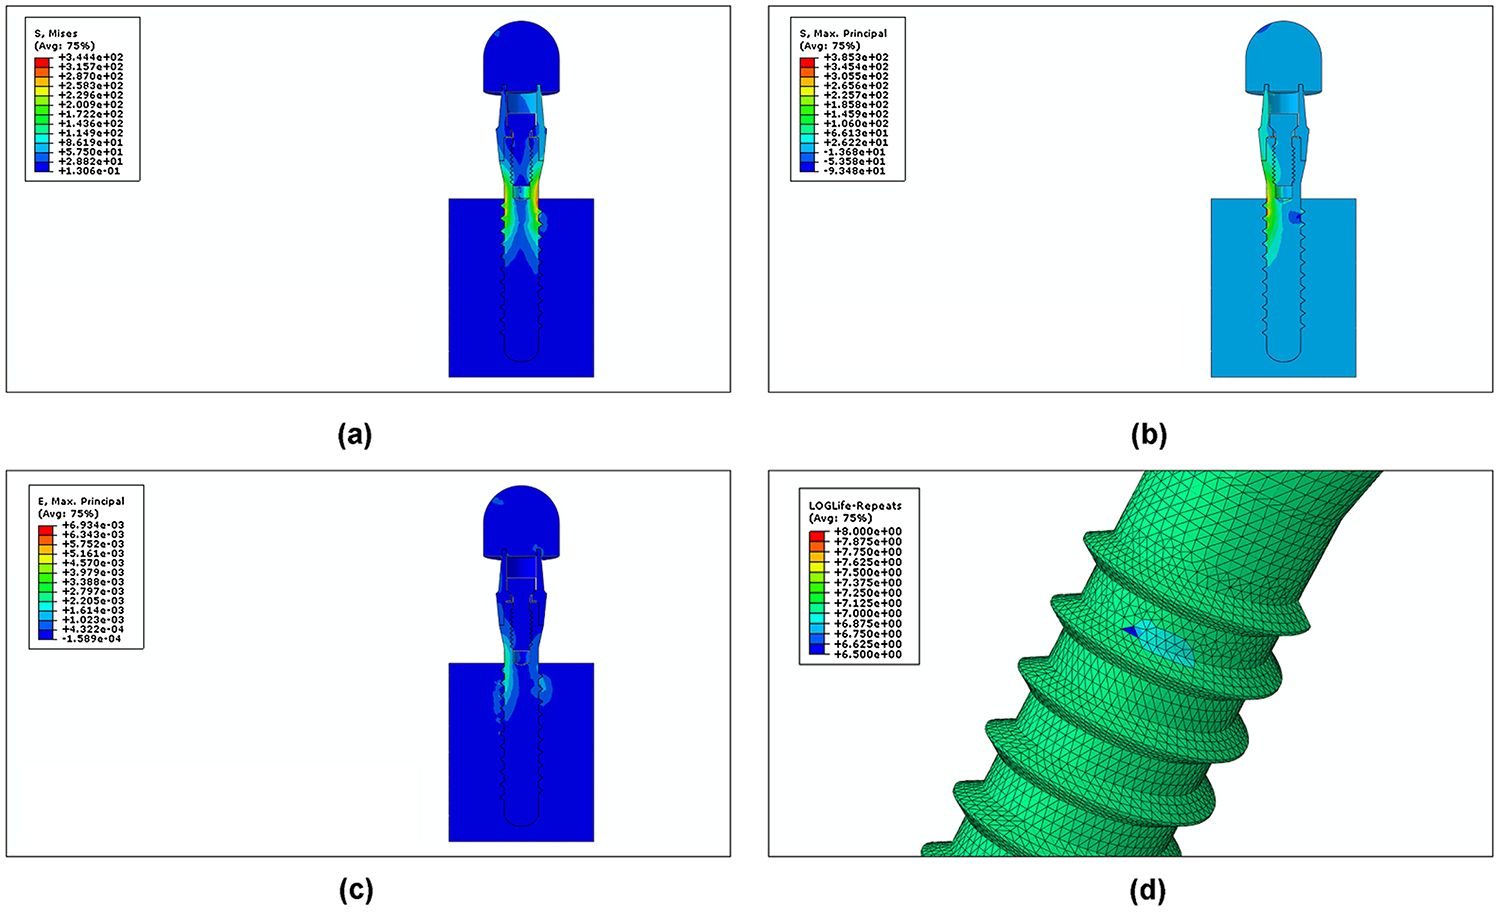
Stress distributions and lifetime contour plot of FE analysis for a load of 100 N. (a) von Mises stress; (b) maximum principal stress; (c) maximum principal strain; (d) log lifetime.
Table 4.
Maximum principal strain in the implant and lifetime predictions corresponding to different simulated bone holder materials having different Young’s modulus values.
| Young’s modulus (GPa) | Maximum principal strain | Mean Lifetime | |
|---|---|---|---|
| 1 | 4 | 3.286×10⁻⁴ | 2,443,747 |
| 2 | 16 | 3.491×10⁻⁴ | 1,007,356 |
| 3 | 30 | 3.658×10⁻⁴ | 403,315 |
3.2. Mechanical test results
Lifetime-stress contours for the physical specimens are shown in Fig. 6 where green and red lines indicate the top and bottom 95% confidence intervals. Model parameters from the physical test results are as follows: m=2.58, −lnK=40.24 and n=4.78 respectively, where m is Weibull modulus describing the data variability, K and n are fatigue crack growth coefficient and exponent showing the effect of load amplitude on lifetime. Load amplitude was used instead of nominal stress because the 30-degree off-axis angle required by ISO 14801 induces a bending moment and because the implant in this study does have a constant cross-sectional area. With the obtained model parameters, the load amplitude corresponding to any given lifetime can be extrapolated, and vice versa, using the Quick Calculation Pad tool in the ALTA PRO software. For a given lifetime of 1M cycles at 5% probability of failure, the predicted load was 185 N with a 95% confidence interval from 98 N to 224 N. The FE-based results were compared with the experimental test results. The lifetime prediction (1,007,356 cycles at 110 N) was located within the 95% confidence interval of the prediction from the laboratory results (98 to 224 N for a 1M cycle mean lifetime).
Fig. 6.
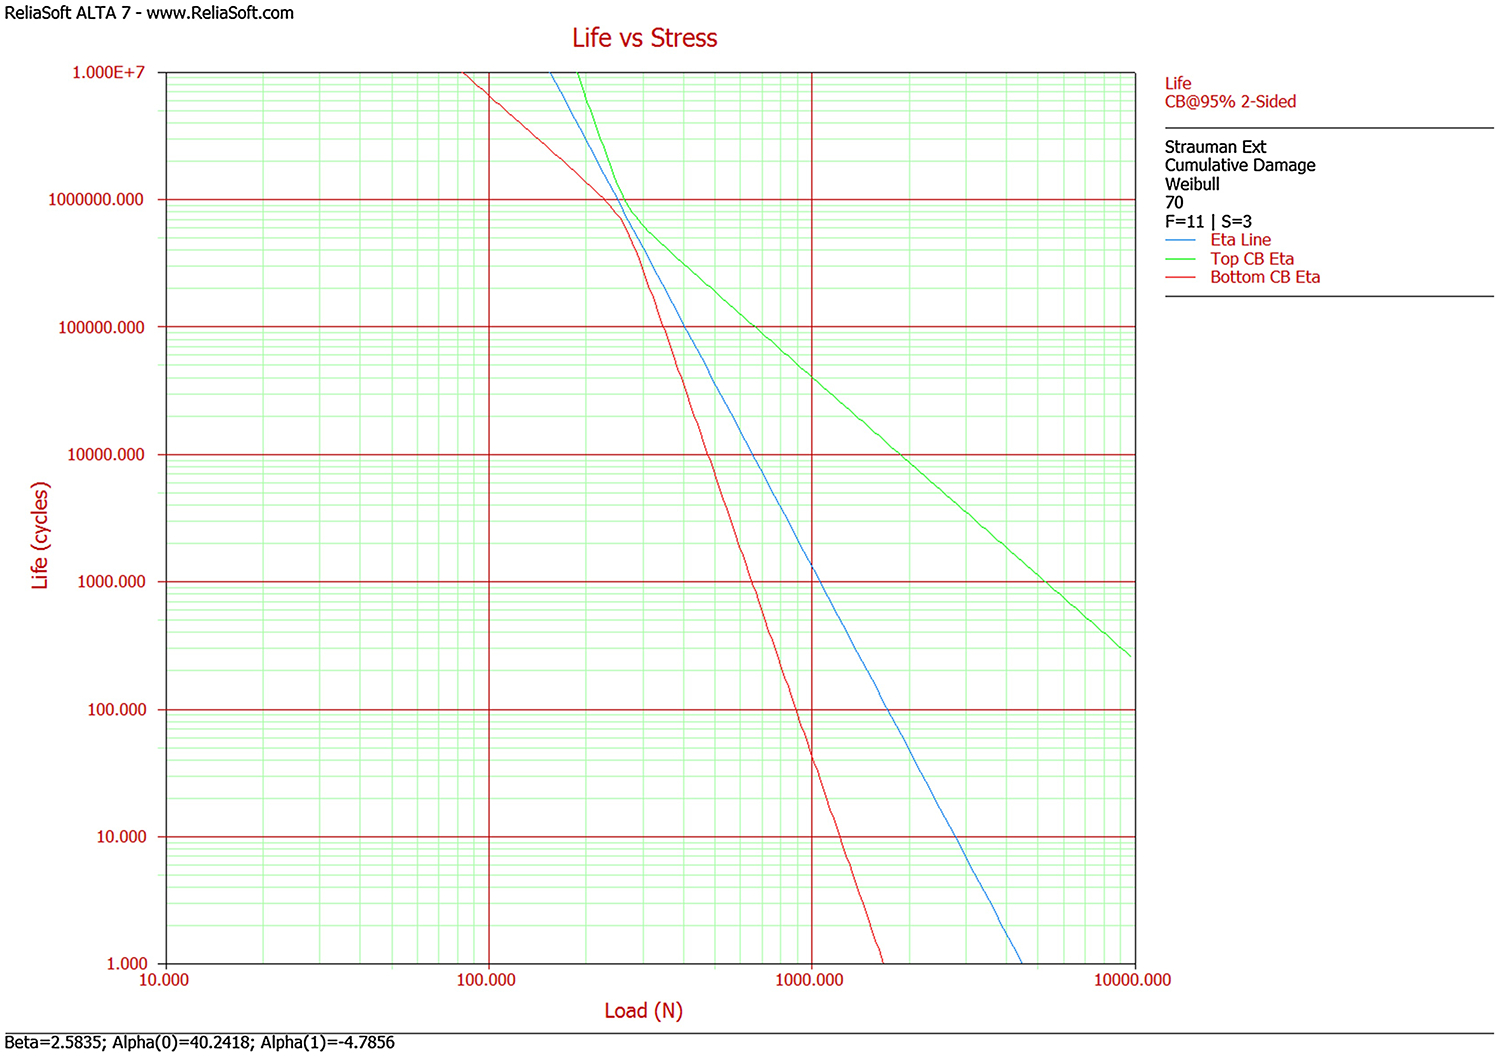
Life-stress contour for the physical specimens.
3.3. Fractographic analysis
The optical examination results are presented in Fig. 7. The results showed that all of the specimens had an identical failure mode. The specimens failed from the implant body at the simulated bone level (Fig. 7(a)). The abutments and connection screws still remained intact without any detectable loosening or damage in all the fractured specimens. Fig. 7(b–d) show a typical appearance of the fractured surface, which was composed of two distinct regions: a smooth region close to the failure origin and a rough region close to the compression curl. These regions indicated a typical flexural fatigue failure of metal and had some characteristic features under higher magnification view [36]. The SEM results showed that the failure origin was located at the root of the screw thread of implant body. The compression curl was observed on the opposite side of the failure origin due to the crack propagation from the tensile area to the compression area (Fig. 8(a)). With the lower magnification, this area had a fairly smooth appearance (Fig. 8(b))[37]. With higher magnification, typical fatigue striations were found in this smooth area adjacent to the failure origin, which indicated the steps in fatigue crack propagation (Fig. 8(c)). Surrounding this area, the rough and granular morphology with lots of dimples characteristic of microvoid coalescence was observed, which indicated overload rapid fracture during the end of the failure (Fig. 8(d)). The fractographic results also showed good agreement to the fracture location predicted by the FE analysis.
Fig. 7.

Optical photos of fractured specimen (a) and fracture surface (b-d).
Fig. 8.
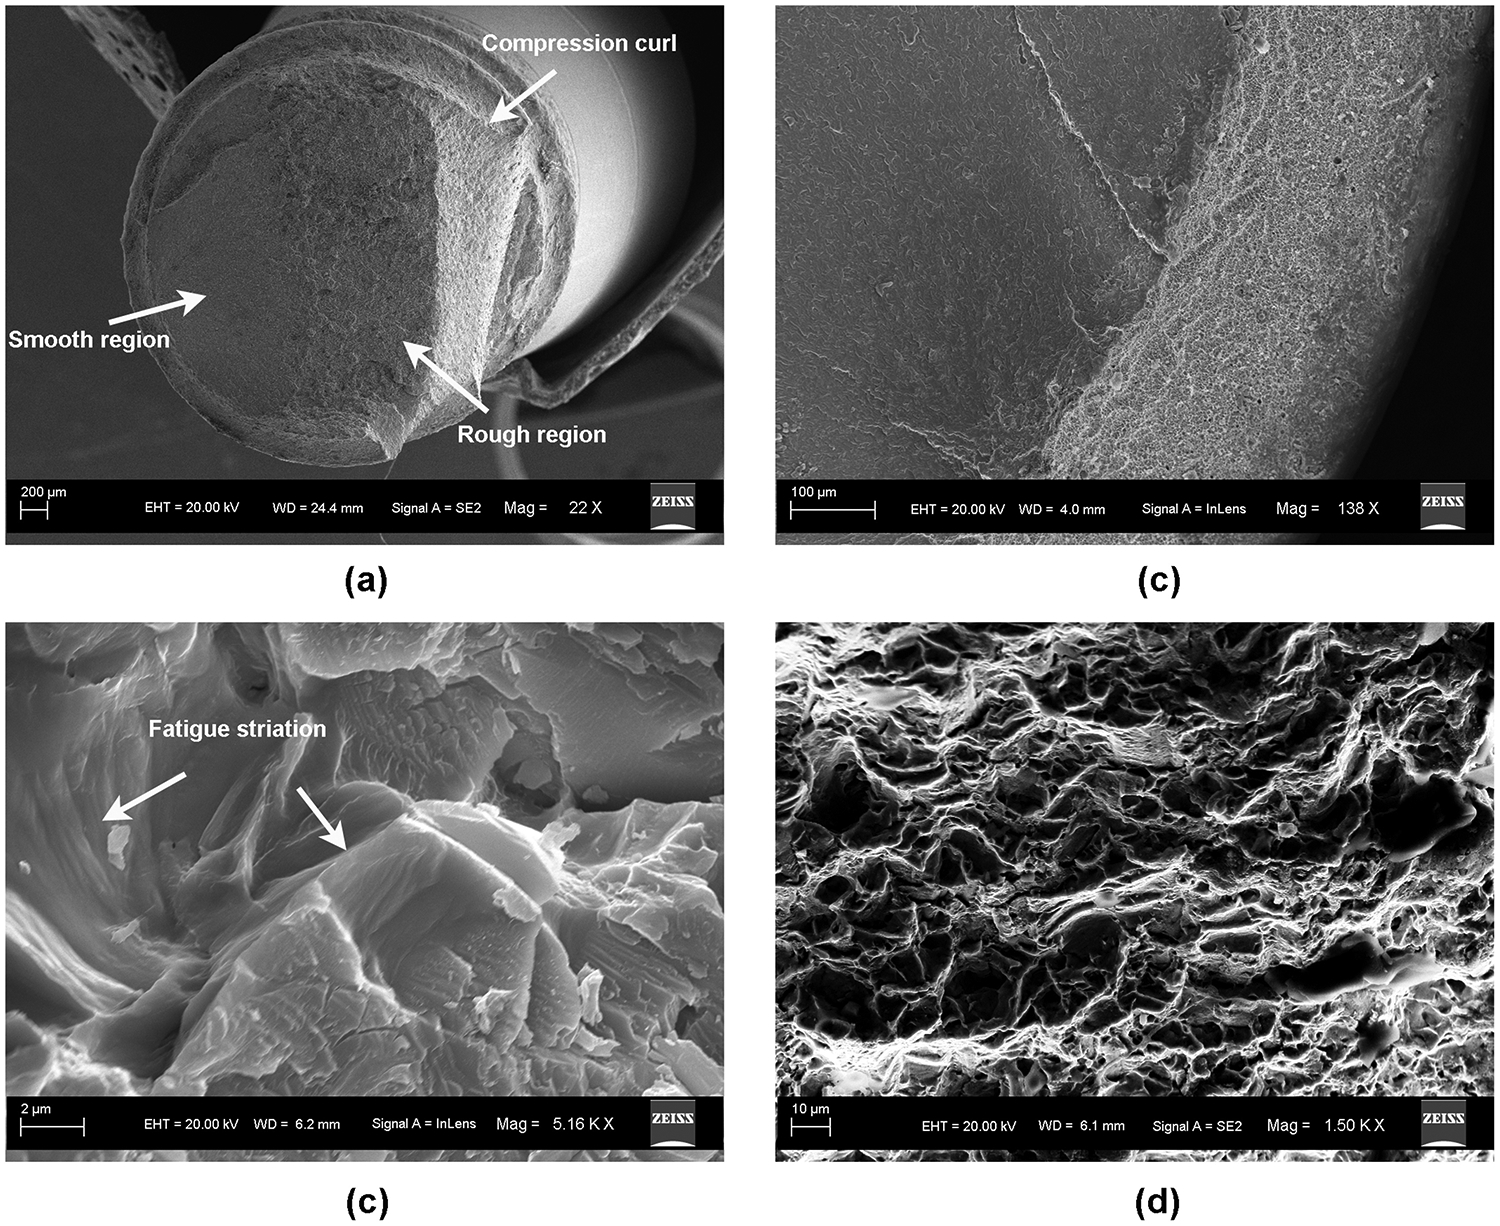
SEM images of fractured surface. (a) Gross view of the fracture surface; (b) area of fracture origin; (c) fatigue striations; (d) ductile dimples.
4. Discussion
Theoretically, all titanium dental implants should have sufficient mechanical strength to withstand physiological masticatory loads. However, failures of the implant body and other components have been occasionally observed in the clinic after a long period of loading, even without abnormalities or pathological lesion [38, 39]. Metal fatigue has been recognized to play an important role in these late failures. Due to the slow but irreversible crack propagation caused by the repeated masticatory loading, sudden and catastrophic failure tends to occur at a much lower stress level than the yield strength of the material and may have a different mode of propagation from the fast fracture and low-cycle fatigue tests. It would be more clinically relevant to investigate the fatigue behavior and estimate the fatigue lifetime for dental implants under physiological loading levels, instead of doing aggressive tests under loading levels that are unlikely to happen in clinical situations. However, considering the high cost of the conventional fatigue testing, an efficient protocol needs to be established to evaluate the fatigue lifetime of dental implant systems.
In this study, we developed a finite element-based computer model to predict the corresponding fatigue lifetime of one dental implant system. This protocol will provide an opportunity to understand the stress distribution patterns of different implant systems and estimate their relative fatigue lifetimes in a fast and cost-effective way before any time-consuming experimental tests and clinical trials. Moreover, it can also be useful to facilitate the optimization of implant design with respect to, not only the static stress distribution, but also the long-term reliability. After the static analysis, Brown-Miller criteria with Morrow mean stress correction was used for the lifetime calculation. The Brown-Miller strain criterion is a critical plane multi-axis fatigue algorithm and usually the preferred one for most conventional ductile metals at room temperature. Previous studies showed that predictions made using Brown-Miller criteria with Morrow mean stress correction agreed well to real data, including the location of expected failures [40, 41].
This study confirmed that FE analysis is capable of the same accuracy as tests of physical specimens for predicting the location and timing of failure of titanium implants tested in vitro. In the future, such in silico testing may serve as an efficient tool in the initial screening of candidate implant designs. The load amplitude predicted by FE analysis to result in failure at 1M cycles fell within the 95% confidence of the load amplitude predicted from testing physical specimens. In addition, it was predicted by FE analysis that stress concentration was at the root of the implant body screw thread adjacent to the simulated bone level. This result correlates well with the consistent failure mode of implant body fracture among all of the tested implants. However, the bone level would ideally be located at the junction of the threads and polished collar of the implant providing support to the implant body. In this worst case scenario, the stress is concentrated at the simulated bone level and fracture typically occurs at the narrowest diameter of the implant, were the depth of two thread grooves are approximating. One possible reason for this fracture mode is that this implant system has an external octagon connection which is positioned approximately 5 mm above the simulated bone crest level. This means that the upper part of implant body is located in the load-bearing bone-implant interface, where the load is directed from the implant to the bone and generates a high stress concentration in the sharp notch of the screw thread. The second possible reason for this failure mode is the precision and stability of the built-in octagon abutment connection configuration. This design allows a thicker abutment wall and a wider diameter abutment screw, which are more fracture-resistant and have less chance to fail compared to implants with thinner diameters. The accurate mating and friction between the parallel walls of the abutment and implant also provided minimal micro-movement and good retention. The material of the abutment screw is anodized Ti-6Al-7Nb alloy, which has been proven to exhibit enhanced mechanical properties compared to CP Ti [42–44]. This may have eliminated the more typical mode of implant mechanical failure, which is abutment screw loosening and fracture. The third possible reason is that the tested implant is a reduced-diameter system with a diameter of only 3.3 mm. This type of implant has gained favor in recent years because it can provide good clinical outcomes in some challenging treatment situations such as narrow alveolar ridges [45]. The clinical reports showed implant body fracture was more frequently observed in reduced-diameter implants compared to regular-diameter implants [45, 46]. This is also the reason that we choose this implant system to study because the decrease of implant diameter may reduce the mechanical stability, increase the risk of overstressing, and eventually increase the risk of technical complications compared to the regular-diameter implant with a diameter larger than 4 mm.
An strong influence of specimen holder elastic modulus on fatigue lifetime was also observed, despite there being little effect of holder elastic modulus on the static stress results. This is because the Brown-Miller failure criterion is a function of strain instead of stress. This indicated that the material properties of the specimen holder should be taken into consideration for dental implant fatigue study in order to obtain more clinically relevant results, although the ISO standard only requires a minimal >3 GPa of Young’s modulus for the specimen holder material. It will be beneficial to use materials with material properties similar to human bone to accurately evaluate the long-term performance of dental implants. In this study, a glass-fiber reinforced composite resin material was used to simulate human jawbone. This is acceptable because it not only meets the requirement of the ISO standard but also has a Young’s modulus of 16 GPa between the values of cancellous bone (14.8 GPa) and cortical bone (20.7 GPa) [47]. However, to make more accurate lifetime predictions for the clinical case, further efforts need to be spent to simulate the bone in both properties and geometry more accurately. In a future study, a new layered structure with different material properties in the simulated cortical and cancellous layers will be customized to simulate the human cortical bone and cancellous bone for implant fatigue test.
In conclusion, FE-based computational lifetime prediction was successfully performed and was quantitatively validated by the ISO 14801 laboratory test for the same implant system. Step-stress method was successfully used to perform the in vitro fatigue test of the dental implant system. Three-dimensional FE analyses could be used to perform strain-based fatigue lifetime prediction for a titanium dental implant system. FE analysis will be a feasible alternative for investigating the fatigue lifetime and fracture modes of dental implant systems, optimizing implant design, and facilitating the selection of indications with the aim of improving the long-term clinical performance.
Highlights:
Finite element modeling and accelerated lifetime testing yielded similar predictions.
Fractographic examination of failure origin agreed with finite element predictions.
Fatigue lifetime was predicted to be dependent on the stiffness of holder material.
5. Acknowledgments
This work was partially supported by NIH grant R01DE017991.
Footnotes
Publisher's Disclaimer: This is a PDF file of an unedited manuscript that has been accepted for publication. As a service to our customers we are providing this early version of the manuscript. The manuscript will undergo copyediting, typesetting, and review of the resulting proof before it is published in its final citable form. Please note that during the production process errors may be discovered which could affect the content, and all legal disclaimers that apply to the journal pertain.
6. References
- [1].Goodacre CJ, Bernal G, Rungcharassaeng K, Kan JYK. Clinical complications with implants and implant prostheses. J Prosthet Dent 2003;90:121–32. [DOI] [PubMed] [Google Scholar]
- [2].Schwarz MS. Mechanical complications of dental implants. Clin Oral Implants Res 2000;11 Suppl 1:156–8. [DOI] [PubMed] [Google Scholar]
- [3].Carlson B, Carlsson GE. Prosthodontic complications in osseointegrated dental implant treatment. Int J Oral Maxillofac Implants 1994;9:90–4. [PubMed] [Google Scholar]
- [4].Berglundh T, Persson L, Klinge B. A systematic review of the incidence of biological and technical complications in implant dentistry reported in prospective longitudinal studies of at least 5 years. J Clin Periodontol 2002;29 Suppl 3:197–212. [DOI] [PubMed] [Google Scholar]
- [5].Oved E, Ardikian L, Peled M. Risk factors for dental implant inflammation--a literature review. Refuat Hapeh Vehashinayim 2004;21:55–62, 98. [PubMed] [Google Scholar]
- [6].Gupta S, Gupta H, Tandan A. Technical complications of implant-causes and management: A comprehensive review. Natl J Maxillofac Surg 2015;6:3–8. [DOI] [PMC free article] [PubMed] [Google Scholar]
- [7].Marcelo CG, Filie Haddad M, Gennari Filho H, Marcelo Ribeiro Villa L, Dos Santos DM, Aldieris AP. Dental implant fractures - aetiology, treatment and case report. Journal of Clinical and Diagnostic Research 2014;8:300–4. [DOI] [PMC free article] [PubMed] [Google Scholar]
- [8].Eckert SE, Meraw SJ, Cal E, Ow RK. Analysis of incidence and associated factors with fractured implants: a retrospective study. Int J Oral Maxillofac Implants 2000;15:662–7. [PubMed] [Google Scholar]
- [9].Zardiackas L, Kraay M, Freese H. Titanium, Niobium, Zirconium, and Tantalum for Medical and Surgical Applications. West Conshohocken: ASTM International; 2004. [Google Scholar]
- [10].Griggs JA. Dental Implants. Dent Clin N Am 2017;61:857–71. [DOI] [PubMed] [Google Scholar]
- [11].Fatigue test for endosseous dental implants. 14801. Geneva, Switzerland: Internatinal organization for standardization; 2003. [Google Scholar]
- [12].Georgii J, Dick C. Efficient finite element methods for deformable bodies in medical applications. Crit Rev Biomed Eng 2012;40:155–72. [DOI] [PubMed] [Google Scholar]
- [13].Roy D, Kauffmann C, Delorme S, Lerouge S, Cloutier G, Soulez G. A literature review of the numerical analysis of abdominal aortic aneurysms treated with endovascular stent grafts. Comput Math Methods Med 2012:820389. [DOI] [PMC free article] [PubMed] [Google Scholar]
- [14].Costa FW, Bezerra MF, Ribeiro TR, Pouchain EC, Saboia Vde P, Soares EC. Biomechanical analysis of titanium plate systems in mandibular condyle fractures: a systematized literature review. Acta Cir Bras 2012;27:424–9. [DOI] [PubMed] [Google Scholar]
- [15].Akca K, Cehreli MC, Iplikcioglu H. Evaluation of the mechanical characteristics of the implant-abutment complex of a reduced-diameter morse-taper implant. A nonlinear finite element stress analysis. Clin Oral Implants Res 2003;14:444–54. [DOI] [PubMed] [Google Scholar]
- [16].Geramy A, Morgano SM. Finite element analysis of three designs of an implant-supported molar crown. J Prosthet Dent 2004;92:434–40. [DOI] [PubMed] [Google Scholar]
- [17].Hsu JT, Fuh LJ, Lin DJ, Shen YW, Huang HL. Bone strain and interfacial sliding analyses of platform switching and implant diameter on an immediately loaded implant: experimental and three-dimensional finite element analyses. J Periodontol 2009;80:1125–32. [DOI] [PubMed] [Google Scholar]
- [18].Tepper G, Haas R, Zechner W, Krach W, Watzek G. Three-dimensional finite element analysis of implant stability in the atrophic posterior maxilla: a mathematical study of the sinus floor augmentation. Clin Oral Implants Res 2002;13:657–65. [DOI] [PubMed] [Google Scholar]
- [19].Stephens R, Fatemi A, Stephens A, Fuchs H. Metal Fatigue in Engineering. New York: John Wiley; 2000. [Google Scholar]
- [20].Oh W, Gotzen N, Anusavice KJ. Influence of connector design on fracture probability of ceramic fixed-partial dentures. J Dent Res 2002;81:623–7. [DOI] [PubMed] [Google Scholar]
- [21].Fischer H, Weber M, Marx R. Lifetime prediction of all-ceramic bridges by computational methods. J Dent Res 2003;82:238–42. [DOI] [PubMed] [Google Scholar]
- [22].Hernandez B, Paterno A, Souza E, Freitas J, Foschini C. Fatigue analysis of dental prostheses by finite element method (FEM). International Mechanical Engineering Congress and Exposition, Houston, Texas, 2015. [Google Scholar]
- [23].Albogha MH, Kitahara T, Todo M, Hyakutake H, Takahashi I. Maximum principal strain as a criterion for prediction of orthodontic mini-implants failure in subject-specific finite element models. Angle Orthod 2016;86:24–31. [DOI] [PMC free article] [PubMed] [Google Scholar]
- [24].Cheng YC, Lin DH, Jiang CP, Lee SY. Design improvement and dynamic finite element analysis of novel ITI dental implant under dynamic chewing loads. Biomed Mater Eng 2015;26 Suppl 1:S555–61. [DOI] [PubMed] [Google Scholar]
- [25].Flanagan D, Ilies H, McCullough P, McQuoid S. Measurement of the fatigue life of mini dental implants: a pilot study. J Oral Implantol 2008;34:7–11. [DOI] [PubMed] [Google Scholar]
- [26].Karl M, Kelly JR. Influence of loading frequency on implant failure under cyclic fatigue conditions. Dent Mater 2009;25:1426–32. [DOI] [PubMed] [Google Scholar]
- [27].Niinomi M. Mechanical properties of biomedical titanium alloys. Mat Sci Eng A-Struct 1998;243:231–6. [Google Scholar]
- [28].Duan Y, Griggs JA. Effect of elasticity on stress distribution in CAD/CAM dental crowns: Glass-ceramic vs. polymer-matrix composite. J Dent 2015;43:742–9. [DOI] [PubMed] [Google Scholar]
- [29].Brown MW, Miller KJ. A theory for fatigue failure under multiaxial stress-Strain conditions. P I Mech Eng 1973;187:745–55. [Google Scholar]
- [30].fe-safe® user manual. Safe Technology Limited; 2002. p. 88–90. [Google Scholar]
- [31].Young CS, Durham JC. Industrial applications of titanium and zirconium : fourth volume : a symposium ASTM: Philadelphia, PA; 1986. [Google Scholar]
- [32].Allum SR, Tomlinson RA, Joshi R. The impact of loads on standard diameter, small diameter and mini implants: a comparative laboratory study. Clin Oral Implants Res 2008;19:553–9. [DOI] [PubMed] [Google Scholar]
- [33].Saab XE, Griggs JA, Powers JM, Engelmeier RL. Effect of abutment angulation on the strain on the bone around an implant in the anterior maxilla: A finite element study. J Prosthet Dent 2007;97:85–92. [DOI] [PubMed] [Google Scholar]
- [34].Nelson W Accelerated testing-step stress model and data analysis. IEEE Trans Rel 1980;R 29:103–8. [Google Scholar]
- [35].Gapido CG, Kobayashi H, Miyakawa O, Kohno S. Fatigue resistance of cast occlusal rests using Co-Cr and Ag-Pd-Cu-Au alloys. J Prosthet Dent 2003;90:261–9. [DOI] [PubMed] [Google Scholar]
- [36].Brooks C, Choudhury C. Metallurgical Failure Analysis. New York: McGraw-Hill; 1993. [Google Scholar]
- [37].Koh SK, Stephens RI. Mean stress effects on low cycle fatigue for a high strength steel. Fatigue Fract Eng Mater Struct 1991;14:413–28. [Google Scholar]
- [38].Morgan MJ, James DF, Pilliar RM. Fractures of the fixture component of an osseointegrated implant. Int J Oral Maxillofac Implants 1993;8:409–14. [PubMed] [Google Scholar]
- [39].Linkow LI, Donath K, Lemons JE. Retrieval analyses of a blade implant after 231 months of clinical function. Implant Dent 1992;1:37–43. [PubMed] [Google Scholar]
- [40].Dambaugh G. Fatigue considerations of high strength rolling bearing steels. Simulia resource center; 2006. p. 24–5. [Google Scholar]
- [41].Wang Y, Yao W. Evaluation and comparison of several multiaxial fatigue criteria. Int J Fatigue 2004;26:17–25. [Google Scholar]
- [42].Iijima D, Yoneyama T, Doi H, Hamanaka H, Kurosaki N. Wear properties of Ti and Ti-6Al-7Nb castings for dental prostheses. Biomaterials 2003;24:1519–24. [DOI] [PubMed] [Google Scholar]
- [43].Mahmoud A, Wakabayashi N, Takahashi H, Ohyama T. Deflection fatigue of Ti-6Al-7Nb, Co-Cr, and gold alloy cast clasps. J Prosthet Dent 2005;93:183–8. [DOI] [PubMed] [Google Scholar]
- [44].Kobayashi E, Wang TJ, Doi H, Yoneyama T, Hamanaka H. Mechanical properties and corrosion resistance of Ti-6Al-7Nb alloy dental castings. J Mater Sci Mater Med 1998;9:567–74. [DOI] [PubMed] [Google Scholar]
- [45].Yaltirik M, Gokcen-Rohlig B, Ozer S, Evlioglu G. Clinical evaluation of small diameter straumann implants in partially edentulous patients: a 5-year retrospective study. J Dent (Tehran). 2011;8:75–80. [PMC free article] [PubMed] [Google Scholar]
- [46].Zinsli B, Sagesser T, Mericske E, Mericske-Stern R. Clinical evaluation of small-diameter ITI implants: a prospective study. Int J Oral Maxillofac Implants 2004;19:92–9. [PubMed] [Google Scholar]
- [47].Rho JY, Ashman RB, Turner CH. Young’s modulus of trabecular and cortical bone material: ultrasonic and microtensile measurements. J Biomech 1993;26:111–9. [DOI] [PubMed] [Google Scholar]


