Abstract
We investigated the effects of rapamycin (RAPA) and chloroquine (CQ) in supporting growth performance and the intestinal mucosal barrier in response to deoxynivalenol (DON) in piglets. A total of 32 healthy weaned piglets (bodyweight 7.10 ± 0.58 kg) were divided into four groups and treated daily with RAPA (1 mg/kg BW), CQ (10 mg/kg BW), or a control volume of normal saline (two groups) until the end of the experiment. After feeding a basal diet for seven days, three groups were then switched to mildewed feed containing 1 mg kg/DON for a further seven days. In contrast to the control group, DON-treated piglets showed decreased average daily gain (ADG) and daily feed intake (ADFI), as well as negatively affected intestinal morphology as indicated by villus height, crypt depth, and tight junction protein expression. A group treated with RAPA and DON showed increased intestinal autophagy, aggravated inflammatory responses, and damage to the intestinal mucosa and permeability, leading to reduced growth performance. Meanwhile, a group treated with CQ and DON showed indices comparable to the non-DON control group, with alleviated inflammatory cytokines and healthy intestinal morphology and structure. They also showed better growth performance compared to DON treatment alone. These findings have important implications for mediating autophagy against DON in vivo, as well as the potential for CQ in improving growth performance and maintaining intestinal barrier integrity in weanling piglets.
1. Introduction
Vomitoxin, known as deoxynivalenol (DON) [1], is one of the several mycotoxins produced by various Fusarium species that frequently grow on corn, wheat, oats, barley, rice, and other grains in the field or during storage. It is widely found in food and animal feed, which is harmful to human health and animal husbandry development. DON shows cytotoxic, genotoxic, and visible antiproliferative effects in intestinal cells, affecting cell cycle distribution, inducing apoptosis, and inhibiting the synthesis of biomacromolecules [2–4]. These effects occur after the ingestion of contaminated foods from affected grains, such as acute temporary nausea, vomiting, diarrhea, abdominal pain, headache, dizziness, and fever, with the gastrointestinal tract as the primary target in reared animals [5–8]. Moreover, DON inhibits the absorption of nutrients and damages intestinal epithelial cells and eventually affects material deposition [9–11].
Autophagy is a catabolic process aimed at recycling cellular components and damaged organelles in response to diverse conditions of stress, such as nutrient deprivation, viral infection, and genotoxic stress. It is upregulated by cellular stressors to enhance cell survival [12, 13]. We previously found that autophagy plays a crucial role in maintaining intestinal epithelial cell homeostasis under DON stress, and DON induces autophagy in pig intestinal cells (IPEC-J2). The knockout of the ATG5 gene led to autophagy deficiency and increased apoptosis via the generation of reactive oxygen species, suggesting that intestinal cell autophagy is essential in protecting against DON [14, 15].
It is of interest to understand the role of autophagy to intestinal barrier function, immunity, and inflammation following the exposure to DON in vivo. We attempted to intervene in autophagy using the autophagy activator rapamycin (RAPA) and inhibitor chloroquine (CQ) to understand the relationship between autophagy and mycotoxins in piglets. RAPA, a macrolide antibiotic, is a widely used inhibitor of the mammalian target of rapamycin (mTOR), which induces autophagy in a variety of cell types [16], while CQ is a late-stage inhibitor of autophagy, which inhibits autophagic flux by blocking the fusion of autophagosomes and lysosomes [17]. The two reagents, RAPA and CQ, have often been used to mediate autophagy in the animal. In this report, after testing different dose, we chose the optimal concentration (1 mg/kg for RAPA and 10 mg/kg for CQ) [18, 19], which succeed in mediating intestinal autophagy level and showed different growth performance, to examine the effect of modulation of autophagy as a strategy to protect in mycotoxin stress. These findings provided evidence of the roles of RAPA and CQ in DON-exposed piglets and indicated a link between autophagy and alteration of the inflammatory response as well as intestinal morphology in vivo.
Through this experiment, DON induced intestinal cell autophagy, but excessive autophagy due to the addition of RAPA did not provide protection and instead aggravated intestinal disorders and induced higher levels of proinflammatory cytokines in both blood and intestinal tissue. Meanwhile, CQ downregulated autophagy and alleviated toxin damage and inflammatory condition relative to the control group.
2. Materials and Methods
2.1. Materials and Reactions
The F. graminearum R6576 strain, from Huazhong Agricultural University molecular biotechnology laboratory preserved in PDA cant. The RAPA and CQ components (purity 94 ≥ 98%) obtained from Sangon Biotech Co., Ltd. (Shanghai, China).
2.2. Preparation for Mildew Feed
Firstly, the mycelia were activated at 25°C ~ 28°C for 7 days in the dark. Secondly, then mycelia were inoculated in CMC liquid medium and cultured in shaker under continuous light condition (28°C, 200r). After 5 days, when conidium produced, the mycelia were filtered with aseptic double layer gauze and count the conidium with a blood count plate. Then, the concentration of conidia was adjusted to 5∗105/mL and inoculated in the feed for 14 days. Finally, deoxynivalenol (DON) and zearalenone content in the fermented feed was detected by ELISA, and the proportion of zearalenone only contained 4.15%. Thus, we only count DON and diluted to the target concentration of 1 mg/kg with the basic diet.
2.3. Animals and Experimental Design
A total of 32 Large White × Landrace piglets weaned at 24 days (d) of age (average initial body weight (BW) of 7.10 ± 0.58 kg) were divided into four groups. Each group has 6 replicates with 1 pig per replicate, and there was no significant difference in average BW among three treatments. Treatments were as follows: RAPA (1 mg/kg BW) + DON, CQ (10 mg/kg BW) + DON, normal saline + DON, and control of normal saline. Adaptation to experimental diets took place from days 1 to 3. Then, piglets were orally administrated with 7 mL saline, RAPA or CQ from days 4 to 10 and took a basal diet. On day 11, the total volume of solution was adjusted according to the average weight of each treatment, and mildewed feed containing 1 mg kg/DON took place from days 11 to 17. Every single pig was housed in a cage equipped with a feeder for ingestion and a nipple drinker for free access to drinking water. The basal diet was formulated to meet the nutrient requirements for weanling piglets (NRC, 2012) and has been described in a previous study [20].
2.4. Sample Collection and Preparation
On day 14, final body weight and average daily feed intake (ADFI) were collected after the initial treatment, otherwise, calculating the ADG and gain to feed ratio (G/F). Ten milliliters of blood was collected from the jugular vein. Blood without anticoagulant was allowed to clot for 1 h at room temperature, and then serum was separated and stored as previously described [21], while blood with anticoagulant was for collecting plasma. After piglets were euthanized, jejunal and ileal samples (2 cm, jejunum as the 1/3 mid and ileum as 1/3 distal part) were collected for the determination of intestinal morphology. Then, samples for histological slicing were rapidly fixed with 10% neutral buffered formalin. An approximate 0.5 cm sample of the jejunum and ileum were immediately and rapidly excised with ice-cold physiological saline [22], then stored in the form of formaldehyde solution or at 2.5% glutaraldehyde solution until further analysis.
2.5. Western Blotting Analysis
Relative protein levels for Sequestosome 1 (P62/SQSTM1, P62), LC3, and β-actin in the jejunum were determined followed the methods of Simeng [23]. The primary antibodies used in the present study were as follows: anti-P62 (#23214), anti- LC3B, and anti-β-actin (#4970). Chemiluminescent reagent (BeyoECL Plus, Beyotime, Shanghai, China) with a ChemiDoc™ Touch Imaging System (Bio-Rad, Philadelphia, PA, USA) visualizing the bands of the protein. The resultant signals quantified as previously by [24]. Antibodies purchased from Cell Signaling Technology (Danvers, MA).
2.6. Analysis of Serum Concentrations of Cytokines, Intestinal Permeability Related Indicators
We followed the methods of Simeng Liao et al. [23] to determined serum concentrations of immunoglobulin (Ig) G, IgM (IgG and IgM quantitation kit; Bethyl Laboratories, Inc., Montgomery, TX, USA), tumor necrosis factor- (TNF-) α, interferon- (IFN-) γ, interleukin- (IL-) 1β, IL-6, IL-8, IL-10, IL-12 and transforming growth factor- (TGF-) β (Cell Biolabs, San Diego, CA, USA), and serum diamine oxidase (DAO) and D-lactate.
2.7. Intestinal Morphology
Intestinal morphology analyses were followed by the methods of [23]. Crypt depth, villous height, intestine wall thickness, goblet cell, and lymphocyte measured and counted with computer-assisted microscopy (Micro metrics TM; Nikon ECLIPSE E200, Tokyo, Japan).
2.8. Real-Time Quantitative Reverse Transcriptase PCR
Quantitative real-time PCR (qRT-PCR) was followed by the methods of [23]. In brief, total RNA was extracted using the Trizol reagent (Invitrogen, Thermo Fisher Scientific, USA). RNA was purified extracted using the RNeasy Mini Kit (Takara Bio Inc., Shiga, Japan), and remove contaminants with DNase (Takara, Shuzo, Kyoto, Japan). Then, the quality and quantity of RNA should be determined by ultraviolet spectroscopy (Nanodrop 2000 Spectrophotometer, Thermo Scientific, Courtaboeuf, France). The cDNA library was constructed using the TransScript One-Step gDNA Removal and cDNA Synthesis SuperMix kit (Transgen, China), then diluted as instructions. Amplification conditions were performed as follows: (1) denaturation for 10 min at 95°C; (2) 40 PCR cycles of denaturation for 15 s at 95°C, annealing for 15 s at 56–64°C and extension for 45 s at 56–64°C [23]. All PCR primers used in this study are listed in Table 1.
Table 1.
Primers used for real-time quantitative PCR.
| Genes | Accession no. | Primers | Sequences (5′-3′) |
|---|---|---|---|
| β-Actin | XM_003124280.3 | Forward | GGATGCAGAAGGAGATCACG |
| Reverse | ATCTGCTGGAAGGTGGACAG | ||
|
| |||
| GAPDH | NM_001206359.1 | Forward | ATCCTGGGCTACACTGAGGAC |
| Reverse | AAGTGGTCGTTGAGGGCAATG | ||
|
| |||
| E-cadherin | NM_001163060.1 | Forward | GAAGGAGGTGGAGAAGAGGAC |
| Reverse | AGAGTCATAAGGTGGGGCAGT | ||
|
| |||
| Occludin | NM_001163647.2 | Forward | AGAGTCATAAGGTGGGGCAGT |
| Reverse | CGCCCGTCGTGTAGTCTGTC | ||
|
| |||
| ZO-1 | XM_005659811.1 | Forward | TACCCTGCGGCTGGAAGA |
| Reverse | GGACGGGACCTGCTCATAACT | ||
|
| |||
| Integrin | NM_213968.1 | Forward | GCAGTTTCAAGGTCAAGATGG |
| Reverse | AGCAGGAGGAAGATGAGCAG | ||
|
| |||
| TNFα | NM_214022.1 | Forward | ACAGGCCAGCTCCCTCTTAT |
| Reverse | CCTCGCCCTCCTGAATAAAT | ||
|
| |||
| IL-6 | NM_214399.1 | Forward | TCCAGCATCATTGCATCATC |
| Reverse | GGCTCCACTCACTCCACAAG | ||
|
| |||
| IL-8 | NM_213948.1 | Forward | TGAGAAGCAACAACAACAGCA |
| Reverse | CAGCACAGGAATGAGGCATA | ||
|
| |||
| IFN-γ | NM_213948.1 | Forward | TTCAGCTTTGCGTGACTTTG |
| Reverse | GGTCCACCATTAGGTACATCTG | ||
|
| |||
| TGF-β1 | NM_001173023.1 | Forward | AAGCGGCAACCAAATCTATG |
| Reverse | CCCGAGAGAGCAATACAGGT | ||
|
| |||
| IL-1α | NM_214029.1 | Forward | ACCCGACTGTTTGTGAGTGC |
| Reverse | TTCCCAGAAGAAGAGGAGACTG | ||
|
| |||
| IL-12 | NM_213993.1 | Forward | ATCTCGGTTGGTGTTGTTCC |
| Reverse | GGGTATCTCGTCCTCTGTCC | ||
|
| |||
| IL-4 | NM_214123.1 | Forward | CCCGAGTGTCAAGTGGCTTA |
| Reverse | TGATGATGCCGAAATAGCAG | ||
2.9. Immunohistochemical Analysis
The expressions of proliferating cell nuclear antigen (PCNA) and tight junction proteins as ZO-1, occludin, claudin-3, and claudin-1 were determined using immunohistochemical analysis as described by [25].
The stained sections were incubated with the primary antibodies described by [25]: anti-PCNA (1 : 200; Changsha Kainuo Biological Technology Co., Ltd., Changsha, China), ZO-1 polyclonal antibody (1 : 100; Abcam, Cambridge, UK), occludin polyclonal antibody (1 : 100; Abcam), claudin-3 poly-clonal antibody (1 : 100; Abcam), claudin-1 polyclonal antibody (1 : 100; Abcam), E-claudin poly-clonal antibody (1 : 100; Abcam), Rabbit hypersensitivity 2-step immunohistochemical kit (Boster Biological Technology), diaminobenzidine (Boster Biological Technology), and hematoxylin (Boster Biological Technology). The PCNA labeling index was expressed as the ratio of cells that were positively stained for PCNA to all epithelial cells. The expressions of tight junction proteins were expressed as the average optical density (the ratio of integrated optical density to the area of tissue) in at least 5 areas. All areas were randomly selected for counting at less than 200-fold magnification and all data expressed as the relative values to those of control piglets.
2.10. Plasma Antioxidative Capacity
The determination of superoxide dismutase (SOD), malondialdehyde (MDA), glutathione S-transferase (GST), glutathione peroxidase (GSH-Px), and total antioxidant capacity (T-AOC) levels in plasma were measured by spectrophotometric methods according to manufacturer instructions of assay kits (Nanjing Jiancheng, Nanjing, China). In brief, SOD, GST, and GSH-Px were analyzed by the xanthine oxidase-xanthine reaction method and reduced glutathione method, respectively. T-AOC was detected by ferric-reducing/antioxidant power reaction method, and MDA capacity was assayed by the 2-thiobarbituric acid method. All samples were measured by a UV/visible spectrophotometer (UV-2450, Shimadzu, Kyoto, Japan).
2.11. Statistical Analysis
Data were analyzed by the analysis of variance, using the General Linear Models procedure of the SPSS 20.0 (SPSS Inc., Chicago, IL, USA). Significant differences between means were determined using Tukey's multiple comparison tests. Results on the column chart expressed as the mean ± standard error of mean. Results on the tables expressed as the mean and standard error of mean (SEM). Differences were declared as significant at P < 0.05, and trends toward significance are discussed at 0.05 ≤ P < 0.10.
3. Results
3.1. Growth Performance
Compared with the control, DON exposure reduced average daily gain (ADG) and gain to feed ratio (G/F) (Table 2). Orally administered RAPA led to poorer growth performance, further reducing the ADG and average daily feed intake (ADFI) and gain: feed ratio relative to the DON group. Conversely, CQ treatment alleviated the effects of DON with growth performance measures nearing those of the control group.
Table 2.
Effect of dietary RAPA and CQ on growth performance following exposure to DON.
| Parameters | CON | DON | RAPA+DON | CQ+DON | SEM | P value |
|---|---|---|---|---|---|---|
| ADG (g/d) | 182.60a | 136.52b | -23.80c | 171.29ab | 9.37 | <0.01 |
| ADFI (g/d) | 255.69a | 248.67a | 116.87b | 232.86a | 8.16 | <0.01 |
| G/F | 0.72a | 0.54b | -0.22c | 0.72a | 0.06 | <0.01 |
CON: saline solution; DON: deoxynivalenol diet and saline solution; RAPA+DON: rapamycin and deoxynivalenol diet; CQ+DON: chloroquine and deoxynivalenol diet. a,b,cValues within a row with different superscripts differ significantly (P < 0.05).
3.2. Beclin1, P62, LC3, and β-Actin Analysis
The group receiving DON and RAPA exhibited a higher ratio of LC3II/LC3I protein and a lower level of p62 relative to the control group, while CQ treatment increased the ratio of LC3II/LC3I and expression level of p62 (Figure 1). These findings suggest that DON and RAPA induced autophagy and CQ alleviated autophagy.
Figure 1.
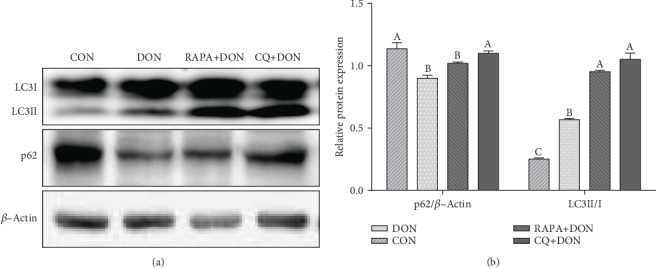
Autophagy validation in the jejunum of weaning piglets. Western blots results and abundance of p62 and LC3 protein abundance (the ratio of LC3IIand LC3I). Dietary treatment: CON: saline solution; DON: deoxynivalenol diet and saline solution; RAPA+DON: rapamycin and deoxynivalenol diet; CQ+DON: chloroquine and deoxynivalenol diet. Data are expressed as mean ± SEM (n = 6), four models chosen, a,b,cValues within a row with different superscripts differ significantly (P < 0.05).
3.3. Cytokine Profiles
Exposure to DON yielded increased serum concentrations of IL-6, IL-12, IL-1β, TNF-α, IL-10, and IFN-γ, but decreased TGF-β content (Table 3). Consistent with this, we found greater expression of IL-6, IL-12, IL-1β, and TNF-α mRNA in the jejunum (Figure 2), as well as a lower level of TGF-β mRNA. Relative to the DON-only group, the DON + RAPA group showed a greater increase in the serum and jejunum concentrations of IL-6, IL-8, and TNF-α, while CQ significantly decreased the levels of IL-6, IL-12, IL-1β, and TNF-α and increased the expression of factor TGF-β in both serum and jejunum to levels similar to the control group.
Table 3.
Effect of dietary RAPA and CQ on serum inflammatory cytokine level following exposure to DON.
| Parameters | CON | DON | RAPA+DON | CQ+DON | SEM | P value |
|---|---|---|---|---|---|---|
| IL-6 (pg/mL) | 553.07c | 652.04b | 718.29a | 592.32c | 15.93 | <0.01 |
| IL-8 (pg/mL) | 34.32b | 33.42b | 43.88a | 31.76b | 1.31 | <0.01 |
| IL-12 (pg/mL) | 36.03c | 46.10ab | 52.35a | 37.85bc | 1.89 | <0.01 |
| IL-1β (pg/mL) | 366.27ab | 431.12a | 381.23ab | 314.97b | 13.78 | 0.02 |
| TNF-α (pg/mL) | 102.34b | 124.08a | 131.36a | 111.92b | 4.54 | 0.05 |
| TGF-β (pg/mL) | 441.70b | 336.34c | 632.91a | 421.70b | 28.73 | <0.01 |
| IgG (g/L) | 1.47 | 1.63 | 1.47 | 1.56 | 0.05 | 0.37 |
| IgM (g/L) | 0.43a | 0.53a | 0.14b | 0.48a | 0.03 | < 0.01 |
CON: saline solution; DON: deoxynivalenol diet and saline solution; RAPA+DON: rapamycin and deoxynivalenol diet; CQ+DON: chloroquine and deoxynivalenol diet. a,b,cValues within a row with different superscripts differ significantly (P < 0.05). If “ab” is in the marked place the measurement is neither significant compared to “a” or “b”, the same as other.
Figure 2.
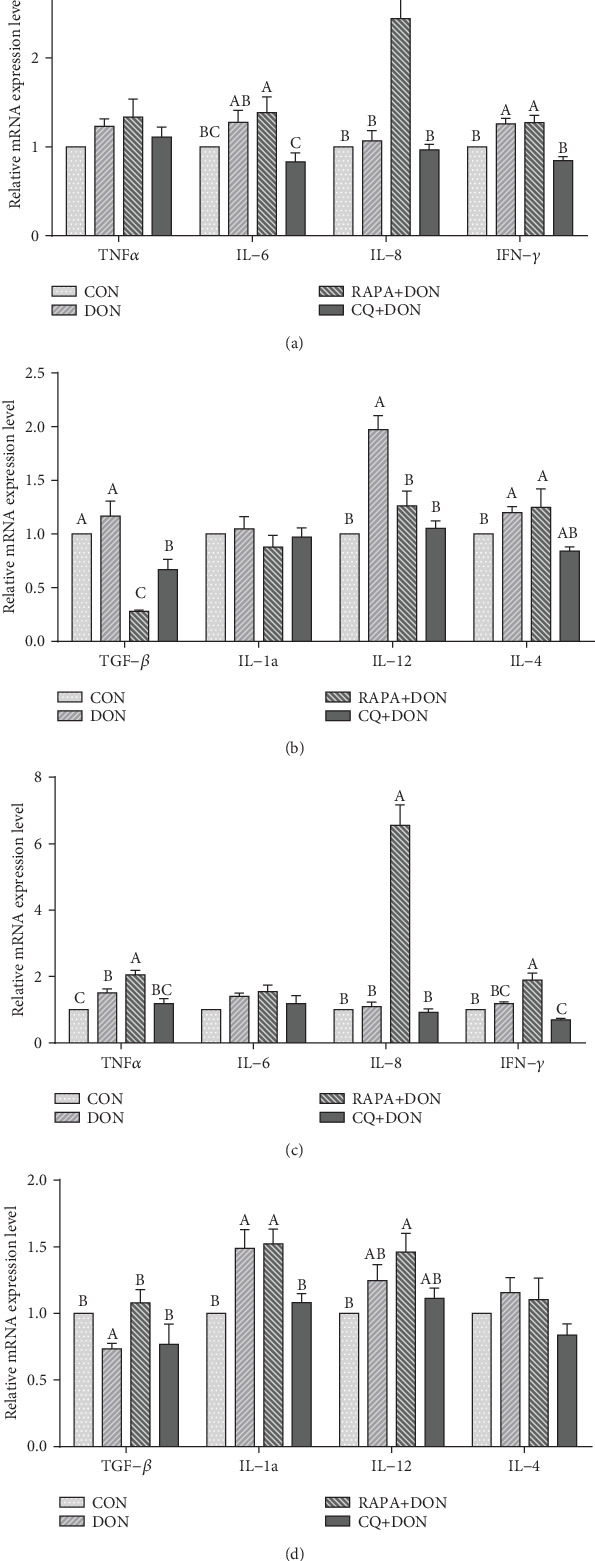
Relative mRNA levels of genes (TNFα, IL-6, IL-8, IFN-γ, TGF-β1, IL-1α, IL-12, IL-4) related to cytokine in the jejunum (a, b) and ileum (c, d) of weanling piglets. The real-time PCR method was employed, and β-actin was used as an internal control. Dietary treatment: CON: saline solution; DON: deoxynivalenol diet and saline solution; RAPA+DON: rapamycin and deoxynivalenol diet; CQ+DON: chloroquine and deoxynivalenol diet. Data are expressed as mean ± SEM (n = 6), four models chosen. a,b,cMean values with different letters were considered to be significantly different (P < 0.05). If “ab” is on top of the column the measurement is neither significant compared to “a” or “b”, the same of other.
3.4. Serum D-Lactate and Diamine Oxidase
The contents of diamine oxidase (DAO) and D-lactic acid of the DON-treated group were significantly higher than those in the control group (Table 4). RAPA treatment further increased serum D-lactic acid concentration, while CQ treatment decreased the levels of both DAO and D-lactic acid in serum.
Table 4.
Effect of dietary RAPA and CQ on Serum Diamine Oxidase and D-lactate following exposure to DON.
| Parameters | CON | DON | RAPA+DON | CQ+DON | SEM | P value |
|---|---|---|---|---|---|---|
| DAO (mmol/L) | 1.40b | 1.70a | 0.60c | 1.28b | 0.09 | <0.01 |
| D-lactose (μg/mL) | 76.093c | 86.76b | 95.77a | 76.07c | 2.69 | <0.01 |
CON: saline solution; DON: deoxynivalenol diet and saline solution; RAPA+DON: rapamycin and deoxynivalenol diet; CQ+DON: chloroquine and deoxynivalenol diet. a,b,cValues within a row with different superscripts differ significantly (P < 0.05). If “ab” is in the marked place the measurement is neither significant compared to “a” or “b”, the same of other.
3.5. Intestinal Morphology
The villus height of jejunum and ileum of DON-treated piglets was significantly lower than that of control piglets (Figure 3, Table 5). RAPA treatment further decreased villus height and increased the ratio of villus height to crypt depth (V/C), while CQ significantly increased villus height, indicating the amelioration of DON-induced injury to the jejunum and ileum villi.
Figure 3.
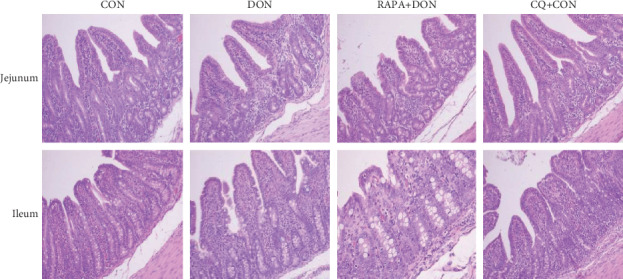
Morphology analysis representative picture (magnification ×100) in the jejunum and ileum of weanling piglets (n = 6). Dietary treatment: CON: saline solution; DON: deoxynivalenol diet and saline solution; RAPA+DON: rapamycin and deoxynivalenol diet; CQ+DON: chloroquine and deoxynivalenol diet.
Table 5.
Effect of dietary RAPA and CQ on intestinal morphology following exposure to DON.
| Parameters | CON | DON | RAPA+DON | CQ+DON | SEM | P value |
|---|---|---|---|---|---|---|
| Jejunum | ||||||
| Villus height (μm) | 352.63a | 323.54b | 259.51c | 341.10a | 19.93 | <0.01 |
| Crypt depth (μm) | 86.70b | 97.31a | 78.21c | 90.20b | 3.46 | <0.01 |
| Villus height: crypt | 4.07a | 3.33c | 3.32c | 3.79b | 0.09 | <0.01 |
| Wall thickness (μm) | 159.24bc | 182.40a | 150.12c | 166.48b | 4.72 | <0.01 |
| Goblet cell number | 8.50 | 9.17 | 8.17 | 7.67 | 0.14 | 0.32 |
| Lymphocyte number | 31.50a | 30.00a | 27.83b | 30.67a | 0.10 | <0.01 |
| Ileum | ||||||
| Villus height (μm) | 325.30a | 267.71c | 223.00d | 297.78b | 20.14 | <0.01 |
| Crypt depth (μm) | 89.19a | 88.27a | 77.80b | 87.54a | 2.81 | <0.01 |
| Villus height: crypt | 3.65a | 3.16b | 2.87c | 3.42a | 0.14 | <0.01 |
| Wall thickness (μm) | 160.20a | 168.36a | 94.80 b | 159.06a | 17.59 | <0.01 |
| Goblet cell number | 10.17 | 9.33 | 10.67 | 11.67 | 0.29 | 0.29 |
| Lymphocyte number | 31.50 | 29.67 | 30.50 | 29.33 | 0.10 | 0.25 |
CON: saline solution; DON: deoxynivalenol diet and saline solution; RAPA+DON: rapamycin and deoxynivalenol diet; CQ+DON: chloroquine and deoxynivalenol diet. a,b,cValues within a row with different superscripts differ significantly (P < 0.05). If “ab” is in the marked place the measurement is neither significant compared to “a” or “b”, the same of other.
3.6. E-Cadherin, Occludin, ZO-1, and Integrin
DON treatment decreased the mRNA expression of E-cadherin, occludin, zonula occludens-1 (ZO-1), and integrin in the jejunal and ileal mucosa relative to controls (Figure 4). RAPA further downregulated the expression of E-cadherin, occludin, ZO-1, and integrin mRNA in the jejunum, while CQ treatment ameliorated the expression of tight junction protein. Under DON treatment, integrin mRNA expression in the ileal mucosa was lower than in controls. There were no differences in the expression of any investigated genes between DON and CQ treatments.
Figure 4.
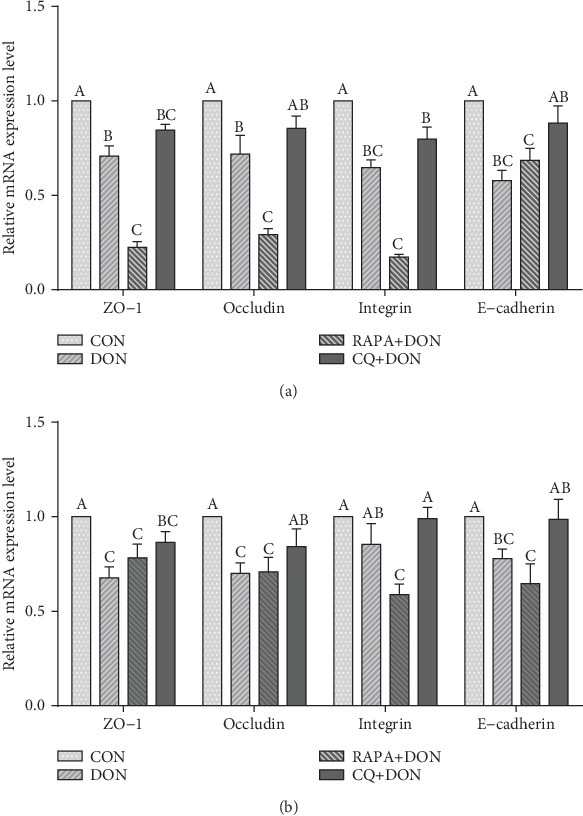
Relative mRNA levels of genes (ZO-1, occludin, integrin, and E-cadherin) related to tight junction and adherent junction in the jejunum (a) and ileum (b) of weanling piglets. The real-time PCR method was employed, and β-actin was used as an internal control. Dietary treatment: CON: saline solution; DON: deoxynivalenol diet and saline solution; RAPA+DON: rapamycin and deoxynivalenol diet; CQ+DON: chloroquine and deoxynivalenol diet. Data are expressed as mean ± SEM (n = 6), four models chosen. a,b,cMean values with different letters were considered to be significantly different (P < 0.05). If “ab” is on top of the column the measurement is neither significant compared to “a” or “b”, the same of other. Differences were assessed within each target gene.
The expression of E-cadherin, ZO-1, claudin-1, and claudin-3 in the jejunum of DON-treated were obviously lower than in the control group. In comparison, CQ treatment increased the optical density of tight junction-associated proteins and upregulated their expression (Figure 5).
Figure 5.
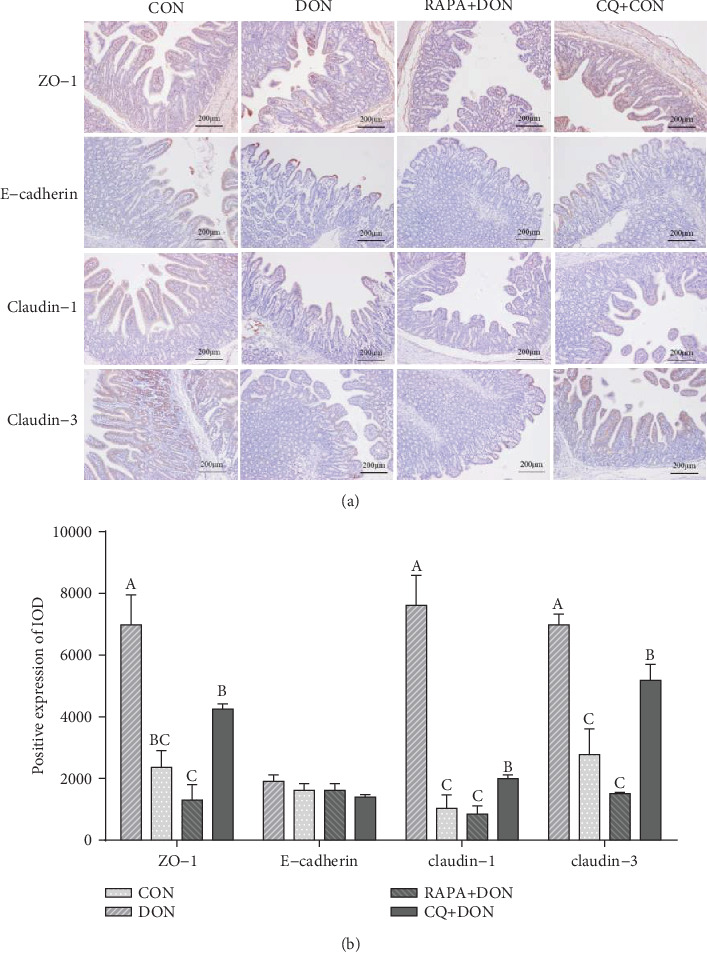
Immunohistochemical staining representative picture (magnification ×100) in jejunal mucosa (a). Relative positive expression of the proteins (ZO-1, E-cadherin, claudin-1, and claudin-3) related to tight junction and adherent junction in the jejunum of weanling piglets (b). Dietary treatment: CON: saline solution; DON: deoxynivalenol diet and saline solution; RAPA+DON: rapamycin and deoxynivalenol diet; CQ+DON: chloroquine and deoxynivalenol diet. Data are expressed as mean ± SEM (n = 6), four models chosen. a,b,cMean values with different letters were considered to be significantly different (P < 0.05). If “ab” is on top of the column the measurement is neither significant compared to “a” or “b”, the same of other.
3.7. Immunohistochemical Staining of Jejunal Mucosa PCNA
A representative image and labeling index of proliferating cell nuclear antigen (PCNA) immunohistochemical staining are shown in Figure 6. The percentage of PCNA-positive cells in the jejunum of piglets treated with DON was significantly lower than in the control group. In comparison, there was a significant decrease in the percentage of PCNA-positive cells in the RAPA group, while CQ treatment increased the PCNA labeling index.
Figure 6.
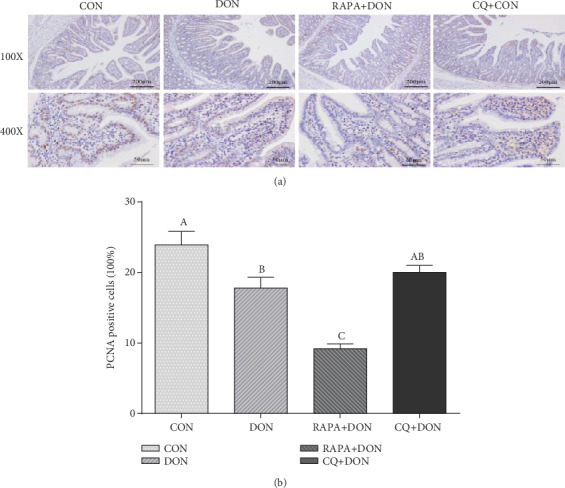
PCNA immunohistochemical staining representative picture (magnification ×100, and ×400) in jejunal mucosa (a), Positive expression of PCNA in the jejunum of weanling piglets (b). Dietary treatment: CON: saline solution; DON: deoxynivalenol diet and saline solution; RAPA+DON: rapamycin and deoxynivalenol diet; CQ+DON: chloroquine and deoxynivalenol diet. Data are expressed as mean ± SEM (n = 6), four models chosen. a,b,cMean values with different letters were considered to be significantly different (P < 0.05).
3.8. Antioxidant Factors Profiles
As shown in Figure 7, DON specimens exhibited lower levels of antioxidants, with remarkably downregulated concentrations of superoxide dismutase (SOD), glutathione S-transferase (GST), glutathione peroxidase (GSH-Px), and total antioxidant capacity (T-AOC), as well as upregulation of malondialdehyde (MDA). RAPA-treated group downregulation antioxidant ability, while the CQ-treated group exhibited improved antioxidant ability with higher concentrations of GSH-Px and GST relative to the DON group.
Figure 7.
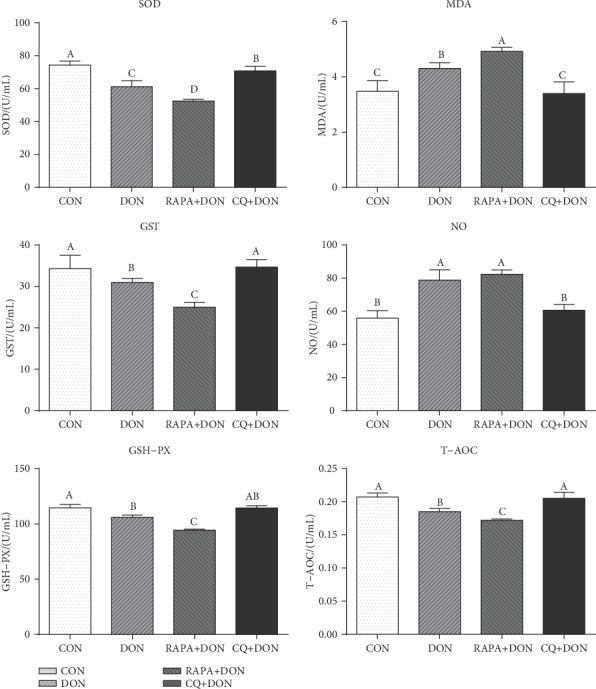
Antioxidant factors profiles in plasma. Dietary treatment: CON: saline solution; DON: deoxynivalenol diet and saline solution; RAPA+DON: rapamycin and deoxynivalenol diet; CQ+DON: chloroquine and deoxynivalenol diet. Data are expressed as mean ± SEM (n = 6), four models chosen. a,b,cMean values with different letters were considered to be significantly different (P < 0.05).
4. Discussion
DON causes toxicity such as growth retardation, weight loss, anorexia, and metabolic disorders in weanling piglets [26, 27]. In our study, DON led to a significant decrease in growth performance and average daily gain following the exposure to DON for 7 days. To explore the role of autophagy in conferring with DON in vivo, two reagents, autophagy inducer RAPA and autophagy inhibitor CQ, were used in the piglet as an animal model. The RAPA-treated group showed aggravated intestinal autophagy leading to further growth inhibition, while CQ alleviated DON damage with intestinal health indices comparable to the level of the control group, yielding improved growth performance with lower levels of autophagy.
The exacerbation of inflammatory responses contributes to increased intestinal damage. Autophagy is believed to play an important role in mediating inflammatory responses through clearing damaged organelles and misfolded proteins and reducing the levels of inflammatory cytokines or increasing levels of anti-inflammatory cytokines [28]. We found that treatment with RAPA yielded higher levels of proinflammatory cytokines in both blood and intestinal cells, triggering a severe inflammatory response with exacerbation of autophagy through RAPA and DON stimulation. In contrast, treatment with CQ yielded significantly lower inflammatory cytokines in blood and intestinal cells compared to a healthy control group, as well as reduced autophagy. These results indicated that, in piglets exposed to DON, RAPA led to excessive autophagy, more proinflammatory cytokines, and severe inflammatory response, while CQ downregulated proinflammatory factors and autophagy, enhancing growth performance.
Intestinal villus height, crypt depth, and tight junction proteins, and indices of cell production, maturation, and secretory function were further negatively affected by treatment with RAPA in DON-exposed piglets. Meanwhile, in keeping with other indices of comparison, CQ-treated piglets showed ameliorated intestinal mucosal morphology. Although a normal physiological rate of autophagy plays a role in cytoprotective mechanisms in response to toxin stress [15, 29–31], our results suggest that excessive or uncontrolled autophagy due to RAPA + DON induces physiological dysfunction and severe inflammatory reactions, leading to intestinal damage and decreased growth performance. Piglets exposed to CQ showed inhibited lysosomal acidification, preventing the development of autophagy, and also showed levels of autophagy, inflammatory cytokines, and intestinal mucous barrier features comparable to a DON-free group. This suggests that moderate alteration of autophagy eases the inflammatory response and yields concomitant enhancement of growth performance with a better intestinal barrier function. In addition to regulating autophagy, CQ can ameliorate cellular function by targeting a variety of proteases to suppress their activity, inhibiting protein hydrolysis, glycolipid generation, and other metabolic pathways [17], which may serve a protective role during toxin stress.
Oxidative stress is another known mechanism by which DON causes damage to the body, producing a large number of free radicals [32, 33] and consuming antioxidants in the body. At the same time, DON inhibits the activity of antioxidant enzymes such as SOD and catalase, resulting in excessive production of oxidation markers such as lipid peroxidation and MDA. These substances can cause severe damage to the structure of the cell membrane, destroy the antioxidant balance, and cause cell dysfunction [34]. This study found that DON reduced the activity of SOD and GSH in plasma, and CQ treatment restores the activity of SOD and GSH in plasma and reduced the content of MDA relative to the DON group. This suggests that the CQ-treated group increases the level of antioxidant enzymes in the blood that in turn accelerated neutralize ROS and play an antioxidant role [35]. In addition, CQ treatment increased the content of nitric oxide (NO), indicating the regulation balance between oxidation and antioxidant system in vivo [35], which an appropriate amount of NO can remove oxygen free radicals, and thus, protecting the cell membrane and reducing tissue damage [36].
5. Conclusion
Our results demonstrated that CQ significantly improves intestinal barrier function, inflammation response, and antioxidant ability in vivo. It may, therefore, be useful as a potential feed additive agent against mycotoxicity in piglets.
Acknowledgments
We thank the Key Laboratory of Agro-ecological Processes in Subtropical Region for kindly helping lab analysis in this study. This work was supported by the Key R&D Program of Hunan Province (2019NK2171, 2019NK2161), the Innovation Team of Key areas of the Ministry of Science and Technology, the Science and Technology Leadership Program of Hunan Province (2019RS3021), the Youth Innovation Team Project of ISA, the Chinese Academy of Sciences (2017QNCXTD_TBE), the State Key Laboratory Foundation of Animal Nutrition (2004DA125184F1701), the Open Fund of Key Laboratory of Agro-ecological Processes in Subtropical Region, the Chinese Academy of Sciences (ISA2018303), the State Key Laboratory of Food Science and Technology, Nanchang University (SKLF-ZZB-201710).
Abbreviations
- mTOR:
Mammalian target of rapamycin
- LC3:
The microtubule-associated protein 1 light chain 3
- P62:
P62/SQSTM1
- IFN-γ:
Interferon-γ
- IL:
Interleukin
- TGF-β:
Transforming growth factor-β
- TNF-α:
Tumor necrosis factor-α
- RAPA:
Rapamycin
- CQ:
Chloroquine
- DON:
Deoxynivalenol
- IgG:
Immunoglobulin G
- IgM:
immunoglobulin M
- ZO-1:
zonula occludens-1
- G/F:
gain: feed ratio.
Contributor Information
Peng Sun, Email: sunpeng02@caas.cn.
Yulong Tang, Email: tangyulong@isa.ac.cn.
Data Availability
All data during the study are available from the corresponding author by request.
Additional Points
Key Contribution. These findings provide evidence of the roles of RAPA and CQ in DON-exposed piglets and indicated a link between autophagy and alteration of the inflammatory response as well as intestinal morphology in vivo.
Ethical Approval
Animal welfare statement: the authors confirm that the ethical policies of the journal, as noted on the journal's author guidelines page, have been adhered to and the appropriate ethical review committee approval has been received. The authors confirm that they have followed EU standards for the protection of animals used for scientific purposes. The experimental design and procedures used in this study were approved by the Animal Care and Use Committee of the Institute of Subtropical Agriculture, Chinese Academy of Science (IACUC#201302), date of approval: 21 April 2018.
Conflicts of Interest
There is no conflict of interest in this manuscript.
Authors' Contributions
YT, BT, and SL proposed the study protocol. SL, JL, ST, MQ, ZC, and YW participated in the experiments. SL, ST, and AZ contributed to sample preparation and data analysis. SL, YT, PS, and YY edited and reviewed the final version of the article. All authors provided constructive comments on the manuscript.
References
- 1.Bullerman L. B., Bianchini A. Stability of mycotoxins during food processing. International Journal of Food Microbiology. 2007;119(1-2):140–146. doi: 10.1016/j.ijfoodmicro.2007.07.035. [DOI] [PubMed] [Google Scholar]
- 2.Bensassi F., El Golli-Bennour E., Abid-Essefi S., Bouaziz C., Hajlaoui M. R., Bacha H. Pathway of deoxynivalenol-induced apoptosis in human colon carcinoma cells. Toxicology. 2009;264(1-2):104–109. doi: 10.1016/j.tox.2009.07.020. [DOI] [PubMed] [Google Scholar]
- 3.Pestka J. J. Deoxynivalenol: toxicity, mechanisms and animal health risks. Animal Feed Science and Technology. 2007;137(3-4):283–298. doi: 10.1016/j.anifeedsci.2007.06.006. [DOI] [Google Scholar]
- 4.Singh S., Banerjee S., Chattopadhyay P., Borthakur S. K., Veer V. Deoxynivalenol induces cytotoxicity and genotoxicity in animal primary cell culture. Toxicology Mechanisms and Methods. 2015;25(3):184–191. doi: 10.3109/15376516.2015.1006743. [DOI] [PubMed] [Google Scholar]
- 5.Ghareeb K., Awad W. A., Bohm J., Zebeli Q. Impacts of the feed contaminant deoxynivalenol on the intestine of monogastric animals: poultry and swine. Journal of Applied Toxicology. 2015;35(4):327–337. doi: 10.1002/jat.3083. [DOI] [PubMed] [Google Scholar]
- 6.Pestka J. J. Mechanisms of deoxynivalenol-induced gene expression and apoptosis. Food Additives & Contaminants: Part A, Chemistry, Analysis, Control, Exposure & Risk Assessment. 2008;25(9):1128–1140. doi: 10.1080/02652030802056626. [DOI] [PMC free article] [PubMed] [Google Scholar]
- 7.Xiao H., Tan B. E., Wu M. M., et al. Effects of composite antimicrobial peptides in weanling piglets challenged with deoxynivalenol: Ii. Intestinal morphology and function. Journal of Animal Science. 2013;91(10):4750–4756. doi: 10.2527/jas.2013-6427. [DOI] [PubMed] [Google Scholar]
- 8.Xiao H., Wu M. M., Tan B. E., et al. Effects of composite antimicrobial peptides in weanling piglets challenged with deoxynivalenol: I. Growth performance, immune function, and antioxidation capacity. Journal of Animal Science. 2013;91(10):4772–4780. doi: 10.2527/jas.2013-6426. [DOI] [PubMed] [Google Scholar]
- 9.Kolf-Clauw M., Castellote J., Joly B., et al. Development of a pig jejunal explant culture for studying the gastrointestinal toxicity of the mycotoxin deoxynivalenol: histopathological analysis. Toxicology In Vitro. 2009;23(8):1580–1584. doi: 10.1016/j.tiv.2009.07.015. [DOI] [PubMed] [Google Scholar]
- 10.Pinton P., Braicu C., Nougayrede J. P., Laffitte J., Taranu I., Oswald I. P. Deoxynivalenol impairs porcine intestinal barrier function and decreases the protein expression of claudin-4 through a mitogen-activated protein kinase-dependent mechanism. The Journal of Nutrition. 2010;140(11):1956–1962. doi: 10.3945/jn.110.123919. [DOI] [PubMed] [Google Scholar]
- 11.Pinton P., Nougayrede J. P., Del Rio J. C., et al. The food contaminant deoxynivalenol, decreases intestinal barrier permeability and reduces claudin expression. Toxicology and Applied Pharmacology. 2009;237(1):41–48. doi: 10.1016/j.taap.2009.03.003. [DOI] [PubMed] [Google Scholar]
- 12.Klionsky D. J., Nemchenko A. There is more to autophagy than induction: regulating the roller coaster. Autophagy. 2011;7(8):801–802. doi: 10.4161/auto.7.8.16609. [DOI] [PMC free article] [PubMed] [Google Scholar]
- 13.Trentesaux C., Fraudeau M., Romagnolo B. Contribution of autophagy to intestinal homeostasis and pathology. Medecine Sciences. 2017;33(3):290–296. doi: 10.1051/medsci/20173303016. [DOI] [PubMed] [Google Scholar]
- 14.Juan-Garcia A., Juan C., Tolosa J., Ruiz M. J. Effects of deoxynivalenol, 3-acetyl-deoxynivalenol and 15-acetyl-deoxynivalenol on parameters associated with oxidative stress in Hepg2 cells. Mycotoxin Research. 2019;35(2):197–205. doi: 10.1007/s12550-019-00344-0. [DOI] [PubMed] [Google Scholar]
- 15.Tang Y., Li J., Li F., et al. Autophagy protects intestinal epithelial cells against deoxynivalenol toxicity by alleviating oxidative stress via Ikk signaling pathway. Free Radical Biology & Medicine. 2015;89:944–951. doi: 10.1016/j.freeradbiomed.2015.09.012. [DOI] [PubMed] [Google Scholar]
- 16.Jung C. H., Ro S. H., Cao J., Otto N. M., Kim D. H. Mtor regulation of autophagy. FEBS Letters. 2010;584(7):1287–1295. doi: 10.1016/j.febslet.2010.01.017. [DOI] [PMC free article] [PubMed] [Google Scholar]
- 17.He C., Klionsky D. J. Regulation mechanisms and signaling pathways of autophagy. Annual Review of Genetics. 2009;43:67–93. doi: 10.1146/annurev-genet-102808-114910. [DOI] [PMC free article] [PubMed] [Google Scholar]
- 18.Nagar J., Ranade S., Kamath V., et al. Therapeutic potential of chloroquine in a murine model of inflammatory bowel disease. International Immunopharmacology. 2014;21(2):328–335. doi: 10.1016/j.intimp.2014.05.005. [DOI] [PubMed] [Google Scholar]
- 19.Yang G. E., Duan X., Lin D., et al. Rapamycin-induced autophagy activity promotes bone fracture healing in rats. Experimental and Therapeutic Medicine. 2015;10(4):1327–1333. doi: 10.3892/etm.2015.2660. [DOI] [PMC free article] [PubMed] [Google Scholar]
- 20.Liu H., Tan B., Huang B., et al. Involvement of Calcium-Sensing Receptor activation in the alleviation of intestinal inflammation in a piglet model by dietary aromatic amino acid supplementation. British Journal of Nutrition. 2018;120(12):1321–1331. doi: 10.1017/S0007114518002891. [DOI] [PubMed] [Google Scholar]
- 21.Duan Y., Li F., Liu H., et al. Nutritional and regulatory roles of leucine in muscle growth and fat reduction. Front Biosci (Landmark Ed) 2015;20:796–813. doi: 10.2741/4338. [DOI] [PubMed] [Google Scholar]
- 22.Hou Y., Yao K., Wang L., et al. Effects of α-ketoglutarate on energy status in the intestinal mucosa of weaned piglets chronically challenged with lipopolysaccharide. The British Journal of Nutrition. 2011;106(3):357–363. doi: 10.1017/S0007114511000249. [DOI] [PubMed] [Google Scholar]
- 23.Liao S., Tang S., Chang M., et al. Chloroquine downregulation of intestinal autophagy to alleviate biological stress in early-weaned piglets. Animals. 2020;10(2):290–303. doi: 10.3390/ani10020290. [DOI] [PMC free article] [PubMed] [Google Scholar]
- 24.Chen J., Su W., Kang B., et al. Supplementation with α-ketoglutarate to a low-protein diet enhances amino acid synthesis in tissues and improves protein metabolism in the skeletal muscle of growing pigs. Amino Acids. 2018;50(11):1525–1537. doi: 10.1007/s00726-018-2618-3. [DOI] [PubMed] [Google Scholar]
- 25.Wang J., Li G. R., Tan B. E., et al. Oral administration of putrescine and proline during the suckling period improves epithelial restitution after early weaning in piglets1. Journal of Animal Science. 2015;93(4):1679–1688. doi: 10.2527/jas.2014-8230. [DOI] [PubMed] [Google Scholar]
- 26.Dersjant-Li Y., Verstegen M. W., Gerrits W. J. The impact of low concentrations of aflatoxin, deoxynivalenol or fumonisin in diets on growing pigs and poultry. Nutrition Research Reviews. 2003;16(2):223–239. doi: 10.1079/NRR200368. [DOI] [PubMed] [Google Scholar]
- 27.Doll S., Danicke S., Ueberschar K. H., et al. Effects of graded levels of fusarium toxin contaminated maize in diets for female weaned piglets. Archiv für Tierernährung. 2003;57(5):311–334. doi: 10.1080/00039420310001607680. [DOI] [PubMed] [Google Scholar]
- 28.Short B. Mitochondrial caspase keeps autophagy in flux. The Journal of Cell Biology. 2012;205(4):p. 431. doi: 10.1083/jcb.2054if. [DOI] [Google Scholar]
- 29.Guo X., Dong Y., Yin S., et al. Patulin induces pro-survival functions via autophagy inhibition and P62 accumulation. Cell Death & Disease. 2013;4(10, article e822) doi: 10.1038/cddis.2013.349. [DOI] [PMC free article] [PubMed] [Google Scholar]
- 30.Solhaug A., Torgersen M. L., Holme J. A., Lagadic-Gossmann D., Eriksen G. S. Autophagy and senescence, stress responses induced by the DNA-damaging mycotoxin alternariol. Toxicology. 2014;326:119–129. doi: 10.1016/j.tox.2014.10.009. [DOI] [PubMed] [Google Scholar]
- 31.Yin S., Guo X., Li J., Fan L., Hu H. Fumonisin B1 induces autophagic cell death via activation of Ern1-Mapk8/9/10 pathway in monkey kidney Marc-145 cells. Archives of Toxicology. 2016;90(4):985–996. doi: 10.1007/s00204-015-1514-9. [DOI] [PubMed] [Google Scholar]
- 32.Shen H., Wu N., Wang Y., et al. Chloroquine attenuates paraquat-induced lung injury in mice by altering inflammation, oxidative stress, and fibrosis. International Immunopharmacology. 2017;46:16–22. doi: 10.1016/j.intimp.2017.02.020. [DOI] [PubMed] [Google Scholar]
- 33.Zhang X., Jiang L., Geng C., Cao J., Zhong L. The role of oxidative stress in deoxynivalenol-induced DNA damage in Hepg2 cells. Toxicon. 2009;54(4):513–518. doi: 10.1016/j.toxicon.2009.05.021. [DOI] [PubMed] [Google Scholar]
- 34.Miloradovic Z., Jovovic D., Mihailovic-Stanojevic N., Milanovic J. G., Milanovic S. Effects of long-term losartan and L-arginine treatment on haemodynamics, glomerular filtration, and sod activity in spontaneously hypertensive rats. Canadian Journal of Physiology and Pharmacology. 2008;86(4):210–214. doi: 10.1139/Y08-022. [DOI] [PubMed] [Google Scholar]
- 35.Kouadio J. H., Mobio T. A., Baudrimont I., Moukha S., Dano S. D., Creppy E. E. Comparative study of cytotoxicity and oxidative stress induced by deoxynivalenol, zearalenone or fumonisin B1 in human intestinal cell line Caco-2. Toxicology. 2005;213(1-2):56–65. doi: 10.1016/j.tox.2005.05.010. [DOI] [PubMed] [Google Scholar]
- 36.Pestana C. R., Oishi J. C., Salistre-Araujo H. S., Rodrigues G. J. Inhibition of autophagy by chloroquine stimulates nitric oxide production and protects endothelial function during serum deprivation. Cellular Physiology and Biochemistry. 2015;37(3):1168–1177. doi: 10.1159/000430240. [DOI] [PubMed] [Google Scholar]
Associated Data
This section collects any data citations, data availability statements, or supplementary materials included in this article.
Data Availability Statement
All data during the study are available from the corresponding author by request.


