

Abstract
Background:
Proteomic analysis of cerebrospinal fluid (CSF) has shown great promise in identifying potential markers of injury in neurodegenerative diseases [1–13]. Here we compared CSF proteomes in healthy individuals, with patients diagnosed with traumatic brain injury (TBI) and subarachnoid hemorrhage (SAH) in order to characterize molecular biomarkers which might identify these different clinical states and describe different molecular mechanisms active in each disease state.
Methods:
Patients presenting to the Neurosurgery service at the Louisiana State University Hospital-Shreveport with an admitting diagnosis of TBI or SAH were prospectively enrolled. Patients undergoing CSF sampling for diagnostic procedures were also enrolled as controls. CSF aliquots were subjected to 2-dimensional gel electrophoresis (2D GE) and spot percentage densities analyzed. Increased or decreased spot expression (compared to controls) was defined in terms of in spot percentages, with spots showing consistent expression change across TBI or SAH specimens being followed up by Matrix-Assisted Laser Desorption/Ionization mass spectrometry (MALDI-MS). Polypeptide masses generated were matched to known standards using a search of the NCBI and/or GenPept databases for protein matches. Eight hundred fifteen separately identifiable polypeptide migration spots were identified on 2D GE gels. MALDI-MS successfully identified 13 of 22 selected 2D GE spots as recognizable polypeptides.
Results:
Statistically significant changes were noted in the expression of fibrinogen, carbonic anhydrase-I (CA-I), peroxiredoxin-2 (Prx-2), both α and β chains of hemoglobin, serotransferrin (Tf) and N-terminal haptoglobin (Hp) in TBI and SAH specimens, as compared to controls. The greatest mean fold change among all specimens was seen in CA-I and Hp at 30.7 and −25.7, respectively. TBI specimens trended toward greater mean increases in CA-I and Prx-2 and greater mean decreases in Hp and Tf.
Conclusions:
Consistent CSF elevation of CA-I and Prx-2 with concurrent depletion of Hp and Tf may represent a useful combination of biomarkers for the prediction of severity and prognosis following brain injury.
1. Background
More than 1.5 million American civilians suffer traumatic brain injury (TBI) annually with immediate and long-term sequel ranging from chronic headaches to significant disability and, for some, ultimately death in as many as 50,000 cases per year [14,15]. While aneurysmal subarachnoid hemorrhage (SAH) is significantly less frequent, at 18–25,000 cases (6–8 cases/100,000) annually, the long term outcomes can be equally as grave [16–18]. Multiple radiographic and clinical indices have been proposed over the years in an attempt to predict the severity of brain injury and provide an ultimate prognosis for meaningful recovery with varying levels of success [19–23].
Proteomic analysis offers a new and powerful technique for the systematic and specific identification of target proteins within a given sample. We have previously reported changes in the endothelial proteome in multiple sclerosis (MS) and in response to NMDA stimulation [24,25]. Identification of CSF proteomic targets that are altered during stress and disease is an important goal for designating their etiologic basis and diagnostic utility [26]. Analysis of cerebrospinal fluid (CSF) has been used to identify potential markers of injury and study pathophysiologic changes in neurologic diseases ranging from MS to Alzheimer’s disease [1–13]. This technique offers the potential not only to identify biomarkers of the severity of brain tissue injury in TBI and SAH, but also may ultimately lead to the development of mechanism-based antagonists that can be used to ameliorate the degree of secondary injury common to the pathophysiology of both disease states.
2. Methods
2.1. Study approval
Prior to the collection of data, our protocol was reviewed and approved on June 2, 2009 by the Institutional Review Board for the Protection of Human Research Subjects at the Louisiana State University Health Sciences Center-Shreveport under Protocol # H09–138.
2.2. Sample acquisition
Following informed consent, consecutive patients presenting to the neurosurgery service at the Louisiana State University Hospital-Shreveport with the admitting diagnosis of either traumatic brain injury (TBI) or subarachnoid hemorrhage (SAH) were enrolled in the following investigation. Additional patients undergoing cerebrospinal fluid sampling for diagnostic procedures including lumbar puncture or myelography were enrolled as controls.
All cases of TBI involved clinical history consistent with closed head injury secondary to motor vehicle collision, fall, or blunt trauma. Non-contrast computed tomography (CT) scan of the head confirmed a pattern of cerebral edema with or without intraparenchymal or subarachnoid hemorrhage. Patients with extra-axial, compressive hematomas were excluded. All cases of SAH were identified based upon a combination of clinical history of sudden headache, new onset seizure, or focal neurologic deficit, as well as a non-contrast CT scan of the head with evidence of cisternal or parenchymal hemorrhage consistent with ruptured cerebral aneurysm.
All patients underwent cerebrospinal fluid (CSF) diversion via external ventricular catheter (EVD) during the normal course of their clinical management. In cases of TBI, EVD placement was performed for the monitoring and treatment of elevated intracranial pressure; SAH patients underwent drainage for the management of early hydrocephalus or the presence of significant intraventricular hemorrhage.
Specimens were collected between 4 and 18 h following EVD placement by aspirating CSF from the reservoir drainage bag. Two additional control samples were selected from discarded specimens from patients undergoing CSF analysis or access for diagnostic procedures including lumbar puncture or myelography. These specimens were screened with cell counts, as well as for glucose and protein levels, and were excluded if they showed evidence of infection or neoplastic process. Samples were also excluded in cases with clinical history of rheumatoid arthritis, metastatic neoplasm, or diabetes mellitus. All CSF aliquots were centrifuged to remove formed blood elements and the supernatants were subsequently frozen and stored at −80 °C pending analysis.
2.3. Total protein determination
Total protein was calculated for all experimental and control specimens using the DC Protein Assay (Bio-Rad Laboratories, Hercules, CA) as previously described [27,28]. Protein concentration standards were prepared using six serial dilutions of 2 mg/mL bovine serum albumin. Five μL CSF samples were mixed in a standard 96-well microplate with 25 μL of reagent A (1–5% NaOH) and 200 μL of Reagent B (Folin reagent) and mixed for 15 min on a plate agitator. Next, the microplate was read at 690 nm using a Finstruments Multiskan model MCC340 (MTX Lab Instruments, Vienna, VA) microplate reader. A standard curve was prepared using absorbance data from BSA dilutions, from which a 3rd-order polynomial equation was identified. This was then used to calculate experimental protein concentrations.
2.4. Sample preparation
All specimens underwent albumin and immunoglobulin depletion using the Calbiochem ProteoExtract Albumin/IgG Removal kit (Cat. # 122642). Remaining samples were then analyzed using the BCA assay (Pierce Chemical, Rockford, IL) to determine total protein concentration as previously reported [29]. All samples were subsequently subjected to TCA precipitation, with product dissolved to 1 mg/mL in 1:1 diluted SDS boiling buffer:urea sample buffer.
2.5. Two-dimensional electrophoresis
Two-dimensional gel electrophoresis (2D GE) was performed using the carrier ampholine method of isoelectric focusing [30,31] developed by Kendrick Labs, Inc. (Madison, WI). Isoelectric focusing was carried out in a glass tube of inner diameter 3.3 mm using 2% pH 4–8 mix Servalytes (Serva, Heidelberg Germany) for 20,000 V h. An aliquot of 100 ng of an IEF internal standard, tropomyosin, was added to the sample. This protein migrates as a doublet with a lower polypeptide spot of MW 33,000 and pI 5.2; an arrow on the stained gel marks its position. The enclosed tube gel pH gradient plot for this set of ampholines was determined with a surface pH electrode.
After equilibration for 10 min in Buffer’O’ (10% glycerol, 50 mM dithiothreitol, 2.3% SDS and 0.0625 M Tris, pH 6.8), each tube gel was sealed to the top of a stacking gel that overlaid a 10% acrylamide slab gel (1.00 mm thick). SDS slab gel electrophoresis was carried out for about 5 h at 25 mA/gel. The following proteins (Sigma Chemical Co., St. Louis, MO) were used as molecular weight (MW) standards: myosin (220,000), phosphorylase A (94,000), catalase (60,000), actin (43,000), carbonic anhydrase (29,000), and lysozyme (14,000). These standards appear along the basic edge of the silver-stained [32] 10% acrylamide slab gel. The silver stained gels were dried between sheets of cellophane with the acid edge to the left.
2.6. Computerized comparisons
Duplicate gels were obtained from each sample and were scanned with a laser densitometer (Model PDSI, Molecular Dynamics Inc., Sunnyvale, CA). The scanner was checked for linearity prior to scanning with a calibrated Neutral Density Filter Set (Melles Griot, Irvine, CA). The images were analyzed using Progenesis Same Spots software (version 4.0, 2010, Nonlinear Dynamics) and Progenesis PG240 software (version 2006, Nonlinear Dynamics, Durham, NC). The general method of computerized analysis for these pairs included image warping followed by spot finding, background subtraction (average on boundary), matching, and quantification in conjunction with detailed manual checking.
Spot percentage is equal to spot integrated density above background (volume) expressed as a percentage of total density above background of all spots measured. Increase or decrease in expression among specimens as compared to control samples was defined in terms of fold change of spot percentages. Spot percentages found to be identical between experimental and control specimens were designated to have a fold change of 1.0, while those twice or thrice as large were assigned values of 2.0 and 3.0, respectively. If the experimental spot percentage had a value half as large, the difference was displayed as - 2.0, indicating a 2-fold downregulation.
3. Matrix-Assisted laser desorption/ionization-mass spectrometry (MALDI-MS)
3.1. In-gel digestion of proteins
Polypeptide spots found to show consistent expression change across TBI or SAH specimens as compared to those of control were manually excised from the 2D gel and prepared for MALDI-MS. Gel spots were transferred to clean tubes and completely hydrated with water. The plastic coating was subsequently removed with clean tweezers. Gel spots were then prepared for digestion by washing twice with 100 uL 0.05 M Tris, pH 8.5/30% acetonitrile for 20 min with shaking, then with 100% acetonitrile for 1–2 min After removing the washes, the gel pieces were dried for 30 min in a Speed-Vac concentrator.
Gels were digested by adding 0.08 g modified trypsin (sequencing grade, Roche Molecular Biochemicals) in 13–15 uL 0.025 M Tris, pH 8.5. The tubes were placed in a heating block at 32 °C and left overnight. Peptides were then extracted twice with 50 uL 50% acetonitrile/2% TFA, combined, and dried.
3.2. MALDI-MS analysis
The dried digest was dissolved in 3 μL matrix/standard solution, prepared by creating a 10 mg/mL solution of 4-hydroxy-α-cyanocinnamic acid in 50% acetonitrile/0.1% TFA and adding angiotensin and ACTH 7–38 peptide as internal standards. An aliquot of 0.5 L was spotted onto the sample plate, dried completely, and then twice washed with water.
MALDI analysis was performed on an electrospray quadrupole time-of-flight (Q-TOF) LC/MS/MS mass spectrometer with an in-line nanoflow LC (Micromass Q-TOF™; Waters Corporation, Mil-ford, MA, USA). Resulting mass spectrometry and MS/MS data were processed and viewed using the MassLynx 4.0 software.
3.3. Peptide mass search
Peptide masses were entered into search programs to search the NCBI and/or GenPept databases for a protein match. Parameters for web-based search using Mascot (www.matrixscience.com) were as follows: database: SwissProt; taxonomy: human; variable modifications: oxidation (M), propionamide (C); enzyme: trypsin; missed cleavages: 2; peptide tolerance (average): 0.5 Da Parameters for web-based search using MS-FIT (http://prospector.ucsf.edu/prospector/mshome.htm) were as follows: database: SwissProt; taxonomy: human; constant mods: propionamide (C); possible mods: oxidation of M; tolerance: 0.5 Da; minimum # of peptides to match: 4.
Cysteine residues were modified by acrylamide. Error tolerance was set at 0.5 Da for average masses.
3.4. Statistical analysis
Spot percentage differences were calculated for each polypeptide spot using the Wilcoxon rank sum or two-sample Student’s t-test to identify p values for statistical significance. Spot percentage difference values were considered significant if all experimental samples showed a fold increase or decrease of ≥1.7 with a p value <0.05. Fisher’s exact test was used to compare mean fold change among groups.
4. Results
Eight hundred fifteen separately identifiable polypeptide migration spots were identified on all 2D GE gels (Fig. 1). Seventy five polypeptide spots showed a consistent (>3-fold) increase in expression across all samples as compared to controls, while 73 polypeptides showed a similar decrease in expression. From these, a subset of spots showing spot fold increase or decrease greater than five-fold were considered for protein identification using MALDI-MS. This group included 24 spots demonstrating a mean increase and 23 demonstrating a mean decrease. Using the MW and isoelec tric point of each point, and referencing the UniProt Knowledgebase (Swiss-Prot and TrEMBL) databases, 22 separate spots were chosen for analysis. Of these, 10 specimens showed upregulation and 12 showed downregulation.
Fig. 1.
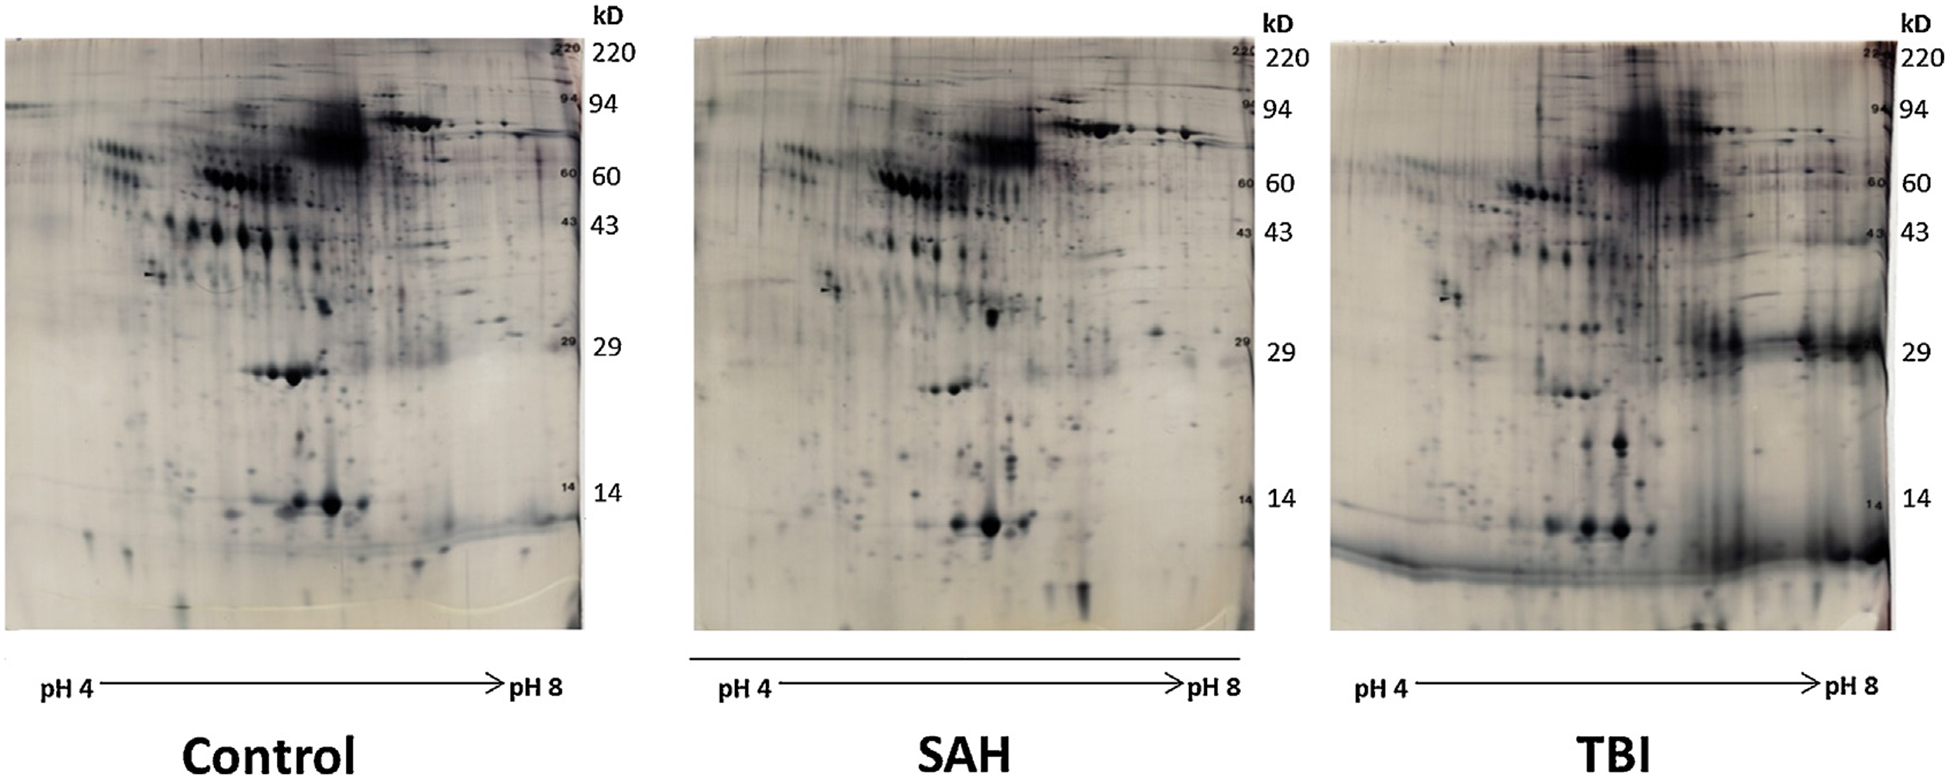
2D gels of control, SAH, and TBI samples.
Representative 2D gels of control (upper left), subarachnoid hemorrhage (SAH, upper right), and traumatic brain injury (TBI, lower right) samples of human CSF. Vertical axis is MW, Horizontal axis is pI (acidic→basic, left→right).
4.1. 2D GE demonstrates significant CSF protein concentration change from control
The 10 spots showing consistent increase change included numbers 146, 410, 529, 557, 608, 673, 758, 767, 772, and 773. Individual spot percentages and fold change data are shown in Fig. 1 and are analyzed in Table 1. The 12 spots demonstrating consistent decrease included numbers 54, 160, 200, 208, 663, 683, 694, 697, 698, 705, 709, and 732. Individual spot percentages and fold change data are included in Table 2. Mean protein concentration was 1.512 mg/mL for SAH samples and 1.554 mg/mL for TBI samples with no significant differences noted between sample groups (p = 0.886). Both SAH and TBI groups were noted to have statistically significant increases in total protein expression as compared to that of controls (p = 0.011 and 0.049, respectively). Protein concentration data for all samples has been included in Table 3.
Table 1.
Polypeptide spots are identified by their spot number, pI, and molecular weight (MW).
| Spot # | pI | MW | Control Spot % | 214 Spot % | Fold change | p | 216 Spots % | Fold change | p | 218 Spots % | Fold change | p | 302 Spot % | Fold change | p | 306 Spot % | Fold change | p | T1 Spot% | Fold change | p |
|---|---|---|---|---|---|---|---|---|---|---|---|---|---|---|---|---|---|---|---|---|---|
| 146 | 7.0 | 76,929 | 0.036 | 0.340 | 9.5 | 0.000 | 0.326 | 9.1 | 0.000 | 0.064 | 1.8 | 0.256 | 0.098 | 2.7 | 0.023 | 0.153 | 4.3 | 0.016 | 0.408 | 11.4 | 0.001 |
| 410 | 6.4 | 50,868 | 0.018 | 0.268 | 14.9 | 0.000 | 0.045 | 2.5 | 0.016 | 0.269 | 15.0 | 0.083 | 0.079 | 4.4 | 0.002 | 0.316 | 17.6 | 0.000 | 0.071 | 4.0 | 0.024 |
| 529 | 7.2 | 32,115 | 0.024 | 0.365 | 14.9 | 0.052 | 0.260 | 10.6 | 0.000 | 0.672 | 27.5 | 0.054 | 1.316 | 53.8 | 0.022 | 1.564 | 64.0 | 0.017 | 0.332 | 13.6 | 0.000 |
| 557 | 7.2 | 30,082 | 0.083 | 0.159 | 1.9 | 0.005 | 0.153 | 1.8 | 0.005 | 0.343 | 4.1 | 0.000 | 0.285 | 3.4 | 0.000 | 0.177 | 2.1 | 0.002 | 0.183 | 2.2 | 0.001 |
| 608 | 5.7 | 27,133 | 0.031 | 0.161 | 5.1 | 0.000 | 0.122 | 3.9 | 0.001 | 0.171 | 5.4 | 0.157 | 0.165 | 5.3 | 0.000 | 0.150 | 4.8 | 0.000 | 0.086 | 2.7 | 0.002 |
| 673 | 6.2 | 23,062 | 0.035 | 0.373 | 10.5 | 0.051 | 0.107 | 3.0 | 0.000 | 0.636 | 18.0 | 0.026 | 1.501 | 42.4 | 0.017 | 1.424 | 40.2 | 0.000 | 0.096 | 2.7 | 0.001 |
| 758 | 5.9 | 15,995 | 0.060 | 0.156 | 2.6 | 0.014 | 0.767 | 12.9 | 0.139 | 0.042 | −1.4 | 0.467 | 0.216 | 3.6 | 0.002 | 0.021 | −2.8 | 0.152 | 1.003 | 16.8 | 0.000 |
| 767 | 7.3 | 14,820 | 0.079 | 0.582 | 7.4 | 0.001 | 0.519 | 6.6 | 0.000 | 1.484 | 18.9 | 0.000 | 2.013 | 25.6 | 0.000 | 0.888 | 11.3 | 0.304 | 0.500 | 6.4 | 0.000 |
| 772 | 6.6 | 13,856 | 0.007 | 0.016 | 2.3 | 0.028 | 0.021 | 2.9 | 0.008 | 0.100 | 14.0 | 0.000 | 0.053 | 7.4 | 0.148 | 0.054 | 7.6 | 0.143 | 0.020 | 2.8 | 0.015 |
| 773 | 6.8 | 13,856 | 0.047 | 0.432 | 9.1 | 0.000 | 0.388 | 8.2 | 0.000 | 0.316 | 6.7 | 0.001 | 0.796 | 16.8 | 0.136 | 1.165 | 24.6 | 0.000 | 0.455 | 9.6 | 0.000 |
Spot percentage differences are calculated from spot percentages of specimen compared to control (individual spot density divided by total density of all measured spots). Spot percentage increase or decrease of ≥1.7 with p value <0.05 was considered significant.
Table 2.
Polypeptide spots are identified by their spot number, pI and molecular weight (MW).
| Spot # | pI | MW | Control Spot % | 214 Spot % | Fold change | p | 216 Spot % | Fold change | p | 218 Spot % | Fold change | p | 302 Spot % | Fold change | p | 306 Spots % | Fold change | p | T1 Spot% | Fold change | p |
|---|---|---|---|---|---|---|---|---|---|---|---|---|---|---|---|---|---|---|---|---|---|
| 54 | 7.2 | 92,116 | 0.048 | 0.007 | −6.8 | 0.000 | 0.005 | −10.1 | 0.000 | 0.012 | −4.1 | 0.170 | 0.003 | −15.9 | 0.000 | 0.005 | −8.8 | 0.000 | 0.008 | −6.3 | 0.000 |
| 160 | 4.9 | 64,625 | 0.033 | 0.017 | −1.9 | 0.045 | 0.010 | −3.3 | 0.012 | 0.004 | −7.9 | 0.006 | 0.006 | −5.4 | 0.007 | 0.005 | −7.1 | 0.004 | 0.008 | −3.9 | 0.010 |
| 200 | 6.0 | 63,958 | 0.089 | 0.012 | 7.4 | 0.005 | 0.016 | 5.7 | 0.007 | 0.003 | 25.9 | 0.004 | 0.002 | 57.1 | 0.003 | 0.002 | 41.9 | 0.003 | 0.014 | 6.6 | 0.006 |
| 208 | 6.3 | 66,651 | 0.329 | 0.072 | −4.5 | 0.000 | 0.084 | −3.9 | 0.000 | 0.168 | −2.0 | 0.019 | 0.111 | −3.0 | 0.001 | 0.100 | −3.3 | 0.001 | 0.140 | −2.3 | 0.004 |
| 663 | 6.7 | 23,604 | 0.137 | 0.011 | −13.0 | 0.005 | 0.013 | −10.5 | 0.009 | 0.065 | −2.1 | 0.052 | 0.021 | −6.5 | 0.011 | 0.016 | −8.7 | 0.010 | 0.015 | −9.1 | 0.009 |
| 683 | 6.3 | 22,172 | 0.128 | 0.099 | −1.3 | 0.062 | 0.040 | 3.2 | 0.000 | 0.067 | −1.9 | 0.003 | 0.004 | 29.8 | 0.000 | 0.008 | 15.8 | 0.000 | 0.044 | 2.9 | 0.001 |
| 694 | 6.6 | 21,478 | 0.194 | 0.478 | 2.5 | 0.010 | 0.005 | 38.3 | 0.018 | 0.016 | 12.5 | 0.042 | 0.021 | 9.0 | 0.046 | 0.050 | 3.9 | 0.078 | 0.007 | 26.2 | 0.037 |
| 697 | 6.3 | 21,413 | 0.622 | 0.964 | 1.5 | 0.109 | 0.012 | −52.3 | 0.012 | 0.039 | −15.8 | 0.013 | 0.011 | −54.9 | 0.012 | 0.013 | −48.9 | 0.012 | 0.013 | −46.3 | 0.012 |
| 698 | 6.1 | 21,175 | 0.286 | 0.370 | 1.3 | 0.535 | 0.008 | 37.0 | 0.044 | 0.008 | 37.8 | 0.044 | 0.034 | 8.4 | 0.112 | 0.007 | 39.9 | 0.043 | 0.005 | 60.0 | 0.043 |
| 705 | 6.3 | 20,741 | 0.285 | 0.521 | 1.8 | 0.046 | 0.005 | 54.4 | 0.015 | 0.026 | 10.8 | 0.035 | 0.038 | −7.5 | 0.040 | 0.045 | 6.4 | 0.022 | 0.005 | 53.4 | 0.015 |
| 709 | 5.4 | 20,549 | 0.059 | 0.015 | −3.9 | 0.047 | 0.008 | −7.2 | 0.030 | 0.089 | 1.5 | 0.131 | 0.005 | −12.0 | 0.024 | 0.005 | −11.5 | 0.025 | 0.005 | −11.4 | 0.013 |
| 732 | 5.1 | 17,535 | 0.049 | 0.002 | −30.6 | 0.003 | 0.006 | −8.3 | 0.005 | 0.081 | 1.7 | 0.015 | 0.005 | −9.5 | 0.004 | 0.008 | −6.1 | 0.006 | 0.003 | −16.2 | 0.004 |
Spot percentage differences are calculated from spot percentages of specimen compared to control (individual spot density divided by total density of all measured spots). Spot percentage increase or decrease of ≥1.7 with p value <0.05 was considered significant.
Table 3.
Total protein concentration calculated for all experimental samples using the Bio-Rad DC Protein Assay.
| Sample | Protein concentration (mg/mL) | Mean | Difference from control | P |
|---|---|---|---|---|
| 214 | 1.690 | 1.512 | 0.987 | 0.011 |
| 216 | 1.263 | |||
| 218 | 1.582 | |||
| 302 | 1.115 | 1.554 | 1.029 | 0.049 |
| 306 | 1.587 | |||
| T1 | 1.959 | |||
| 7 | 0.606 | 0.524 | ||
| 8 | 0.443 |
4.2. MALDI-MS identification of polypeptides significantly changed from control
Mass spectrometry successfully identified 13 of 22 2D GE spots as recognizable polypeptides. The remaining nine spots were either obscured by keratin contamination (six samples), generated unidentifiable spectra (two samples), or failed to reach minimum protein concentration thresholds (one sample). Spots and their identities can be seen in Table 4. Spots in the 60–70 kD range are often contaminated with exogenous keratins as was seen in spots 160, 200, 683, 146, 758, and 709. MALDI-MS typically generates identifiable spectra in about 70–80% of the 2D GE spots analyzed. Failure is likely to be due to lower total protein concentrations or proteins of MW <20,000 or >100,000.
Table 4.
Proteins identified following trypsin digestion and analysis by MALDI-TOF (nm = no significant match with Mascot search).
| Spot | Protein identified | Accession # | % Sequence coverage | Peptides | Unmatched peaks | MS-Fit MOWSE score | Mascot score | Expect value |
|---|---|---|---|---|---|---|---|---|
| 54 | Serotransferrin | P02787 | 18.5 | 12 | 6 | 4.93E+05 | 101 | 1.60E–06 |
| 410 | Fibrinogen beta chain | P02675 | 42.6 | 25 | 3 | 5.52E+13 | 209 | 2.50E–17 |
| 529 | Carbonic anhydrase 1 | P00915 | 62.5 | 14 | 7 | 2.86E+08 | 168 | 3.20E–13 |
| 673 | Peroxiredoxin-2 | P32119 | 35.9 | 7 | 7 | 9.40E+03 | 89 | 2.70E–05 |
| 694 | Haptoglobin | P61764 | 18.0 | 6 | 4 | 2.67E+01 | 57 | 3.90E–02 |
| 697 | Haptoglobin | P61764 | 21.0 | 5 | 4 | 7.13E+00 | 49 | 0.27 |
| 698 | Haptoglobin | P61764 | 17.5 | 4 | 3 | 4.25E+00 | nm | |
| 705 | Haptoglobin | P61764 | 7.0 | 5 | 6 | 3.60E+00 | nm | |
| 767 | Hemoglobin subunit beta | P68871 | 89.0 | 13 | 5 | 3.38E+07 | 169 | 1.60E–18 |
| Hemoglobin subunit alpha | P69905 | 77.0 | 7 | 5 | 9.49E+02 | 80 | 2.00E–04 | |
| 772 | Hemoglobin subunit beta | P68871 | 53.7 | 7 | 5 | 9.81E+04 | 85 | 5.80E–05 |
| 773 | Hemoglobin subunit beta | P68871 | 96.0 | 17 | 2 | 6.62E+08 | 284 | 8.10E–25 |
Statistically significant increases were noted in expression of fibrinogen (β chain), carbonic anhydrase-1, peroxiredoxin-2, and both α and β chains of hemoglobin in TBI and SAH specimens, as compared to expression in controls (p = 0.00002–0.02176) (Table 1). Polypeptides identified that consistently decreased among experimental samples included serotransferrin, serum albumin, and N-terminal haptoglobin (p = 0.00003–0.04649) (Table 2). The greatest mean fold change among all specimens was seen in CA-I and Hp at 30.7 and −25.7, respectively. Comparison of SAH with TBI specimens showed a trend toward greater mean increases in CA-I and Prx-2 in TBI patients (43.8 vs. 17.7 and 28.4 vs. 10.5), although this failed to reach statistical significance (p = 0.1377 and 0.2164). Similarly, Hp and serotransferrin means trended toward greater fold change in TBI samples (−30.4 vs. −21.0 and −10.3 vs. −7.0), with p values of 0.3062 and 0.3443, respectively (Table 5).
Table 5.
Comparison of fold change values in selected biomarkers for SAH and TBI specimens with comparison of means by two-tailed Student’s t-test.
| Fold change (compared to control) Mean | Median | SAH Mean | TB1 Mean | P | |
|---|---|---|---|---|---|
| Carbonic anhydrase 1 | 30.73 | 21.21 | 17.69 | 43.78 | 0.138 |
| Peroxiredoxin-2 | 19.47 | 14.24 | 10.50 | 28.44 | 0.216 |
| α/β Hemoglobin | 8.48 | 7.02 | 6.99 | 9.97 | 0.231 |
| Fibrinogen | 9.73 | 9.66 | 10.81 | 8.65 | 0.744 |
| Serum albumin | −3.17 | −3.13 | −3.48 | −2.87 | 0.500 |
| Serotransferrin | −8.65 | −7.80 | −6.96 | −10.34 | 0.344 |
| Haptoglobin | −25.68 | −11.61 | −20.96 | −30.40 | 0.306 |
5. Discussion
Seventy percent of CSF production has been identified to occur at the choroid epithelium; however, it is the remaining fraction that has proven most clinically relevant. Building upon the seminal work of Curl and Pollay [33] and Rosenberg et al. [34], several investigators have used CSF composition as an effective surrogate for the pathological state of the central nervous system (CNS). Based upon the assumption that up to 30% of CSF is derived from fluid in direct contact with brain parenchyma, the protein composition of CSF has been successfully used to investigate a variety of neurodegenerative disorders [35]. Much of the early work used radioimmunological assays and focused on demyelinating diseases. This effort culminated in the discovery of myelin basic protein and establishment of its clinical use in the diagnosis of MS [36]; similar investigations also led to the discovery of proteins such as S-100 [37] and glial fibrillary acidic protein (GFAP) [38].
Combining advancements in gel electrophoresis and mass spectrometry, multiple investigators have used proteomics to identify hundreds of potential markers in human CSF in diseases as diverse as Guillain-Barré syndrome (GBS) [10,39], CNS malignancies [40], traumatic brain injury (TBI) [4], idiopathic intracranial hypertension [5], Alzheimer’s disease [7,9,12], schizophrenia [8,9], trigeminal neuralgia [3], childhood-onset ataxia and CNS hypomyelination (CACH)/vanishing white matter disease (VWM) [41], Huntington’s disease [42], and cerebral infarction [1,3]. By applying this approach to CSF sampled from TBI/SAH patients, we endeavored to identify specific markers of injury, by identifying proteins either significantly increased following injury or, conversely, significantly consumed. Previous investigators have suggested several proteins that specifically increased [4,43–48] or decreased [49] in TBI; however, rather than limiting our search to previously identified markers, we chose our putative targets solely on the basis of consistent fold change in intensity compared to controls across all samples on 2D GE.
We would categorize the markers identified here into one of two general categories. The first category comprises plasma proteins, the leakage of which has been previously demonstrated to be indicative of disruption of the blood-brain barrier [10,50,51]. The second category includes endogenous antioxidant proteins involved in regulating intra- and extracellular oxidative damage. Subtle alterations in these markers may have significant impact on the degree of secondary injury following the primary insult. The processes of neuroinflammation, microvascular damage, excitatory neurotransmitter generation, and reactive oxygen species have all been implicated in this pathogenesis [47,52–56].
6. Polypeptides increased following TBI/SAH
6.1. Carbonic anhydrase I
Carbonic anhydrase I (CA-I) is one of seven distinct isoenzymes identified in mammalian species responsible for catalyzing the reversible hydration of carbon dioxide. This 29 kDa molecule was first isolated from human erythrocytes in 1961 when it was referred to as CA B and known as the isoform with lower enzymatic activity, present in higher concentration [57]. It represents the second-most abundant protein present in red blood cells, at concentrations 0.38% that of hemoglobin [58]. CA-II, although over ten times more active, constitutes only 10% of the total CA complement [58,59]. Subsequent study has identified CA-I in the cytosol of epithelial tissues throughout the body, including those of the large intestine, cornea, lens, ciliary body, sweat and adrenal glands, as well as within neutrophils [3,57,60].
CA-I is encoded on chromosome 8q22 with CA-II and III; although its deficiency has been identified in several populations, no known clinical deficits have been identified. In contrast, CA-II deficiency has been shown to cause osteopetrosis, renal tubular acidosis, and brain calcification. [57] Until very recently, CA-I was believed to be excluded from the CNS; however, a recent study of pediatric epileptic foci has identified positive immunoreactivity within astrocytic cytoplasmic inclusions as well as within control astrocytes [61]. CA-II is considered the most widely distributed isoform within the CNS, with immunohisto-chemical studies identifying its presence in tumors originating from astrocytes, oligodendroglia, ependyma, choroid plexus, and nerve sheath cells [40]. CA-III and CA-IV are expressed in choroid plexus epithelium and neurovascular endothelium, respectively, but in far lower concentrations. In choroid epithelium, CA-II (and to a significantly lesser degree, CA-III) functions to promote HCO3− secretion into CSF, whereas in oligodendrocytes, it has been purported to be essential in providing the HCO3− required for fatty acid synthesis [40,62].
CA-I was recognized in our sample as the marker with the greatest mean fold change of 30.73 (median 21.2, range 14.9–64.0) in all samples, with TBI samples demonstrating a positive trend toward greater mean increases (17.69 vs. 43.78; p = 0.1377). Significant increases have been demonstrated in CSF expression of the CA-II isozyme in diseases as varied as MS, trigeminal neuralgia, CNS infection, and certain forms of dementia; however, our discovery of CA-I upregulation appears to be relatively unique [3,60]. The limited data available places its expression predominantly within white matter astrocytes and finds its increased expression associated with a subset of early-onset pediatric epilepsy [61]. This is further supported by the discovery of several efficacious anticonvulsants also demonstrated to be potent CA-Inhibitors [63].
As a prominent component of erythrocyte cytoplasm, CA-I identification within CSF following cerebral hemorrhage is not entirely surprising. What is more intriguing, however, is the statistical similarity demonstrated between experimental groups in this investigation. The finding of CA-I in equivalent or even increased quantities (17.69 vs. 43.78) in TBI patients as compared to those in SAH patients has several potential explanations. First, the most abundant and likely potential source of CA-I in TBI is from leakage across an incompetent BBB. This may occur in several ways. Direct leakage of blood from capillary damage is known to occur in the more severe forms of TBI; however, it is unlikely, as a single source, to approach the volume produced by a ruptured intracranial aneurysm. Equally plausible and supported by previous investigation is the leakage of circulating CA-I across a BBB damaged by inflammatory cytokines triggered by traumatic injury [47,52,64]. In fact, there is some evidence that extracellular CA-I released by intracerebral hemorrhage can independently exacerbate BBB disruption and that direct injection of CA inhibitors has been shown to attenuate this effect [65,66].
CA-I elevation within our TBI cohort may also be a reflection of a differential mechanism of injury. In SAH, brain tissue injury is typically localized to the immediate vicinity of the aneurysmal rupture and markers of injury would be expected from astrocytic, neuronal, and oligodendroglial damage. However, TBI is well established both radiographically and clinically to result from a more global, shearing injury to the white matter tracts. As CA-I expression has been demonstrated most positively within white matter astrocytes, a substantially elevated level might be expected in patients suffering this type of injury.
Some have suggested, based on recent experiments with intentional whole blood addition to CSF prior to proteomic investigation, that the presence of CA-I may indicate blood contamination of samples [67]. These authors admit that hemoglobin is, by far, the most sensitive marker, and in cases of contamination should be present on the order of 10–20 times the concentration of that of CA-I; however, these experiments were performed on nonpathological CSF from healthy volunteers and have questionable applicability to SAH and TBI investigations. Our results indicate that CA-I and hemoglobin were both elevated in TBI samples, but in the opposite proportions suggested for contamination (43.78 vs. 9.97). Similarly, whole blood contamination of samples would be expected to substantially increase the total protein content of samples, owing to the addition of plasma proteins; however, no difference could be identified in mean protein content of SAH and TBI samples (1.51 vs. 1.55 mg/mL; p = 0.8863).
6.2. Peroxiredoxin-2
Peroxiredoxin-2 (Prx-2) is a 198 amino acid enzyme encoded on chromosome 13q that functions to reduce a variety of intra- and extracellular organic peroxides [68]. It is a member of a family of six (Prx-1–6) similarly functioning enzymes, differing only in the mechanism by which they are returned to their active state [68–70], the homology of which has only recently been recognized. Prior to the mid-1990s, multiple members of the Prx family had been independently identified and investigated in multiple species, and as such had been previously classified under a number of alternative names, including thioredoxin peroxidase (Tpx), thiol-specific antioxidant (TSA), natural killer enhancing factor (NKEF), and protector protein (PRP) [71–76].
Prx isoforms are present within the majority of human cell types at risk for oxidative damage secondary to endogenously generated peroxides and have demonstrated up- or downregulation based upon anatomical location [77]. Differential expression of the major subtypes has been demonstrated within the CNS, with Prx-2, −3, −4, and −5 consistently localizing to neuronal cell types, while Prx-1 and 6 isoforms present predominantly in glial cells [71,78–81]. Prx-2 also appears to favor the larger cortical neurons with smaller interneurons evidencing minimal expression. Many investigators have speculated whether this differential expression may explain the selective vulnerability of these cells to damage during periods of oxidative stress [71,80]. Similarly, differential expression of Prx isoforms has been suggested in a variety of neurodegenerative disorders [82,83].
Reactive oxygen species (ROS) and free radicals have been strongly implicated in the pathogenesis of a variety of neurodegenerative disorders [71,84–86], including multiple sclerosis [87] Alzheimer’s disease [88–93], Parkinson’s disease [94], amyotrophic lateral sclerosis [95–97], TBI [98,99], ischemia/reperfusion [99,100], and epilepsy [101]. Generation of ROS within the CNS is common in situations of local or regional hypoxia; however, it has also been demonstrated secondary to mitochondrial electron leakage or Fenton chemistry surrounding heavy metal ions within Hb and certain neurotransmitters (e.g., norepinephrine, dopamine) [84], [102]. Multiple intra- and extracellular systems of antioxidant defense exist within the brain to combat ROS, including the superoxide dismutases, catalase, glutathione peroxidase, and the Prx family. When these systems become overwhelmed, the accumulation of toxic levels of nitric oxide, superoxide, and hydroxyl radicals creates the potential for oxidative damage to cellular components, potentially leading to cell death or apoptosis. In the case of Parkinson’s disease, direct inhibition of Prx-2 function has been linked to the intracellular accumulation of ROS and subsequent cell death within the dopaminegic neurons of the substantia nigra [103,104].
Despite the deleterious effects attributed to ROS, critical roles have been identified for several of these pro-oxidants in the regulation of cell proliferation, differentiation, and intracellular signaling [78,105–107]. Intracellular hydrogen peroxide levels, for example, have been shown to regulate the activity of NF-κB, a transcription factor critical in activating the cellular response to a variety of stresses, as well as protein kinases involved in signal transduction [71,103,108,109] Over oxidation of the available supply of Prx-2 by increasing levels of hydrogen peroxide has been shown to lead to activation of apoptotic signaling cascades and eventual cell death [69,110,111]. The ratio of oxidized (inactivated) Prx-2 to non-oxidized enzyme is believed to represent the mechanism by which intracellular peroxides exhibit their regulatory functions [68,110–112].
Our results indicate a Prx-2 mean fold change of 19.47 in all SAH and TBI samples with a positive trend toward greater mean increases in TBI samples (28.44 vs. 10.50; p = 0.2164). The similarities demonstrated here lead to several hypotheses regarding the origin of this upregulation. First, in situations involving the widespread lysis of erythrocytes, as occurs with SAH, it would not be surprising to see an increase in Prx-2, as it represents the third most abundant cytosolic protein in these cells [113]. However, even the most severe grade of TBI is only associated with microscopic hemorrhages, usually localized within the deep white matter, which is certainly not sufficient to explain a statistical equivalence (or potential increase) in expression. If peripheral sources are to be excluded, we must assume that the increased CSF presence of Prx-2 must result from either increased de novo production in response to oxidative demand and subsequent shedding into the interstitial space, or alternatively, damage and lysis of cells containing large antioxidant stores with subsequent spilling into the surrounding milieu.
ROS have been shown to play a critical role in the evolving pathology of both SAH and TBI, with increasing levels associated with worsening injury [114–118]. Experimental overexpression of Prx-2 has shown increased protection from oxidative damage in cultured neurons [119], while genetic loss has been demonstrated to increase oxidative damage in the CA1 layer of the hippocampus in mice [78]. Inhibition of Prx-2 and its regulation of Jun N-terminal kinase (JNK)-dependent DNA repair has been shown to trigger hydrogen peroxide-directed apoptosis in glioma cells [120,121]. Human postmortem studies have identified an adaptive Prx-2 upregulation within the frontal cortex of patients with Down syndrome, Alzheimer’s and Parkinson’s diseases, believed to represent a compensatory response to the enhanced apoptotic signaling characteristic of these disorders [82]. A similar increase in SAH/TBI patients would surely be reflected in increased interstitial levels sampled in a random CSF sample.
Neuroglial damage occurs both in an immediate as well as a delayed fashion following SAH and TBI [122,123]. Proteomic comparison of ante- and postmortem CSF has been used to identify potential biomarkers of cell death within the brain and it is not surprising that significant increases have been demonstrated in Prx-2 expression [1,124]. As Prx-2 has been consistently localized to large cortical neurons, it seems feasible to use its increased expression in CSF as a potential marker of specifically neuronal damage.
6.3. Hemoglobin
Hemoglobin (Hb) is 64,500 Da tetramer consisting of two α and two β subunits, each consisting of a globular peptide in close association with a porphyrin ring containing a single iron ion. Its synthesis occurs mainly during erythrocyte maturation from pluripotent precursors within the bone marrow, as mature red blood cells lack the nuclear machinery for transcription.
While bone marrow has been long believed to be the only source of Hb in the body, recent studies have identified its transcription in cell types far removed from the blood, including macrophages [125], pulmonary epithelial cells [126], cells of the lens [127], and in the pituitary gland [128].
The lifespan of a circulating erythrocyte is 120 days, with the majority of Hb recycling taking place within the reticuloendothelial system with little release of free Hb into plasma. Intravascular hemolysis results in dissociation of the Hb tetramer into αβ dimers, which, under physiologic conditions, is immediately complexed with circulating haptoglobin (Hp) and cleared by the liver. Free Hb in plasma is susceptible to either oxidation to methemoglobin and subsequent clearance or, alternatively, proteolytic degradation by circulating proteases to release members of the peptide family known as hemorphins [129]. Subsequent study has identified significant activity for these peptides in analgesia, systemic vasodilatation, endocrine modulation, memory potentiation, and general homeostasis.
Hb is typically excluded from the CNS based upon its large size; its presence in CSF is generally considered secondary to focal bleeding or a compromise of the BBB. Some have suggested that Hb in CSF samples not associated with cerebral hemorrhage may indicate sample contamination, resulting in its specious use as a neurodegenerative disease biomarker [67,130]. Despite this, several well controlled investigations have described Hb, or Hb peptide fragments, as markers of disease severity in Parkinson’s and Alzheimer’s diseases [131,132], preeclampsia [133], lumbar disc herniation [134], and pediatric brain tumors [135].
Our results indicate an average 8.48-fold positive change in Hb in all samples with statistically similar values among SAH and TBI samples (6.99 vs. 9.97; p = 0.2314). In terms of these two conditions, loss of vascular integrity and the direct exchange of Hb into the subarachnoid and interstitial spaces is well established and may potentially explain these findings; recent evidence also supports additional potential sources for Hb and Hb functions within the CNS. For example, Richter et al. and Biagioli et al. independently demonstrated the de novo transcription of α and β Hb chains in multiple types of animal and human neurons [136,137]. Immunohistochemical studies also suggest Hb expression in cortical and hippocampal astrocytes as well as in mature oligodendrocytes [137]. Hb α and β monomers may function as a homeostatic depot for oxygen, which could protect neurons during periods of hypoxia, while also serving as a scavenger of ‘gasotransmitters’, e.g., CO and NO·, a theory that is supported by studies of Hb allosteric interactions [138–140]. Neurons also express important Hb-regulatory molecules such as hypoxia-inducible factor 1 (HIF1α), erythropoietin, and the erythropoietin receptor, suggesting that they may be capable of altering intracellular Hb levels in a fashion similar to that of erythrocyte progenitors [136,141,142].
The release of Hb, either by excretion or leakage from parenchymal cells or directly from the plasma, is typically cleared from the CSF by the Hb scavenger, Hp, which takes place in the circulation with some interesting caveats. The inherent Hb binding capacity of the intrathecal space has been shown to be 50,000-fold lower than that of the peripheral circulation [143]. In cases of extensive intracerebral hemorrhage (such as that in SAH or spontaneous intraventricular hemorrhage), this system quickly becomes saturated, leaving significantly more free Hb available for degradation by proteases, yielding bioactive hemorphins. Hemorphin fragments have agonist activity at cerebral opioid and AT4 receptors, with diverse homeostatic and adaptive functions [129,136].
We found several α and β Hb fragments of varying lengths, including the 31–40 and 32–40 sequences, which are recognized as the bioactive variants of hemorphin-7; however, the tryptic digestion of samples prior to MALDI-MS analysis complicates specific confirmation of the molecular entities. Using a unique type of MS identification with liquid chromatography prior to MS that did not involve protease pretreatment, Desiderio et al. were able to consistently identify both the LVV- and VV-hemorphin-7 variants in pediatric CSF [135].
The presence of Hb in CSF from patients following SAH is anticipated, but the same cannot be said for patients with TBI. While microvascular damage and BBB disruption are hallmarks of TBI, one would not predict CSF expression of Hb equivalent to, or even greater than that found in SAH. While the 42.6% increased expression in our TBI samples (6.99 vs. 9.97) did not reach significance, the statistical similarity suggests a source of Hb that is similar and abundant in both cases, suggesting that the amount of Hb found in TBI is similar to that which could be provided by the large vessel arterial rupture typical of SAH pathophysiology. Excluding the mass contamination of all experimental samples with iatrogenically introduced erythrocytes (as will be addressed in the section ‘Limitations’), we believe that there are several potential (including non-vascular) sources for increased Hb. Focal microhemorrhages are a radiographic hallmark of more severe forms of TBI and certainly could contribute to some proportion of the Hb in our samples [144,145]. Leakage across a damaged BBB is likely to allow the passage of macromolecules present in the plasma into the CNS, and could include free Hb αβ dimers; however, given the extreme efficiency of the systemic Hp scavenger system, this seems unlikely to represent a major source. We theorize that a significant portion of Hb fragments identified in post-TBI CSF are likely to have also originated within neurons and oligodendrocytes primarily damaged by traumatic injury, or secondarily injured by ischemia, toxic neurotransmitter accumulation, or inflammatory responses.
6.4. Fibrinogen (β chain)
Fibrinogen is a 340 kDa dimeric glycoprotein consisting of identical monomers, each containing three distinct polypeptide chains, designated Aα, Bβ, and γ, linked by 29 disulfide bonds. Synthesized within the liver, it is considered an acute phase reactant, and represents the final substrate of the coagulation cascade. Following cleavage of fibrinopeptides A and B from the N-terminal regions of the Aα and Bβ chains by the serine protease thrombin, exposed polymerization sites bind activated coagulation factor XIII to form an insoluble fibrin clot.
As a ubiquitous plasma protein, fibrinogen is commonly deposited within the CNS following injury to the blood-brain barrier (BBB), where it has been implicated in multiple neurodegenerative processes. The effect of fibrin polymerization following leakage has been shown to lead to endothelial cell activation or leakage [146,147], release of pro-inflammatory cytokines and chemokines [148–150], activation of microglia and tissue macrophages [151–153], and direct inhibition of neurite outgrowth following axonal damage [154]. While it contributes to the pro-inflammatory state, it has been discovered that fibrinopeptide B can function independently as a leukocyte attractant [155]. Fibrinogen has also been recently discovered to act as a transport molecule for latent forms of other pro-inflammatory molecules, including transforming growth factor-β (TGF-β), a mechanism linked to the formation of glial scar tissue [156,157].
The fibrinolytic pathway serves as a check to over exuberant coagulation within the systemic circulation and has also been shown to have beneficial effects within the CNS. Plasminogen activators within damaged tissue activate the zymogen to form active plasmin, which functions in the localized degradation of insoluble fibrin clots. Disruption of this pathway has been demonstrated to contribute to the exaggeration of inflammatory damage in clinical and experimental models of MS [158–160]. Similarly, increased fibrinolytic activity has demonstrated beneficial effects in models of peripheral nerve regeneration [151] and inflammatory demyelination [161].
The release of fibrin degradation products (FDP) into the CSF has been used as a surrogate marker of disease activity in a number of neurologic disorders, including Alzheimer’s disease, Parkinson’s disease, GBS, TBI, and SAH [4,7,39,162,163]. Detection of increasing CSF levels of α and β chains has been positively correlated with severity of BBB damage [2]. In Alzheimer’s disease patients, increasing levels of the γ chain precursor in CSF has been positively correlated with increasing severity of disease, with the highest levels discovered in patients with end stage symptomatology [7]. However, in Parkinson’s disease, fibrinogen β chain isoforms have been found to show relatively decreased or unchanged expression in relation to controls [163–165]; and despite the strong correlation of extravasated fibrinogen to MS pathophysiology, elevation within CSF has not been consistently demonstrated [6,166].
Fibrinogen showed a mean 9.73-fold increase across all samples with statistically similar values among SAH and TBI samples (10.81 vs. 8.65), supporting a similar common pathway for both varieties of brain injury. The presence of FDP in CSF following SAH has been recognized for decades, where implications regarding clot stability and levels of fibrinolytic activity have received considerable attention. As early as 1973, Tovi et al. first proposed the clinical utility of serially monitoring CSF FDP levels to better predict the risk of aneurysmal re-rupture; subsequently, many investigators have supported this hypothesis [167–169]. Others have, however, failed to consistently demonstrate this relationship and have linked BBB damage with secondary leakage of FDP [170,171]. Elevated levels have also been positively associated with a greater risk of severe neurological deficits and vasospasm-associated cerebral ischemia [162,172].
The implications of similar fibrinogen upregulation in TBI and SAH samples are several. First, as a de novo source of fibrinogen within the CNS has yet to be identified, we must assume that its presence in experimental samples is secondary to direct leakage from the vasculature or incompetence of the BBB. Next, as vessel rupture is not pathognomonic of TBI, it is reasonable to surmise that, to demonstrate equivalence with SAH, the condition of the BBB must have been significantly altered in these samples. Conti et al. have previously demonstrated CSF fibrinogen β chain upregulation in a cohort of patients suffering severe TBI (Glasgow Coma Scale (GCS) < 7); however, they were unable to correlate concentration change with prognosis or final outcome [4]. Fibrinogen extravasation has been positively correlated with BBB incompetence in ischemic injury [173], Alzheimer’s disease [174], and obesity [5], as well as with TBI [50]. However, we are unaware of any previous studies demonstrating a degree of dysfunction equivalent to that seen with the vascular compromise of SAH.
7. Polypeptides decreased following TBI/SAH
7.1. Haptoglobin
Human haptoglobin (Hp) exists as a genetically diverse series of multiunit glycoprotein polymers consisting of variably repeated series of αβ subunits. Phenotypic variations are determined by the heritability of the 17 kDa α subunits, as the 40 kDa β subunits are identical in the most commonly expressed variations. The α-chain has two different isotypes (α1 and α [2]), both encoded on chromosome 16q. Population expression of the different α alleles is distributed widely among different ethnic groups [175–178]. Synthesis is primarily in the liver, with baseline levels in the range 0.4–1.5 mg/mL of plasma, although minor contributions have also been demonstrated from the spleen, lymph nodes, and thymus [179].
Hp polymers are assembled as α chain β chain heterodimers bound by a single disulfide bridge. While α subunits can subsequently bridge with other α subunits via additional disulfide bonds, β subunits cannot. Polymerization and overall length of polymers in Hp is thus determined by the ability of α subunits to multiply bind other α subunits, which includes both α variants. The α1 variant contains a single cysteine available for binding and polymerization, producing a single α12β2 polymer, referred to as ‘HP 1–1.’ The α2 variant has two cysteines available for bridging, increasing the potential for polymerization. Homozygous Hpα2 and heterozygous Hpα1α2 individuals form linear polymers with successively longer and longer chains that are terminated by either an α1 subunit or an end-to-end disulfide bridge, yielding a closed, cyclized protein. In Hp 2–2 individuals, the serum counterpart of Hp consists of a variable complement of trimers, tetramers, and longer chains of α2β. However, in Hp 2–1 individuals, α12β2 dimers and (α2β)n and (α1β) (α2β) polymers all exist in equilibrium controlled by the differential expression of the terminating chain, α [1].
Hp functions to specifically and irreversibly bind free hemoglobin (Hb) to facilitate its plasma clearance. The Hb binding site is localized to the Hp β chain, with each binding site capable of binding a single Hb αβ dimer. Each Hp 1–1 molecule is shown to bind two Hb dimers with equal affinity, a pattern repeated in the majority of the smaller polymers of Hp 2–1 and Hp 2–2. There is some evidence that steric hindrance in larger polymers may decrease this 1:1 relationship. The remarkably stable Hp-Hb complex is then consumed by circulating monocytes and reticuloendothelial macrophages bearing the CD163 Hb scavenger receptor for degradation and recycling of the heme moiety [180–182]. This process is relatively linear at higher concentrations (15 mg/100 mL/h), but is more exponential at physiologic concentrations, with a half-life of 9–12 min [178]. Severe intravascular hemolysis can quickly overwhelm the ability of plasma Hp to remove free Hb, as no positive feedback loop exists for increased synthesis. However, a 2- to 10-fold increase can be shown in cases of systemic infection, inflammation, neoplastic disease, and exogenous steroid dosage, as Hp is included in the myriad of proteins known as the “acute phase reactants.” Increases in plasma levels rely solely on de novo liver synthesis, as no extravascular storage pools have been identified.
Several theories have been advanced for the presence of Hp in the CNS. The majority of Hp in the CNS is believed to originate from transport or leakage across the BBB; several groups have demonstrated differential CSF levels based upon MW, with the Hp 1–1 (85 kDa) phenotype dominating and the larger Hp 2–1 (120 kDa) or Hp 2–2 (160 kDa) polymers present at significantly lower levels [2,179,183]. Increasing concentrations of CSF Hp have generally been associated with pathologic barrier disruption or as a reflection of increased plasma levels in the case of the acute phase response [51,179]. However, recent findings of Hp within astrocytes [184], oligodendrocytes [185] and human glioblastoma cells [186,187] have offered a new potential explanation for its presence in CSF from control subjects [143].
Hp functions performed within the CNS closely parallel those beyond the BBB. In addition to Hp roles in scavenging potentially neurotoxic free Hb (released in cases of brain injury), several immunomodulatory and antioxidant functions of Hp have also been identified [188,189]. As an acute phase reactant, Hp directly downregulates prostaglandin synthesis and has been implicated in protecting the cholesterol esterification function of ApoE against oxidative stress, potentially mitigating an important trigger of neurodegeneration in diseases like MS or Alzheimer’s disease [190]. Hp has also been shown to be necessary for neovascularization following endothelial injury, functioning as a promoter of angiogenesis [191,192]. Taken together, the currently identified functions of Hp within the CNS are consistent with neuroprotection. Low levels or deficient Hp production have been associated with worsening outcome following intracerebral hemorrhage [143,185].
Here, our results indicate that Hp exhibited the greatest mean fold change of all CSF markers identified, a 25.68-fold mean decrease in concentration (TBI/SAH vs. controls.) However, some reports have described increased levels of Hp in TBI CSF [4,193]. Evidence of increased CSF Hp levels has also been demonstrated in a variety of acute and chronic neurodegenerative conditions, including TBI, MS, Alzheimer’s disease, frontotemporal dementia, neuromyelitis optica, and GBS [2,9,10,42,51,193–200]. In most cases, such changes are thought to reflect pathologic changes in BBB integrity due to age [179], inflammation, or infection [39,196], with the free flow of plasma Hp along its concentration gradient to the brain interstitial space.
Stable CSF Hp concentrations have been demonstrated in SAH populations with an important caveat: when individual Hp isoforms are considered, the Hp 2 species showed no concentration changes, but the Hp 1–1 isoform showed a significant, greater than 6-fold decrease in concentration [143]. Galea et al. explained these differences as the result of enhanced clearance of Hp 1–1-Hb complexes, compared to that of Hp 2-Hb complexes. That study also clinically correlated these changes with protection against delayed cerebral ischemia, consistent with previous investigations [201,202]. Hp concentration changes in our study showed a 45% greater decrease in TBI CSF samples, although this failed to reach statistical significance (p = 0.3062). It is possible that these differences could represent an increased representation of the Hp 1–1 isoform in our TBI patients as compared to those of SAH patients, with the resulting increase in clearance demonstrated in our findings. It is also possible that this decrease reflects blunting of acute phase responses, with a secondary diminution of leakage across the BBB among TBI patients.
7.2. Serotransferrin
Serotransferrin refers to the sialylated form of a 79.5 kDa glycoprotein synthesized by the liver and secreted into the plasma. Following translation, complex branching oligosaccharide moieties are covalently bound via N-type-glycosylation at two asparagine residues prior to exiting the endoplasmic reticulum [203]. The presence of these modifications prevents premature clearance from plasma by the hepatic receptor system [11,204]. Transferrin (Tf) binds up to two atoms of ferric (Fe3+) iron with a high affinity for transport to tissues requiring it for oxidative respiration [205]. Cells bearing Tf receptors internalize the transport protein and its ligand for later endosomal recycling of apotransferrin to the extracellular space [203].
A Tf isoform lacking glycosylation has been selectively identified within human CSF. This β-transferrin constitutes up to 35% of the CSF pool and changes in this depot have been associated with neurodegenerative syndromes [12,41,206]. Under non-pathologic conditions, choroid epithelial cells can regulate brain levels of Tf by transcytosis of serum Tf or by de novo synthesis and secretion of β-Tf [207,208]. An endogenous form of Tf has also been identified in human oligodendrocytes, whose presence has been found to be essential for normal myelination [209]. However, this differentially gene spliced product lacks the signal peptide necessary for secretion [205,210]. Within the CNS, the only cells consistently found to express the Tf receptor are neurons, although glial cells have been reported to express the Tf receptor in vitro [205,211–213]. Adaptive increases in circulating Tf and its target receptor on tissues have been demonstrated under conditions of iron deficiency [208,214,215] and insufficient upregulation has been linked to the loss of neurons and hypomyelination characteristic of pediatric iron deficiency and fetal alcohol syndrome [216,217].
A biochemical model of inflammatory damage in brain tissue has been postulated involving the interaction of Tf with endogenous proteases [218]. During periods of stress or infection, a physiologic decrease in the availability of serum iron has long been described as an adaptation to ‘starve’ invading microbial pathogens [219]. Unfortunately, under these conditions, circulating Tf becomes desaturated with iron, which can contribute to inflammatory injury by two main pathways. First, desaturated Tf is significantly more susceptible to proteases that can free bound and enable produc tion of free radicals via the Fenton reaction [220–222]. Second, a protease intermediate, toxiferrin (TxF), can independently promote lipid peroxidation and significantly increase monocyte differentiation into macrophages [218].
Tf levels have been found to be consistently decreased in postmortem studies of the cerebral cortices from the aging and those with Alzheimer’s disease [223], while increased activity has been associated with a Parkinson’s-like syndrome in rats following exposure to manganese [224,225]. Alterations in Tf CSF levels have been demonstrated in restless leg syndrome [226], MS [206], Alzheimer’s disease [12], PD [131], and sporadic Creutzfeldt-Jakob-disease [227], indicating that the pathologic changes seen in these disorders may, on some level, reflect the consequences of altered iron hemostasis. Our results here indicate a mean 8.65-fold decrease in serotransferrin in SAH and TBI specimens compared to those of controls, but no statistically significant difference was found between these experimental groups (p = 0.3443).
We hypothesize that this decrease may reflect one or more clinical processes: (1) a stress- and/or inflammation-induced relative hypotransferrinemia could lead to lower CSF levels secondary to either decreased transcytosis at the choroid plexus or increased loss down its gradient at an incompetent BBB; or (2) this decrease might involve increased depletion of extracellular Tf by a compensatory increase in neuronal uptake secondary to the increased demands of localized ischemia or metabolic derangement. These findings might also be explained by a temporary disruption of Tf uptake at the choroid epithelial layer triggered by traumatic injury. It is worth noting that one consequence of any decrease in CSF transferrin would be to decrease total brain iron, which is crucial for neuronal metabolic functions, remyelination, and nerve repair, but can also lead to iron dependent oxidant generation and tissue injury.
7.3. Potential limitations of the study
While levels of Hb, CA-I, and Prx-2 were found to be significantly elevated in CSF, these proteins are detected in erythrocytes [67,130]. However, it has been previously established that a 10–20:1 ratio of Hb to CA-I in experimental samples is a threshold for whole blood contamination; the Hb to CA-I ratio in our samples showed a dominance of CA-I expression. Likewise, if whole blood contamination occurred within our samples, it would also have been expected to have dramatically increased the total protein content of samples, based on the greater abundance of plasma proteins compared to those in CSF. Protein concentration analysis prior to albumin and immunoglobulin depletion identified no differences in mean protein content of SAH and TBI samples (1.51 vs. 1.55 mg/mL; p = 0.8863).
Although we have identified biomarkers that are elevated in SAH and TBI, we have not yet defined biomarkers that discriminate between SAH and TBI. This may reflect several technical and procedural factors. First, it is possible that albumin and immunoglobulin depletion prior to 2D GE may diminish markers with lower MW that bind adventitiously to these larger polypeptides. MALDI-MS has also demonstrated an inability to identify proteins with a MW range <20,000 or >100,000, or those with an excessive acidic amino acid composition [228,229]. Several of the protein spots found to change significantly in our experimental groups have not been characterized by MALDI-MS. Likewise, some identified spots might be less accurately quantified due to protein lability, post-translational modification, or the presence of different isoforms within the same specimen, factors which have been previously reported to confound protein analysis in MALDI-MS [186,196].
Future proteomic studies in this area with improved control over demographics (age, sex, race, other diagnoses, etc.) will help to recognize and potentially exclude outlier samples, which might improve interpretation. Further, larger scale studies could help identify CSF biomarkers that better and more accurately discriminate between SAH and TBI and possibly other diagnoses.
8. Conclusions
These data suggest a similar pathogenesis of brain injury in cases of TBI and SAH as reflected in the CSF proteome. Consistent CSF elevations of CA-I and Prx-2 with concurrent depletion of Hp and serotransferrin represent a valuable combination of biomarkers for the prediction of severity and prognosis following brain injury. These results strongly support further research into the CSF proteomic mechanisms of secondary injury following primary CNS insult.
Acknowledgments
These studies were supported by the Feist Cardiovascular and Imaging Foundation Award for Translational Research (Connor), DOD Award MS090035 (Alexander, Minagar) and the NW Louisiana Brain and Spinal Cord Injury Foundation (Alexander). The authors would like to acknowledge Ms. Courtney Parker for assistance in manuscript preparation.
This work was partially supported by grants from the Northwest Louisiana Brain and Spinal Cord Injury Foundation and the Malcolm Feist Cardiovascular/Imaging Center.
Footnotes
Competing interests
Neither Dr. Alexander nor any contributing author has received anything of value from or owns stock in a commercial company or institution related directly or indirectly to the subject of this article.
References
- 1.Finehout EJ, Franck Z, Relkin N, Lee KH, Proteomic analysis of cerebrospinal fluid changes related to postmortem interval, Clin. Chem 52 (2006) 1906–1913. [DOI] [PubMed] [Google Scholar]
- 2.Wiederkehr F, Ogilvie A, Vonderschmitt DJ, Two-dimensional gel electrophoresis of cerebrospinal fluid proteins from patients with various neurological diseases, Clin. Chem 31 (1985) 1537–1542. [PubMed] [Google Scholar]
- 3.Parkkila AK, Parkkila S, Reunanen M, Niemelä O, Tuisku S, Rautakorpi I, Rajaniemi H, Carbonic anhydrase II in the cerebrospinal fluid: its value as a disease marker, Eur. J. Clin. Invest 27 (1997) 392–397. [DOI] [PubMed] [Google Scholar]
- 4.Conti A, Sanchez-Ruiz Y, Bachi A, Beretta L, Grandi E, Beltramo M, Alessio M, Proteome study of human cerebrospinal fluid following traumatic brain injury indicates fibrin(ogen) degradation products as trauma-associated markers, J. Neurotrauma 21 (2004) 854–863. [DOI] [PubMed] [Google Scholar]
- 5.Lecube A, Poca MA, Colomé N, Bech-Serra JJ, Hernández C, García-Ramírez M, Gándara D, Canals F, Simó R, Proteomic analysis of cerebrospinal fluid from obese women with idiopathic intracranial hypertension: a new approach for identifying new candidates in the pathogenesis of obesity, J. Neuroendocrinol 24 (2012) 944–952. [DOI] [PubMed] [Google Scholar]
- 6.Ehling R, Pauli FD, Lackner P, Kuenz B, Santner W, Lutterotti A, Gneiss C, Hegen H, Schocke M, Deisenhammer F, Berger T, Reindl M, Fibrinogen is not elevated in the cerebrospinal fluid of patients with multiple sclerosis, Fluids Barriers CNS 8 (2011) 25. [DOI] [PMC free article] [PubMed] [Google Scholar]
- 7.Lee JW, Namkoong H, Kim HK, Kim S, Hwang DW, Na HR, Ha S-A, Kim J-R, Kim JW, Fibrinogen gamma-A chain precursor in CSF: a candidate biomarker for Alzheimer’s disease, BMC Neurol. 7 (2007) 14. [DOI] [PMC free article] [PubMed] [Google Scholar]
- 8.Wildenauer DB, Körschenhausen D, Hoechtlen W, Ackenheil M, Kehl M, Lottspeich F, Analysis of cerebrospinal fluid from patients with psychiatric and neurological disorders by two-dimensional electrophoresis: identification of disease-associated polypeptides as fibrin fragments, Electrophoresis 12 (1991) 487–492. [DOI] [PubMed] [Google Scholar]
- 9.Johnson G, Brane D, Block W, Van Kammen DP, Gurklis J, Peters JL, Wyatt RJ, Kirch DG, Ghanbari HA, Merril CR, Cerebrospinal fluid protein variations in common to Alzheimer’s disease and schizophrenia, Appl. Theor. Electrophor 3 (1992) 47–53. [PubMed] [Google Scholar]
- 10.Zhang H-L, Zhang X-M, Mao X-J, Deng H, Li H-F, Press R, Fredrikson S, Zhu J, Altered cerebrospinal fluid index of prealbumin, fibrinogen, and haptoglobin in patients with Guillain-Barreí syndrome and chronic inflammatory demyelinating polyneuropathy, Acta Neurol. Scand 125 (2012) 129–135. [DOI] [PubMed] [Google Scholar]
- 11.Hoffmann A, Nimtz M, Getzlaff R, Conradt HS, Brain-type N-glycosylation of asialo-transferrin from human cerebrospinal fluid, FEBS Lett. 359 (1995) 164–168. [DOI] [PubMed] [Google Scholar]
- 12.Ringman JM, Schulman H, Becker C, Jones T, Bai Y, Immermann F, Cole G, Sokolow S, Gylys K, Geschwind DH, Cummings JL, Wan HI, Proteomic changes in cerebrospinal fluid of presymptomatic and affected persons carrying familial Alzheimer disease mutations, Arch. Neurol 69 (2012) 96–104. [DOI] [PMC free article] [PubMed] [Google Scholar]
- 13.Raymackers J, Daniels A, De Brabandere V, Missiaen C, Dauwe M, Verhaert P, Vanmechelen E, Meheus L, Identification of two-dimensionally separated human cerebrospinal fluid proteins by N-terminal sequencing, matrix-assisted laser desorption/ionization-mass spectrometry, nanoliquid chromatography–electrospray ionization–time of flight-mass spectrometry, and tandem mass spectrometry, Electrophoresis 21 (2000) 2266–2283. [DOI] [PubMed] [Google Scholar]
- 14.McAllister TW, Neurobiological consequences of traumatic brain injury, Dialogues Clin. Neurosci 13 (2011) 287–300. [DOI] [PMC free article] [PubMed] [Google Scholar]
- 15.Rutland-Brown W, Langlois JA, Thomas KE, Xi YL, Incidence of traumatic brain injury in the United States, 2003, J. Head Trauma Rehabil 21 (2006) 544–548. [DOI] [PubMed] [Google Scholar]
- 16.Johnston SC, Selvin S, Gress DR, The burden, trends, and demographics of mortality from subarachnoid hemorrhage, Neurology 50 (1998) 1413–1418. [DOI] [PubMed] [Google Scholar]
- 17.Linn FH, Rinkel GJ, Algra A, Van Gijn J, Incidence of subarachnoid hemorrhage: role of region, year, and rate of computed tomography: a meta-analysis, Stroke 27 (1996) 625–629. [DOI] [PubMed] [Google Scholar]
- 18.Van Gijn J, Rinkel GJ, Subarachnoid haemorrhage: diagnosis, causes and management, Brain 124 (2001) 249–278. [DOI] [PubMed] [Google Scholar]
- 19.McDonald CM, Jaffe KM, Fay GC, Polissar NL, Martin KM, Liao S, Rivara JB, Comparison of indices of traumatic brain injury severity as predictors of neurobehavioral outcome in children, Arch. Phys. Med. Rehabil 75 (1994) 328–337. [DOI] [PubMed] [Google Scholar]
- 20.Teasdale G, Jennett B, Assessment of coma and impaired consciousness. A practical scale, Lancet 2 (1974) 81–84. [DOI] [PubMed] [Google Scholar]
- 21.Demetriades D, Kuncir E, Murray J, Velmahos GC, Rhee P, Chan L, Mortality prediction of head Abbreviated Injury Score and Glasgow Coma Scale: analysis of 7,764 head injuries, J. Am. Coll. Surg 199 (2004) 216–222. [DOI] [PubMed] [Google Scholar]
- 22.Walder AD, Yeoman PM, Turnbull A, The abbreviated injury scale as a predictor of outcome of severe head injury, Intensive Care Med. 21 (1995) 606–609. [DOI] [PubMed] [Google Scholar]
- 23.Marshall LF, Marshall SB, Klauber MR, Van Berkum Clark M, Eisenberg H, Jane JA, Luerssen TG, Marmarou A, Foulkes MA, The diagnosis of head injury requires a classification based on computed axial tomography, J. Neurotrauma 1 (9 Suppl) (1992) S287–S292. [PubMed] [Google Scholar]
- 24.Alexander JS, Minagar A, Harper M, Robinson-Jackson S, Jennings M, Smith SJ, Proteomic analysis of human cerebral endothelial cells activated by multiple sclerosis serum and IFNbeta-1b, J. Mol. Neurosci 32 (2007) 169–178. [DOI] [PubMed] [Google Scholar]
- 25.Minagar A, Alexander JS, Kelley RE, Harper M, Jennings MH, Proteomic analysis of human cerebral endothelial cells activated by glutamate/MK-801: significance in ischemic stroke injury, J. Mol. Neurosci 38 (2009) 182–192. [DOI] [PubMed] [Google Scholar]
- 26.Romeo MJ, Espina V, Lowenthal M, Espina BH, Petricoin EF 3rd, Liotta LA, CSF proteome: a protein repository for potential biomarker identification, Expert Rev. Proteomics 2 (2005) 57–70. [DOI] [PubMed] [Google Scholar]
- 27.Lowry OH, Rosebrough NJ, Farr AL, Randall RJ, Protein measurement with the Folin phenol reagent, J. Biol. Chem 193 (1951) 265–275. [PubMed] [Google Scholar]
- 28.Peterson GL, Review of the Folin phenol protein quantitation method of Lowry, Rosebrough, Farr and Randall, Anal. Biochem 100 (1979) 201–220. [DOI] [PubMed] [Google Scholar]
- 29.Smith PK, Krohn RI, Hermanson GT, Mallia AK, Gartner FH, Provenzano MD, Fujimoto EK, Goeke NM, Olson BJ, Klenk DC, Measurement of protein using bicinchoninic acid, Anal. Biochem 150 (1985) 76–85. [DOI] [PubMed] [Google Scholar]
- 30.O’Farrell PH, High resolution two-dimensional electrophoresis of proteins, J. Biol. Chem 250 (1975) 4007–4021. [PMC free article] [PubMed] [Google Scholar]
- 31.Burgess-Cassler A, Johansen JJ, Santek DA, Ide JR, Kendrick NC, Computerized quantitative analysis of coomassie-blue-stained serum proteins separated by two-dimensional electrophoresis, Clin. Chem 35 (1989) 2297–2304. [PubMed] [Google Scholar]
- 32.Oakley BR, Kirsch DR, Morris NR, A simplified ultrasensitive silver stain for detecting proteins in polyacrylamide gels, Anal. Biochem 105 (1980) 361–363. [DOI] [PubMed] [Google Scholar]
- 33.Curl FD, Pollay M, Transport of water and electrolytes between brain and ventricular fluid in the rabbit, Exp. Neurol 20 (1968) 558–574. [DOI] [PubMed] [Google Scholar]
- 34.Rosenberg GA, Kyner WT, Estrada E, Bulk flow of brain interstitial fluid under normal and hyperosmolar conditions, Am. J. Physiol 238 (1980) F42–F49. [DOI] [PubMed] [Google Scholar]
- 35.Kazemi H, Johnson DC, Regulation of cerebrospinal fluid acid-base balance, Physiol. Rev 66 (1986) 953–1037. [DOI] [PubMed] [Google Scholar]
- 36.Cohen SR, Herndon RM, McKhann GM, Radioimmunoassay of myelin basic protein in spinal fluid: an index of active demyelination, N. Engl. J. Med 295 (1976) 1455–1457. [DOI] [PubMed] [Google Scholar]
- 37.Moore BW, McGregor D, Chromatographic and electrophoretic fractionation of soluble proteins of brain and liver, J. Biol. Chem 240 (1965) 1647–1653. [PubMed] [Google Scholar]
- 38.Lowenthal A, Noppe M, Gheuens J, Karcher D, Alpha-albumin (glial fibrillary acidic protein) in normal and pathological human brain and cerebrospinal fluid, J. Neurol 219 (1978) 87–91. [DOI] [PubMed] [Google Scholar]
- 39.Jin T, Hu L-S, Chang M, Wu J, Winblad B, Zhu J, Proteomic identification of potential protein markers in cerebrospinal fluid of GBS patients, Eur. J. Neurol 14 (2007) 563–568. [DOI] [PubMed] [Google Scholar]
- 40.Parkkila AK, Herva R, Parkkila S, Rajaniemi H, Immunohistochemical demonstration of human carbonic anhydrase isoenzyme II in brain tumours, Histochem. J 27 (1995) 974–982. [PubMed] [Google Scholar]
- 41.Vanderver A, Schiffmann R, Timmons M, Kellersberger KA, Fabris D, Hoffman EP, Maletkovic J, Hathout Y, Decreased asialotransferrin in cerebrospinal fluid of patients with childhood-onset ataxia and central nervous system hypomyelination/vanishing white matter disease, Clin. Chem 51 (2005) 2031–2042. [DOI] [PubMed] [Google Scholar]
- 42.Huang Y-C, Wu Y-R, Tseng M-Y, Chen Y-C, Hsieh S-Y, Chen C-M, Increased prothrombin, apolipoprotein A-IV, and haptoglobin in the cerebrospinal fluid of patients with Huntington’s disease, PLoS ONE 6 (2011) e15809. [DOI] [PMC free article] [PubMed] [Google Scholar]
- 43.Zemlan FP, Jauch EC, Mulchahey JJ, Gabbita SP, Rosenberg WS, Speciale SG, Zuccarello M, C-tau biomarker of neuronal damage in severe brain injured patients: association with elevated intracranial pressure and clinical outcome, Brain Res. 947 (2002) 131–139. [DOI] [PubMed] [Google Scholar]
- 44.Franz G, Beer R, Kampfl A, Engelhardt K, Schmutzhard E, Ulmer H, Deisenhammer F, Amyloid beta 1–42 and tau in cerebrospinal fluid after severe traumatic brain injury, Neurology 60 (2003) 1457–1461. [DOI] [PubMed] [Google Scholar]
- 45.Berger RP, Pierce MC, Wisniewski SR, Adelson PD, Clark RSB, Ruppel RA, Kochanek PM, Neuron-specific enolase and S100B in cerebrospinal fluid after severe traumatic brain injury in infants and children, Pediatrics 109 (2002) E31. [DOI] [PubMed] [Google Scholar]
- 46.Pleines UE, Morganti-Kossmann MC, Rancan M, Joller H, Trentz O, Kossmann T, S-100 beta reflects the extent of injury and outcome, whereas neuronal specific enolase is a better indicator of neuroinflammation in patients with severe traumatic brain injury, J. Neurotrauma 18 (2001) 491–498. [DOI] [PubMed] [Google Scholar]
- 47.Kossmann T, Hans VH, Imhof HG, Stocker R, Grob P, Trentz O, Morganti-Kossmann C, Intrathecal and serum interleukin-6 and the acute-phase response in patients with severe traumatic brain injuries, Shock 4 (1995) 311–317. [DOI] [PubMed] [Google Scholar]
- 48.Fraser DD, Close TE, Rose KL, Ward R, Mehl M, Farrell C, Lacroix J, Creery D, Kesselman M, Stanimirovic D, Hutchison JS, Severe traumatic brain injury in children elevates glial fibrillary acidic protein in cerebrospinal fluid and serum, Pediatr. Crit. Care Med 12 (2011) 319–324. [DOI] [PubMed] [Google Scholar]
- 49.Kay AD, Day SP, Kerr M, Nicoll JAR, Packard CJ, Caslake MJ, Remodeling of cerebrospinal fluid lipoprotein particles after human traumatic brain injury, J. Neurotrauma 20 (2003) 717–723. [DOI] [PubMed] [Google Scholar]
- 50.Liu HM, Sturner WQ, Extravasation of plasma proteins in brain trauma, Forensic Sci. Int 38 (1988) 285–295. [DOI] [PubMed] [Google Scholar]
- 51.Mattila KM, Pirttilä T, Blennow K, Wallin A, Viitanen M, Frey H, Altered blood-brain-barrier function in Alzheimer’s disease? Acta Neurol. Scand 89 (1994) 192–198. [DOI] [PubMed] [Google Scholar]
- 52.Schmidt OI, Heyde CE, Ertel W, Stahel PF, Closed head injury—an inflammatory disease? Brain Res. Brain Res. Rev 48 (2005) 388–399. [DOI] [PubMed] [Google Scholar]
- 53.Kochanek PM, Clark RSB, Ruppel RA, Adelson PD, Bell MJ, Whalen MJ, Robertson CL, Satchell MA, Seidberg NA, Marion DW, Jenkins LW, Biochemical, cellular, and molecular mechanisms in the evolution of secondary damage after severe traumatic brain injury in infants and children: lessons learned from the bedside, Pediatr. Crit. Care Med 1 (2000) 4–19. [DOI] [PubMed] [Google Scholar]
- 54.Faden AI, Demediuk P, Panter SS, Vink R, The role of excitatory amino acids and NMDA receptors in traumatic brain injury, Science 244 (1989) 798–800. [DOI] [PubMed] [Google Scholar]
- 55.Shohami E, Beit-Yannai E, Horowitz M, Kohen R, Oxidative stress in closed-head injury: brain antioxidant capacity as an indicator of functional outcome, J. Cereb. Blood Flow Metab 17 (1997) 1007–1019. [DOI] [PubMed] [Google Scholar]
- 56.Bayir H, Kagan VE, Tyurina YY, Tyurin V, Ruppel RA, Adelson PD, Graham SH, Janesko K, Clark RSB, Kochanek PM, Assessment of antioxidant reserves and oxidative stress in cerebrospinal fluid after severe traumatic brain injury in infants and children, Pediatr. Res 51 (2002) 571–578. [DOI] [PubMed] [Google Scholar]
- 57.Sly WS, Hu PY, Human carbonic anhydrases and carbonic anhydrase deficiencies, Annu. Rev. Biochem 64 (1995) 375–401. [DOI] [PubMed] [Google Scholar]
- 58.Moini M, Demars SM, Huang H, Analysis of carbonic anhydrase in human red Blood cells using capillary electrophoresis/electrospray ionization-mass spectrometry, Anal. Chem 74 (2002) 3772–3776. [DOI] [PubMed] [Google Scholar]
- 59.Chegwidden WR, Carter ND, The Carbonic Anhydrases: New Horizons, Springer, 2000. [PubMed] [Google Scholar]
- 60.Kumpulainen T, Rajaniemi H, Myllylä VV, Korhonen LK, A single-step solid phase radioimmunoassay for quantifying human carbonic anhydrase I and II in cerebrospinal fluid, Clin. Chim. Acta 150 (1985) 205–212. [DOI] [PubMed] [Google Scholar]
- 61.Visanji NP, Wong JC, Wang SX, Cappel B, Kleinschmidt-Demasters BK, Handler MH, Ochi A, Otsubo H, Rutka JT, Go C, Weiss S, Vinters HV, Hawkins CE, Desouza LV, Siu KWM, Hazrati L-N, A proteomic analysis of pediatric seizure cases associated with astrocytic inclusions, Epilepsia 53 (2012) e50–e54. [DOI] [PubMed] [Google Scholar]
- 62.Cammer W, Immunostaining of carbamoylphosphate synthase II and fatty acid synthase in glial cells in rat, mouse, and hamster brains suggests roles for carbonic anhydrase in biosynthetic processes, Neurosci. Lett 129 (1991) 247–250. [DOI] [PubMed] [Google Scholar]
- 63.Ilies MA, Masereel B, Rolin S, Scozzafava A, Câmpeanu G, Cîmpeanu V, Supuran CT, Carbonic anhydrase inhibitors: aromatic and heterocyclic sulfonamides incorporating adamantyl moieties with strong anticonvulsant activity, Bioorg. Med. Chem 12 (2004) 2717–2726. [DOI] [PubMed] [Google Scholar]
- 64.Kossmann T, Stahel PF, Lenzlinger PM, Redl H, Dubs RW, Trentz O, Schlag G, Morganti-Kossmann MC, Interleukin-8 released into the cerebrospinal fluid after brain injury is associated with blood-brain barrier dysfunction and nerve growth factor production, J. Cereb. Blood Flow Metab 17 (1997) 280–289. [DOI] [PubMed] [Google Scholar]
- 65.Guo F, Hua Y, Wang J, Keep RF, Xi G, Inhibition of carbonic anhydrase reduces brain injury after intracerebral hemorrhage, Transl. Stroke Res 3 (2012) 130–137. [DOI] [PMC free article] [PubMed] [Google Scholar]
- 66.Gao B-B, Clermont A, Rook S, Fonda SJ, Srinivasan VJ, Wojtkowski M, Fujimoto JG, Avery RL, Arrigg PG, Bursell S-E, Aiello LP, Feener EP, Extracellular carbonic anhydrase mediates hemorrhagic retinal and cerebral vascular permeability through prekallikrein activation, Nat. Med 13 (2007) 181–188. [DOI] [PubMed] [Google Scholar]
- 67.You J-S, Gelfanova V, Knierman MD, Witzmann FA, Wang M, Hale JE, The impact of blood contamination on the proteome of cerebrospinal fluid, Proteomics 5 (2005) 290–296. [DOI] [PubMed] [Google Scholar]
- 68.Wood ZA, Schröder E, Robin Harris J, Poole LB, Structure, mechanism and regulation of peroxiredoxins, Trends Biochem. Sci 28 (2003) 32–40. [DOI] [PubMed] [Google Scholar]
- 69.Low FM, Hampton MB, Peskin AV, Winterbourn CC, Peroxiredoxin 2 functions as a noncatalytic scavenger of low-level hydrogen peroxide in the erythrocyte, Blood 109 (2007) 2611–2617. [DOI] [PubMed] [Google Scholar]
- 70.Yan S, Chen S, Li Z, Wang H, Huang T, Wang X, Wang J, Biochemical characterization of human peroxiredoxin 2, an antioxidative protein, Acta Biochim. Biophys. Sinica (2012). [DOI] [PubMed] [Google Scholar]
- 71.Sarafian TA, Verity MA, Vinters HV, Shih CC, Shi L, Ji XD, Dong L, Shau H, Differential expression of peroxiredoxin subtypes in human brain cell types, J. Neurosci. Res 56 (1999) 206–212. [PubMed] [Google Scholar]
- 72.Shau H, Gupta RK, Golub SH, Identification of a natural killer enhancing factor (NKEF) from human erythroid cells, Cell Immunol. 147 (1993) 1–11. [DOI] [PubMed] [Google Scholar]
- 73.Rhee SG, Chae HZ, Kim K, Peroxiredoxins: a historical overview and speculative preview of novel mechanisms and emerging concepts in cell signaling, Free Radic. Biol. Med 38 (2005) 1543–1552. [DOI] [PubMed] [Google Scholar]
- 74.Rhee SG, Kim KH, Chae HZ, Yim MB, Uchida K, Netto LE, Stadtman ER, Antioxidant defense mechanisms: a new thiol-specific antioxidant enzyme, Ann. N. Y. Acad. Sci 738 (1994) 86–92. [DOI] [PubMed] [Google Scholar]
- 75.Zhang P, Liu B, Kang SW, Seo MS, Rhee SG, Obeid LM, Thioredoxin peroxidase is a novel inhibitor of apoptosis with a mechanism distinct from that of Bcl-2, J. Biol. Chem 272 (1997) 30615–30618. [DOI] [PubMed] [Google Scholar]
- 76.Ahn SM, Lee SM, Chung T, Kim K, Park JW, Yeast thiol-dependent protector protein expression enhances the resistance of Escherichia coli to hydrogen peroxide, Biochem. Mol. Biol. Int 39 (1996) 1007–1015. [DOI] [PubMed] [Google Scholar]
- 77.Richardson MR, Lai X, Witzmann FA, Yoder MC, Venous and arterial endothelial proteomics: mining for markers and mechanisms of endothelial diversity, Expert Rev. Proteomics 7 (2010) 823–831. [DOI] [PMC free article] [PubMed] [Google Scholar]
- 78.Kim S-U, Jin M-H, Kim YS, Lee S-H, Cho YS, Cho K-J, Lee K-S, Kim YI, Kim GW, Kim J-M, Lee T-H, Lee Y-H, Shong M, Kim H-C, Chang K-T, Yu D-Y, Lee D-S, Peroxiredoxin II preserves cognitive function against age-linked hippocampal oxidative damage, Neurobiol. Aging 32 (2011) 1054–1068. [DOI] [PubMed] [Google Scholar]
- 79.Jin M-H, Lee Y-H, Kim J-M, Sun H-N, Moon E-Y, Shong MH, Kim S-U, Lee SH, Lee T-H, Yu D-Y, Lee D-S, Characterization of neural cell types expressing peroxiredoxins in mouse brain, Neurosci. Lett 381 (2005) 252–257. [DOI] [PubMed] [Google Scholar]
- 80.Ichimiya S, Davis JG, O’Rourke DM, Katsumata M, Greene MI, Murine thioredoxin peroxidase delays neuronal apoptosis and is expressed in areas of the brain most susceptible to hypoxic and ischemic injury, DNA Cell Biol. 16 (1997) 311–321. [DOI] [PubMed] [Google Scholar]
- 81.Hattori F, Oikawa S, Peroxiredoxins in the central nervous system, Subcell Biochem. 44 (2007) 357–374. [DOI] [PubMed] [Google Scholar]
- 82.Krapfenbauer K, Engidawork E, Cairns N, Fountoulakis M, Lubec G, Aberrant expression of peroxiredoxin subtypes in neurodegenerative disorders, Brain Res. 967 (2003) 152–160. [DOI] [PubMed] [Google Scholar]
- 83.Kim SH, Fountoulakis M, Cairns N, Lubec G, Protein levels of human peroxiredoxin subtypes in brains of patients with Alzheimer’s disease and Down syndrome, J. Neural Transm Suppl (2001) 223–235. [DOI] [PubMed] [Google Scholar]
- 84.Warner DS, Sheng H, Batinić-Haberle I, Oxidants, antioxidants and the ischemic brain, J. Exp. Biol 207 (2004) 3221–3231. [DOI] [PubMed] [Google Scholar]
- 85.Giasson BI, Duda JE, Murray IV, Chen Q, Souza JM, Hurtig HI, Ischiropoulos H, Trojanowski JQ, Lee VM, Oxidative damage linked to neurodegeneration by selective alpha-synuclein nitration in synucleinopathy lesions, Science 290 (2000) 985–989. [DOI] [PubMed] [Google Scholar]
- 86.Halliwell B, Gutteridge JM, Role of free radicals and catalytic metal ions in human disease: an overview, Methods Enzymol. 186 (1990) 1–85. [DOI] [PubMed] [Google Scholar]
- 87.Lassmann H, Van Horssen J, The molecular basis of neurodegeneration in multiple sclerosis, FEBS Lett. 585 (2011) 3715–3723. [DOI] [PubMed] [Google Scholar]
- 88.Multhaup G, Ruppert T, Schlicksupp A, Hesse L, Beher D, Masters CL, Beyreuther K, Reactive oxygen species and Alzheimer’s disease, Biochem. Pharmacol 54 (1997) 533–539. [DOI] [PubMed] [Google Scholar]
- 89.Smith MA, Perry G, Free radical damage, iron, and Alzheimer’s disease, J. Neurol. Sci 134 (Suppl) (1995) 92–94. [DOI] [PubMed] [Google Scholar]
- 90.Lyras L, Cairns NJ, Jenner A, Jenner P, Halliwell B, An assessment of oxidative damage to proteins, lipids, and DNA in brain from patients with Alzheimer’s disease, J. Neurochem 68 (1997) 2061–2069. [DOI] [PubMed] [Google Scholar]
- 91.Smith MA, Sayre LM, Anderson VE, Harris PL, Beal MF, Kowall N, Perry G, Cytochemical demonstration of oxidative damage in Alzheimer disease by immunochemical enhancement of the carbonyl reaction with 2,4-dinitrophenylhydrazine, J. Histochem. Cytochem 46 (1998) 731–735. [DOI] [PubMed] [Google Scholar]
- 92.Facchinetti F, Dawson VL, Dawson TM, Free radicals as mediators of neuronal injury, Cell. Mol. Neurobiol 18 (1998) 667–682. [DOI] [PMC free article] [PubMed] [Google Scholar]
- 93.Yoshida Y, Yoshikawa A, Kinumi T, Ogawa Y, Saito Y, Ohara K, Yamamoto H, Imai Y, Niki E, Hydroxyoctadecadienoic acid and oxidatively modified peroxiredoxins in the blood of Alzheimer’s disease patients and their potential as biomarkers, Neurobiol. Aging 30 (2009) 174–185. [DOI] [PubMed] [Google Scholar]
- 94.Jenner P, Oxidative mechanisms in nigral cell death in Parkinson’s disease, Mov. Disord 1 (13 Suppl) (1998) 24–34. [PubMed] [Google Scholar]
- 95.Liu D, Wen J, Liu J, Li L, The roles of free radicals in amyotrophic lateral sclerosis: reactive oxygen species and elevated oxidation of protein, DNA, and membrane phospholipids, FASEB J. 13 (1999) 2318–2328. [DOI] [PubMed] [Google Scholar]
- 96.Pedersen WA, Fu W, Keller JN, Markesbery WR, Appel S, Smith RG, Kasarskis E, Mattson MP, Protein modification by the lipid peroxidation product 4-hydroxynonenal in the spinal cords of amyotrophic lateral sclerosis patients, Ann. Neurol 44 (1998) 819–824. [DOI] [PubMed] [Google Scholar]
- 97.Ferrante RJ, Browne SE, Shinobu LA, Bowling AC, Baik MJ, MacGarvey U, Kowall NW, Brown RH Jr., Beal MF, Evidence of increased oxidative damage in both sporadic and familial amyotrophic lateral sclerosis, J. Neurochem 69 (1997) 2064–2074. [DOI] [PubMed] [Google Scholar]
- 98.Lipton SA, Molecular mechanisms of trauma-induced neuronal degeneration, Curr. Opin. Neurol. Neurosurg 6 (1993) 588–596. [PubMed] [Google Scholar]
- 99.Gidday JM, Beetsch JW, Park TS, Endogenous glutathione protects cerebral endothelial cells from traumatic injury, J. Neurotrauma 16 (1999) 27–36. [DOI] [PubMed] [Google Scholar]
- 100.Hossmann KA, Reperfusion of the brain after global ischemia: hemodynamic disturbances, Shock 8 (1997) 95–101, discussion 102–103. [DOI] [PubMed] [Google Scholar]
- 101.Küçükkaya B, Aker R, Yüksel M, Onat F, Yalçin AS, Low dose MK-801 protects against iron-induced oxidative changes in a rat model of focal epilepsy, Brain Res. 788 (1998) 133–136. [DOI] [PubMed] [Google Scholar]
- 102.Liochev SI, Fridovich I, The Haber–Weiss cycle – 70 years later: an alternative view, Redox Rep. 7 (2002) 55–57, author reply 59–60. [DOI] [PubMed] [Google Scholar]
- 103.Przedborski S, Peroxiredoxin-2 links Cdk5 to neurodegeneration, Nat. Med 13 (2007) 907–909. [DOI] [PubMed] [Google Scholar]
- 104.Qu D, Rashidian J, Mount MP, Aleyasin H, Parsanejad M, Lira A, Haque E, Zhang Y, Callaghan S, Daigle M, Rousseaux MWC, Slack RS, Albert PR, Vincent I, Woulfe JM, Park DS, Role of Cdk5-mediated phosphorylation of Prx2 in MPTP toxicity and Parkinson’s disease, Neuron 55 (2007) 37–52. [DOI] [PubMed] [Google Scholar]
- 105.Choi MH, Lee IK, Kim GW, Kim BU, Han Y-H, Yu D-Y, Park HS, Kim KY, Lee JS, Choi C, Bae YS, Lee BI, Rhee SG, Kang SW, Regulation of PDGF signalling and vascular remodelling by peroxiredoxin II, Nature 435 (2005) 347–353. [DOI] [PubMed] [Google Scholar]
- 106.Yamamoto T, Matsui Y, Natori S, Obinata M, Cloning of a housekeeping-type gene (MER5) preferentially expressed in murine erythroleukemia cells, Gene 80 (1989) 337–343. [DOI] [PubMed] [Google Scholar]
- 107.Prospéri MT, Apiou F, Dutrillaux B, Goubin G, Organization and chromosomal assignment of two human PAG gene loci: PAGA encoding a functional gene and PAGB a processed pseudogene, Genomics 19 (1994) 236–241. [DOI] [PubMed] [Google Scholar]
- 108.Rhee SG, Cell signaling H2O2, a necessary evil for cell signaling, Science 312 (2006) 1882–1883. [DOI] [PubMed] [Google Scholar]
- 109.Baldwin AS Jr., The NF-kappa B and I kappa B proteins: new discoveries and insights, Annu. Rev. Immunol 14 (1996) 649–683. [DOI] [PubMed] [Google Scholar]
- 110.Kang SW, Rhee SG, Chang T-S, Jeong W, Choi MH, 2-Cys peroxiredoxin function in intracellular signal transduction: therapeutic implications, Trends Mol. Med 11 (2005) 571–578. [DOI] [PMC free article] [PubMed] [Google Scholar]
- 111.Kang SW, Chae HZ, Seo MS, Kim K, Baines IC, Rhee SG, Mammalian peroxiredoxin isoforms can reduce hydrogen peroxide generated in response to growth factors and tumor necrosis factor-alpha, J. Biol. Chem 273 (1998) 6297–6302. [DOI] [PubMed] [Google Scholar]
- 112.Rabilloud T, Heller M, Gasnier F, Luche S, Rey C, Aebersold R, Benahmed M, Louisot P, Lunardi J, Proteomics analysis of cellular response to oxidative stress: evidence for in vivo overoxidation of peroxiredoxins at their active site, J. Biol. Chem 277 (2002) 19396–19401. [DOI] [PubMed] [Google Scholar]
- 113.Kwon T-H, Han Y-H, Hong SG, Lee DJ, Ha H-L, Kang SW, Li W, Yoon DY, Yu D-Y, Reactive oxygen species mediated DNA damage is essential for abnormal erythropoiesis in peroxiredoxin II(−/−) mice, Biochem. Biophys. Res. Commun (2012). [DOI] [PubMed] [Google Scholar]
- 114.Caner B, Hou J, Altay O, Fuj M, Zhang JH, Transition of research focus from vasospasm to early brain injury after subarachnoid hemorrhage, J. Neurochem 123 (2012) 12–21. [DOI] [PubMed] [Google Scholar]
- 115.Marzatico F, Gaetani P, Buratti E, Messina AL, Ferlenga P, Rodriguez Baena R, Effects of high-dose methylprednisolone on Na+–K+ ATPase and lipid peroxidation after experimental subarachnoid hemorrhage, Acta Neurol. Scand 82 (1990) 263–270. [DOI] [PubMed] [Google Scholar]
- 116.Endo H, Nito C, Kamada H, Yu F, Chan PH, Reduction in oxidative stress by superoxide dismutase overexpression attenuates acute brain injury after subarachnoid hemorrhage via activation of Akt/glycogen synthase kinase-3beta survival signaling, J. Cereb. Blood Flow Metab 27 (2007) 975–982. [DOI] [PMC free article] [PubMed] [Google Scholar]
- 117.Scheff SW, Ansari MA, Roberts KN, Neuroprotective effect of Pycnogenol® following traumatic brain injury, Exp. Neurol 239 (2013) 183–191. [DOI] [PMC free article] [PubMed] [Google Scholar]
- 118.Ansari MA, Roberts KN, Scheff SW, Oxidative stress and modification of synaptic proteins in hippocampus after traumatic brain injury, Free Radic. Biol. Med 45 (2008) 443–452. [DOI] [PMC free article] [PubMed] [Google Scholar]
- 119.Simzar S, Ellyin R, Shau H, Sarafian TA, Contrasting antioxidant and cytotoxic effects of peroxiredoxin I and II in PC12 and NIH3T3 cells, Neurochem. Res 25 (2000) 1613–1621. [DOI] [PubMed] [Google Scholar]
- 120.Lee KW, Lee DJ, Lee JY, Kang DH, Kwon J, Kang SW, Peroxiredoxin II restrains DNA damage-induced death in cancer cells by positively regulating JNK-dependent DNA repair, J. Biol. Chem 286 (2011) 8394–8404. [DOI] [PMC free article] [PubMed] [Google Scholar]
- 121.Smith-Pearson PS, Kooshki M, Spitz DR, Poole LB, Zhao W, Robbins ME, Decreasing peroxiredoxin II expression decreases glutathione, alters cell cycle distribution, and sensitizes glioma cells to ionizing radiation and H(2)O(2), Free Radic. Biol. Med 45 (2008) 1178–1189. [DOI] [PMC free article] [PubMed] [Google Scholar]
- 122.Conti AC, Raghupathi R, Trojanowski JQ, McIntosh TK, Experimental brain injury induces regionally distinct apoptosis during the acute and delayed post-traumatic period, J. Neurosci 18 (1998) 5663–5672. [DOI] [PMC free article] [PubMed] [Google Scholar]
- 123.Yuksel S, Tosun YB, Cahill J, Solaroglu I, Early brain injury following aneurysmal subarachnoid hemorrhage: emphasis on cellular apoptosis, Turk Neurosurg. 22 (2012) 529–533. [DOI] [PubMed] [Google Scholar]
- 124.Lescuyer P, Allard L, Zimmermann-Ivol CG, Burgess JA, Hughes-Frutiger S, Burkhard PR, Sanchez J-C, Hochstrasser DF, Identification of post-mortem cerebrospinal fluid proteins as potential biomarkers of ischemia and neurodegeneration, Proteomics 4 (2004) 2234–2241. [DOI] [PubMed] [Google Scholar]
- 125.Liu L, Zeng M, Stamler JS, Hemoglobin induction in mouse macrophages, Proc. Natl. Acad. Sci. U.S.A 96 (1999) 6643–6647. [DOI] [PMC free article] [PubMed] [Google Scholar]
- 126.Newton DA, Rao KMK, Dluhy RA, Baatz JE, Hemoglobin is expressed by alveolar epithelial cells, J. Biol. Chem 281 (2006) 5668–5676. [DOI] [PubMed] [Google Scholar]
- 127.Wride MA, Mansergh FC, Adams S, Everitt R, Minnema SE, Rancourt DE, Evans MJ, Expression profiling and gene discovery in the mouse lens, Mol. Vis 9 (2003) 360–396. [PubMed] [Google Scholar]
- 128.Glämsta EL, Marklund A, Hellman U, Wernstedt C, Terenius L, Nyberg F, Isolation and characterization of a hemoglobin-derived opioid peptide from the human pituitary gland, Regul. Pept 34 (1991) 169–179. [DOI] [PubMed] [Google Scholar]
- 129.Nyberg F, Sanderson K, Glämsta E-L, The hemorphins: a new class of opioid peptides derived from the blood protein hemoglobin, Peptide Sci. 43 (1997) 147–156. [DOI] [PubMed] [Google Scholar]
- 130.Jimenez CR, Koel-Simmelink M, Pham TV, Van der Voort L, Teunissen CE, Endogeneous peptide profiling of cerebrospinal fluid by MALDI-TOF mass spectrometry: optimization of magnetic bead-based peptide capture and analysis of preanalytical variables, Proteomics Clin. Appl 1 (2007) 1385–1392. [DOI] [PubMed] [Google Scholar]
- 131.Sinha A, Srivastava N, Singh S, Singh AK, Bhushan S, Shukla R, Singh MP, Identification of differentially displayed proteins in cerebrospinal fluid of Parkinson’s disease patients: a proteomic approach, Clin. Chim. Acta 400 (2009) 14–20. [DOI] [PubMed] [Google Scholar]
- 132.Slemmon JR, Hughes CM, Campbell GA, Flood DG, Increased levels of hemoglobin-derived and other peptides in Alzheimer’s disease cerebellum, J. Neurosci 14 (1994) 2225–2235. [DOI] [PMC free article] [PubMed] [Google Scholar]
- 133.Norwitz ER, Tsen LC, Park JS, Fitzpatrick PA, Dorfman DM, Saade GR, Buhimschi CS, Buhimschi IA, Discriminatory proteomic biomarker analysis identifies free hemoglobin in the cerebrospinal fluid of women with severe preeclampsia, Am. J. Obstet. Gynecol 193 (2005) 957–964. [DOI] [PubMed] [Google Scholar]
- 134.Liu X-D, Zeng B-F, Xu J-G, Zhu H-B, Xia Q-C, Proteomic analysis of the cerebrospinal fluid of patients with lumbar disk herniation, Proteomics 6 (2006) 1019–1028. [DOI] [PubMed] [Google Scholar]
- 135.Desiderio C, D’Angelo L, Rossetti DV, Iavarone F, Giardina B, Castagnola M, Massimi L, Tamburrini G, Di Rocco C, Cerebrospinal fluid top-down proteomics evidenced the potential biomarker role of LVV- and VV-hemorphin-7 in posterior cranial fossa pediatric brain tumors, Proteomics 12 (2012) 2158–2166. [DOI] [PubMed] [Google Scholar]
- 136.Richter F, Meurers BH, Zhu C, Medvedeva VP, Chesselet M-F, Neurons express hemoglobin α- and β-chains in rat and human brains, J. Comp. Neurol 515 (2009) 538–547. [DOI] [PMC free article] [PubMed] [Google Scholar]
- 137.Biagioli M, Pinto M, Cesselli D, Zaninello M, Lazarevic D, Roncaglia P, Simone R, Vlachouli C, Plessy C, Bertin N, Beltrami A, Kobayashi K, Gallo V, Santoro C, Ferrer I, Rivella S, Beltrami CA, Carninci P, Raviola E, Gustincich S, Unexpected expression of α- and β-globin in mesencephalic dopaminergic neurons and glial cells, PNAS 106 (2009) 15454–15459. [DOI] [PMC free article] [PubMed] [Google Scholar]
- 138.Mills FC, Ackers GK, Quaternary enhancement in binding of oxygen by human hemoglobin, Proc. Natl. Acad. Sci. U.S.A 76 (1979) 273–277. [DOI] [PMC free article] [PubMed] [Google Scholar]
- 139.Wittenberg JB, Wittenberg BA, Mechanisms of cytoplasmic hemoglobin and myoglobin function, Annu. Rev. Biophys. Biophys. Chem 19 (1990) 217–241. [DOI] [PubMed] [Google Scholar]
- 140.Bellelli A, Brunori M, Miele AE, Panetta G, Vallone B, The allosteric properties of hemoglobin: insights from natural and site directed mutants, Curr. Protein Pept. Sci 7 (2006) 17–45. [DOI] [PubMed] [Google Scholar]
- 141.Digicaylioglu M, Bichet S, Marti HH, Wenger RH, Rivas LA, Bauer C, Gassmann M, Localization of specific erythropoietin binding sites in defined areas of the mouse brain, Proc. Natl. Acad. Sci. U.S.A 92 (1995) 3717–3720. [DOI] [PMC free article] [PubMed] [Google Scholar]
- 142.Stroka DM, Burkhardt T, Desbaillets I, Wenger RH, Neil DA, Bauer C, Gassmann M, Candinas D, HIF-1 is expressed in normoxic tissue and displays an organ-specific regulation under systemic hypoxia, FASEB J. 15 (2001) 2445–2453. [DOI] [PubMed] [Google Scholar]
- 143.Galea J, Cruickshank G, Teeling JL, Boche D, Garland P, Perry VH, Galea I, The intrathecal CD163-haptoglobin-hemoglobin scavenging system in subarachnoid hemorrhage, J. Neurochem 121 (2012) 785–792. [DOI] [PMC free article] [PubMed] [Google Scholar]
- 144.Akiyama Y, Miyata K, Harada K, Minamida Y, Nonaka T, Koyanagi I, Asai Y, Houkin K, Susceptibility-weighted magnetic resonance imaging for the detection of cerebral microhemorrhage in patients with traumatic brain injury, Neurol. Med. Chir. (Tokyo) 49 (2009) 97–99, discussion 99. [DOI] [PubMed] [Google Scholar]
- 145.Toth A, Kovacs N, Perlaki G, Orsi G, Aradi M, Komaromy H, Ezer E, Bukovics P, Farkas O, Janszky J, Doczi T, Buki A, Schwarcz A, Multi-modal magnetic resonance imaging in the acute and sub-acute phase of mild traumatic brain injury: can we see the difference? J. Neurotrauma 30 (2013) 2–10. [DOI] [PubMed] [Google Scholar]
- 146.Wakefield AJ, More LJ, Difford J, McLaughlin JE, Immunohistochemical study of vascular injury in acute multiple sclerosis, J. Clin. Pathol 47 (1994) 129–133. [DOI] [PMC free article] [PubMed] [Google Scholar]
- 147.Paterson PY, Experimental allergic encephalomyelitis: role of fibrin deposition in immunopathogenesis of inflammation in rats, Fed. Proc 35 (1976) 2428–2434. [PubMed] [Google Scholar]
- 148.Perez RL, Roman J, Fibrin enhances the expression of IL-1 beta by human peripheral blood mononuclear cells Implications in pulmonary inflammation, J. Immunol 154 (1995) 1879–1887. [PubMed] [Google Scholar]
- 149.Fan ST, Edgington TS, Integrin regulation of leukocyte inflammatory functions. CD11b/CD18 enhancement of the tumor necrosis factor-alpha responses of monocytes, J. Immunol 150 (1993) 2972–2980. [PubMed] [Google Scholar]
- 150.Smiley ST, King JA, Hancock WW, Fibrinogen stimulates macrophage chemokine secretion through toll-like receptor 4, J. Immunol 167 (2001) 2887–2894. [DOI] [PubMed] [Google Scholar]
- 151.Akassoglou K, Adams RA, Bauer J, Mercado P, Tseveleki V, Lassmann H, Probert L, Strickland S, Fibrin depletion decreases inflammation and delays the onset of demyelination in a tumor necrosis factor transgenic mouse model for multiple sclerosis, Proc. Natl. Acad. Sci. U.S.A 101 (2004) 6698–6703. [DOI] [PMC free article] [PubMed] [Google Scholar]
- 152.Adams RA, Bauer J, Flick MJ, Sikorski SL, Nuriel T, Lassmann H, Degen JL, Akassoglou K, The fibrin-derived gamma377–395 peptide inhibits microglia activation and suppresses relapsing paralysis in central nervous system autoimmune disease, J. Exp. Med 204 (2007) 571–582. [DOI] [PMC free article] [PubMed] [Google Scholar]
- 153.Ryu JK, Davalos D, Akassoglou K, Fibrinogen signal transduction in the nervous system, J. Thromb. Haemost 1 (7 Suppl) (2009) 151–154. [DOI] [PMC free article] [PubMed] [Google Scholar]
- 154.Schachtrup C, Lu P, Jones LL, Lee JK, Lu J, Sachs BD, Zheng B, Akassoglou K, Fibrinogen inhibits neurite outgrowth via beta 3 integrin-mediated phosphorylation of the EGF receptor, Proc. Natl. Acad. Sci. U.S.A 104 (2007) 11814–11819. [DOI] [PMC free article] [PubMed] [Google Scholar]
- 155.Senior RM, Skogen WF, Griffin GL, Wilner GD, Effects of fibrinogen derivatives upon the inflammatory response. Studies with human fibrinopeptide B, J. Clin. Invest 77 (1986) 1014–1019. [DOI] [PMC free article] [PubMed] [Google Scholar]
- 156.Davalos D, Akassoglou K, Fibrinogen as a key regulator of inflammation in disease, Semin. Immunopathol 34 (2012) 43–62. [DOI] [PubMed] [Google Scholar]
- 157.Schachtrup C, Ryu JK, Helmrick MJ, Vagena E, Galanakis DK, Degen JL, Margolis RU, Akassoglou K, Fibrinogen triggers astrocyte scar formation by promoting the availability of active TGF-beta after vascular damage, J. Neurosci 30 (2010) 5843–5854. [DOI] [PMC free article] [PubMed] [Google Scholar]
- 158.Gveric D, Hanemaaijer R, Newcombe J, Van Lent NA, Sier CF, Cuzner ML, Plasminogen activators in multiple sclerosis lesions: implications for the inflammatory response and axonal damage, Brain 124 (2001) 1978–1988. [DOI] [PubMed] [Google Scholar]
- 159.Gveric D, Herrera B, Petzold A, Lawrence DA, Cuzner ML, Impaired fibrinolysis in multiple sclerosis: a role for tissue plasminogen activator inhibitors, Brain 126 (2003) 1590–1598. [DOI] [PubMed] [Google Scholar]
- 160.Koh CS, Kwaan HC, Paterson PY, Neurovascular fibrinolytic activity in normal Lewis rats and rats with cell-transferred experimental allergic encephalomyelitis, J. Neuroimmunol 28 (1990) 189–200. [DOI] [PubMed] [Google Scholar]
- 161.Lu W, Bhasin M, Tsirka SE, Involvement of tissue plasminogen activator in onset and effector phases of experimental allergic encephalomyelitis, J. Neurosci 22 (2002) 10781–10789. [DOI] [PMC free article] [PubMed] [Google Scholar]
- 162.Schisano G, Franco A, Nina P, Papa ML, Iannuzzi M, De Biase R, Caldora M, Monitoring of fibrin and fibrinogen degradation products (FDP) in the cerebrospinal fluid of patients with subarachnoid haemorrhage due to ruptured aneurysm. Report of 55 cases, J. Neurosurg. Sci 38 (1994) 77–86. [PubMed] [Google Scholar]
- 163.Maarouf CL, Beach TG, Adler CH, Shill HA, Sabbagh MN, Wu T, Walker DG, Kokjohn TA, Roher AE, Cerebrospinal fluid biomarkers of neuropathologically diagnosed Parkinson’s disease subjects, Neurol. Res 34 (2012) 669–676. [DOI] [PMC free article] [PubMed] [Google Scholar]
- 164.Yin GN, Lee HW, Cho J-Y, Suk K, Neuronal pentraxin receptor in cerebrospinal fluid as a potential biomarker for neurodegenerative diseases, Brain Res. 1265 (2009) 158–170. [DOI] [PubMed] [Google Scholar]
- 165.Abdi F, Quinn JF, Jankovic J, McIntosh M, Leverenz JB, Peskind E, Nixon R, Nutt J, Chung K, Zabetian C, Samii A, Lin M, Hattan S, Pan C, Wang Y, Jin J, Zhu D, Li GJ, Liu Y, Waichunas D, Montine TJ, Zhang J, Detection of biomarkers with a multiplex quantitative proteomic platform in cerebrospinal fluid of patients with neurodegenerative disorders, J. Alzheimers Dis 9 (2006) 293–348. [DOI] [PubMed] [Google Scholar]
- 166.Magliozzi R, Howell OW, Reeves C, Roncaroli F, Nicholas R, Serafini B, Aloisi F, Reynolds R, A gradient of neuronal loss and meningeal inflammation in multiple sclerosis, Ann. Neurol 68 (2010) 477–493. [DOI] [PubMed] [Google Scholar]
- 167.Tovi D, Nilsson IM, Thulin CA, Fibrinolytic activity of the cerebrospinal fluid after subarachnoid haemorrhage, Acta Neurol. Scand 49 (1973) 1–9. [DOI] [PubMed] [Google Scholar]
- 168.Maurice-Williams RS, Gordon YB, Sykes A, Monitoring fibrinolytic activity in the cerebrospinal fluid after aneurysmal subarachnoid haemorrhage: a guide to the risk of rebleeding? J. Neurol. Neurosurg. Psychiatr 43 (1980) 175–181. [DOI] [PMC free article] [PubMed] [Google Scholar]
- 169.Sawaya R, Sonnino V, McLaurin RL, Perrotta G, Monitoring of antifibrinolytic therapy following subarachnoid hemorrhage. The importance of CSF fibrin/fibrinogen degradation products, J. Neurosurg 58 (1983) 699–707. [DOI] [PubMed] [Google Scholar]
- 170.Vermeulen M, Van Vliet HH, Lindsay KW, Hijdra A, Van Gijn J, Source of fibrin/fibrinogen degradation products in the CSF after subarachnoid hemorrhage, J. Neurosurg 63 (1985) 573–577. [DOI] [PubMed] [Google Scholar]
- 171.Anderson M, Matthews KB, Stuart J, Coagulation and fibrinolytic activity of cerebrospinal fluid, J. Clin. Pathol 31 (1978) 488–492. [DOI] [PMC free article] [PubMed] [Google Scholar]
- 172.Guggiari M, Dagreou F, Rivierez M, Mottet P, Gallais S, Philippon J, Viars P, Prediction of cerebral vasospasm value of fibrinogen degradation products (FDP) in the cerebro-spinal fluid (CSF) for prediction of vasospasm following subarachnoid haemorrhage due to a ruptured aneurysm, Acta Neurochir. (Wien) 73 (1984) 25–33. [DOI] [PubMed] [Google Scholar]
- 173.Tomimoto H, Akiguchi I, Suenaga T, Nishimura M, Wakita H, Nakamura S, Kimura J, Alterations of the blood-brain barrier and glial cells in white-matter lesions in cerebrovascular and Alzheimer’s disease patients, Stroke 27 (1996) 2069–2074. [DOI] [PubMed] [Google Scholar]
- 174.Ryu JK, McLarnon JG, A leaky blood-brain barrier, fibrinogen infiltration and microglial reactivity in inflamed Alzheimer’s disease brain, J. Cell Mol. Med 13 (2009) 2911–2925. [DOI] [PMC free article] [PubMed] [Google Scholar]
- 175.Kirk RL, The haptoglobin groups in man, Monogr. Hum. Genet 4 (1968) 1–77. [PubMed] [Google Scholar]
- 176.Kirk RL, Lai LY, The distribution of haptoglobin and transferrin groups in South and South East Asia, Acta Genet. Stat. Med 11 (1961) 97–105. [DOI] [PubMed] [Google Scholar]
- 177.Matson GA, Sutton HE, Swanson J, Robinson AR, Santiana A, Distribution of hereditary blood groups among Indians in South America. I. In Ecuador, Am. J. Phys. Anthropol 24 (1966) 51–69. [DOI] [PubMed] [Google Scholar]
- 178.Javid J, Human haptoglobins, Curr. Top. Hematol 1 (1978) 151–192. [PubMed] [Google Scholar]
- 179.Chamoun V, Zeman A, Blennow K, Fredman P, Wallin A, Keir G, Giovannoni G, Thompson EJ, Haptoglobins as markers of blood-CSF barrier dysfunction: the findings in normal CSF, J. Neurol. Sci 182 (2001) 117–121. [DOI] [PubMed] [Google Scholar]
- 180.Kristiansen M, Graversen JH, Jacobsen C, Sonne O, Hoffman HJ, Law SK, Moestrup SK, Identification of the haemoglobin scavenger receptor, Nature 409 (2001) 198–201. [DOI] [PubMed] [Google Scholar]
- 181.Schaer DJ, Schleiffenbaum B, Kurrer M, Imhof A, Bächli E, Fehr J, Moller HJ, Moestrup SK, Schaffner A, Soluble hemoglobin-haptoglobin scavenger receptor CD163 as a lineage-specific marker in the reactive hemophagocytic syndrome, Eur. J. Haematol 74 (2005) 6–10. [DOI] [PubMed] [Google Scholar]
- 182.Zuwała-Jagiełło J, Haemoglobin scavenger receptor: function in relation to disease, Acta Biochim. Pol 53 (2006) 257–268. [PubMed] [Google Scholar]
- 183.Blau JN, Harris H, Robson EB, Haptoglobins in cerebrospinal fluid, Clin. Chim. Acta 8 (1963) 202–206. [DOI] [PubMed] [Google Scholar]
- 184.Lee M-Y, Kim SY, Choi J-S, Lee I-H, Choi Y-S, Jin JY, Park S-J, Sung K-W, Chun M-H, Kim I-S, Upregulation of haptoglobin in reactive astrocytes after transient forebrain ischemia in rats, J. Cereb. Blood Flow Metab 22 (2002) 1176–1180. [DOI] [PubMed] [Google Scholar]
- 185.Zhao X, Song S, Sun G, Strong R, Zhang J, Grotta JC, Aronowski J, Neuroprotective role of haptoglobin after intracerebral hemorrhage, J. Neurosci 29 (2009) 15819–15827. [DOI] [PMC free article] [PubMed] [Google Scholar]
- 186.Kumar DM, Thota B, Shinde SV, Prasanna KV, Hegde AS, Arivazhagan A, Chandramouli BA, Santosh V, Somasundaram K, Proteomic identification of haptoglobin α2 as a glioblastoma serum biomarker: implications in cancer cell migration and tumor growth, J. Proteome Res 9 (2010) 5557–5567. [DOI] [PubMed] [Google Scholar]
- 187.Sanchez DJ, Armstrong L, Aguilar R, Adrian GS, Haro L, Martinez AO, Haptoglobin gene expression in human glioblastoma cell lines, Neurosci. Lett 303 (2001) 181–184. [DOI] [PubMed] [Google Scholar]
- 188.Quaye IK, Haptoglobin, inflammation and disease, Trans. R. Soc. Trop. Med. Hyg 102 (2008) 735–742. [DOI] [PubMed] [Google Scholar]
- 189.Langlois MR, Delanghe JR, Biological and clinical significance of haptoglobin polymorphism in humans, Clin. Chem 42 (1996) 1589–1600. [PubMed] [Google Scholar]
- 190.Salvatore A, Cigliano L, Carlucci A, Bucci EM, Abrescia P, Haptoglobin binds apolipoprotein E and influences cholesterol esterification in the cerebrospinal fluid, J. Neurochem 110 (2009) 255–263. [DOI] [PubMed] [Google Scholar]
- 191.Cid MC, Grant DS, Hoffman GS, Auerbach R, Fauci AS, Kleinman HK, Identification of haptoglobin as an angiogenic factor in sera from patients with systemic vasculitis, J. Clin. Invest 91 (1993) 977–985. [DOI] [PMC free article] [PubMed] [Google Scholar]
- 192.De Kleijn DPV, Smeets MB, Kemmeren PPCW, Lim SK, Van Middelaar BJ, Velema E, Schoneveld A, Pasterkamp G, Borst C, Acute-phase protein haptoglobin is a cell migration factor involved in arterial restructuring, FASEB J. 16 (2002) 1123–1125. [DOI] [PubMed] [Google Scholar]
- 193.Gao W-M, Chadha MS, Berger RP, Omenn GS, Allen DL, Pisano M, Adelson PD, Clark RSB, Jenkins LW, Kochanek PM, A gel-based proteomic comparison of human cerebrospinal fluid between inflicted and non-inflicted pediatric traumatic brain injury, J. Neurotrauma 24 (2007) 43–53. [DOI] [PMC free article] [PubMed] [Google Scholar]
- 194.Abraham J-D, Calvayrac-Pawlowski S, Cobo S, Salvetat N, Vicat G, Molina L, Touchon J, Michel B-F, Molina F, Verdier J-M, Fareh J, Mourton-Gilles C, Combined measurement of PEDF, haptoglobin and tau in cerebrospinal fluid improves the diagnostic discrimination between Alzheimer’s disease and other dementias, Biomarkers 16 (2011) 161–171. [DOI] [PubMed] [Google Scholar]
- 195.Argüelles S, Venero JL, García-Rodriguez S, Tomas-Camardiel M, Ayala A, Cano J, Machado A, Use of haptoglobin and transthyretin as potential biomarkers for the preclinical diagnosis of Parkinson’s disease, Neurochem. Int 57 (2010) 227–234. [DOI] [PubMed] [Google Scholar]
- 196.Bai S, Liu S, Guo X, Qin Z, Wang B, Li X, Qin Y, Proteome analysis of haptoglobin in cerebrospinal fluid of neuromyelitis optica, Mol. Biol. Rep 37 (2010) 1619–1625. [DOI] [PubMed] [Google Scholar]
- 197.Yang Y-R, Liu S-L, Qin Z-Y, Liu F-J, Qin Y-J, Bai S-M, Chen Z-Y, Comparative proteomics analysis of cerebrospinal fluid of patients with Guillain-Barré syndrome, Cell. Mol. Neurobiol 28 (2008) 737–744. [DOI] [PMC free article] [PubMed] [Google Scholar]
- 198.Jung SM, Lee K, Lee JW, Namkoong H, Kim HK, Kim S, Na HR, Ha S-A, Kim J-R, Ko J, Kim JW, Both plasma retinol-binding protein and haptoglobin precursor allele 1 in CSF: candidate biomarkers for the progression of normal to mild cognitive impairment to Alzheimer’s disease, Neurosci. Lett 436 (2008) 153–157. [DOI] [PubMed] [Google Scholar]
- 199.Jin T, Hu L-S, Chang M, Wu J, Winblad B, Zhu J, Proteomic identification of potential protein markers in cerebrospinal fluid of GBS patients, Eur. J. Neurol 14 (2007) 563–568. [DOI] [PubMed] [Google Scholar]
- 200.Davidsson P, Sjögren M, Andreasen N, Lindbjer M, Nilsson CL, Westman-Brinkmalm A, Blennow K, Studies of the pathophysiological mechanisms in frontotemporal dementia by proteome analysis of CSF proteins, Brain Res. Mol. Brain Res 109 (2002) 128–133. [DOI] [PubMed] [Google Scholar]
- 201.Borsody M, Burke A, Coplin W, Miller-Lotan R, Levy A, Haptoglobin and the development of cerebral artery vasospasm after subarachnoid hemorrhage, Neurology 66 (2006) 634–640. [DOI] [PubMed] [Google Scholar]
- 202.Chaichana KL, Levy AP, Miller-Lotan R, Shakur S, Tamargo RJ, Haptoglobin 2–2 genotype determines chronic vasospasm after experimental subarachnoid hemorrhage, Stroke 38 (2007) 3266–3271. [DOI] [PubMed] [Google Scholar]
- 203.Crichton RR, Charloteaux-Wauters M, Iron transport and storage, Eur. J. Biochem 164 (1987) 485–506. [DOI] [PubMed] [Google Scholar]
- 204.Ashwell G, Harford J, Carbohydrate-specific receptors of the liver, Annu. Rev. Biochem 51 (1982) 531–554. [DOI] [PubMed] [Google Scholar]
- 205.Leitner DF, Connor JR, Functional roles of transferrin in the brain, Biochim. Biophys. Acta 1820 (2012) 393–402. [DOI] [PubMed] [Google Scholar]
- 206.Jiang S, Wu J, Yang Y, Liu J, Ding Y, Ding M, Proteomic analysis of the cerebrospinal fluid in multiple sclerosis and neuromyelitis optica patients, Mol. Med. Rep 6 (2012) 1081–1086. [DOI] [PubMed] [Google Scholar]
- 207.Skjørringe T, Møller LB, Moos T, Impairment of interrelated iron- and copper homeostatic mechanisms in brain contributes to the pathogenesis of neurodegenerative disorders, Front. Pharmacol 3 (2012) 169. [DOI] [PMC free article] [PubMed] [Google Scholar]
- 208.Moos T, Rosengren Nielsen T, Skjørringe T, Morgan EH, Iron trafficking inside the brain, J. Neurochem 103 (2007) 1730–1740. [DOI] [PubMed] [Google Scholar]
- 209.Espinosa de los Monteros A, Kumar S, Zhao P, Huang CJ, Nazarian R, Pan T, Scully S, Chang R, De Vellis J, Transferrin is an essential factor for myelination, Neurochem. Res 24 (1999) 235–248. [DOI] [PubMed] [Google Scholar]
- 210.De Arriba Zerpa GA, Saleh MC, Fernández PM, Guillou F, Espinosa de los Monteros A, De Vellis J, Zakin MM, Baron B, Alternative splicing prevents transferrin secretion during differentiation of a human oligodendrocyte cell line, J. Neurosci. Res 61 (2000) 388–395. [DOI] [PubMed] [Google Scholar]
- 211.Connor JR, Benkovic SA, Iron regulation in the brain: histochemical, biochemical, and molecular considerations, Ann. Neurol 32 (Suppl) (1992) S51–S61. [DOI] [PubMed] [Google Scholar]
- 212.Hoepken HH, Korten T, Robinson SR, Dringen R, Iron accumulation, iron-mediated toxicity and altered levels of ferritin and transferrin receptor in cultured astrocytes during incubation with ferric ammonium citrate, J. Neurochem 88 (2004) 1194–1202. [DOI] [PubMed] [Google Scholar]
- 213.Kaur C, Ling E, Increased expression of transferrin receptors and iron in amoeboid microglial cells in postnatal rats following an exposure to hypoxia, Neurosci. Lett 262 (1999) 183–186. [DOI] [PubMed] [Google Scholar]
- 214.Rouault TA, Cooperman S, Brain iron metabolism, Semin. Pediatr. Neurol 13 (2006) 142–148. [DOI] [PubMed] [Google Scholar]
- 215.Hansen TM, Nielsen H, Bernth N, Moos T, Expression of ferritin protein and subunit mRNAs in normal and iron deficient rat brain, Brain Res. Mol. Brain Res 65 (1999) 186–197. [DOI] [PubMed] [Google Scholar]
- 216.Miller MW, Roskams AJ, Connor JR, Iron regulation in the developing rat brain: effect of in utero ethanol exposure, J. Neurochem 65 (1995) 373–380. [DOI] [PubMed] [Google Scholar]
- 217.Lozoff B, Beard J, Connor J, Barbara F, Georgieff M, Schallert T, Long-lasting neural and behavioral effects of iron deficiency in infancy, Nutr. Rev 64 (2006) S34–S43, discussion S72–S91. [DOI] [PMC free article] [PubMed] [Google Scholar]
- 218.Van Rensburg SJ, Van Zyl J, Hon D, Daniels W, Hendricks J, Potocnik F, Erasmus R, Biochemical model for inflammation of the brain: the effect of iron and transferrin on monocytes and lipid peroxidation, Metab. Brain Dis 19 (2004) 97–112. [DOI] [PubMed] [Google Scholar]
- 219.Ballantyne GH, Rapid drop in serum iron concentration as a host defense mechanism. A review of experimental and clinical evidence, Am. Surg 50 (1984) 405–411. [PubMed] [Google Scholar]
- 220.Brock JH, Esparza I, Oliver RA, Spooner RL, Electrophoretic mobility of N-and C-terminal monoferric fragments of bovine transferrin phenotypes AA, D1D1, D2D2, and EE, and N-terminal amino acid sequences, Biochem. Genet 18 (1980) 851–860. [DOI] [PubMed] [Google Scholar]
- 221.Harris WR, Equilibrium constants for the complexation of metal ions by serum transferrin, Adv Exp. Med. Biol 249 (1989) 67–93. [DOI] [PubMed] [Google Scholar]
- 222.Williams J, The formation of iron-binding fragments of hen ovotransferrin by limited proteolysis, Biochem. J 141 (1974) 745–752. [DOI] [PMC free article] [PubMed] [Google Scholar]
- 223.Connor JR, Snyder BS, Beard JL, Fine RE, Mufson EJ, Regional distribution of iron and iron-regulatory proteins in the brain in aging and Alzheimer’s disease, J. Neurosci. Res 31 (1992) 327–335. [DOI] [PubMed] [Google Scholar]
- 224.Li GJ, Choi B-S, Wang X, Liu J, Waalkes MP, Zheng W, Molecular mechanism of distorted iron regulation in the blood-CSF barrier and regional blood-brain barrier following in vivo subchronic manganese exposure, Neurotoxicology 27 (2006) 737–744. [DOI] [PMC free article] [PubMed] [Google Scholar]
- 225.Zheng W, Monnot AD, Regulation of brain iron and copper homeostasis by brain barrier systems: implication in neurodegenerative diseases, Pharmacol. Ther 133 (2012) 177–188. [DOI] [PMC free article] [PubMed] [Google Scholar]
- 226.Earley CJ, Connor JR, Beard JL, Malecki EA, Epstein DK, Allen RP, Abnormalities in CSF concentrations of ferritin and transferrin in restless legs syndrome, Neurology 54 (2000) 1698–1700. [DOI] [PubMed] [Google Scholar]
- 227.Singh A, Beveridge AJ, Singh N, Decreased CSF transferrin in sCJD: a potential pre-mortem diagnostic test for prion disorders, PLoS One 6 (2011) e16804. [DOI] [PMC free article] [PubMed] [Google Scholar]
- 228.Andersson M, Andren P, Caprioli RM, in: Alzate O (Ed.), MALDI Imaging and Profiling Mass Spectrometry in Neuroproteomics. Neuroproteomics, CRC Press, Boca Raton, FL, 2010. (Chapter 7). [PubMed] [Google Scholar]
- 229.Schober Y, Guenther S, Spengler B, Römpp A, High-resolution matrix-assisted laser desorption/ionization imaging of tryptic peptides from tissue, Rapid Commun. Mass Spectrom 26 (2012) 1141–1146. [DOI] [PubMed] [Google Scholar]