

Summary
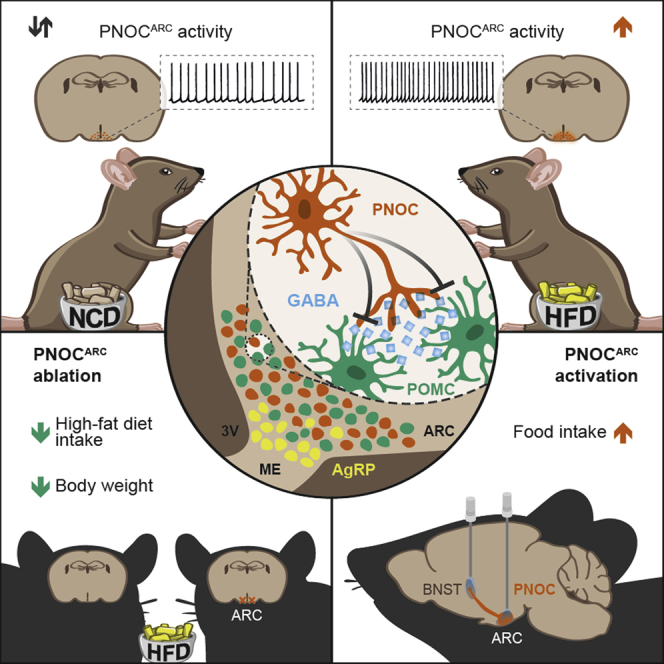
Calorie-rich diets induce hyperphagia and promote obesity, although the underlying mechanisms remain poorly defined. We find that short-term high-fat-diet (HFD) feeding of mice activates prepronociceptin (PNOC)-expressing neurons in the arcuate nucleus of the hypothalamus (ARC). PNOCARC neurons represent a previously unrecognized GABAergic population of ARC neurons distinct from well-defined feeding regulatory AgRP or POMC neurons. PNOCARC neurons arborize densely in the ARC and provide inhibitory synaptic input to nearby anorexigenic POMC neurons. Optogenetic activation of PNOCARC neurons in the ARC and their projections to the bed nucleus of the stria terminalis promotes feeding. Selective ablation of these cells promotes the activation of POMC neurons upon HFD exposure, reduces feeding, and protects from obesity, but it does not affect food intake or body weight under normal chow consumption. We characterize PNOCARC neurons as a novel ARC neuron population activated upon palatable food consumption to promote hyperphagia.
Keywords: prepronociceptin, nociceptin, orphanin FQ, food intake, acute high-fat-diet feeding, neuropeptide, PNOC neurons, arcuate nucleus, hypothalamus, obesity
Graphical Abstract
Highlights
-
•
Acute high-fat-diet feeding activates PNOC neurons in the arcuate nucleus (ARC)
-
•
GABAergic PNOCARC neurons inhibit anorexigenic POMC neurons
-
•
Optogenetic activation of PNOCARC neurons promotes feeding
-
•
Ablation of PNOCARC neurons protects from obesity
Calorie-rich diets induce hyperphagia and promote obesity. Here, Jais et al. report that short-term high-fat-diet (HFD) feeding in mice activates prepronociceptin (PNOC)-expressing neurons in the arcuate nucleus of the hypothalamus (ARC). They characterize PNOCARC neurons as a novel ARC neuron population activated upon palatable food consumption to promote hyperphagia.
Introduction
Genetic studies indicate a strong role for the CNS in the development of obesity, especially for genes expressed in the hypothalamus (Locke et al., 2015, Speliotes et al., 2010). Nevertheless, how a high-fat diet (HFD) affects the central regulation of feeding remains largely elusive. Exposure to a HFD leads to acute hyperphagia, which is potentially caused by the difference in postingestive signals arising from carbohydrate and fat consumption (Blundell and MacDiarmid, 1997, Gaysinskaya et al., 2007, Green et al., 1994, Thaler et al., 2012, Warwick, 2003). In addition, acute and/or prolonged feeding of a HFD alters the secretion of gastrointestinal hormones (Richards et al., 2016, Xu et al., 2011) and impairs vagal afferent sensitivity (Daly et al., 2011, Kentish et al., 2012). In the brain, highly dynamic neuronal networks in the hypothalamus integrate anticipatory responses, postingestive signals, and systemic metabolic homeostasis. In particular, the orexigenic agouti-related peptide (AgRP)-expressing and the anorexigenic proopiomelanocortin (POMC)-expressing neurons in the arcuate nucleus of the hypothalamus (ARC) express receptors for sensing the organismal energy state, allowing for accurate feedback regulation (Belgardt et al., 2009, Gautron et al., 2015, Jais and Brüning, 2017). For example, increased blood glucose concentrations and release of the adipokine leptin inform the brain about the sufficiency of energy stores and act via the activation of satiety signaling POMC neurons (Cowley et al., 2001, Ibrahim et al., 2003) and inhibition of hunger-signaling AgRP/NPY (neuropeptide Y) neurons (Fioramonti et al., 2007, van den Top et al., 2004). In addition, sensory food perception transiently regulates POMC neuron activity to prime postprandial liver adaptation (Brandt et al., 2018). However, continuous and prolonged HFD feeding results in impaired glucose sensing by POMC neurons (Parton et al., 2007), altered mitochondrial dynamics and mitochondria-endoplasmic reticulum (ER) interactions (Diano et al., 2011, Schneeberger et al., 2013), and ultimately inhibition of POMC neuron firing via the deterioration of Ca2+ homeostasis (Paeger et al., 2017).
Here, we set out to characterize neuronal populations that specifically respond to the feeding of energy-dense, highly palatable food. Using an unbiased phosphoribotrap approach, we find that prepronociceptin (PNOC)-expressing neurons in the hypothalamus are activated upon acute HFD feeding, and specifically, PNOC-expressing neurons in the ARC (PNOCARC neurons) provide inhibitory synaptic contact to anorexigenic POMC neurons. Their activity promotes overconsumption during acute HFD feeding, making PNOC-expressing neurons an attractive target for the prevention and treatment of obesity and associated metabolic diseases.
Results
PNOCARC Neurons Are Activated upon Short-Term HFD Feeding
To identify novel neurocircuits activated upon short-term HFD feeding, we used phosphoribotrap profiling (Knight et al., 2012) via immunoprecipitation of phosphorylated S6 ribosomal protein-tagged ribosomes from hypothalamic extracts of mice exposed to either 3 days of normal chow diet (NCD) or HFD (Figure S1A). The extraction of RNA from precipitated ribosomes allowed for the comparison of mRNA expression both in the input RNA and following pull-down of pS6-bearing ribosomes under both diet conditions. Only minor differences were observed between the input RNA fractions (Figure S1B). However, when we compared the input normalized immunoprecipitation (IP)-associated mRNAs, we detected transcripts that were significantly enriched in association with pS6-labeled ribosomes in hypothalamic extracts of mice exposed to HFD feeding for 3 days (Figure 1A). Among these transcripts, the mRNA encoding the neuropeptide PNOC (Pnoc) exhibited a significant enrichment in ribosomes precipitated from cells activated upon HFD feeding (Figures 1B and 1C). We next overlaid our dataset with a published single-cell-sequencing dataset of cells in the ARC of mice (Campbell et al., 2017). Analysis of activated cell clusters based on our phosphoribotrap data identified Pnoc as a characteristic marker of neurons activated by HFD feeding (Figure S1C). In addition, when we analyzed the top 50 most significantly enriched transcripts upon HFD feeding, Pnoc was the only transcript characterizing the Gene Ontology (GO) term “neuropeptide signaling pathway” (GO: 0007218; Table S1). Using PNOC-EGFP mice (Smith et al., 2020), we identified PNOC-expressing cells in the ARC, the lateral hypothalamus (LHA), the dorsomedial nucleus of the hypothalamus (DMH), and the zona incerta (Figure 1D).
Figure 1.

PNOCARC Neurons Are Activated upon Short-Term HFD Feeding
(A) RNA sequencing (RNA-seq) profiling of gene expression after 3 days of NCD or HFD feeding using phosphoribotrap. Fold enrichment (IP/input) for each condition is shown.
(B) Fold enrichment in IP/input HFD versus IP/input NCD and statistical significance are shown.
(C) Pnoc mRNA fold expression (IP/input) and Pnoc mRNA expression (IP) for NCD-fed (n = 3) and HFD-fed (n = 4) mice.
(D) Hypothalamic Pnoc expression in PNOC-EGFP mice.
(E) Quantification of pS6 expression in PNOCARC neurons in PNOC-EGFP mice after 3 days of NCD or HFD (n = 4/4) feeding.
(F) Representative pS6 stainings of the ARC of PNOC-eGFP mice after 3 days of NCD or HFD feeding. Scale bar, 200 μm.
(G) Representative traces of spontaneous firing from original recordings of PNOCARC neurons from NCD- and HFD-fed mice.
(H) Action potential firing frequencies and percentage of spontaneously active and silent (<0.5 Hz) PNOCARC neurons from NCD-fed (n = 88) and HFD-fed (n = 28) mice. Empty and filled bars represent active and silent cells, respectively. Absolute numbers of neurons are indicated.
(I) Input resistance of PNOCARC neurons from NCD-fed (n = 50) and HFD-fed (n = 24) mice.
(J) Representative traces illustrating the application of a ramp stimulus protocol to assess excitability in PNOCARC neurons from NCD-fed and HFD-fed mice.
(K) Threshold current determined by the ramp protocols in (J) of PNOCARC neurons from NCD-fed (n = 36) and HFD-fed (n = 23) mice.
(L) Total number of action potentials elicited upon ramp current injection in PNOCARC neurons from NCD-fed (n = 36) and HFD-fed (n = 23) mice.
(M) Quantification of Fos-positive PNOCARC neurons (fasted: n = 4/4, refed: n = 5/5).
(N) Quantification of Fos-positive AgRP neurons (fasted: n = 4/4, refed: n = 5/5).
∗p < 0.05, ∗∗p < 0.01, and ∗∗∗p < 0.001 as determined by Mann-Whitney test (H, left; I; and K), Fisher test (H, right), 2-tailed, unpaired Student’s t test (C, E, and L), and mixed-effects analysis followed by Sidak’s multiple comparisons test (M and N).
See also Figure S1 and Table S1.
Next, we performed a co-expression analysis of PNOC and pS6 expression via immunohistochemistry on hypothalamic sections of mice, which express EGFP under the regulatory elements of the Pnoc gene via bacterial artificial chromosome (BAC) transgenesis and had been exposed to NCD or HFD for 3 days. This analysis revealed an enhancement of the proportion of PNOC neurons exhibiting pS6 immunoreactivity, particularly in the ARC of mice that had been fed HFD for 3 days (Figures 1E and 1F).
Furthermore, we performed perforated patch-clamp recordings of identified and synaptically isolated PNOCARC neurons (Figures 1G and 1H). While 24% of PNOCARC neurons were completely silent in NCD-fed animals, the percentage of silent neurons was decreased to only 1% in HFD-fed animals (Figure 1H). In addition, PNOCARC neurons had a higher mean firing rate in HFD-fed animals compared to NCD-fed animals (Figures 1G and 1H). Acute HFD feeding failed to alter the membrane potential of PNOCARC neurons (Figure S1D), but the higher firing rate was accompanied by a tendency of increased input resistance in PNOCARC neurons of HFD-fed animals (Figure 1I). When we applied a triangular depolarizing stimulus protocol and determined the action potential threshold by measuring the current at the peak of the first action potential (Figure 1J), we found a significant decrease in the threshold current in PNOCARC neurons of HFD-fed animals (Figure 1K). The number of action potentials elicited by depolarizing current ramps was significantly higher compared to NCD-fed animals (Figure 1L), due to a uniform increase in the number of action potentials during the ascending and descending parts of the protocol (Figures S1E and S1F), strongly suggesting a general increase in excitability without altering activity-dependent mechanisms (Figure S1G).
To further investigate whether acute HFD feeding could affect the activity pattern of PNOCARC neurons, we analyzed their activation upon food consumption via performing in situ hybridizations for Pnoc, Agrp, and Fos mRNA expression in the ARC of NCD- and HFD-fed mice that were fasted and refed. This analysis revealed that in NCD-fed mice, refeeding suppressed the activation of PNOCARC neurons (Figures 1M and S1H). This refeeding-induced inhibition was completely abrogated in mice that had been exposed to HFD for 3 days (Figures 1M and S1H). In contrast, while refeeding potently suppressed fasting-induced activation of AgRP neurons in NCD-fed mice, short-term fasting-induced activation of AgRP neurons was largely reduced in animals exposed to HFD and not further suppressed upon refeeding (Figures 1N and S1H). These experiments indicate that PNOCARC neurons lose their ability to rapidly adapt to the short-term increase in highly palatable caloric intake.
PNOCARC Neurons Are GABAergic and Distinct from POMC or AgRP Neurons
To further characterize PNOC neurons on a molecular level, we performed BAC-TRAP (translating ribosome affinity purification)-based ribosome profiling of these cells in mice, which express a fusion protein of the ribosomal L10a protein with EGFP (L10a-EGFP) under control of the Pnoc promoter (Doyle et al., 2008). The precipitation of ribosomes of hypothalamic PNOC neurons with anti-GFP antibodies and subsequent sequencing of associated mRNAs allowed for the assessment of an in-depth translational profile of these cells. Besides a clear enrichment of Pnoc mRNA (Figure 2A), pathway analysis of enriched mRNAs revealed a signature of GABAergic neurons (Figures 2B and S2A), while precipitation of Agrp mRNA was underrepresented in the pull-down (Figure 2A). Similarly, we found enrichment of Pomc mRNA in the hypothalamic, non-PNOC fraction (Figure 2A). These data indicate that PNOCARC neurons, AgRPs, and POMC neurons are distinct neuronal populations.
Figure 2.

PNOCARC Neurons Are GABAergic and Distinct from POMC or AgRP Neurons
(A) RNA-seq profiling of hypothalamic tissue of PNOC-L10a-EGFP mice using BAC-TRAP. Fold enrichment in IP/input (x axis) and statistical significance (y axis) are shown (NCD-fed mice).
(B) Expression profiling of GABAergic marker genes in PNOC neurons using BAC-TRAP.
(C) Overlap of Pnoc mRNA with neuronal clusters obtained from single-cell RNA-seq of ARC neurons (Campbell et al., 2017).
(D) Representative confocal images and quantification of in situ hybridization of mRNA of Pnoc (cyan) and Slc32a1 (gray) in the ARC of C57BL/6N mice (n = 4). Scale bar, 200 μm.
(E) Representative confocal images and quantification of in situ hybridization of mRNA of Pnoc (cyan), Agrp (yellow), and Pomc (magenta) in the ARC of C57BL/6N mice (n = 5 for Agrp quantification, n = 6 for Pomc quantification). Scale bar, 200 μm.
(F) Representative confocal images and quantification of in situ hybridization of mRNA of Pnoc (cyan) and Th (blue) in the ARC of C57BL/6N mice (n = 4). Scale bar, 200 μm.
(G) Original traces illustrating inward rectification of a PNOCARC neuron upon hyperpolarizing current injections.
(H) Quantification of inward rectification to 5 consecutive stimuli as illustrated by the non-linear relationship (solid red line) compared to a theoretical linear ohmic relationship (dashed black line).
(I) Original examples of hyperpolarizations illustrating the inward rectification in PNOCARC and the lack of inward rectification in POMC and AgRP neurons.
(J) Percentage of neurons with inward rectification upon hyperpolarization in PNOCARC (n = 28), POMC (n = 27), and AgRP neurons (n = 14) of NCD-fed mice.
See also Figure S2.
We next assessed the overlap of genes enriched in PNOC neurons as identified in the BAC-TRAP approach with data obtained from single-cell RNA sequencing of > 20,000 arcuate and median eminence cells (Campbell et al., 2017). This analysis revealed a clear enrichment of PNOC neuron characteristic transcripts in a cluster of ARC neurons characterized by Htr3b expression (Figure 2C).
When we performed double in situ hybridizations with probes for Pnoc and either Pomc, Agrp, Slc32a1 (VGAT), or Th (tyrosine hydroxylase) mRNA in the ARC, we confirmed that the majority (76.5%) of PNOCARC neurons express VGAT (Figure 2D). Furthermore, there was little overlap of Pnoc mRNA expression with Agrp- (10.1%), Pomc- (11.0%), or Th- (15.4%) mRNA expression (Figures 2E and 2F).
Electrophysiological recordings of PNOCARC revealed the presence of inward rectification upon hyperpolarizing stimuli (Figures 2G–2I). Hyperpolarizing current injections revealed inward rectification in ~82% of the recorded PNOCARC neurons (Figure 2J), while inward rectification upon hyperpolarizing current injections was only observed in ~14% of POMC and ~15% of AgRP neurons (Figures 2I and 2J). These studies suggest that PNOCARC neurons represent a GABAergic population that is distinct from previously characterized ARC neurons.
PNOCARC Neurons Are Regulated by Extracellular Glucose
We next aimed to investigate the response of these cells to nutrients and circulating adiposity signals such as glucose and leptin. Therefore, we performed long-lasting perforated patch-clamp recordings from identified PNOCARC neurons combined with pharmacological experiments. To this end, we decreased extracellular glucose concentrations during electrophysiological recordings stepwise from 5 to 0.1 mM. Reduction of extracellular glucose concentrations profoundly hyperpolarized the membrane potential of PNOCARC neurons and led to significantly reduced firing of these neurons, thus characterizing them as glucose excited (GE)-ARC neurons (Figures 3A–3C). Altering extracellular glucose concentrations stepwise from 5 to 0.1 mM revealed a clear concentration-dependent inhibition of PNOCARC neurons (Figure 3B), similar to other GE neurons in the ARC (Claret et al., 2007). In support of these findings, BAC-TRAP-based ribosome profiling revealed that hypothalamic PNOC neurons express functional KATP channels, specifically Kir6.2 (Kcnj11) and SUR1 (Abcc8) subunits (Figure S3A). Furthermore, these neurons express glucokinase (Gck), a primary glucose sensor (Matschinsky and Wilson, 2019), as well as transient receptor potential canonical type 3 (Trpc3) channels, which are involved in hypothalamic glucose detection (Chrétien et al., 2017; Figure S3A).
Figure 3.

PNOCARC Neurons Are Regulated by Extracellular Glucose
(A) Original recording and corresponding rate histogram of a PNOCARC neuron from a NCD-fed mouse treated with a decreased concentration of extracellular glucose (5–0.1 mM). Numbered arrows mark the sections of the recording that are displayed in a higher time resolution.
(B) Normalized frequency and absolute membrane potential (inset) of PNOCARC neurons, illustrating a concentration-response relationship and responses to extracellular glucose concentrations ranging from 5 to 0.1 mM. The representative recordings and corresponding rate histograms illustrate the responses to 3, 1.5, and 0.1 mM, respectively. The numbers above the circles represent the number of experiments.
(C) Membrane potential under control (5 mM) and low glucose (0.1 mM) conditions of PNOCARC neurons of NCD-fed mice (dashed black lines mark single experiments; n = 13).
(D) Attenuated responsiveness to decreases in extracellular glucose to 0.1 mM. Original recording and corresponding rate histogram of a PNOCARC neuron from HFD-fed mice treated with decreased extracellular glucose (0.1 mM). Numbered arrows mark the sections of the recording that are displayed in higher time resolution.
(E) Membrane potential under control (5 mM) and low glucose (0.1 mM) conditions of PNOCARC neurons of HFD-fed mice (dashed black lines mark single experiments; n = 23).
(F) Mean change of the membrane potential upon treatment with low glucose in PNOCARC neurons of NCD-fed (n = 13) and HFD-fed mice (n = 23).
(G) Original recording and corresponding rate histogram of a PNOCARC neuron treated with 100 nM leptin. Numbered arrows mark the sections of the recording that are displayed in a higher time resolution.
(H) Effect of leptin treatment (100 nM) on action potential frequency of PNOCARC neurons.
(I) Percentage of hyperpolarized, depolarized, and non-responsive neurons.
∗p < 0.05, ∗∗p < 0.01, and ∗∗∗p < 0.001 as determined by Mann-Whitney test (C and E), and 2-tailed, unpaired Student’s t test (F) or by 2-tailed, paired Student’s t test (H).
See also Figure S3.
We also performed similar electrophysiological studies in PNOC neurons in the LHA and in the bed nucleus of the stria terminalis (BNST). Here, also, the majority of PNOCLHA neurons hyperpolarize their membrane potential upon the reduction of extracellular glucose concentrations (Figures S3B–S3E). PNOCBNST neurons exhibited a more heterogeneous response to changes in extracellular glucose concentrations (Figures S3F–S3I). These experiments indicate that the majority of hypothalamic PNOC neurons represent glucose-excited neurons.
Since HFD feeding has been shown to impair neuronal glucose sensing in the ARC (Parton et al., 2007), we tested whether short-term exposure to HFD also affects glucose sensitivity in PNOCARC neurons. While a number of neurons still responded to decreased extracellular glucose concentrations (Figures 3D and S3J), we found a larger number of cells with attenuated or abrogated responsiveness to decreases in extracellular glucose (Figures 3D and 3E). The impaired glucose responsiveness in these cells revealed a significant decrease in the responsiveness to decreased extracellular glucose at the population level (Figure 3F), thus providing evidence for a relative activation of these cells in the presence of reduced glucose transport in response to acute HFD feeding (Jais et al., 2016).
Since PNOCARC neurons respond to HFD feeding, we aimed to investigate a possible role of leptin signaling in the direct regulation of these neurons. Here, the application of 100 nM leptin to synaptically isolated, actively firing (>0.5Hz) PNOCARC neurons on average decreased their activity. While the majority (80%) of PNOCARC neurons were inhibited, 1 neuron (10%) was activated by the application of leptin (Figures 3G–3I). In situ hybridization for Lepr expression in PNOCARC neurons revealed that 10% of these cells express the leptin receptor (Lepr) (Figure S3K).
PNOC Signaling Mediates Acute Hyperphagia and Initial Body Weight Gain upon HFD Feeding
To specifically address the role of PNOC neurons in the regulation of food intake, we generated a PNOC-Cre mouse line, which expresses the Cre-recombinase from the Pnoc locus while simultaneously disrupting the Pnoc coding exon 2 via homologous recombination-based gene targeting in embryonic stem cells (ESCs) (Figures 4A and S4A). PNOC-Cre mice exhibited the expected pattern of Cre-recombination as evidenced via overlap of endogenous Pnoc expression and ZsGreen fluorescence in mice expressing ZsGreen in a Cre-dependent manner (Figure 4B). As mice homozygous for the Cre allele lack the Pnoc gene product, breeding this mouse line to homozygosity allowed us to study the effects of global PNOC inactivation on body weight regulation.
Figure 4.

PNOC Signaling Mediates Acute Hyperphagia and Initial Body Weight Gain upon HFD Feeding
(A) Schematic diagram of the PNOC-Cre allele.
(B) Representative confocal images of in situ hybridization of mRNA of Pnoc (cyan), endogenous Cre-driven ZsGreen fluorescence (yellow), and Agrp mRNA (cyan) in the ARC of PNOC-Cre::ZsGreen floxed mice. Scale bar, 200 μm.
(C) Body weights of PNOC-Cre mice (PNOC-Crewt/wt, PNOC-Cretg/wt, and PNOC-Cretg/tg) during HFD feeding (n = 15/12/9, 2-way repeated measures [RM] ANOVA with Sidak’s multiple comparisons test).
(D) Percentage of weekly body weight gain on HFD compared to Pnoc wild-type (WT) mice (n = 15/12/9, 2-way RM ANOVA followed by Sidak’s multiple comparisons test).
(E) Cumulative food intake on NCD.
(F) Total food intake on NCD. (n = 5/5/5, 1-way ANOVA followed by Tukey’s post hoc test).
(G) Cumulative food intake during 3 days of HFD feeding.
(H) Total food intake during 3 days of HFD feeding (n = 5/5/5, 1-way ANOVA followed by Tukey’s post hoc test).
(I) Cumulative food intake after 4 weeks on HFD.
(J) Total food intake after 4 weeks of HFD feeding (n = 5/5/5, 1-way ANOVA followed by Tukey’s post hoc test).
(K) Fat mass of Pnoc WT, Pnoc HET and Pnoc KO mice after 4 weeks of HFD (n = 6/5/6, 1-way ANOVA followed by Tukey’s post hoc test).
(L) Representative images of computed tomography (CT) scans of Pnoc WT, Pnoc HET, and Pnoc KO mice after 4 weeks of HFD. Yellow, fat tissue; blue, non-adipose soft tissue.
∗p < 0.05, ∗∗p < 0.01, and ∗∗∗p < 0.001.
See also Figure S4.
While the body weight of Pnoc knockout (KO) mice on NCD did not significantly differ from control animals, they showed a clear reduction in body weight gain after 1 week of HFD feeding (Figures 4C, 4D, and S4B). This initial difference in body weight gain decreased over time (Figure 4D). Similarly, food intake did not differ between control and Pnoc KO mice when exposed to NCD (Figures 4E and 4F), while it was significantly decreased in Pnoc KO mice compared to controls during the first 3 days of HFD feeding (Figures 4G and 4H). However, after 4 weeks of HFD feeding, no difference in food intake was observable (Figures 4I and 4J). Notably, this initial reduction in HFD intake resulted in decreased fat mass after 4 weeks of HFD feeding (Figures 4K, 4L, and S4C). Pnoc KO mice also showed a trend toward increased water consumption (Figures S4D–S4F). In addition, we found unaltered respiratory exchange ratio (RER) and locomotor activity between the groups of mice (Figures S4G–S4L).
PNOCARC Neurons Densely Innervate the ARC
We next investigated the projection pattern of PNOCARC neurons and compared it to that of AgRP and POMC neurons. PNOC-Cre, AgRP-Cre, and POMC-Cre mice were stereotaxically injected in the ARC with an adeno-associated virus (AAV) allowing for Cre-dependent expression of channelrhodopsin-2 (ChR2) fused to mCherry (AAV-DIO-ChR2-mCherry) (Figure 5A). Assessment of the distribution of mCherry-positive PNOCARC fibers revealed dense local arborizations within the ARC (Figure 5A). The dense PNOCARC fibers within the ARC largely overlapped with the localization of POMC neuron cell bodies, but not with AgRP neurons (Figure 5A). Moreover, we observed PNOCARC projections to other brain areas, including the BNST, similar to what was observed for AgRP and POMC fibers (Figure 5A). In contrast, while both AgRP and POMC neurons densely innervate the paraventricular nucleus of the hypothalamus (PVN), we did not detect PVN-projecting PNOCARC fibers (Figure 5A). Moreover, while AgRP and POMC neurons more densely innervate the LHA and dorsal raphe nucleus (DR), there were less prominent projections of PNOCARC neurons detectable in these regions (Figure 5A).
Figure 5.

PNOCARC Neurons Densely Innervate the ARC and Monosynaptically Inhibit POMC Neurons
(A) Injection of AAV-ChR2-mCherry into the ARC. Cre-dependent ChR2 expression in neuronal projections (ChR2-mCherry) of PNOC-Cre, Agrp-Cre, and Pomc-Cre mice (n = 4). (a) ARC, (b) anterior bed nucleus of the stria terminals (BNST), (c) paraventricular nucleus of the hypothalamus (PVN), (d) lateral hypothalamic area (LHA)/dorsal premammillary nucleus (PMD), and (e) dorsal raphe nucleus (DR). Scale bar, 200 μm.
(B) Schematic (left) and representative traces of light-evoked IPSCs recorded from POMC neurons in PNOC-Cre::POMC-IRES-EGFP mice expressing ChR2 in PNOCARC neurons (n = 12).
(C) Schematic (top) and representative traces of sIPSCs recorded from POMC neurons in POMC-IRES-EGFP mice.
(D and E) Frequency (D) and amplitude (E) of sIPSCs in POMC neurons from NCD-fed (n = 18) or HFD-fed (n = 21) mice.
∗p < 0.05, ∗∗p < 0.01, and ∗∗∗p < 0.001 as determined by 2-tailed, unpaired Student’s t test.
See also Figure S5.
To investigate the downstream effects of activating PNOCARC neurons, we used positron emission tomography (PET) coupled with photostimulation of PNOCARC neurons in anesthetized mice. This allowed us to measure changes in regional brain glucose metabolism in response to acute photostimulation. We found reduced glucose metabolism in the BNST and in the amygdala and other feeding regulatory centers, such as the LHA (Rossi et al., 2019), zona incerta (Zhang and van den Pol, 2017), and the lateral septum (Sweeney and Yang, 2016; Figures S5A and S5B) in response to the activation of PNOCARC neurons, indicating the inhibition of neuronal activity in feeding-regulatory projection sites, including the BNST, which receives prominent projections from these cells.
PNOCARC Neurons Monosynaptically Inhibit POMC Neurons
Since PNOCARC neurons form local innervation in the ARC overlapping with the localization of POMC neurons (Figure 5A) and GABAergic tone regulates POMC neuron activity (Dicken et al., 2015, Newton et al., 2013, Vong et al., 2011), we determined whether PNOCARC neurons provide direct inhibitory input into anorexigenic POMC neurons. To probe local connectivity between PNOCARC and POMC neurons, we performed ChR2-assisted circuit mapping (CRACM; Atasoy et al., 2008, Petreanu et al., 2007). To this end, we injected AAV-DIO-ChR2-mCherry into the ARC of PNOC-Cre::POMC-IRES-EGFP mice (Figure S5C) and recorded light-evoked inhibitory postsynaptic currents (IPSCs) in POMC neurons (Figure 5B). We readily detected robust light-evoked IPSCs in all (12 of 12) of the POMC neurons tested (Figure 5B). The light-evoked IPSCs were completely blocked by bath application of the GABAA-receptor antagonist bicuculline (Figure 5B). Thus, PNOCARC neurons synaptically release GABA onto POMC neurons in the ARC. Since acute HFD feeding robustly increased the activity and excitability of PNOCARC neurons (Figure 1), we investigated whether GABAergic input to POMC neurons is affected upon HFD feeding. Three days of HFD feeding markedly increased both the frequency and the amplitude of spontaneous GABAergic IPSCs (sIPSCs) in POMC neurons (Figures 5C–5E). Thus, short-term HFD feeding caused a marked increase in GABAergic tone onto POMC neurons paralleled by the activation of PNOCARC neurons, which provides strong GABAergic input onto POMC neurons.
Optogenetic PNOCARC Neuron Activation Promotes Feeding
To investigate the functional role of PNOCARC neurons in feeding regulation, we crossed PNOC-Cre mice with animals, allowing for Cre-dependent expression of the excitatory opsin ChR2. Optical fibers were implanted above the ARC of PNOC-Cre ChR2-positive mice to selectively photostimulate PNOCARC neurons (Figure S6A). Blue light illumination at the onset of the dark phase and during daytime increased NCD food intake in PNOC-Cre ChR2-positive mice (Figures 6A, 6B, S6B, and S6C) concomitant with a significant shift in RER and an increase in water intake (Figures S6D–S6F). In contrast, in the absence of photostimulation, food intake and water consumption did not differ between the two groups of mice (Figures 6C, 6D, S6G, and S6H). In contrast, when we stimulated PNOCARC neurons in fasted mice, PNOCARC neuron activation failed to alter water intake (Figures S6I and S6J). Moreover, photostimulation of PNOCARC neurons increased HFD intake alongside a shift in RER (Figures 6E, 6F, and S6K). Again, in the absence of laser stimulation, food intake did not differ between the two groups of mice (Figures 6G and 6H).
Figure 6.

Optogenetic PNOCARC Neuron Activation Promotes Feeding
Data are plotted as cumulative food intake over time and total food intake after the stimulation period (16 h).
(A) Cumulative food intake with photostimulation on NCD (n = 12/11).
(B) Total food intake on NCD.
(C) Cumulative food intake without photostimulation on NCD (n = 12/11).
(D) Total food intake without photostimulation on NCD.
(E) Cumulative food intake with photostimulation after 3 days of HFD feeding (n = 11/11).
(F) Total food intake (3 days of HFD feeding).
(G) Cumulative food intake without stimulation after 2 days of HFD feeding (n = 11/11).
(H) Total food intake without stimulation (2 days of HFD feeding).
(I) Cumulative food intake with photostimulation of PNOCARC-LHA projections (NCD, n = 6/7).
(J) Total food intake (PNOCARC-LHA projections).
(K) Cumulative food intake without photostimulation of PNOCARC-LHA projections (n = 6/7).
(L) Total food intake without photostimulation (PNOCARC-LHA projections).
(M) Cumulative food intake with photostimulation of PNOCARC-BNST projections (NCD, n = 6/7).
(N) Total food intake (PNOCARC-BNST projections).
(O) Cumulative food intake without photostimulation of PNOCARC-BNST projections (n = 6/7).
(P) Total food intake without photostimulation (PNOCARC-BNST projections).
∗p < 0.05, ∗∗p < 0.01, and ∗∗∗p < 0.001 as determined by 2-tailed, unpaired Student’s t test.
See also Figure S6.
Since the activation of food intake-stimulating AgRP neurons had been demonstrated to act as a negative valence teaching signal (Betley et al., 2015), we performed photostimulation of PNOCARC neurons in a place-preference/aversion setup. However, the activation of PNOCARC cells failed to induce aversive or appetitive behavior either upon acute stimulation or repeated conditioning (Figures S6L and S6M). Furthermore, upon photostimulation of PNOCARC neurons, no acute effects on glucose homeostasis or insulin sensitivity were observed (Figures S6N and S6O).
Because PNOC neurons project locally within the ARC and to other brain regions, we aimed at investigating the potential contribution of PNOCARC → LHA and PNOCARC → BNST projections in mediating the food intake-stimulatory effect of optogenetic PNOCARC neuron activation. To this end, we injected AAV-DIO-ChR2-EYFP (enhanced yellow fluorescent protein) into the ARC of PNOC-Cre mice (Figure S6P) and implanted optical fibers either above the LHA or the BNST (Figures S6Q and S6R). While photostimulation of PNOCARC → LHA fibers had no effect on food intake (Figures 6I–6L), the stimulation of PNOCARC → BNST projections potently increased food intake (Figures 6M–6P)
The activation of PNOCARC neurons increases feeding, and while these neurons provide inhibitory input on anorexigenic POMC neurons within the ARC, part of this effect is mediated through PNOCARC → BNST projections.
Ablation of PNOCARC Neurons Protects from HFD-Induced Obesity
To investigate the necessity of PNOCARC neurons in feeding regulation, we bilaterally injected PNOC-Cre or wild-type littermate control animals with an AAV, allowing for Cre-dependent expression of activated caspase-3 (AAVCasp) in the ARC to selectively ablate PNOCARC neurons (Figures 7A and S7A). Assessment of Pnoc mRNA expression via in situ hybridization revealed the expected reduction of PNOC expression in the ARC of PNOC-Cre mice, but not in control animals (Figures 7B and S7B). Expression of Pomc mRNA in the ARC was unchanged between the groups (Figure S7C). Three weeks following viral injection, a cohort of mice was exposed to HFD feeding. Body weight and food intake between AAVCasp-injected PNOC-Cre mice compared to AAVCasp-injected control animals did not differ 2 weeks following virus injection upon NCD feeding (Figures 7C, S7D, and S7E). When we then switched the animals from NCD to HFD, AAVCasp-injected PNOC-Cre mice exhibited a reduced body weight gain as compared to AAVCasp-injected control animals (Figure 7C). After 3 days of HFD feeding, we found a significant reduction in food intake (Figures 7D–7G). Here, we also found a significantly increased caloric intake for the AAVCasp-injected control animals on acute HFD compared to their previous NCD intake, whereas this acute overeating was abrogated in the AAVCasp-injected PNOC-Cre mice (Figures 7F and 7G). After 5 weeks of HFD feeding, the AAVCasp-injected PNOC-Cre mice showed significantly reduced body weights (Figure 7C) and a trend toward reduced adiposity (Figures 7H and 7I). Furthermore, we found significantly reduced food intake even after 5 weeks of HFD feeding (Figures S7F and S7G). In a separate cohort, AAVCasp-injected PNOC-Cre mice and control animals remained on NCD. Here, the animals showed no difference in body weight (Figure 7J). When we compared the activation of POMC neurons, the ablation of PNOCARC neurons clearly increased the proportion of Fos-expressing POMC neurons in HFD-fed mice compared to control mice on the same diet (Figure 7K). Quantification of PNOC expressing cells showed a significant positive correlation with the number of PNOC neurons in the ARC and body weight gain on HFD (Figures 7L and S7H).
Figure 7.

Ablation of PNOCARC Neurons Protects from HFD-Induced Obesity
(A) Injection of AAV-flex-taCasp3-TEVp into the ARC of PNOC-Cre and littermate WT control animals.
(B) Representative confocal images of in situ hybridization of Pnoc mRNA (green) and DAPI staining (blue). Scale bar, 200 μm.
(C) Body weight of PNOCARC ablated mice. Mice were fed an HFD after 3 weeks postsurgery (n = 10/9).
(D) Cumulative food intake during 3 days of HFD feeding (n = 8/9).
(E) Total food intake after 3 days of HFD feeding (n = 8/9).
(F) Food intake of AAVCasp-injected control animals on NCD and after 3 days of HFD feeding (n = 8/9).
(G) Food intake of AAVCasp-injected PNOC-Cre mice on NCD and after 3 days of HFD feeding (n = 8/9).
(H) Representative images of CT scans of AAVCasp-injected PNOC-Cre mice and control animals after 5 weeks of HFD. Yellow, fat tissue; blue, non-adipose soft tissue.
(I) Fat mass of AAVCasp-injected PNOC-Cre mice and control animals after 5 weeks of HFD (n = 6/5).
(J) Body weight of PNOCARC ablated mice. Mice were fed a NCD postsurgery (n = 9/8).
(K) Quantification of Fos-positive POMC neurons after 5 weeks of HFD feeding (n = 10/9).
(L) Correlation of body weight gain during 5 weeks of HFD feeding and the average number of Pnoc neurons per section and hemisphere (Pearson correlation is reported, n = 10/9).
∗p < 0.05, ∗∗p < 0.01, and ∗∗∗p < 0.001 as determined by 2-way RM ANOVA with Sidak’s multiple comparisons test (C and J), by 2-tailed, unpaired Student’s t test (E–G, I, and K). To assess the correlation between 2 variables, Pearson’s correlation coefficient for normally distributed data was used (L).
See also Figure S7.
Discussion
Deterioration of energy homeostasis initiated by the consumption of highly palatable, calorie-dense food represents a key step in the development of obesity. Here, we demonstrate that the consummatory aspect of palatable food is regulated via a newly identified population of PNOC neurons in the ARC. This finding is in line with the recent identification of PNOC neurons in the central amygdala (CeA), which are activated by palatable food consumption (Hardaway et al., 2019). However, in contrast to the results obtained in our study, the activation of PNOC cell bodies in the CeA or their axons in the ventral BNST, parabrachial nucleus (PBN), and nucleus of the solitary tract (NTS) induces reward behavior but failed to promote the feeding of palatable food (Hardaway et al., 2019). Thus, PNOC neurons appear to be activated at different sites in the CNS to control distinct aspects of HFD-induced hyperphagia (i.e., increased food consumption via PNOCARC neurons and increased food-associated reward as controlled via PNOC neurons in the CeA).
Rodents placed on an HFD show a transient increase in food intake (Thaler et al., 2012). Using whole-body Pnoc KO mice, we find abrogation of acute hyperphagia and reduced body weight gain during the first week of HFD feeding. This indicates that Pnoc-expressing circuitries play key integrative roles in acute hyperphagia and the development of obesity. These findings are consistent with previous reports on attenuated HFD-binge eating behavior upon treatment with the selective nociceptin receptor (NOP) antagonist SB-612111 (Hardaway et al., 2016) and reduced overconsumption of palatable high-energy diet upon treatment with the NOP antagonist LY2940094 (Statnick et al., 2016). In fat-preferring rats, intracerebroventricular (i.c.v.) administered nociceptin exhibited a hyperphagic response, whereas sucrose-preferring or “neutral” rats did not increase the intake of preferred diets (Olszewski et al., 2002). Moreover, icv injection of nociceptin induced acute hyperphagia in satiated rats (Pomonis et al., 1996), and more recently, it was shown that intra-ARC injections of nociceptin increased energy intake, which was further potentiated by exposure to HFD (Hernandez et al., 2019). The latter finding is consistent with our observation that the optogenetic activation of PNOCARC neurons increases the intake of NCD and HFD.
Although we demonstrate through multiple complementary approaches that PNOCARC neurons are robustly activated upon short-term HFD feeding, the exact mechanism underlying this regulation clearly deserves future study. We show that PNOCARC neurons are strongly activated by rising extracellular glucose concentrations, and within 3 days of acute HFD feeding, a large proportion of these cells exhibits attenuated sensitivity to decreased extracellular glucose concentrations. Our previous studies revealed that short-term feeding of HFD during the same time range reduces brain glucose uptake via suppression of GLUT-1-expression in blood-brain barrier vascular endothelial cells (Jais et al., 2016). Thus, an altered ability to reduce PNOCARC neuron firing in response to lowered extracellular glucose concentrations may lead to the excitation of these neurons under such conditions and thus promote their activity. Therefore, defining the molecular basis of altered glucose sensing under conditions in which glucose availability is reduced may point toward a new mechanistic basis of altered feeding circuit regulation in obesity. In addition, we reveal that a subset of PNOC neurons are inhibited by leptin. Direct leptin action on POMC and AgRP neurons was shown to play only a small role in controlling energy balance (van de Wall et al., 2008). Our finding is in line with a report that shows that leptin, acting directly on presynaptic GABAergic neurons, many of which do not express AgRP, reduces inhibitory tone to postsynaptic POMC neurons (Vong et al., 2011). Clearly, future studies must address the physiological diet-dependent regulation of PNOCARC neurons using in vivo calcium imaging.
We define PNOCARC neurons as a previously functionally uncharacterized class of feeding-regulatory neurons in the ARC. We further reveal a clear GABAergic signature of PNOCARC neurons and find a minor overlap of PNOC and POMC neurons (11.0%), which is in line with a report that showed a 13.9% overlap between PNOC and POMC neurons in the ARC (Maolood and Meister, 2010). Consequently, we define them as distinct from the well-characterized feeding-promoting Agrp- or Th-expressing cells in the ARC, also consistent with the notion that although AgRP neurons promote feeding upon chemogenetic or optogenetic activation, they are dispensable for an appropriate feeding response to palatable food (Denis et al., 2015). In fact, our in-depth molecular profiling in conjunction with single-cell sequencing data define them as a class of ARC neurons characterized by Htr3b expression.
Previous work has shown the activation of AgRP neuron firing upon 2–6 days of short-term HFD feeding (Wei et al., 2015). In this study, the authors demonstrate that while long-term HFD feeding abolishes the ability of leptin to inhibit AgRP neurons (Baver et al., 2014), leptin still normally inhibits AgRP neuron firing upon short-term HFD feeding (Wei et al., 2015). Consistent with this, AgRP and PNOCARC neurons are active in the fasting state of lean NCD-fed mice, and both types of neurons are inhibited upon 1 h of refeeding in NCD-fed mice. Here, the acute suppression of AgRP neurons is more profound compared to that of PNOCARC neurons as assessed via Fos expression. Remarkably, in 3 days HFD-fed mice, fasting-induced AgRP neuron activation is blunted, indicating that AgRP neurons are capable of sensing the energy state of the organism and adapt their activity during an early phase of HFD intake. This is also consistent with the study by Wei et al. (2015), revealing normal leptin sensitivity under these conditions. Nevertheless, PNOCARC neurons upon short-term HFD feeding retain their activity and lose their ability to suppress their activity upon refeeding. In addition, our phosphoribotrap approach failed to identify AgRP neurons as chronically activated upon 3 days of HFD feeding. Thus, although AgRP neurons can also increase their firing upon short-term HFD feeding, they apparently retain the ability to sense transitions in feeding state, while PNOCARC neurons lose their regulation and become activated upon short-term HFD feeding.
Regarding the downstream effector circuitry of feeding stimulation via activation by PNOCARC neurons, we find that the inhibition of POMC neurons is driven by direct monosynaptic GABAergic output of PNOCARC neurons. This finding is consistent with a clear enhancement of IPSCs on POMC neurons upon short-term HFD feeding. In contrast, AgRP neurons do not contribute a significant source of spontaneous GABA input to POMC neurons, which indicates that other GABAergic cells play an important role in spontaneous inhibitory modulation of POMC neurons (Rau and Hentges, 2017). In addition, a role for the NOP in the inhibition of POMC neuronal activity was reported. Bath application of nociceptin reversibly hyperpolarized and decreased firing in POMC neurons via a NOP-mediated mechanism (Hernandez et al., 2019). Furthermore, nociceptin-induced presynaptic inhibition of glutamatergic input onto POMC neurons observed in wild-type mice was absent in NOP KO mice (Farhang et al., 2010). In addition to the PNOCARC-dependent inhibition of POMC neurons, bath application of nociceptin potently suppressed activity in LepRb-expressing ventromedial hypothalamic (VMH) neurons (Chee et al., 2011). Therefore, nociceptin acts as an orexigenic factor by suppressing VMH output, and future studies are warranted to investigate the link between PNOCARC and VMH neurons. The activation of POMC neurons is enhanced in mice with selective ablation of PNOCARC neurons upon HFD feeding, revealing the functional relevance of these cells in the control of POMC neuron function upon HFD feeding. In addition, our experiments reveal that PNOCARC → BNST projections also contribute to the feeding stimulatory effect of optogenetic PNOCARC neuron activation.
Our data reveal that PNOCARC neurons represent a neuronal population distinct from AgRP- and POMC-expressing cells, which is activated upon short-term HFD feeding, that these neurons provide strong inhibitory input on POMC neurons, and that upon photostimulation these cells also increase food intake via projections to the BNST. Selective ablation of these cells reduces feeding and body weight gain upon HFD feeding but not in NCD-fed mice. Thus, we define the PNOCARC neuronal signaling as a critical pathway underlying the instatement of hyperphagia upon short-term HFD feeding.
STAR★Methods
Key Resources Table
| REAGENT or RESOURCE | SOURCE | IDENTIFIER |
|---|---|---|
| Antibodies | ||
| Phospho-S6 (Ser244, Ser247) Polyclonal Antibody | Thermo Fisher Scientific | Cat# 44-923G, RRID:AB_2533798 |
| Heintz Lab TRAP anti-GFP 19F7 antibody | Heintz Lab; Rockefeller University (Heiman et al., 2008) | Cat# Htz-GFP-19F7, RRID:AB_2716736 |
| Heintz Lab TRAP anti-GFP 19C8 antibody | Heintz Lab; Rockefeller University (Heiman et al., 2008) | Cat# Htz-GFP-19C8, RRID:AB_2716737 |
| Goat anti-Rabbit IgG (H+L) Cross-Adsorbed Secondary Antibody, Alexa Fluor 594 | Thermo Fisher Scientific | Cat# A-11012, RRID:AB_2534079 |
| Bacterial and Virus Strains | ||
| AAV-flex-taCasp3-TEVp | UNC Vector core, plasmid a gift from Nirao Shah | In Stock AAV Vectors (plasmid: Addgene Cat# 45580) |
| pAAV-EF1a-double floxed-hChR2(H134R)-mCherry-WPRE-HGHpA (AAV1) | Addgene, plasmid a gift from Karl Deisseroth | Addgene, Cat# 20297-AAV1 |
| pAAV-EF1a-double floxed-hChR2(H134R)-EYFP-WPRE-HGHpA (AAV1) | Addgene, plasmid a gift from Karl Deisseroth | Addgene, Cat# 20298-AAV1 |
| Chemicals, Peptides, and Recombinant Proteins | ||
| IgG-free BSA | Sigma Aldrich/Merck | Cat# A2058 |
| Cycloheximide | AppliChem | Cat# A0879,0001 |
| Nonident P40 | AppliChem | Cat# A1694,0250 |
| HEPES | AppliChem | Cat# A1069,0250 |
| KCl | Sigma Aldrich/Merck | Cat# P9541 |
| RNasin | Promega | Cat# N2511 |
| DHPC | Avanti Polar Lipids | Cat# 850306P |
| DTT | AppliChem | Cat# A1101,0005 |
| Complete Mini, EDTA-free | Sigma Aldrich/Merck | Cat# 11836170001 |
| PhosSTOP (Phosphatase Inhibitor Cocktail) | Sigma Aldrich/Merck | Cat# 04906845001 |
| Leptin | Sigma Aldrich/Merck | Cat# L3772 |
| D-Mannitol | AppliChem | Cat# A4831 |
| Amphotericin B | Sigma Aldrich/Merck | Cat# A4888 |
| Bicuculline methiodide | Sigma Aldrich/Merck | Cat# 14343 |
| Picrotoxin | Sigma Aldrich/Merck | Cat# P1675 |
| DL-2-amino-5-phosphonopentanoic acid (DL-AP5) | Biotrend | Cat# BN0086 |
| 6-cyano-7-nitroquinoxaline-2,3-dione (CNQX) | Sigma Aldrich/Merck | Cat# C127 |
| Critical Commercial Assays | ||
| RNAscope Multiplex Fluorescent Reagent Kit v2 | Advanced Cell Diagnostics | Cat# 323100 |
| Probe Mm-Pnoc | Advanced Cell Diagnostics | Cat# 437881 |
| Probe Mm-Pomc | Advanced Cell Diagnostics | Cat# 314081 |
| Probe Mm-Agrp | Advanced Cell Diagnostics | Cat# 400711 |
| Probe Mm-Slc32a1 | Advanced Cell Diagnostics | Cat# 319191 |
| Probe Mm-Th | Advanced Cell Diagnostics | Cat# 317621 |
| Probe Mm-Fos | Advanced Cell Diagnostics | Cat# 316921 |
| Probe Mm-Lepr | Advanced Cell Diagnostics | Cat# 402731 |
| RNeasy Micro kit | QIAGEN | Cat# 74004 |
| Agilent RNA 6000 Pico Kit | Agilent | Cat# 5067-1513 |
| Deposited Data | ||
| Phosphoribotrap RNA Seq raw and analyzed data | This paper | GSE137737 |
| PNOC BacTRAP RNA Seq raw and analyzed data | This paper | GSE137626 |
| Gene expression in 20,921 individual cells in and around the adult mouse Arc-ME using Drop-seq | Campbell et al., 2017 | GSE90806 |
| Experimental Models: Cell Lines | ||
| C57BL/6N-PRX-B6N | Jackson Laboratory | Stock No: 012448 |
| ES-Bruce 4 | Dr. Frank Koentgen | N/A |
| Experimental Models: Organisms/Strains | ||
| Mouse: C57BL/6N | Charles River Laboratories | Strain code: 027 |
| PNOC-Cre | This paper | N/A |
| POMC-IRES-EGFP | This paper | N/A |
| Tg(Pnoc-EGFP)#Uze | Zeilhofer HU, University of Zurich (Smith et al., 2020) | MGI:5426015 |
| Tg(Pnoc-EGFP/Rpl10a)GM64Htz | Zeilhofer HU, University of Zurich (Doyle et al., 2008) | MGI:5496695 |
| ROSA26loxSTOPloxChR2(H134R)-EYFP-WPRE | Jackson Laboratory (Madisen et al., 2012) | Stock No: 012569, RRID:IMSR_JAX:012569 |
| POMC-Cre | Jackson Laboratory (Balthasar et al., 2004) | Stock No: 005965, RRID:IMSR_JAX:005965 |
| AgRP-IRES-EGFP | Jackson Laboratory (Tong et al., 2008) | Stock No: 012899 RRID:IMSR_JAX:012899 |
| Oligonucleotides | ||
| 5screen5pnoc: CAGATTCTGTATCTATAATTTG ATGGATTTGG |
Eurogentech Germany | N/A |
| 3Cre5screen: ATGTTTAGCTGGCCCAAATGTT GCTGGATAGT |
Eurogentech Germany | N/A |
| 5screen5neo: GGGCCAGCTCATTCCTCCCAC TCATGATCTATAGA |
Eurogentech Germany | N/A |
| 3screen3pnoc: GCTCAGTTCTCTGCTCCTTTG GTTTACTGGTG |
Eurogentech Germany | N/A |
| Software and Algorithms | ||
| R | The R Foundation for Statistical Computing, Institute for Statistics and Mathematics, University of Economics and Business, Vienna, Austria | https://www.r-project.org |
| Halo Image Analysis Platform | Indica labs | https://www.indicalab.com/halo/ |
| Fiji | ImageJ/Fiji | https://fiji.sc/ |
| Spike2 | Cambridge Electronic Design | http://ced.co.uk/ |
| Igor Pro 6 | Wavemetrics | https://www.wavemetrics.com |
| Patchmaster | HEKA | https://www.heka.com |
| pClamp/Clampfit | Molecular Devices | https://www.moleculardevices.com/ |
| GraphPad Prism | GraphPad | https://www.graphpad.com/scientific-software/prism/ |
| ExpeData | Sable Systems | https://www.sablesys.com |
| Vinci | Max Planck Institute for Metabolism Research | https://vinci.sf.mpg.de/ |
| Other | ||
| Maintenance Diet (NCD) | Ssniff Spezialdiäten | Cat# R/M-H |
| Control Diet (NCD) | Ssniff Spezialdiäten | Cat# EF D12450B |
| High-Fat Diet (HFD) | Ssniff Spezialdiäten | Cat# EF D12492-(I) |
| Protein A Dynabeads | Invitrogen | Cat# 10001 |
| SuperFrost Plus Gold slides | Thermo Fisher | Cat# K5800AMNT72 |
| Vectashield Antifade Mounting Medium with DAPI | Vector Laboratories | Cat# H-1200 |
Resource Availability
Lead Contact
Additional information and requests for resources or reagents used in this paper should be directed and will be fulfilled by the Lead Contact, Jens C. Brüning (bruening@sf.mpg.de).
Materials Availability
Mouse lines generated in this study are available from the Lead Contact with a completed Materials Transfer Agreement.
Data and Code Availability
Raw and fully processed RNA-Seq data from the phosphoribotrap screen are available at GEO accession number GSE137737. Raw and fully processed RNA-Seq data from BacTRAP-based ribosomal profiling of PNOC neurons are available at GEO accession number GSE137626. All data and code are available upon reasonable request.
Experimental Model and Subject Details
Animal Care
All animal procedures were conducted in compliance with protocols approved by local government authorities (Bezirksregierung Köln). Permission to maintain and breed mice was issued by the Department for Environment and Consumer Protection - Veterinary Section, Köln, North Rhine-Westphalia, Germany. All animal procedures were performed in accordance with NIH guidelines. Mice were housed in individually ventilated cages (IVCs) at 22°C–24°C using a 12-hour light/dark cycle. Animals had access to water and food ad libitum. Food was only withdrawn if required for an experiment during defined fasting periods. Sex is a significant modifier of the impact of HFD (Ingvorsen et al., 2017), therefore all experiments have been performed in male mice (If not stated otherwise).
Animal Diets
Mice had ad libitum access to either a normal chow-diet (R/M-H; Ssniff Diet) containing 57% of calories from carbohydrates, 34% calories from protein and 9% calories from fat, a control-diet (NCD; EF D12450B; Ssniff Diet) containing 67% of calories from carbohydrates, 20% of calories from protein and 13% of calories from fat, or a high-fat diet (HFD; EF D12492-(I); Ssniff Diet) containing 21% calories from carbohydrates, 19% calories from protein and 60% calories from fat. Fasting/refeeding experiments: 8-week-old male C57BL/6N mice were obtained from Charles River, France and acclimatized to the facility for 14 days prior to the experiment. Fasting cohorts were fasted for 8 hours (after being fed either NCD or HFD for 3 days). Refeeding cohorts were fasted for 8 hours (after being fed either NCD or HFD for 3 days) and refed for 1 hour with their respective diet.
Mouse lines
C57BL/6N - This mouse line was obtained from Charles River, France.
BAC-transgenic PNOC-eGFP (B6.FVB-Tg(pnoc-EGFP)Uze, MGI:5426015) carrying a eGFP expression cassette introduced into the start codon of BAC RPCI 452H11 were used for electrophysiology experiments.
PNOC-L10a-eGFP (Tg(Pnoc-EGFP/Rpl10a)GM64Htz, MGI:5496695) mice were used for BacTRAP experiments.
For experiments enabling photostimulation of PNOC neurons, mice homozygous for a ROSA26loxSTOPloxChR2(H134R)-EYFP-WPRE conditional allele were bred to PNOC-Cre mice and the resulting Pnoctg/wt::ChR2fl/wt (Pnoc ChR2) and Pnocwt/wt::ChR2fl/wt (control) mice were used for experiments. ROSA26loxSTOPloxChR2(H134R)-EYFP-WPRE) (Madisen et al., 2012) with a conditional allele (Ai32) were obtained from Jackson Laboratory (stock# 012569).
For CRACM experiments, PNOC-Cre mice were crossed with POMC-IRES-eGFP mice (see ‘Generation of POMC-IRES-eGFP Mice’).
POMC-Cre - This line has previously been described (Balthasar et al., 2004) and was obtained from Jackson Laboratory (stock# 005965). Mice were bred to C57BL/6N mice from Charles River, France, to maintain the line in the facility of the Max Planck Institute for Metabolism Research, Cologne, Germany.
AgRP-IRES-Cre - This line has previously been described (Tong et al., 2008). Mice were bred to C57BL/6N mice from Charles River, France, to maintain the line in the facility of the Max Planck Institute for Metabolism Research, Cologne, Germany.
Method Details
Generation of PNOC-Cre mice
To generate PNOC-Cre knock in mice, a targeting vector was designed that replaces exon 2, containing the ATG translation start-site of Pnoc, with Cre. To this end TW1 plasmid containing Cre and neo/kana resistance cassette was used to insert PCR amplified left arm of homology (LAH) and right arm of homology (RAH). 2576 bp LAH was amplified from B6Ng01-327O03 BAC using oligos 5KpnLAHpnoc: GGTACCGCGATCGCAGAGGGCTGGAGAGTTATCTCA and 3SalLAHpnoc: GTCGACGCAGCAGTGGGAATCGGGAG. Subsequently, LAH was cloned into TW1 via Kpn1/Sal1 digest. Furthermore, 4.7 kb RAH was amplified from B6Ng01-327O03 BAC using oligos 5AscRAHpnoc: GGCGCGCCAAAATCCTCTTTTGTGACGTTCTG and 3SacIIRAHpnoc: CCGCGGAAGAGATAAGTCTAGAGGCCACT and inserted into LAH containing TW1 plasmid via Asc1/SacII digest. 30μg of Pnoc targeting vector was transfected into 107 Bruce 4 ES cells that upon G418 selection were screened by long range PCR for correct integration using 5′ screening of 3.11 kb with oligos 5screen5pnoc: CAGATTCTGTATCTATAATTTGATGGATTTGG and 3Cre5screen: ATGTTTAGCTGGCCCAAATGTTGCTGGATAGT For correct 3′ integration, we screened to obtain a 4.99 kb band with oligos 5screen5neo: GGGCCAGCTCATTCCTCCCACTCATGATCTATAGA and 3screen3pnoc: GCTCAGTTCTCTGCTCCTTTGGTTTACTGGTG ES cell clones positive for both PCRs were used in Southern blot analysis of EcoRV digested clonal DNA to obtain a single 11 kb band when single integrated. Correct targeted clones were injected into donor blastocysts to generate chimeric mice that were further bred for germline transmission. Animals heterozygous for PNOC-Cre were crossed with mice expressing Flp-recombinase in the germline to remove neo cassette flanked by FRT sites.
Generation of POMC-IRES-eGFP mice
POMC-IRES-eGFP mice were created using standard protocols for generating knockin IRES-Cre mice. Specifically, to target IRES-eGFP to the Pomc gene, recombineering techniques were used (Copeland et al., 2001). A PCR amplicon containing an optimized internal ribosome entry sequence (IRES) fused to an enhanced green fluorescent protein (eGFP) sequence, followed by a FRT-flanked neomycin selection cassette, was first inserted 3 bp after the Pomc stop codon within a Pomc BAC genomic clone (bMQ314d20) obtained from the Source BioScience. The targeting construct containing the eGFP and FRT-flanked neomycin selection cassette, along with 4kb of upstream and downstream Pomc genomic DNA sequence (i.e., the homology arms), was then lifted out from the BAC clone using reverse recombineering. The resulting targeting construct was then transfected into mouse ESCs (C57BL/6N-PRX-B6N #1, The Jackson Laboratory). Drug-selection was used to enrich for targeted clones, which were then identified by long range PCR, and injected into C57BL/6 blastocysts. Chimeric animals from blastocyst implantation were bred for germline-line transmission of the targeted Pomc gene. Animals heterozygous for the targeting event were crossed with mice expressing Flp-recombinase in the germline (Farley et al., 2000) to remove neo cassette flanked by FRT sites (Rossi et al., 2011, Tong et al., 2008).
Ribosome Immunoprecipitations (Phosphoribotrap)
Ribosome immunoprecipitations were performed according to Knight et al. (2012) with minor modifications. Protein A Dynabeads (150 μL per IP, Invitrogen) were loaded with 5 μg of pS6 antibody (Phospho-S6 (Ser244, Ser247) Polyclonal Antibody, Invitrogen, 44-923G, RRID:AB_2533798) in Buffer A (10 mM HEPES [pH 7.4], 150 mM KCl, 5 mM MgCl2, 1% NP40, 0.05% IgG-free BSA) at 4°C overnight. Beads were washed three times with Buffer A immediately before use. 10-week-old male C57/BL6N mice were put either on a NCD or a high fat diet for 3 days. Afterward, mice were sacrificed by cervical dislocation. The hypothalamus was rapidly dissected using a stainless steel brain matrix (World Precision Instruments) and immediately frozen in liquid nitrogen. Hypothalamic tissues were pooled (8 per IP, 4 IPs per condition) in a homogenization cylinder (Sartorius) and resuspended in 1.35 mL of buffer C (10 mM HEPES [pH 7.4], 150 mM KCl, 5 mM MgCl2, 2 mM DTT, 100 U/ml RNasin, 100 μg/ml cycloheximide, protease and phosphatase inhibitor cocktails [1 tablet of cOmplete mini EDTA-free protease inhibitor cocktail/7ml and 2 tablets of PhosSTOP/10ml]). Samples were homogenized 2 times at 250 rpm, and 9 times at 750 rpm on a rotating glass/teflon potter homogenizer (Potter S, Braun) at 4°C. Homogenates were transferred to low binding microcentrifuge tubes (Nonstick, RNase-free microfuge tubes, 1.5 ml, Ambion, Invitrogen) and centrifuged at 2,000xg for 10 min at 4°C. The supernatant was transferred to a new tube on ice, and to this solution was added 90 μl of 10% NP40 and 90 μl of DHPC (Avanti Polar Lipids: 100 mg/0.69 ml). This solution was mixed, incubated on ice for 2 min and then centrifuged at 17,000xg for 10 min at 4°C. The resulting supernatant was transferred to a new tube. A 25 μl aliquot was removed, transferred to a separate tube, flash frozen in liquid nitrogen and stored at 80°C for purification as input RNA. The remainder was used for immunoprecipitation (IP). Immunoprecipitations were allowed to proceed 10 minutes at 4°C during constant rotation. The beads were then washed four times with buffer D (10 mM HEPES [pH 7.4], 350 mM KCl, 5 mM MgCl2, 2 mM DTT, 1% NP40, 100 U/ml RNasin, and 100 μg/ml cycloheximide). After the final wash the RNA was eluted by addition of buffer RLT (350 μL) to the beads at RT, allowed to incubate at RT for 5 minutes, the beads removed by magnet, and the RNA purified using the RNeasy Micro Kit (QIAGEN). RNA integrity was assessed using an Agilent 2100 bioanalyzer. The extracted RNA of one replicate from the NCD-fed group was used for quality control and testing for enrichment of activity marker genes.
BacTRAP-based ribosomal profiling of hypothalamic PNOC neurons
Affinity purification of translating ribosomes was performed as described by Heiman et al., 2014, Heiman et al., 2008) with minor modifications. 10-12 week old male and female PNOC-L10a-eGFP mice were put either on a NCD or a high fat diet for 3 days. Afterward, mice were sacrificed by cervical dislocation. The hypothalamus was rapidly dissected using a stainless steel brain matrix (World Precision Instruments) and immediately frozen in liquid nitrogen. Protein A Dynabeads (375 μl, Invitrogen per IP) were washed three times in 0.15M KCl IP wash buffer (20 mM HEPES [pH 7.4], 5 mM MgCl2, 150 mM KCl, 1% NP40, 0.5 mM DTT and 100 μg/ml cycloheximide). Beads were resuspended in 275 μl 0.15M KCl IP wash buffer and were loaded with 50 μg of 19C8 and 50 μg of 19F7 (Cat# Htz-GFP-19F7, RRID:AB_2716736 and Htz-GFP-19C8, RRID:AB_2716737, Memorial Sloan Kettering Monoclonal Antibody Facility) and incubated with slow end-over-end mixing at 4°C overnight. Pooled hypothalamic tissue (4 pooled mice per sample; 4 samples per group) was homogenized in lysis buffer (20 mM HEPES [pH 7.4], 5 mM MgCl2, 150 mM KCl, 0.5 mM DTT, 40 U/ml RNasin, 100 μg/ml cycloheximide, protease and phosphatase inhibitor cocktails [1 tablet of cOmplete mini EDTA-free protease inhibitor cocktail/7 mL and 2 tablets of PhosSTOP/10 ml]) 2 times at 250 rpm, and 9 times at 750 rpm on a rotating glass/teflon potter homogenizer (Potter S, Braun) at 4°C. Homogenates were transferred to low binding microcentrifuge tubes (Nonstick, RNase-free microfuge tubes, 1.5 ml, Ambion, Invitrogen) and centrifuged at 2,000xg for 10 min at 4°C. The supernatant was transferred to a new tube on ice, and 1/9 sample volume 10% NP-40 (final concentration: 1%) and 1/9 sample volume 300 mM DHPC (final concentration: 30 mM) was added. This solution was mixed, incubated on ice for 2 min and then centrifuged at 17,000xg for 10 min at 4°C. The resulting supernatant was transferred to a new tube, and a 25 μl aliquot was removed, transferred to a new tube, flash frozen in liquid nitrogen and stored at 80°C for purification as input RNA. 200 μl of antibody-bound beads were added (800-1000 μl supernatant) and incubated at 4°C for one hour with end-over-end mixing. Beads were collected with a magnet and resuspended in 1000 μl of 0.35 M KCl IP wash buffer (20 mM HEPES [pH 7.4], 5 mM MgCl2, 350 mM KCl, 1% NP40, 0.5 mM DTT, 100 μg/ml cycloheximide). Beads were washed three more times with 1000 μl of 0.35 M KCl IP wash buffer. After the final wash the beads were collected with a magnet and the supernatant removed. The RNA was eluted by addition of buffer RLT (350 μL) to the beads, allowed to incubate at RT for 5 minutes and RNA was purified subsequently using the RNeasy Micro Kit (QIAGEN). RNA integrity was assessed using an Agilent 2100 bioanalyzer.
Sequencing
Due to low amount of input material, pre-amplification using the Ovation RNASeq System V2 was performed. Total RNA was used for first strand cDNA synthesis, using both poly(T) and random primers, followed by second strand synthesis and isothermal strand-displacement amplification. For library preparation, the Illumina Nextera XT DNA sample preparation protocol was used, with 1 ng cDNA input. After validation (Agilent 2200 TapeStation) and quantification (Invitrogen Qubit System) all transcriptome libraries were pooled. The pool was quantified using the Peqlab KAPA Library Quantification Kit and the Applied Biosystems 7900HT Sequence Detection and sequenced on an Illumina HiSeq 4000 sequencing instrument with a 2x75bp paired-end read length. The RNA sequencing pipeline utilizes the GRCm38 assembly of the mouse genome as gene sets from Ensembl release 92 (Yates et al., 2016). We quantified the gene expression of each sample by (1) aligning the RNA-sequencing reads to the mm10 reference genome using hisat 2.1.0 (Kim et al., 2015), (2) computationally depleted rRNA reads using samtools 1.8.0 (Li et al., 2009), and (3) transcript assembly and quantification using the cufflinks 2.2.1 suite (Trapnell et al., 2010). To normalize the ribosomal pulldown (IP) to the hypothalamic background (Input) per sample, we calculated a ratio of the gene abundance level (reported in Fragments Per Kilobase Million, FPKM) using the formula . For overlap analysis single-cell RNA-sequencing data of 20,921 cells from the hypothalamic arcuate-median eminence complex (Campbell et al., 2017) was used. Cells were clustered using the R Seurat package (Butler et al., 2018). The resulting 20 cell type specific clusters were analyzed for the expression of the top 100 most enriched transcripts from the phosphoribotrap screen. An overlap with Pnoc mRNA was found in the neuronal clusters a17.Neurons5 and a18.Neurons6. Gene annotations and pathway analysis were performed using Ingenuity Pathway Analysis (QIAGEN).
Immunohistochemistry
For immunohistochemistry assays, mice were deeply anesthetized and perfused transcardially with phosphate-buffered saline (PBS) followed by 4% paraformaldehyde (PFA). Brains were postfixed for 8 hours at 4°C and transferred to 25% sucrose in PBS for 2-3 days. 20-μm thick sections were processed for immunofluorescence as described below. Brain sections were washed (2 × 10 min) with PBS 0.1 M (pH 7.4) and incubated in blocking solution (PBS containing 0.3% Triton X-100, 3% goat serum) for 60 minutes at room temperature. Sections were incubated with the primary antibody (p-S6, rabbit, 44-923, 1:250, Thermo Fisher/Invitrogen) overnight at 4°C, washed 3 times with PBS + 0.1% Triton X-100 for 10 minutes each and incubated with the secondary antibody (Alexa 594, A11012, 1:500, Thermo Fisher/Invitrogen) for 60 minutes at room temperature, protected from light. The slides were washed 3 times with PBS + 0.1% Triton X-100 and mounted using Vectashield Antifade Mounting Medium with DAPI (Vector Laboratories). To ensure comparable immunostaining, sections were processed together under identical conditions.
Fluorescence in situ hybridization
Deeply anaesthetized mice were perfused transcardially with phosphate-buffered saline (pH 7.4) followed by 4% paraformaldehyde (PFA) dissolved in phosphate-buffered saline (pH 7.4). The brain was removed from the skull and post-fixed in 4% PFA at room temperature (RT) overnight, and then moved to 25% sucrose solution (in 1X PBS) at 4°C for 2-3 days. 14 μm thick sections were processed as described below. Detection of Pnoc, Fos, Agrp, Pomc, Slc32a1, Th and Lepr mRNA was performed using a fluorescent in situ hybridization technique (RNAscope, Advanced Cell Diagnostics) according to the manufacturer’s instructions. The Pnoc probe (Cat no. 437881) contained 20 oligo pairs and targeted region 325 - 1263 (Acc. No. NM_010932.2) of the Pnoc transcript. 3-plex negative and 3-plex positive control probes were processed in parallel with the target probes. All incubation steps were performed at 40°C using the ACD HybEz hybridization system (Cat No. 321462). Sections were mounted on SuperFrost Plus Gold slides (ThermoFisher), dried at RT, briefly rinsed in autoclaved Millipore water, air-dried and baked at 60°C overnight. A section from the same region of the brain was also mounted for use with the negative control probe to enable calculation of background signal. Afterward, slides were submerged in Target Retrieval (Cat No. 322000) at 98.5-99.5°C for 8 min, followed by two brief rinses in autoclaved Millipore water. The slides were dehydrated in 100% ethanol and allowed to air dry for 5 min. A hydrophobic barrier was then created around the sections using an ImmEdge hydrophobic barrier pen (Cat No. 310018). Sections were incubated with Protease III (Cat No. 322340) for 35 min. The subsequent hybridization, amplification and detection steps were performed according to the manufacturer’s instructions (Multiplex Fluorescent Detection kit v2, Cat No. 323110). Sections were coverslipped and counterstained with DAPI with Vectashield Antifade Mounting Medium (Vector Laboratories) and stored at 4°C in the dark.
Imaging and quantification
Images were captured using a confocal Leica TCS microscope, equipped with 10x/0.30 dry and 20x/0.75 immersion objectives. Laser intensities for the probe channels were kept constant throughout the imaging process. Images of the ARC were captured from rostral to caudal, rendering approximately 5 sections per animal. Images were imported into Fiji (NIH), where the DAPI channel was enhanced regarding brightness and contrast, but the probe channels were left unmodified. The images were then imported into the Halo software (Indica Labs) for quantification of labeled neurons. The software uses the DAPI fluorescence signal for cellular identification and calculates the cell intensity for each cell and probe. The threshold for probe recognition was calculated as the mean cell intensity present in the negative control sections + 3 x standard deviation (SD).
Electrophysiology
Experiments were performed on brain slices from 8-12 week-old male and female PNOC-eGFP mice that expressed enhanced green fluorescent protein (eGFP) selectively in prepronociceptin (PNOC) neurons. Animals were either fed normal chow diet or a high fat diet for three consecutive days and nights. The animals were decapitated and coronal slices (270 – 300 μm) containing the ARC, LHA or BNST were cut with a vibration microtome (HM-650 V; Thermo Scientific, Walldorf, Germany) under cold (4°C), carbogenated (95% O2 and 5% CO2), glycerol-based modified artificial cerebrospinal fluid (GaCSF). GaCSF contained (in mM): 244 Glycerol, 2.5 KCl, 2 MgCl2, 2 CaCl2, 1.2 NaH2PO4, 10 HEPES, 21 NaHCO3, and 5 Glucose adjusted to pH 7.2 with NaOH. If not mentioned otherwise, the brain slices were continuously superfused with carbogenated aCSF at a flow rate of ~2.5 ml/min. aCSF contained (in mM): 125 NaCl, 2.5 KCl, 2 MgCl2, 2 CaCl2, 1.2 NaH2PO4, 21 NaHCO3, 10 HEPES, and 5 Glucose adjusted to pH 7.2 with NaOH. To reduce synaptic input, it contained 10−4 M PTX (picrotoxin, P1675, Sigma Aldrich), 5 × 10⁻⁵ M DL-AP5 (DL-2-amino-5-phosphonopentanoic acid, BN0086, Biotrend), and 10−5 M CNQX (6-cyano-7-nitroquinoxaline-2,3-dione, C127, Sigma-Aldrich).
Current-clamp recordings of PNOC-eGFP mice were performed at ~32°C in the perforated patch clamp configuration. Neurons were visualized with a fixed stage upright microscope (BX51WI, Olympus, Hamburg, Germany) using 40x and 60x water-immersion objectives (LUMplan FL/N 40x, 0.8 numerical aperture, 2 mm working distance; LUMplan FL/N 60x, 1.0 numerical aperture, 2 mm working distance, Olympus) with infrared differential interference contrast optics and fluorescence optics. PNOC-eGFP neurons were identified by their anatomical location in the ARH and by their eGFP fluorescence that was visualized with an X-Cite 120 illumination system (EXFO Photonic Solutions, Ontario, Canada) in combination with a Chroma 41001 filter set (EX: HQ480/40x, BS: Q505LP, EM: HQ535/50 m, Chroma, Rockingham, VT, USA). Electrodes with tip resistances between 4 and 6 MΩ were fashioned from borosilicate glass (0.86 mm inner diameter; 1.5 mm outer diameter; GB150-8P; Science Products) with a vertical pipette puller (PP-830; Narishige, London, UK). All recordings were performed with an EPC10 patch-clamp amplifier (HEKA, Lambrecht, Germany) controlled by the program PatchMaster (version 2.32; HEKA). In parallel, data were recorded using a micro1410 data acquisition interface and Spike 2 (version 7) (both from CED, Cambridge, UK). Data were sampled at 25 kHz and low-pass filtered at 2 kHz with a four-pole Bessel filter. The calculated liquid junction potential of 14.6 mV between intracellular and extracellular solution was compensated or subtracted offline (calculated with Patcher’s Power Tools plug-in from https://www.mpibpc.mpg.de/groups/neher/index.php?page=software for IGOR Pro 6 (Wavemetrics, Lake Oswego, OR, USA)).
Recordings were performed with pipette solution containing (in mM): 140 K-gluconate, 10 KCl, 10 HEPES, 0.1 EGTA, 2 MgCl2 adjusted to pH 7.2 with KOH. ATP and GTP were omitted from the intracellular solution to prevent uncontrolled permeabilization of the cell membrane. The patch pipette was tip filled with internal solution and back filled with internal solution, which contained the ionophore to achieve perforated patch recordings and 0.02% tetramethylrhodamine-dextran (3000 MW, D3308, Invitrogen, Eugene, OR, USA) to monitor the stability of the perforated membrane. Amphotericin B (A4888; Sigma) was dissolved in dimethyl sulfoxide to a concentration of 40 μg/μl (DMSO; D8418, Sigma). The used DMSO concentration (0.1%–0.3%) had no obvious effect on the investigated neurons. The ionophore was added to the modified pipette solution shortly before use. The final concentration of amphotericin B was ~120–180 μg/mL. Amphotericin solutions were prepared from undissolved weighted samples (stored at 4°C protected from light) on every recording day. During the perforation process access resistance (Ra) was constantly monitored and experiments were started after Ra had reached steady state (~15–20 min) or the action potential amplitude was stable.
After the electrophysiological experiments, perforated-patch recordings were converted to the whole-cell configuration and biocytin was allowed to diffuse into the cell for at least 30 s. Biocytin-streptavidin labeling (1:500 streptavidin-Alexa Fluor 633, S21375, Invitrogen) combined with GFP immunohistochemistry (1:1000 chicken polyclonal anti-GFP, ab13970, abcam; 1:500 goat anti-chicken Alexa Fluor 488, ab150173, abcam) was performed as previously described (Hausen et al., 2016). For the overviews shown in Figure 1D slices were stained for GFP only. Fluorescence images were captured with a confocal microscope (SP8, Leica) equipped with PL APO 10x/0.40, PL APO 20x/0.75 IMM and PL APO 63/1.2 objectives. Scaling, z-projections and adjustments of brightness and contrast were done using ImageJ/Fiji.
Glucose and leptin sensitivity
Glucose sensitivity was analyzed with perforated patch clamp recordings and protocols modified from Claret et al. (2007). Glucose sensitivity was assessed lowering the extracellular glucose concentration stepwise from 5 mM to 0.1 mM. D-Mannitol (A4831, AppliChem, Germany) was used to adjust osmolarity. The effect of changes in glucose concentration or leptin (100 nM; L3772, Sigma-Aldrich, Taufkirchen, Germany) was measured after 25-30 min when the spike frequency or membrane potential had stabilized. To test the significance of the responses of individual neurons, means and standard deviations of action potential frequency and membrane potential were calculated from 12 bins each 10 s long. Significance was accepted at p ≤ 0.001 in paired t tests.
ChR2-assisted circuit mapping (CRACM)
PNOC-Cre::POMC-IRES-eGFP mice were unilaterally injected with pAAV-EF1a-double floxed-hChR2(H134R)-mCherry-WPRE-HGHpA (AAV1) in the ARC and allowed 3 weeks for virus expression. Mice were decapitated and brains were quickly removed into ice-cold cutting solution consisting of (in mM): 92 choline chloride, 30 NaHCO3, 25 Glucose, 20 HEPES, 10 MgSO4, 2.5 KCl, 1.25 NaH2PO4, 5 sodium ascorbate, 3 sodium pyruvate, 2 thiourea, 0.5 CaCl2; oxygenated with 95% O2/5% CO2; measured osmolarity 310–320 mOsm/L. 300 μm thick coronal sections were cut with a Campden vibratome (Model 7000smz-2) and incubated in oxygenated cutting solution at 34 °C for 10 min. Slices were transferred to oxygenated aCSF (consisting of (in mM): 126 NaCl, 21.4 NaHCO3, 2.5 KCl, 1.2 NaH2PO4, 1.2 MgCl2, 2.4 CaCl2, 10 glucose) at 34 °C for 30 min, and stored in the same solution at room temperature (20–24 °C) for at least 60 min prior to recording. A single slice was placed in the recording chamber where it was continuously superfused at a rate of 3–4 mL per min with oxygenated aCSF. Neurons were visualized with an upright microscope (SliceScope, Scientifica) equipped with infrared-differential interference contrast and fluorescence optics. Borosilicate glass microelectrodes (3-5 MΩ) were filled with a Cs+-based internal solution consisting of (in mM): 135 CsMeSO3, 10 HEPES, 1 EGTA, 4 MgCl2, 4 Na2-ATP, 0.4 Na2-GTP, 10 Na2-phosphocreatine (pH 7.3 adjusted with CsOH; 295 mOsm/L). To photostimulate ChR2-expressing PNOCARC cell bodies and terminals, an LED light source (473 nm) was focused onto the back aperture of the microscope objective, producing widefield exposure around recorded cells. Light-evoked IPSCs were recorded from GFP-positive POMC neurons in whole-cell voltage-clamp mode, with membrane potential clamped at Vh = 0 mV. At the end of the recordings, bicuculline (10 μM) was added to the aCSF to block GABAergic synaptic transmission. All recordings were made using a Multiclamp 700B amplifier, and data were filtered at 2 kHz and digitized at 10 kHz. The light-evoked IPSC detection protocol consisted of four blue light pulses (473 nm wavelength, 5 ms) administered 1 s apart during the first 4 s of an 8 s sweep. Evoked IPSCs with short latency (< 10 ms) upon light stimulation and low jitter were considered light-driven. Light output was controlled by a programmable pulse stimulator, Master-8 (A.M.P.I.) and pClamp software (Axon Instruments). All recordings were analyzed offline using Clampfit.
sIPSCs in POMC neurons
POMC-IRES-eGFP mice were either fed NCD or HFD for 3 days prior to the experiment. Brain slices were prepared as outlined above (ChR2-assisted circuit mapping) and sIPSCs recordings from POMC neurons were obtained in voltage-clamp mode at Vh = −70 mV. Borosilicate glass microelectrodes (3-5 MΩ) were filled with a CsCl-based internal solution consisting of (in mM): 140 CsCl, 2 NaCl, 10 HEPES, 5 EGTA, 2 MgCl2, 0.5 CaCl2, 2 Na-ATP, 0.5 Na-GTP, 2 QX-314, pH of 7.3 with CsOH). sIPSCs were recorded in presence of CNQX (10 μM) to block glutamatergic synaptic transmission. Recordings with an Ra change of > 20% were discarded from analysis. sIPSC frequency and mean peak amplitude were determined using WinEDR (version 3.8.6). The entire duration of each analyzed recording was manually inspected (1-2 minute duration).
Stereotaxic surgical procedures
For all stereotaxic surgeries, animals were anesthetized with isoflurane and placed into a stereotaxic apparatus. For pain relief and postoperative care, mice were injected with buprenorphine (0.1 mg/kg) and meloxicam (5 mg/kg). Post-surgery, animals received tramadol in the drinking water (1 mg/mL), were inspected twice daily and body weight was monitored to ensure regain of pre-surgery weight.
Fiber implantation
Optical fibers (fiber core = 200 μm, NA = 0.48, flat tip; Doric Lenses Inc.) were implanted unilaterally over the ARC (coordinates from bregma AP: −1.45 mm, DV: −5.5, ML: 0) and fixed to the skull using dental acrylic.
For projection stimulation experiments PNOC-Cre and control mice were unilaterally injected (coordinates from bregma AP: −1.45 mm; ; ML: −0.20 mm; DV: −5.87 mm) with 25 nL pAAV-EF1a-double floxed-hChR2(H134R)-EYFP-WPRE-HGHpA (AAV1). For stimulation of BNST projections optical fibers were implanted unilaterally over the BNST (coordinates from bregma AP: 0.45; ML: −0.50; DV: −3.8). For stimulation of LHA/PMD projections optical fibers were implanted over the LHA/PMD (coordinates from bregma AP:-2.5; ML: −0.5; DV: −4.6).
Viral injections
For PNOCARC projection mapping 25 nL of pAAV-EF1a-double floxed-hChR2(H134R)-EYFP-WPRE-HGHpA (AAV1) was unilaterally injected into the ARC (coordinates from bregma AP: −1.45 mm; ML: ± 0.20 mm; DV: −5.95 mm). Mice with missed injections or expression outside the ARC were excluded from analysis after post hoc examination of EYFP expression.
For CRACM experiments, 10-15 nL of pAAV-EF1a-double floxed-hChR2(H134R)-mCherry-WPRE-HGHpA (AAV1) was unilaterally injected into the ARC (coordinates from bregma AP: −1.45 mm; ML: ± 0.20 mm; DV: −5.95 mm) of PNOC-Cre::POMC-IRES-eGFP mice.
75 nL of AAV expressing AAV-flex-taCasp3-TEVp (2.8 x10¹² particles/ml) was bilaterally injected into the ARC (coordinates from bregma AP: −1.45 mm; ML: ± 0.20 mm; DV: −5.95 mm) and the pipette was withdrawn 5 min after injection.
In vivo optogenetic studies
A fiber optic cable was firmly attached to the implanted fiber optic cannula. ChR2-Pnoc and control ChR2-wild-type mice were acclimated to this procedure in their experimental cages for one week prior to optogenetic stimulation. Blue laser light stimulation (473 nm, output power of 15 mW at the tip of the patch cord) consisting of pulse trains (5 ms pulses of 20 Hz; 1 s on, 3 s off) was delivered. For photostimulation of PNOCARC projections to the LHA/PMD and BNST blue laser light stimulation (473 nm, output power of 10 mW at the tip of the patch cord) consisting of pulse trains (5 ms pulses of 20 Hz; 1 s on, 3 s off) was delivered. The location of the fiber tip was identified using histology of the brain tissue. Mice with fiber placement outside of the target region were excluded from analysis.
Indirect Calorimetry
Indirect calorimetry was performed using an indirect calorimetry system from TSE systems (PhenoMaster, TSE systems). Mice were placed in training cages for three days prior to data acquisition to adapt to the pellet and liquid dispensers of the system. For the measurement mice were placed in regular type II cages with sealed lids at room temperature (22°C) and allowed to adapt to the chambers for at least 24 hours. Food and water were provided ad libitum. All parameters were measured continuously and simultaneously.
Indirect calorimetry during optogenetic stimulation was performed using an indirect calorimetry system from Sable Systems (Promethion, Sable Systems, Las Vegas, NV). Mice were placed in the calorimetric cages for three days prior to data acquisition to adapt to the pellet and liquid dispensers of the system. Food and water were provided ad libitum. Obtained raw data was processed using ExpeData v. 1.9.22 (Sable Systems, Las Vegas, NV) using an analysis script for data transformation.
Real time place preference/aversion test
Real time place preference/aversion test was performed in a custom-built wooden enclosure (30x50x20 cm), consisting of two interconnected chambers. The experiment was conducted in two sessions, 30 min each (baseline recording on the day 1 and a stimulation session two days later). During the baseline session, mice were connected to the patchords and placed in the enclosure, but no laser light was delivered. During the stimulation session, optogenetic stimulation consisted of 1 s of blue light pulses (473 nm, 5 ms pulse width, 20 Hz) followed by 1 s of delay. For optogenetic stimulation, the patch cord was connected to a 473-nm diode-pumped solid-state laser (R471005FX, Laserglow Technologies) with an FC/PC adaptor. The stimulation was delivered by the AnyMaze behavior tracking software (Stoelting, USA) when animal entered one of the compartments (stimulation compartment) until the mouse crossed back into the non-stimulation side. The stimulation compartment was assigned in a counterbalanced manner. Behavioral data was recorded using the Digital USB 2.0 CMOS Camera (The Imaging Source Europe GmbH, Germany), scored and analyzed in AnyMaze.
Conditioned place preference/aversion test
Conditioned place preference/aversion test was conducted using a 4 days protocol as described previously (Tan et al., 2012, Zhang et al., 2015) in a three-chambered setup. It was performed in a custom-built wooden enclosure, consisting of two chambers (30x20x20 cm each) with distinct wall features, and separated by a corridor (30x10x20 cm). The experiment consisted of 4 sessions (15 min baseline recording on the Day 1; conditioning sessions, 30 min each, on Day 2 and 3; 15 min test on Day 4). During the conditioning sessions, optogenetic stimulation consisted of 1 s of blue (473 nm) light pulses (5 ms pulse width, 20 Hz) followed by 1 s of delay and was activated when the animal entered the conditioned chamber. The conditioned chamber was assigned in a counterbalanced manner. For optogenetic stimulation, the patch cord was connected to a 473-nm diode-pumped solid-state laser (R471005FX, Laserglow Technologies) with an FC/PC adaptor. The stimulation was delivered by the Any-Maze behavioral tracking software (Stoelting Co, the USA). Behavioral data was recorded using the Digital USB 2.0 CMOS Camera (The Imaging Source Europe GmbH, Germany), scored and analyzed in Any-Maze and GraphPad Prism.
PET Imaging
PET imaging was performed as described in Jais et al. (2016) using an Inveon preclinical PET/CT system (Siemens). Mice were anesthetized with 2% isoflurane in 65%/35% nitrous oxide/oxygen gas and positioned on a dedicated mouse carrier (MEDRES, Germany) carrying two mice. A fiber optic cable was firmly attached to the implanted fiber optic cannula. For injection of the radiotracer, a catheter consisting of a 30G cannula connected to a polythene tubing (ID = 0.28 mm) was inserted into the tail vein and fixated by a drop of glue. After starting the PET scan, 7-8 MBq of [18F]FDG in 50-100 μL saline were injected per mouse and blue laser (473 nm) light stimulation (output power of 15 mW) consisting of pulse trains (5 ms pulses of 20 Hz; 1 s on, 3 s off) was delivered. Emission data were acquired for 45 minutes. Thereafter, animals were automatically moved into the CT gantry and a CT scan was performed (180 projections/360°, 200 ms, 80 kV, 500 μA). The CT data were used for attenuation correction of the PET data and the CT image of the scull was used for image co-registration. Plasma glucose levels were determined from a tail vein blood sample using a standard glucometer (Bayer) after removing the tail vein catheters. PET data were histogrammed in time frames of 12x30s, 3x60s, 3x120s, 7x240s, Fourier rebinned, and images were reconstructed using the MAP-SP algorithm provided by the manufacturer. For co-registration the imaging analysis software Vinci was used (Cízek et al., 2004). Images were co-registered to a 3D mouse brain atlas constructed from the 2D mouse brain atlas published by Paxinos (Paxinos et al., 2013). An image-derived input function was extracted from the PET data of the aorta, which could be identified in the image of the first time frame of each animal. Input function data were corrected for partial volume effect by assuming a standardized volume fraction of 0.6 (Green et al., 1998). Parametric images of the [18F]FDG kinetic constants K1, k2, k3, and k4 were determined by a voxel-by-voxel (voxel size = 0.4 mm x 0.4 mm x 0.8 mm) fitting of data to a two- tissue-compartment kinetic model. The ratio of tissue and plasma glucose concentrations (CE/CP) is a measure for glucose transport and is given by CE/CP = K1/(k2+k3/0.26) (Backes et al., 2011, Jais et al., 2016). Since neuronal activation is accompanied by increased glucose transport and this parameter is less sensitive to changes in plasma glucose level, we use alterations of glucose transport (CE/CP) as surrogate for alterations in neuronal activation. Statistical testing was performed by application of a voxel-wise t test between groups. 3D maps of p values allow for identification of regions with significant differences in the parameters. From these regions we defined volumes of interest (VOIs) and performed additional statistical testing for these VOIs. For presentation only, 3D maps of p values were re-calculated on a 0.1 mm x 0.1 mm x 0.1 mm grid from the original dataset using trilinear interpolation.
Analysis of Body Composition
Body composition was analyzed using micro-computed tomography (micro-CT)-based imaging of isoflurane-anesthetized mice. Data acquisition was performed in an IVIS Spectrum CT-scanner (Calpier LifeScience, USA) using the IVIS LivingImage Software V4.3.1. Quantification of fat mass was performed with a modification of the Vinci software package 4.61.0 (Cízek et al., 2004).
Insulin tolerance test
Insulin tolerance tests (ITTs) were performed in random fed mice. Food was removed and bedding was renewed prior to starting the experiment. Blue laser (473 nm) light stimulation (output power of 15 mW) consisting of pulse trains (5 ms pulses of 20 Hz; 1 s on, 3 s off) was delivered starting 3 hours prior to the experiment and continued throughout the experiment. Blood glucose concentrations were measured from whole venous blood using an automatic glucose monitor (Contour Ascensia, Bayer HealthCare, Germany). Following determination of body weights and basal blood glucose concentrations, mice received an intraperitoneal injection of 0.75 U/kg body weight of human insulin (Insuman® Rapid, Sanofi Aventis) dissolved in saline and blood glucose concentrations were measured again at 15, 30, and 60 min post injection. Food was withdrawn over the whole course of the experiment.
Glucose tolerance test
Glucose tolerance tests (GTTs) were performed in mice that had been fasted for 16 hours overnight. Blue laser (473 nm) light stimulation (output power of 15 mW) consisting of pulse trains (5 ms pulses of 20 Hz; 1 s on, 3 s off) was delivered starting 3 hours prior to the experiment and continued throughout the experiment. Following determination of body weights and basal blood glucose concentrations, mice received an intraperitoneal injection of 20% glucose (10 mL/kg body weight; beta-pharm) and blood glucose levels were measured again at 15, 30, 60, and 120 min post injection. Blood samples for glucose measurement were collected from the tail vein. Glycemia was assessed using a Contour glucometer (Bayer).
Quantification and Statistical Analysis
The number of replicates (n) are indicated in the figure legends. For electrophysiology experiments, n represents the number of recorded neurons. For RNA sequencing experiments, n represents the number of technical replicates (details on the number of mice pooled for each replicate can be found in the ‘Ribosome Immunoprecipitations (Phosphoribotrap)’ or in the ‘BacTRAP-Based Ribosomal Profiling of Hypothalamic PNOC Neurons’ section of STAR Methods. For all other experiments, n represents the number of mice (unless otherwise stated). Data are presented as Box-whisker plots or as violin plots with upper and lower quartile, median, the minimum and maximum values. For all statistical tests, significance was measured against an alpha value of 0.05 unless otherwise stated. ∗ p < 0.05, ∗∗ p < 0.01, ∗∗∗ p < 0.001. All error bars show s.e.m. No statistical methods were used to predetermine sample sizes, but group sizes commonly applied in murine studies were used. All statistical analyses were performed using GraphPad Prism software unless noted otherwise. Electrophysiology analysis was performed with Spike2 (version 7; Cambridge Electronic Design Ltd., Cambridge, UK), Igor Pro 6 (Wavemetrics, Portland, OR, USA) and Graphpad Prism (version 5.0b; Graphpad Software Inc., La Jolla, CA, USA). If not stated otherwise, all calculated values are expressed as means ± SEM (standard error of the mean). For pairwise comparisons of dependent and independent normal distributions paired and unpaired t tests were used, respectively. For pairwise comparisons of independent, not normal distributions Mann-Whitney U-test was used. Tests were executed using GraphPad Prism 5 (GraphPad Software Inc., La Jolla, CA, USA). Neurons with action potential frequencies below 0.5 Hz were defined as silent.
Acknowledgments
We thank Jens Alber, Pia Scholl, Nadine Spenrath, Denise Roggan, Christian Heilinger, Andreas Beyrau, Julia Goldau, Änne Lautenschlager, Helmut Wratil, Anke Lietzau, and Patrick Jankoswski for excellent technical help. Furthermore, we thank Dr. Ursula Lichtenberg, Dr. Hella Brönneke, and Dr. Ramona Braun for administrative help. We are grateful for the technical support for RNA sequencing experiments provided by Dr. Janine Altmüller and Marek Franitza (Cologne Center for Genomics, University of Cologne, Germany) and Dr. Peter Frommolt and Dr. Prerana Wagle (CECAD Bioinformatics Core Facility, University of Cologne, Germany). We acknowledge the UNC Gene Therapy Vector Core (Dr. R. Jude Salmulski) for providing the flex-taCasp3-TEVp AAV vector. J.C.B. received funding within the Excellence Initiative by German Federal and State Governments (CECAD), from the National Center for Diabetes Research (DZD), and from the European Union through the European Research Council (ERC) advanced grant 742106 SYNEME.
Author Contributions
Conceptualization, A.J., L.P., and J.C.B.; Methodology, A.J., L.P., and J.C.B.; Investigation, A.J., L.P., T.S.-H., M.P., S.B., K.G., M.M., V.M., P. Klemm, P.J.M.W., A.J.V., A.L.C., and J.X.; Formal Analysis, A.J., L.P., P. Klemm, A.L.C., and H.B.; Visualization, A.J., L.P., S.B., K.G., M.M., A.L.C., and V.M.; Writing – Original Draft, A.J. and J.C.B.; Project Administration, A.J. and J.C.B.; Resources, H.U.Z., H.B., H.F., F.T.W., P. Kloppenburg, T.K., and J.C.B.; Funding Acquisition, J.C.B.
Declaration of Interests
The authors declare no competing interests.
Published: April 16, 2020
Footnotes
Supplemental Information can be found online at https://doi.org/10.1016/j.neuron.2020.03.022.
Contributor Information
Peter Kloppenburg, Email: peter.kloppenburg@uni-koeln.de.
Jens C. Brüning, Email: bruening@sf.mpg.de.
Supplemental Information
References
- Atasoy D., Aponte Y., Su H.H., Sternson S.M. A FLEX switch targets Channelrhodopsin-2 to multiple cell types for imaging and long-range circuit mapping. J. Neurosci. 2008;28:7025–7030. doi: 10.1523/JNEUROSCI.1954-08.2008. [DOI] [PMC free article] [PubMed] [Google Scholar]
- Backes H., Walberer M., Endepols H., Neumaier B., Graf R., Wienhard K., Mies G. Whiskers area as extracerebral reference tissue for quantification of rat brain metabolism using (18)F-FDG PET: application to focal cerebral ischemia. J. Nucl. Med. 2011;52:1252–1260. doi: 10.2967/jnumed.110.085266. [DOI] [PubMed] [Google Scholar]
- Balthasar N., Coppari R., McMinn J., Liu S.M., Lee C.E., Tang V., Kenny C.D., McGovern R.A., Chua S.C., Jr., Elmquist J.K., Lowell B.B. Leptin receptor signaling in POMC neurons is required for normal body weight homeostasis. Neuron. 2004;42:983–991. doi: 10.1016/j.neuron.2004.06.004. [DOI] [PubMed] [Google Scholar]
- Baver S.B., Hope K., Guyot S., Bjørbaek C., Kaczorowski C., O’Connell K.M. Leptin modulates the intrinsic excitability of AgRP/NPY neurons in the arcuate nucleus of the hypothalamus. J. Neurosci. 2014;34:5486–5496. doi: 10.1523/JNEUROSCI.4861-12.2014. [DOI] [PMC free article] [PubMed] [Google Scholar]
- Belgardt B.F., Okamura T., Brüning J.C. Hormone and glucose signalling in POMC and AgRP neurons. J. Physiol. 2009;587:5305–5314. doi: 10.1113/jphysiol.2009.179192. [DOI] [PMC free article] [PubMed] [Google Scholar]
- Betley J.N., Xu S., Cao Z.F.H., Gong R., Magnus C.J., Yu Y., Sternson S.M. Neurons for hunger and thirst transmit a negative-valence teaching signal. Nature. 2015;521:180–185. doi: 10.1038/nature14416. [DOI] [PMC free article] [PubMed] [Google Scholar]
- Blundell J.E., MacDiarmid J.I. Fat as a risk factor for overconsumption: satiation, satiety, and patterns of eating. J. Am. Diet. Assoc. 1997;97(7 Suppl):S63–S69. doi: 10.1016/s0002-8223(97)00733-5. [DOI] [PubMed] [Google Scholar]
- Brandt C., Nolte H., Henschke S., Engstrom Ruud L., Awazawa M., Morgan D.A., Gabel P., Sprenger H.G., Hess M.E., Gunther S. Food Perception Primes Hepatic ER Homeostasis via Melanocortin-Dependent Control of mTOR Activation. Cell. 2018;175:1321–1335.e20. doi: 10.1016/j.cell.2018.10.015. [DOI] [PMC free article] [PubMed] [Google Scholar]
- Butler A., Hoffman P., Smibert P., Papalexi E., Satija R. Integrating single-cell transcriptomic data across different conditions, technologies, and species. Nat. Biotechnol. 2018;36:411–420. doi: 10.1038/nbt.4096. [DOI] [PMC free article] [PubMed] [Google Scholar]
- Campbell J.N., Macosko E.Z., Fenselau H., Pers T.H., Lyubetskaya A., Tenen D., Goldman M., Verstegen A.M., Resch J.M., McCarroll S.A. A molecular census of arcuate hypothalamus and median eminence cell types. Nat. Neurosci. 2017;20:484–496. doi: 10.1038/nn.4495. [DOI] [PMC free article] [PubMed] [Google Scholar]
- Chee M.J., Price C.J., Statnick M.A., Colmers W.F. Nociceptin/orphanin FQ suppresses the excitability of neurons in the ventromedial nucleus of the hypothalamus. J. Physiol. 2011;589:3103–3114. doi: 10.1113/jphysiol.2011.208819. [DOI] [PMC free article] [PubMed] [Google Scholar]
- Chrétien C., Fenech C., Liénard F., Grall S., Chevalier C., Chaudy S., Brenachot X., Berges R., Louche K., Stark R. Transient Receptor Potential Canonical 3 (TRPC3) Channels Are Required for Hypothalamic Glucose Detection and Energy Homeostasis. Diabetes. 2017;66:314–324. doi: 10.2337/db16-1114. [DOI] [PubMed] [Google Scholar]
- Cízek J., Herholz K., Vollmar S., Schrader R., Klein J., Heiss W.D. Fast and robust registration of PET and MR images of human brain. Neuroimage. 2004;22:434–442. doi: 10.1016/j.neuroimage.2004.01.016. [DOI] [PubMed] [Google Scholar]
- Claret M., Smith M.A., Batterham R.L., Selman C., Choudhury A.I., Fryer L.G., Clements M., Al-Qassab H., Heffron H., Xu A.W. AMPK is essential for energy homeostasis regulation and glucose sensing by POMC and AgRP neurons. J. Clin. Invest. 2007;117:2325–2336. doi: 10.1172/JCI31516. [DOI] [PMC free article] [PubMed] [Google Scholar]
- Copeland N.G., Jenkins N.A., Court D.L. Recombineering: a powerful new tool for mouse functional genomics. Nat. Rev. Genet. 2001;2:769–779. doi: 10.1038/35093556. [DOI] [PubMed] [Google Scholar]
- Cowley M.A., Smart J.L., Rubinstein M., Cerdán M.G., Diano S., Horvath T.L., Cone R.D., Low M.J. Leptin activates anorexigenic POMC neurons through a neural network in the arcuate nucleus. Nature. 2001;411:480–484. doi: 10.1038/35078085. [DOI] [PubMed] [Google Scholar]
- Daly D.M., Park S.J., Valinsky W.C., Beyak M.J. Impaired intestinal afferent nerve satiety signalling and vagal afferent excitability in diet induced obesity in the mouse. J. Physiol. 2011;589:2857–2870. doi: 10.1113/jphysiol.2010.204594. [DOI] [PMC free article] [PubMed] [Google Scholar]
- Denis R.G., Joly-Amado A., Webber E., Langlet F., Schaeffer M., Padilla S.L., Cansell C., Dehouck B., Castel J., Delbès A.S. Palatability Can Drive Feeding Independent of AgRP Neurons. Cell Metab. 2015;22:646–657. doi: 10.1016/j.cmet.2015.07.011. [DOI] [PMC free article] [PubMed] [Google Scholar]
- Diano S., Liu Z.W., Jeong J.K., Dietrich M.O., Ruan H.B., Kim E., Suyama S., Kelly K., Gyengesi E., Arbiser J.L. Peroxisome proliferation-associated control of reactive oxygen species sets melanocortin tone and feeding in diet-induced obesity. Nat. Med. 2011;17:1121–1127. doi: 10.1038/nm.2421. [DOI] [PMC free article] [PubMed] [Google Scholar]
- Dicken M.S., Hughes A.R., Hentges S.T. Gad1 mRNA as a reliable indicator of altered GABA release from orexigenic neurons in the hypothalamus. Eur. J. Neurosci. 2015;42:2644–2653. doi: 10.1111/ejn.13076. [DOI] [PMC free article] [PubMed] [Google Scholar]
- Doyle J.P., Dougherty J.D., Heiman M., Schmidt E.F., Stevens T.R., Ma G., Bupp S., Shrestha P., Shah R.D., Doughty M.L. Application of a translational profiling approach for the comparative analysis of CNS cell types. Cell. 2008;135:749–762. doi: 10.1016/j.cell.2008.10.029. [DOI] [PMC free article] [PubMed] [Google Scholar]
- Farhang B., Pietruszewski L., Lutfy K., Wagner E.J. The role of the NOP receptor in regulating food intake, meal pattern, and the excitability of proopiomelanocortin neurons. Neuropharmacology. 2010;59:190–200. doi: 10.1016/j.neuropharm.2010.05.007. [DOI] [PMC free article] [PubMed] [Google Scholar]
- Farley F.W., Soriano P., Steffen L.S., Dymecki S.M. Widespread recombinase expression using FLPeR (flipper) mice. Genesis. 2000;28:106–110. [PubMed] [Google Scholar]
- Fioramonti X., Contié S., Song Z., Routh V.H., Lorsignol A., Pénicaud L. Characterization of glucosensing neuron subpopulations in the arcuate nucleus: integration in neuropeptide Y and pro-opio melanocortin networks? Diabetes. 2007;56:1219–1227. doi: 10.2337/db06-0567. [DOI] [PubMed] [Google Scholar]
- Gautron L., Elmquist J.K., Williams K.W. Neural control of energy balance: translating circuits to therapies. Cell. 2015;161:133–145. doi: 10.1016/j.cell.2015.02.023. [DOI] [PMC free article] [PubMed] [Google Scholar]
- Gaysinskaya V.A., Karatayev O., Chang G.Q., Leibowitz S.F. Increased caloric intake after a high-fat preload: relation to circulating triglycerides and orexigenic peptides. Physiol. Behav. 2007;91:142–153. doi: 10.1016/j.physbeh.2007.02.002. [DOI] [PubMed] [Google Scholar]
- Green S.M., Burley V.J., Blundell J.E. Effect of fat- and sucrose-containing foods on the size of eating episodes and energy intake in lean males: potential for causing overconsumption. Eur. J. Clin. Nutr. 1994;48:547–555. [PubMed] [Google Scholar]
- Green L.A., Gambhir S.S., Srinivasan A., Banerjee P.K., Hoh C.K., Cherry S.R., Sharfstein S., Barrio J.R., Herschman H.R., Phelps M.E. Noninvasive methods for quantitating blood time-activity curves from mouse PET images obtained with fluorine-18-fluorodeoxyglucose. J. Nucl. Med. 1998;39:729–734. [PubMed] [Google Scholar]
- Hardaway J.A., Jensen J., Kim M., Mazzone C.M., Sugam J.A., Diberto J.F., Lowery-Gionta E.G., Hwa L.S., Pleil K.E., Bulik C.M., Kash T.L. Nociceptin receptor antagonist SB 612111 decreases high fat diet binge eating. Behav. Brain Res. 2016;307:25–34. doi: 10.1016/j.bbr.2016.03.046. [DOI] [PMC free article] [PubMed] [Google Scholar]
- Hardaway J.A., Halladay L.R., Mazzone C.M., Pati D., Bloodgood D.W., Kim M., Jensen J., DiBerto J.F., Boyt K.M., Shiddapur A. Central Amygdala Prepronociceptin-Expressing Neurons Mediate Palatable Food Consumption and Reward. Neuron. 2019;102:1037–1052.e7. doi: 10.1016/j.neuron.2019.03.037. [DOI] [PMC free article] [PubMed] [Google Scholar]
- Hausen A.C., Ruud J., Jiang H., Hess S., Varbanov H., Kloppenburg P., Brüning J.C. Insulin-Dependent Activation of MCH Neurons Impairs Locomotor Activity and Insulin Sensitivity in Obesity. Cell Rep. 2016;17:2512–2521. doi: 10.1016/j.celrep.2016.11.030. [DOI] [PubMed] [Google Scholar]
- Heiman M., Schaefer A., Gong S., Peterson J.D., Day M., Ramsey K.E., Suárez-Fariñas M., Schwarz C., Stephan D.A., Surmeier D.J. A translational profiling approach for the molecular characterization of CNS cell types. Cell. 2008;135:738–748. doi: 10.1016/j.cell.2008.10.028. [DOI] [PMC free article] [PubMed] [Google Scholar]
- Heiman M., Kulicke R., Fenster R.J., Greengard P., Heintz N. Cell type-specific mRNA purification by translating ribosome affinity purification (TRAP) Nat. Protoc. 2014;9:1282–1291. doi: 10.1038/nprot.2014.085. [DOI] [PMC free article] [PubMed] [Google Scholar]
- Hernandez J., Fabelo C., Perez L., Moore C., Chang R., Wagner E.J. Nociceptin/orphanin FQ modulates energy homeostasis through inhibition of neurotransmission at VMN SF-1/ARC POMC synapses in a sex- and diet-dependent manner. Biol. Sex Differ. 2019;10:9. doi: 10.1186/s13293-019-0220-3. [DOI] [PMC free article] [PubMed] [Google Scholar]
- Ibrahim N., Bosch M.A., Smart J.L., Qiu J., Rubinstein M., Rønnekleiv O.K., Low M.J., Kelly M.J. Hypothalamic proopiomelanocortin neurons are glucose responsive and express K(ATP) channels. Endocrinology. 2003;144:1331–1340. doi: 10.1210/en.2002-221033. [DOI] [PubMed] [Google Scholar]
- Ingvorsen C., Karp N.A., Lelliott C.J. The role of sex and body weight on the metabolic effects of high-fat diet in C57BL/6N mice. Nutr. Diabetes. 2017;7:e261. doi: 10.1038/nutd.2017.6. [DOI] [PMC free article] [PubMed] [Google Scholar]
- Jais A., Brüning J.C. Hypothalamic inflammation in obesity and metabolic disease. J. Clin. Invest. 2017;127:24–32. doi: 10.1172/JCI88878. [DOI] [PMC free article] [PubMed] [Google Scholar]
- Jais A., Solas M., Backes H., Chaurasia B., Kleinridders A., Theurich S., Mauer J., Steculorum S.M., Hampel B., Goldau J. Myeloid-Cell-Derived VEGF Maintains Brain Glucose Uptake and Limits Cognitive Impairment in Obesity. Cell. 2016;165:882–895. doi: 10.1016/j.cell.2016.03.033. [DOI] [PubMed] [Google Scholar]
- Kentish S., Li H., Philp L.K., O’Donnell T.A., Isaacs N.J., Young R.L., Wittert G.A., Blackshaw L.A., Page A.J. Diet-induced adaptation of vagal afferent function. J. Physiol. 2012;590:209–221. doi: 10.1113/jphysiol.2011.222158. [DOI] [PMC free article] [PubMed] [Google Scholar]
- Kim D., Langmead B., Salzberg S.L. HISAT: a fast spliced aligner with low memory requirements. Nat. Methods. 2015;12:357–360. doi: 10.1038/nmeth.3317. [DOI] [PMC free article] [PubMed] [Google Scholar]
- Knight Z.A., Tan K., Birsoy K., Schmidt S., Garrison J.L., Wysocki R.W., Emiliano A., Ekstrand M.I., Friedman J.M. Molecular profiling of activated neurons by phosphorylated ribosome capture. Cell. 2012;151:1126–1137. doi: 10.1016/j.cell.2012.10.039. [DOI] [PMC free article] [PubMed] [Google Scholar]
- Li H., Handsaker B., Wysoker A., Fennell T., Ruan J., Homer N., Marth G., Abecasis G., Durbin R., 1000 Genome Project Data Processing Subgroup The Sequence Alignment/Map format and SAMtools. Bioinformatics. 2009;25:2078–2079. doi: 10.1093/bioinformatics/btp352. [DOI] [PMC free article] [PubMed] [Google Scholar]
- Locke A.E., Kahali B., Berndt S.I., Justice A.E., Pers T.H., Day F.R., Powell C., Vedantam S., Buchkovich M.L., Yang J., LifeLines Cohort Study. ADIPOGen Consortium. AGEN-BMI Working Group. CARDIOGRAMplusC4D Consortium. CKDGen Consortium. GLGC. ICBP. MAGIC Investigators. MuTHER Consortium. MIGen Consortium. PAGE Consortium. ReproGen Consortium. GENIE Consortium. International Endogene Consortium Genetic studies of body mass index yield new insights for obesity biology. Nature. 2015;518:197–206. doi: 10.1038/nature14177. [DOI] [PMC free article] [PubMed] [Google Scholar]
- Madisen L., Mao T., Koch H., Zhuo J.M., Berenyi A., Fujisawa S., Hsu Y.W., Garcia A.J., 3rd, Gu X., Zanella S. A toolbox of Cre-dependent optogenetic transgenic mice for light-induced activation and silencing. Nat. Neurosci. 2012;15:793–802. doi: 10.1038/nn.3078. [DOI] [PMC free article] [PubMed] [Google Scholar]
- Maolood N., Meister B. Nociceptin/orphanin FQ peptide in hypothalamic neurones associated with the control of feeding behaviour. J. Neuroendocrinol. 2010;22:75–82. doi: 10.1111/j.1365-2826.2009.01946.x. [DOI] [PubMed] [Google Scholar]
- Matschinsky F.M., Wilson D.F. The Central Role of Glucokinase in Glucose Homeostasis: A Perspective 50 Years After Demonstrating the Presence of the Enzyme in Islets of Langerhans. Front. Physiol. 2019;10:148. doi: 10.3389/fphys.2019.00148. [DOI] [PMC free article] [PubMed] [Google Scholar]
- Newton A.J., Hess S., Paeger L., Vogt M.C., Fleming Lascano J., Nillni E.A., Brüning J.C., Kloppenburg P., Xu A.W. AgRP innervation onto POMC neurons increases with age and is accelerated with chronic high-fat feeding in male mice. Endocrinology. 2013;154:172–183. doi: 10.1210/en.2012-1643. [DOI] [PMC free article] [PubMed] [Google Scholar]
- Olszewski P.K., Grace M.K., Sanders J.B., Billington C.J., Levine A.S. Effect of nociceptin/orphanin FQ on food intake in rats that differ in diet preference. Pharmacol. Biochem. Behav. 2002;73:529–535. doi: 10.1016/s0091-3057(02)00821-3. [DOI] [PubMed] [Google Scholar]
- Paeger L., Pippow A., Hess S., Paehler M., Klein A.C., Husch A., Pouzat C., Bruning J.C., Kloppenburg P. Energy imbalance alters Ca(2+) handling and excitability of POMC neurons. eLife. 2017;6:e25641. doi: 10.7554/eLife.25641. [DOI] [PMC free article] [PubMed] [Google Scholar]
- Parton L.E., Ye C.P., Coppari R., Enriori P.J., Choi B., Zhang C.Y., Xu C., Vianna C.R., Balthasar N., Lee C.E. Glucose sensing by POMC neurons regulates glucose homeostasis and is impaired in obesity. Nature. 2007;449:228–232. doi: 10.1038/nature06098. [DOI] [PubMed] [Google Scholar]
- Paxinos G., Franklin K.B.J., Franklin K.B.J. Elsevier/Academic Press; 2013. Paxinos and Franklin’s The Mouse Brain in Stereotaxic Coordinates, 4th Edition. [Google Scholar]
- Petreanu L., Huber D., Sobczyk A., Svoboda K. Channelrhodopsin-2-assisted circuit mapping of long-range callosal projections. Nat. Neurosci. 2007;10:663–668. doi: 10.1038/nn1891. [DOI] [PubMed] [Google Scholar]
- Pomonis J.D., Billington C.J., Levine A.S. Orphanin FQ, agonist of orphan opioid receptor ORL1, stimulates feeding in rats. Neuroreport. 1996;8:369–371. doi: 10.1097/00001756-199612200-00072. [DOI] [PubMed] [Google Scholar]
- Rau A.R., Hentges S.T. The Relevance of AgRP Neuron-Derived GABA Inputs to POMC Neurons Differs for Spontaneous and Evoked Release. J. Neurosci. 2017;37:7362–7372. doi: 10.1523/JNEUROSCI.0647-17.2017. [DOI] [PMC free article] [PubMed] [Google Scholar]
- Richards P., Pais R., Habib A.M., Brighton C.A., Yeo G.S., Reimann F., Gribble F.M. High fat diet impairs the function of glucagon-like peptide-1 producing L-cells. Peptides. 2016;77:21–27. doi: 10.1016/j.peptides.2015.06.006. [DOI] [PMC free article] [PubMed] [Google Scholar]
- Rossi J., Balthasar N., Olson D., Scott M., Berglund E., Lee C.E., Choi M.J., Lauzon D., Lowell B.B., Elmquist J.K. Melanocortin-4 receptors expressed by cholinergic neurons regulate energy balance and glucose homeostasis. Cell Metab. 2011;13:195–204. doi: 10.1016/j.cmet.2011.01.010. [DOI] [PMC free article] [PubMed] [Google Scholar]
- Rossi M.A., Basiri M.L., McHenry J.A., Kosyk O., Otis J.M., van den Munkhof H.E., Bryois J., Hübel C., Breen G., Guo W. Obesity remodels activity and transcriptional state of a lateral hypothalamic brake on feeding. Science. 2019;364:1271–1274. doi: 10.1126/science.aax1184. [DOI] [PMC free article] [PubMed] [Google Scholar]
- Schneeberger M., Dietrich M.O., Sebastián D., Imbernón M., Castaño C., Garcia A., Esteban Y., Gonzalez-Franquesa A., Rodríguez I.C., Bortolozzi A. Mitofusin 2 in POMC neurons connects ER stress with leptin resistance and energy imbalance. Cell. 2013;155:172–187. doi: 10.1016/j.cell.2013.09.003. [DOI] [PMC free article] [PubMed] [Google Scholar]
- Smith M.A., Choudhury A.I., Glegola J.A., Viskaitis P., Irvine E.E., de Campos Silva P.C.C., Khadayate S., Zeilhofer H.U., Withers D.J. Extrahypothalamic GABAergic nociceptin-expressing neurons regulate AgRP neuron activity to control feeding behavior. J. Clin. Invest. 2020;130:126–142. doi: 10.1172/JCI130340. [DOI] [PMC free article] [PubMed] [Google Scholar]
- Speliotes E.K., Willer C.J., Berndt S.I., Monda K.L., Thorleifsson G., Jackson A.U., Lango Allen H., Lindgren C.M., Luan J., Mägi R., MAGIC. Procardis Consortium Association analyses of 249,796 individuals reveal 18 new loci associated with body mass index. Nat. Genet. 2010;42:937–948. doi: 10.1038/ng.686. [DOI] [PMC free article] [PubMed] [Google Scholar]
- Statnick M.A., Chen Y., Ansonoff M., Witkin J.M., Rorick-Kehn L., Suter T.M., Song M., Hu C., Lafuente C., Jiménez A. A Novel Nociceptin Receptor Antagonist LY2940094 Inhibits Excessive Feeding Behavior in Rodents: A Possible Mechanism for the Treatment of Binge Eating Disorder. J. Pharmacol. Exp. Ther. 2016;356:493–502. doi: 10.1124/jpet.115.228221. [DOI] [PubMed] [Google Scholar]
- Sweeney P., Yang Y. An Inhibitory Septum to Lateral Hypothalamus Circuit That Suppresses Feeding. J. Neurosci. 2016;36:11185–11195. doi: 10.1523/JNEUROSCI.2042-16.2016. [DOI] [PMC free article] [PubMed] [Google Scholar]
- Tan K.R., Yvon C., Turiault M., Mirzabekov J.J., Doehner J., Labouèbe G., Deisseroth K., Tye K.M., Lüscher C. GABA neurons of the VTA drive conditioned place aversion. Neuron. 2012;73:1173–1183. doi: 10.1016/j.neuron.2012.02.015. [DOI] [PMC free article] [PubMed] [Google Scholar]
- Thaler J.P., Yi C.X., Schur E.A., Guyenet S.J., Hwang B.H., Dietrich M.O., Zhao X., Sarruf D.A., Izgur V., Maravilla K.R. Obesity is associated with hypothalamic injury in rodents and humans. J. Clin. Invest. 2012;122:153–162. doi: 10.1172/JCI59660. [DOI] [PMC free article] [PubMed] [Google Scholar]
- Tong Q., Ye C.P., Jones J.E., Elmquist J.K., Lowell B.B. Synaptic release of GABA by AgRP neurons is required for normal regulation of energy balance. Nat. Neurosci. 2008;11:998–1000. doi: 10.1038/nn.2167. [DOI] [PMC free article] [PubMed] [Google Scholar]
- Trapnell C., Williams B.A., Pertea G., Mortazavi A., Kwan G., van Baren M.J., Salzberg S.L., Wold B.J., Pachter L. Transcript assembly and quantification by RNA-Seq reveals unannotated transcripts and isoform switching during cell differentiation. Nat. Biotechnol. 2010;28:511–515. doi: 10.1038/nbt.1621. [DOI] [PMC free article] [PubMed] [Google Scholar]
- van de Wall E., Leshan R., Xu A.W., Balthasar N., Coppari R., Liu S.M., Jo Y.H., MacKenzie R.G., Allison D.B., Dun N.J. Collective and individual functions of leptin receptor modulated neurons controlling metabolism and ingestion. Endocrinology. 2008;149:1773–1785. doi: 10.1210/en.2007-1132. [DOI] [PMC free article] [PubMed] [Google Scholar]
- van den Top M., Lee K., Whyment A.D., Blanks A.M., Spanswick D. Orexigen-sensitive NPY/AgRP pacemaker neurons in the hypothalamic arcuate nucleus. Nat. Neurosci. 2004;7:493–494. doi: 10.1038/nn1226. [DOI] [PubMed] [Google Scholar]
- Vong L., Ye C., Yang Z., Choi B., Chua S., Jr., Lowell B.B. Leptin action on GABAergic neurons prevents obesity and reduces inhibitory tone to POMC neurons. Neuron. 2011;71:142–154. doi: 10.1016/j.neuron.2011.05.028. [DOI] [PMC free article] [PubMed] [Google Scholar]
- Warwick Z.S. Dietary fat dose dependently increases spontaneous caloric intake in rat. Obes. Res. 2003;11:859–864. doi: 10.1038/oby.2003.118. [DOI] [PubMed] [Google Scholar]
- Wei W., Pham K., Gammons J.W., Sutherland D., Liu Y., Smith A., Kaczorowski C.C., O’Connell K.M. Diet composition, not calorie intake, rapidly alters intrinsic excitability of hypothalamic AgRP/NPY neurons in mice. Sci. Rep. 2015;5:16810. doi: 10.1038/srep16810. [DOI] [PMC free article] [PubMed] [Google Scholar]
- Xu J., McNearney T.A., Chen J.D. Impaired postprandial releases/syntheses of ghrelin and PYY(3-36) and blunted responses to exogenous ghrelin and PYY(3-36) in a rodent model of diet-induced obesity. J. Gastroenterol. Hepatol. 2011;26:700–705. doi: 10.1111/j.1440-1746.2010.06563.x. [DOI] [PubMed] [Google Scholar]
- Yates A., Akanni W., Amode M.R., Barrell D., Billis K., Carvalho-Silva D., Cummins C., Clapham P., Fitzgerald S., Gil L. Ensembl 2016. Nucleic Acids Res. 2016;44(D1):D710–D716. doi: 10.1093/nar/gkv1157. [DOI] [PMC free article] [PubMed] [Google Scholar]
- Zhang X., van den Pol A.N. Rapid binge-like eating and body weight gain driven by zona incerta GABA neuron activation. Science. 2017;356:853–859. doi: 10.1126/science.aam7100. [DOI] [PMC free article] [PubMed] [Google Scholar]
- Zhang F., Tsai H.C., Airan R.D., Stuber G.D., Adamantidis A.R., de Lecea L., Bonci A., Deisseroth K. Optogenetics in Freely Moving Mammals: Dopamine and Reward. Cold Spring Harb. Protoc. 2015;2015:715–724. doi: 10.1101/pdb.top086330. [DOI] [PubMed] [Google Scholar]
Associated Data
This section collects any data citations, data availability statements, or supplementary materials included in this article.
Supplementary Materials
Data Availability Statement
Raw and fully processed RNA-Seq data from the phosphoribotrap screen are available at GEO accession number GSE137737. Raw and fully processed RNA-Seq data from BacTRAP-based ribosomal profiling of PNOC neurons are available at GEO accession number GSE137626. All data and code are available upon reasonable request.