

Abstract
Objectives
Frailty is an accumulation of deficits characterized by reduced resilience to stressors and increased vulnerability to adverse outcomes. There is evolving evidence on the health benefits of residential greenness, but little is known about its impact on frailty.
Design
A longitudinal cohort study.
Setting and participants
We included older adults aged ≥65 years from the Chinese Longitudinal Healthy Longevity Survey (CLHLS) with a 12-year follow-up.
Methods
We assessed residential greenness by calculating the Normalized Difference Vegetation Index (NDVI) in the 500 m radius around participants' residence. We used 39 self-reported health items to construct a frailty index (FI) as a proportion of accumulated deficits. We defined an FI of ≤0.21 as nonfrail and prefrail, and an FI of >0.21 as frail. We used the mixed effects logistic regression models to examine the association between residential greenness and frailty, adjusted for a number of covariates.
Results
We had 16,238 participants, with a mean age of 83.0 years (standard deviation: 11.5). The mean baseline NDVI and FI were 0.40, and 0.12, respectively. Compared to the participants living in the lowest quartile of residential greenness, those in the highest quartile had a 14% [odds ratio (OR): 0.86, 95% confidence interval (CI): 0.77, 0.97] lower odds of frailty. The association was stronger among urban vs rural residents. Additionally, each 0.1-unit increase in annual average NDVI was related to a 2% higher odds of improvement in the frailty status (OR: 1.02, 95% CI: 1.00, 1.04).
Conclusions and Implications
Our study suggests that higher levels of residential greenness are related to a lower likelihood of frailty, specifically in urban areas.
Keywords: Residential greenness, Normalized Difference Vegetation Index, frailty, healthy longevity
Frailty reflects cumulative physical, psychological, and social deficits with loss reserve and declined resistance to the stressors in the aging process.1, 2, 3 Frailty is related to higher risks of hospitalization,4 falls,5 and mortality.6 It is estimated that about 25% to 50% of adults aged ≥85 years in the world are frail.7
There is a lot of research on frailty detection,7,8 the association between frailty and adverse health outcomes,6,9 and individual intervention to prevent and improve frailty.10,11 This research mainly focuses on the individual level. The association between frailty and neighborhood-level factors like the built environment is rarely studied, although evolving evidence showed protective effects of residential greenness on population health, like lower mortality rates and fewer disabilities in activities of daily living.12,13 In Hong Kong, a cohort study of 3240 adults aged 65 years and older showed that higher levels of residential greenness could improve frailty. The association was mediated by physical activity.14 Physical activity could be the potential mechanism and was one of the most common interventions to improve frailty.15,16 In addition, frailty may influence access to residential greenness. A study in New Zealand found that the older adults who were the most frail faced a lack of resources to connect with nature.17
China has the largest number of older adults aged ≥65 years18 and has a large number of older adults who are frail. A study of the 2011-2012 survey of China Health and Retirement Longitudinal Study reported that about 51.2% and 7.0% of older adults aged ≥60 years were prefrail and frail.19 The large number of prefrail and frail older adults challenged the long-term care system in China. To our knowledge, the Hong Kong study is the only previous large-scale population-based cohort study on residential greenness and frailty.14 However, the association is unclear in the middle-income settings with a greater variation in green space like Mainland China. Our study aimed to examine the association between residential greenness and frailty among Chinese older adults aged 65 years and older.
Methods
Study Population
We used 2002, 2005, 2008, and 2011 waves (with a follow-up period between 2002 and 2014) of the Chinese Longitudinal Healthy Longevity Survey (CLHLS). Initiated in 1998, the CLHLS is a prospective longitudinal cohort study on determinants of healthy longevity in China. Follow-up surveys were conducted in 2000, 2002, 2005, 2008, 2011, 2014, and 2018. In each survey, new participants were recruited. The CLHLS used a multistage, stratified cluster design, and randomly selected 631 cities and counties as the sample sites, where the Han Chinese are the largest majority. The sample sites represent about 85% of the Chinese population. The CLHLS recruited a large sample of older adults aged 65 years and older, including both community-dwelling older adults and institutionalized older adults, from 22 of 31 provinces. The CLHLS oversampled the older adults aged ≥80 years, accounting for about 75% of the sample size. Detailed study design and sampling design could be found elsewhere.20 The survey has collected extensive data, including demographic characteristic, socioeconomic status (SES), lifestyle, physical and mental health, and health services utilization.20 We excluded the 1998 and 2000 waves because all included items used for creating the frailty index (FI) were available since the 2002 survey, and we also excluded the newly recruited participants in the 2014 and 2018 surveys because of unavailable data access.
Among 34,342 participants from the 2002-2011 wave, we excluded the participants if they were missing residential addresses (n = 17), were aged ≤65 years (n = 545), were lost to follow-up (n = 5308), or had died (n = 12,234) after the baseline survey. In total, 16,238 participants were included in the final analysis.
Greenness Assessment
We calculated the Normalized Difference Vegetation Index (NDVI) to measure the residential greenness. NDVI is a satellite image–based vegetation index that is obtained from the Moderate-Resolution Imaging Spectro-Radiometer (MODIS) in the National Aeronautics and Space Administration's Terra Satellite. In the process of photosynthesis, the plants absorb red visible light and reflect near-infrared light to scatter extra heat. NDVI is equal to the ratio of difference in reflection of visible and near-infrared light to the sum of these 2 measurements. NDVI ranges from −1.0 to 1.0, with larger values indicating higher levels of vegetative density.21,22
Based on the longitude and latitude of residential addresses, we calculated NDVI in the 500 m radius to indicate the residential greenness. Researchers have recommended 0.25 miles (about 400 m) as an optimum radius size to reflect environmental measurement of residential neighbourhood.23 A number of similar studies also used the 500 m radius as the scale of greenness exposure around the residency.24,25 MODIS has a temporal resolution of 16 days. We calculated 2 NDVI values for January, April, July, and October from 2002 to 2014 to take into consideration seasonal variation. We calculated annual average NDVI values from 2002 to 2014 to reflect time-varying residential greenness in accordance with multiple measurements of frailty. We categorized annual average NDVI values into quartiles and calculated 0.1 unit of NDVI values.
Frailty Assessment
We constructed the FI to measure frailty status. Our FI was the same as the previous CLHLS study.26 FI included 39 self-reported items, including instrumental activities of daily living, functional limitations, activities of daily living, cognitive function, self-reported health status, interviewer-rated health status, mental health, auditory and visual ability, heart rhythm, and chronic diseases. More details about the included items for calculating the FI can be found in Supplementary Table 1.26 We scored each term as 0 (absence of deficit) or 1 (presence of deficit) for 38 of 39 terms. We scored the other 1 term as 2 if the participants reported 2 or more serious illness that caused hospitalization or being bedridden in the past 2 years, such as stroke, cancer, and cataract. FI was equal to the number of reported deficits divided by the total number of included deficits. FI was a continuous variable and ranged from 0 to 1. A higher value indicated poorer frailty.26 Our FI reflected cumulative health deficits and was comparable to other studies.27,28 We also classified the continuous FI into nonfrail (FI ≤ 0.21) and frail (FI > 0.21) following a previous report.29
Covariates
We assessed a number of covariates, including age, sex, ethnicity, marital status, geographic region, urban or rural residence, education, occupation, financial support, social and leisure activity, smoking status, drinking status, and physical activity.
Demographic Characteristics
We calculated the age based on the interview dates and the verified birth dates and divided sex into males and females. We dichotomized ethnicity to Han Chinese and ethnic minorities (Hui, Korean, Manchurian, Mongolian, Yao, Zhuang, and others). We coded marital status as married and not married at the time of interview (separated or divorced, widowed, or never married). Based on the residential addresses of participants, we divided them into 7 geographical regions, including Central China (Henan, Hubei, and Hunan provinces), Eastern China (Anhui, Fujian, Jiangxi, Jiangsu, Shandong, Shanghai, and Zhejiang provinces), Northeastern China (Heilongjiang, Jilin, and Liaoning provinces), Northern China (Hebei, Shanxi, and Tianjin provinces), Northwestern China (Shaanxi Province), Southern China (Guangdong, Guangxi, and Hainan provinces), and Southwestern China (Chongqing and Sichuan provinces).
Socioeconomic Status
We dichotomized residence to urban or rural areas. The education level of our participants was relatively low. We categorized education into formal education (≥1 year of education) and no formal education (<1 year of education). We divided occupation into professional work (professional and technical personnel, government, and management) and nonprofessional work (agriculture, fishing, service, industry, and housework). We dichotomized financial support into financial independence, where participants were financially independent with their work and retirement wage, and financial dependence, where participants financially relied on other family members.
Health Behavior
We assessed social and leisure activity index by 7 activities, including gardening, personal outdoor activities excluding exercise, raising poultry or pets, reading, playing cards or mah-jongg, listening to the radio or watching TV, and participating in organized social activities. We scored each activity as 0 (no) or 1 (yes). The index ranged from 0 to 7, with higher values indicating more active social and leisure activity.30 We evaluated smoking status by the questions of “whether smoke at present,” and “whether smoked in the past.” We defined never smokers as those who neither smoked in the past nor at the time of interview, former smokers as those who smoked in the past but not at the time of interview, and current smokers as those who smoked at the time of interview. We defined never, former, and current drinkers using a similar evaluation. We evaluated physical activity by the question of “exercise or not at present.”
Statistical Analysis
We used the mixed effects logistic regression models to assess the association between annual average NDVI (both in quartiles and 0.1 unit of NDVI) and frailty (nonfrail and prefrail vs frail), adjusted for length of follow-up, age, sex, ethnicity, marital status, geographic region, urban or rural residence, education, occupation, financial support, social and leisure activity, smoking status, drinking status, and physical activity. Annual average NDVI was repeatedly measured, based on the updated residential addresses if there was any change in residence during the follow-up period. We calculated odds ratios (ORs) and 95% confidence intervals (CIs) to estimate the odds of being frail under different levels of residential greenness. We plotted cubic splines with 3 knots to visualize the curve association. In addition, we conducted a sensitivity analysis on annual average NDVI and FI at baseline using the logistic regression and mixed effects logistic regression for all participants with or without follow-up surveys. Furthermore, we conducted stratified analysis by age groups, sex, urban or rural residence, occupation (professional work vs nonprofessional work), education (formal education vs no formal education), financial support (financial independence vs financial dependence), social and leisure activity (less active vs more active), smoking status (never vs former vs current smokers), drinking status (never vs former vs current drinkers), and physical activity (yes vs no).
We used the mixed effects ordered logistic regression models to examine the relationship between annual average NDVI at time T – 1 and frailty transitions between time T – 1 and time T among the participants with follow-up surveys. We defined frailty transitions between time T – 1 and time T as deteriorated, stable, and improved in frailty status, using a definition similar to the one in the Hong Kong study.14 We defined deterioration in frailty status relative to the reference group. The regression models were adjusted for age, sex, ethnicity, marital status, geographic region, urban or rural residence, education, occupation, financial support, social and leisure activity, smoking status, drinking status, and physical activity.
We reported results of age-adjusted models and fully adjusted models, and results for quartiles of NDVI and 0.1 unit of NDVI. Missing values accounted for less than 2% of the total sample size; we assigned modal and mean values to the missing data for the categorical and continuous variables. We used STATA 14.0 (StataCorp LP, College Station, TX) for statistical analysis.
Ethical Approval
The CLHLS study was approved by the relevant Institutional Review Board. All participants signed written informed consent.
Results
Table 1 presents the baseline characteristics of CLHLS participants. We included a total of 16,238 participants. The mean age was 83.0 years [standard deviation (SD): 11.5], 60.9% were 80 years and older, 44.4% were male, and 79.9% lived in rural areas. Urban residents lived in less green areas, had higher SES, and were more physically active than their rural counterparts (Supplementary Table 2). The mean baseline NDVI and FI were 0.40 (SD: 0.15) and 0.12 (SD: 0.12), respectively. Baseline annual average NDVI values were much higher in rural areas than in urban areas (0.44 vs 0.23, P < .001). Centenarians (n = 1978) and female participants (n = 9023) had worse frailty. In addition, compared with the participants with follow-up surveys, those without follow-up surveys were older (92 vs 83 years) and more frail (0.24 vs 0.12) at baseline (Supplementary Table 3).
Table 1.
Baseline Characteristics of CLHLS Participants
| Characteristics | Total, n (%) | Baseline Annual Average NDVI | P value | Frailty Index | P value |
|---|---|---|---|---|---|
| 16,238 | 0.40 ± 0.14 | — | 0.12 ± 0.12 | — | |
| Age, y, mean ± SD | 83 ± 11.5 | — | — | — | — |
| Age group, y | <.001 | <.001 | |||
| 65-79 | 6343 (39.1) | 0.39 ± 0.15 | 0.07 ± 0.07 | ||
| 80-89 | 4665 (28.7) | 0.40 ± 0.14 | 0.11 ± 0.11 | ||
| 90-99 | 3252 (20.0) | 0.40 ± 0.14 | 0.16 ± 0.13 | ||
| ≥100 | 1978 (12.2) | 0.41 ± 0.14 | 0.24 ± 0.16 | ||
| Sex | .014 | <.001 | |||
| Male | 7215 (44.4) | 0.39 ± 0.14 | 0.09 ± 0.10 | ||
| Female | 9023 (55.6) | 0.40 ± 0.14 | 0.14 ± 0.13 | ||
| Ethnicity | <.001 | <.001 | |||
| Han Chinese | 15,226 (93.8) | 0.39 ± 0.14 | 0.12 ± 0.12 | ||
| Ethnic minority | 1012 (6.2) | 0.47 ± 0.13 | 0.10 ± 0.11 | ||
| Marital status | <.001 | <.001 | |||
| Married | 6269 (38.6) | 0.39 ± 0.15 | 0.08 ± 0.09 | ||
| Not married | 9969 (61.4) | 0.40 ± 0.14 | 0.14 ± 0.13 | ||
| Residence | <.001 | <.001 | |||
| Urban area | 3266 (20.1) | 0.23 ± 0.12 | 0.13 ± 0.13 | ||
| Rural area | 12,972 (79.9) | 0.44 ± 0.12 | 0.12 ± 0.12 | ||
| Occupation | <.001 | <.001 | |||
| Professional work | 1316 (8.1) | 0.31 ± 0.15 | 0.09 ± 0.11 | ||
| Nonprofessional work | 14,922 (91.9) | 0.40 ± 0.14 | 0.12 ± 0.12 | ||
| Education | <.001 | <.001 | |||
| Formal education | 6569 (40.5) | 0.37 ± 0.15 | 0.09 ± 0.10 | ||
| No formal education | 9669 (59.5) | 0.41 ± 0.14 | 0.14 ± 0.13 | ||
| Financial support | <.001 | <.001 | |||
| Financial independence | 5044 (31.1) | 0.35 ± 0.16 | 0.08 ± 0.09 | ||
| Financial dependence | 11,194 (68.9) | 0.42 ± 0.13 | 0.14 ± 0.13 | ||
| Social and leisure activity index, mean ± SD | 2.49 ± 1.53 | — | — | — | — |
| Smoking status | <.001 | <.001 | |||
| Never smoker | 10,678 (65.8) | 0.40 ± 0.14 | 0.13 ± 0.13 | ||
| Former smoker | 2190 (13.5) | 0.37 ± 0.14 | 0.12 ± 0.12 | ||
| Current smoker | 3370 (20.7) | 0.40 ± 0.14 | 0.08 ± 0.09 | ||
| Drinking status | <.001 | <.001 | |||
| Never drinker | 11,131 (68.5) | 0.39 ± 0.15 | 0.13 ± 0.13 | ||
| Former drinker | 1571 (9.7) | 0.39 ± 0.14 | 0.13 ± 0.13 | ||
| Current drinker | 3536 (21.8) | 0.41 ± 0.14 | 0.09 ± 0.10 | ||
| Physical activity | <.001 | <.001 | |||
| Yes | 5313 (32.7) | 0.35 ± 0.15 | 0.08 ± 0.08 | ||
| No | 10,925 (67.3) | 0.42 ± 0.13 | 0.14 ± 0.13 | ||
| Geographic region | <.001 | <.001 | |||
| Central China | 2474 (15.2) | 0.44 ± 0.12 | 0.12 ± 0.12 | ||
| Eastern China | 6327 (40.0) | 0.40 ± 0.15 | 0.12 ± 0.12 | ||
| Northeastern China | 1278 (7.9) | 0.27 ± 0.11 | 0.14 ± 0.14 | ||
| Northern China | 742 (4.6) | 0.26 ± 0.11 | 0.13 ± 0.13 | ||
| Northwestern China | 216 (1.3) | 0.37 ± 0.13 | 0.13 ± 0.12 | ||
| Southern China | 3144 (19.4) | 0.44 ± 0.13 | 0.10 ± 0.11 | ||
| Southwestern China | 2057 (12.7) | 0.39 ± 0.13 | 0.12 ± 0.12 | ||
Data are mean ± SD for baseline annual average NDVI and frailty index.
Table 2 reports the results of mixed effects logistic regression for the association between annual average NDVI and frailty. In the fully adjusted regression, each 0.1-unit increase in annual average NDVI was associated with an OR of 0.96 (95% CI: 0.93, 0.99) of frailty. Compared with the participants living in the lowest quartile of residential greenness, those in the highest quartile had a 14% lower odds of frailty (OR: 0.86, 95% CI: 0.77, 0.97). It has an equivalent effect of 1-year increase in age on frailty (OR: 1.14, 95% CI: 1.13, 1.14). The cubic splines (Figure 1) reported consistent findings that higher levels of annual average NDVI were associated with lower odds of frailty. Additionally, the sensitivity analysis including the participants both with and without follow-up surveys by using a cross-sectional design reported a similar protective association between annual average NDVI and frailty (Supplementary Tables 4 and 5). Furthermore, the association was only significant among the urban residents (OR: 0.89, 95% CI: 0.82, 0.96), not rural residents (OR: 0.98, 95% CI: 0.95, 1.02).
Table 2.
Mixed Effects Logistic Regression for the Relationship Between Annual Average NDVI and Frailty
| Exposure Metrics | Age-Adjusted OR (95% CI) | Fully Adjusted∗ OR (95% CI) |
|---|---|---|
| All participants (N = 16,238) | ||
| Quartiles of NDVI | ||
| Quartile 1 | Ref | Ref |
| Quartile 2 | 0.78 (0.71, 0.84) | 0.92 (0.83, 1.03) |
| Quartile 3 | 0.71 (0.65, 0.78) | 0.94 (0.84, 1.06) |
| Quartile 4 | 0.62 (0.57, 0.68) | 0.86 (0.77, 0.97) |
| 0.1-unit of NDVI | 0.93 (0.91, 0.95) | 0.96 (0.93, 0.99) |
| Urban area (n = 3266) | ||
| Quartiles of NDVI | ||
| Quartile 1 | Ref | Ref |
| Quartile 2 | 0.80 (0.66, 0.96) | 0.76 (0.61, 0.96) |
| Quartile 3 | 0.70 (0.52, 0.94) | 0.71 (0.50, 1.01) |
| Quartile 4 | 0.73 (0.51, 1.04) | 0.66 (0.43, 1.01) |
| 0.1-unit of NDVI | 0.96 (0.90, 1.02) | 0.89 (0.82, 0.96) |
| Rural area (n = 12,972) | ||
| Quartiles of NDVI | ||
| Quartile 1 | Ref | Ref |
| Quartile 2 | 0.92 (0.82, 1.02) | 1.01 (0.89, 1.15) |
| Quartile 3 | 0.86 (0.77, 0.97) | 1.04 (0.91, 1.19) |
| Quartile 4 | 0.75 (0.67, 0.84) | 0.96 (0.84, 1.09) |
| 0.1-unit of NDVI | 0.99 (0.97, 1.02) | 0.98 (0.95, 1.02) |
ORs (95% CIs) of being frail are shown.
In the fully adjusted models, ORs were adjusted for length of follow-up, age, sex, ethnicity, marital status, geographic region, urban or rural residence, education, occupation, financial support, social and leisure activity, smoking status, drinking status, and physical activity.
Fig. 1.
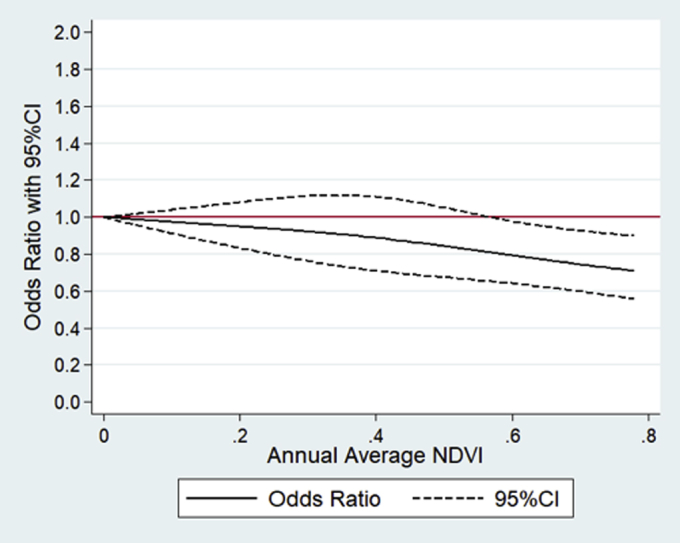
Curve association between annual average NDVI and frailty. Data are shown as OR (95% CI) of being frail in the fully adjusted models.
Figure 2 shows the stratified analysis on each 0.1-unit increase in annual average NDVI and frailty. We observed significant association only among the participants who were living in urban areas, had nonprofessional work, had formal education, were financially independent, and were never drinkers, compared with their counterparts.
Fig. 2.

Stratified analysis for each 0.1-unit increase in annual average NDVI and frailty. Data are shown as OR (95% CI) of being frail in the fully adjusted models.
Table 3 shows the association between annual average NDVI and frailty transitions. In the fully adjusted regression, each 0.1-unit increase in annual average NDVI was related to a 2% higher odds of improvement in the frailty status (OR: 1.02, 95% CI: 1.00, 1.04), and the association was weak but detectable.
Table 3.
Mixed Effects Ordered Logistic Regression for the Association Between Annual Average NDVI and Frailty Transitions
| Exposure Metrics | Age-Adjusted OR (95% CI) | Fully Adjusted∗ OR (95% CI) |
|---|---|---|
| Quartiles of NDVI | ||
| Quartile 1 | Ref | Ref |
| Quartile 2 | 1.08 (1.01, 1.15) | 1.08 (1.00, 1.16) |
| Quartile 3 | 1.11 (1.04, 1.18) | 1.09 (1.02, 1.18) |
| Quartile 4 | 1.07 (1.00, 1.14) | 1.06 (0.98, 1.14) |
| 0.1-unit of NDVI | 1.02 (1.01, 1.04) | 1.02 (1.00, 1.04) |
ORs (95% CIs) of improvement in frailty status are shown, which have deteriorated in frailty status as the reference group.
In the fully adjusted models, ORs were adjusted for age, sex, ethnicity, marital status, geographic region, urban or rural residence, education, occupation, financial support, social and leisure activity, smoking status, drinking status, and physical activity.
Discussion
We found that living in the highest quartile of residential greenness was associated with a 14% lower odds of frailty, compared with the lowest quartile. Together with our previous study that higher levels of residential greenness were associated with lower mortality rates and fewer disabilities in activities of daily living,12,13 our findings suggested the potential health benefits of residential greenness, which have significant medical implications. Frailty influences multiple physiologic systems when reaching an aggregate threshold of declined resistance to the stressors. Patients who are frail have specific care needs on progressive weakness, weight loss, decreased exercise tolerance, and slowed task performance.2 They also have lower abilities to tolerate the medical procedures and hospitalization.2 Increasing green space and appropriate planning around the residency, especially for the nursing homes, may reduce specific care needs and improve the effectiveness of relevant treatment, which requires further study.
Our finding was consistent with the other study in Hong Kong. The Mr. and Ms. Os (Hong Kong) Study, composed of 3240 older adults aged ≥65 years, reported that compared with the lowest quartile, those living in the highest quartile of green space at baseline in the 300 m radius around the residence were related to a 29% higher odds of improving frailty, which was evaluated by 5-item Cardiovascular Health Study frailty phenotype.14 To our knowledge, there are no other large-scale population-based cohort studies on residential greenness and frailty. Hong Kong is the most populous and developed place in the world whereas our participants were from 22 of 31 provinces in Mainland China, and up to 79.9% were rural residents. Our study added additional evidence in developing contexts with a greater variation in residential greenness.
Our study found that there was a difference in the association between residential greenness and frailty by urban and rural residence. The association was only significant for the urban residents, rather than those living in rural areas where there was more green space. Evidence on the urban-rural difference in the association between green space and health outcome was not consistent among other studies. A study of 250,782 participants in the Netherlands reported the significant association between green space and perceived general health among all degrees of urbanity (from strongly urban to nonurban areas), although the effect size varied.31 The authors found that the urban-rural difference could be explained by the amount of green space, which had stronger effects on health than the degree of urbanity. Another study in England showed that the relationship between green space and health depended on both levels of urbanity and income deprivation. There was no significant association in higher-income suburban and higher-income rural areas, whereas more green space was related to worse health in lower-income suburban areas.32 It was possible that there were different types of vegetation between higher-SES and lower-SES communities. It is unclear how different types of vegetation influences population health. Overall, few studies reported the urban-rural difference in the association between green space and health outcomes because majority studies were in the developed contexts and mainly focus on urban areas. Additionally, the urban-rural difference in our study might also be due to the urban-rural difference in frailty. Our study showed that the urban residents were a little bit frailer than the rural residents (0.13 vs 0.12 for FI at baseline). Furthermore, the difference might be explained by the urban-rural difference in the structure of green space and types of vegetation, which might have different effects on frailty.33 A study consisting of 6 million urban residents in Taipei showed that maximizing the largest green patch proportion and minimizing green space fragmentation were the most important contributors to reduce cardiovascular mortality.34 A study involving 276 counties in the United States reported similar findings that the effects of green space on mental effects also differed by the structures of green space.35 The structure of green space and types of vegetation may be different in urban and rural area in China. We did not have relevant data, and we could not verify the potential hypothesis. Further research on comparing the structure of green space and types of vegetation between urban and rural areas and their health effects is needed.
We did not observe significant gender difference in the association between residential greenness and frailty. This is not consistent with the Mr. and Ms. Os Study in Hong Kong,14 which reported health benefits of residential greenness on frailty only among males but not females. Gender difference was also reported in another study in the United Kingdom, which stated that males and females may have different perceptions and usage of green space.36 Our study did not have information on the usage pattern of green space by gender. It was unclear how the usage pattern could influence the association by gender.
There are several limitations to our study. First, although NDVI could objectively indicate the density of overall vegetation, it could not indicate the structure of green space and specific types of vegetation. The activity patterns of participants were also unknown. It was unclear how different types of vegetation and activity patterns could influence the association between residential greenness and frailty. Our study only used the 500 m radius around the residential address. It was unknown whether other scales had stronger or weaker associations. Second, our study had a potential concern about informative censoring because of our longitudinal design. Partly because of the advanced age (mean age: 83 years) of our participants, there were a large number of deaths (n = 12,234) and many were lost to follow-up (n = 5308) after the baseline survey. Compared with all participants at baseline, the participants with follow-up surveys were much younger (83 vs 88 years) and had better frailty (0.12 vs 0.18) at baseline (Supplementary Table 3). However, our sensitivity analysis on residential greenness and frailty included all participants with or without follow-up surveys, which used a cross-sectional design, and showed consistent findings with the longitudinal analysis (Supplementary Tables 4 and 5). These consistent findings confirmed the protective effects of residential greenness on frailty, and made our evidence more convincing. Although the cross-sectional design had some limitations, it could help decrease the potential selection bias and dropout bias from the longitudinal analysis, and also contributed to a more comprehensive picture. Third, although our FI was a continuous variable, we categorized it into frailty categories (nonfrail, prefrail, and frail). It made FI less sensitive because continuous FI was more informative to describe the deficit accumulation and the health status trajectories. The continuous FI was also less likely to misclassify phenotype.37 However, the cutoff points used in our study have been illustrated to be reliable in the other study.29 Categorizing FI in our study shall not bias the association. Fourth, our study lacks evidence on mechanisms of residential greenness and frailty. The path analysis in the Hong Kong study illustrated that residential greenness could directly, and indirectly, influence frailty through physical activity.14 However, our study did not show different associations by physical activity. We also found that the association between residential greenness and frailty became nonsignificant if social and leisure activity and physical activity were not adjusted. It was possible that residential greenness was more likely to directly influence frailty in our study, or our measurement of physical activity was not accurately measured by the question of “exercise or not at present.” While there might be mediating effects of physical activity, we could not conduct path analysis like the Hong Kong study because we lacked more accurate and detailed information to define the mediators like physical activity, and our FI assessment included potential mediators, such as cognitive function and mental health. Lastly, compared with the socioeconomic characteristics defined in other studies in developed contexts, our definitions may appear to be relatively crude. However, they reflected the special contexts in China of our participants' generation. With the mean age of 83 years at the time of the interview, our participants were mainly born between the 1900s and 1940s, when China experienced unstable and disrupted economic activities. Although our definitions of personal characteristics might not eliminate all residual confounding, they were a good proxy.
Our study has several strengths. Our study added evidence on residential greenness and frailty in the developing context, and provided evidence for further research on preventing or delaying frailty. Consistent with our previous analysis on residential greenness and mortality,12 our findings further reinforced the evidence on the potential health benefits of residential greenness. Additionally, our study included a large sample of 16,238 participants, recruited from 22 of 31 provinces in Mainland, China. This unique sampling design provided evidence in the developing context with a greater variation in residential greenness. Furthermore, our study used a longitudinal design with a long follow-up period from 2002 to 2014. Finally, we assessed greenness exposure by calculating NDVI values, based on aerial and satellite images. We also calculated time-varying annual average NDVI values in accordance with multiple measurements of frailty. This more objective and multiple measurements made our evidence on the residential greenness and frailty more convincing.
Conclusions and Implications
Our study found that higher levels of residential greenness were associated with a lower likelihood of frailty among Chinese older adults. We observed a stronger association among the urban residents than the rural residents. Our finding reinforced the evidence on the potential health benefit of residential greenness, which had significant implications for supporting the usage of green space to help prevent or improve frailty among Chinese older adults in the process of urbanization and aging.
Footnotes
This work was supported by Bill & Melinda Gates Foundation (Grant Number: OOP1148464), United States. The data analyzed in this paper were provided by the Chinese Longitudinal Healthy Longevity Study (CLHLS) which has been jointly supported by National Natural Sciences Foundation of China (71490732) and the National Key R&D Program of China (2018YFC2000400), China. The funders had no role in study design; collection, analysis, and interpretation of data; or manuscript drafting.
The authors declare no conflicts of interest.
Contributor Information
Chenkai Wu, Email: chenkai.wu@dukekunshan.edu.cn.
John S. Ji, Email: john.ji@dukekunshan.edu.cn.
Appendix
Supplementary Table 4.
A Cross-Sectional Analysis for Baseline Annual Average NDVI and Frailty at Baseline (N = 33,780)
| Exposure Metrics | Baseline NDVI, Mean ± SD | Baseline FI, Mean ± SD | Age-Adjusted OR (95% CI) | Fully Adjusted∗ OR (95% CI) |
|---|---|---|---|---|
| Quartiles of NDVI | ||||
| Quartile 1 | 0.18 ± 0.06 | 0.19 ± 0.18 | Ref | Ref |
| Quartile 2 | 0.36 ± 0.04 | 0.18 ± 0.17 | 0.79 (0.73, 0.85) | 0.87 (0.79, 0.96) |
| Quartile 3 | 0.46 ± 0.02 | 0.18 ± 0.16 | 0.76 (0.71, 0.82) | 0.88 (0.80, 0.98) |
| Quartile 4 | 0.56 ± 0.04 | 0.17 ± 0.16 | 0.67 (0.62, 0.72) | 0.81 (0.73, 0.90) |
| 0.1-unit of NDVI | — | — | 0.90 (0.89, 0.92) | 0.95 (0.92, 0.97) |
ORs (95% CIs) of being frail are shown.
In the fully adjusted regression models, ORs were adjusted for age, sex, ethnicity, marital status, geographic region, urban or rural residence, education, occupation, financial support, social and leisure activity, smoking status, drinking status, and physical activity.
Supplementary Table 3.
Baseline Annual Average NDVI, and Frailty for the Participants With or Without Follow-up Surveys
| All Participants (N = 33,780) | Participants With Follow-up Surveys (n = 16,238) | Participants Without Follow-up Surveys |
|||
|---|---|---|---|---|---|
| All (n = 17,542) | Death (n = 12,234) | Lost to Follow-up (n = 5308) | |||
| Baseline NDVI, mean ± SD | 0.39 ± 0.15 | 0.40 ± 0.14 | 0.38 ± 0.15 | 0.40 ± 0.14 | 0.35 ± 0.16 |
| Baseline FI score, mean ± SD | 0.18 ± 0.17 | 0.12 ± 0.12 | 0.24 ± 0.18 | 0.26 ± 0.18 | 0.19 ± 0.18 |
| Age, mean ± SD | 88 ± 11.8 | 83 ± 11.5 | 92 ± 10.2 | 94 ± 8.5 | 87 ± 12.1 |
Supplementary Table 5.
Mixed Effects Logistic Regression for the Relationship Between Annual Average NDVI and Frailty
| Exposure Metrics | Age-Adjusted OR (95% CI) | Fully Adjusted∗ OR (95% CI) |
|---|---|---|
| All participants (N = 33,780) | ||
| Quartiles of NDVI | ||
| Quartile 1 | Ref | Ref |
| Quartile 2 | 0.75 (0.69, 0.82) | 0.89 (0.81, 0.97) |
| Quartile 3 | 0.68 (0.62, 0.74) | 0.87 (0.79, 0.96) |
| Quartile 4 | 0.59 (0.54, 0.64) | 0.81 (0.73, 0.89) |
| 0.1-unit of NDVI | 0.87 (0.85, 0.89) | 0.94 (0.92, 0.96) |
| Urban area (n = 7649) | ||
| Quartiles of NDVI | ||
| Quartile 1 | Ref | Ref |
| Quartile 2 | 0.72 (0.60, 0.86) | 0.70 (0.59, 0.84) |
| Quartile 3 | 0.70 (0.52, 0.93) | 0.68 (0.51, 0.90) |
| Quartile 4 | 0.61 (0.43, 0.88) | 0.56 (0.39, 0.79) |
| 0.1-unit of NDVI | 0.88 (0.83, 0.94) | 0.88 (0.83, 0.93) |
| Rural area (n = 26,131) | ||
| Quartiles of NDVI | ||
| Quartile 1 | Ref | Ref |
| Quartile 2 | 1.06 (0.95, 1.18) | 1.01 (0.91, 1.13) |
| Quartile 3 | 0.99 (0.89, 1.10) | 0.99 (0.89, 1.11) |
| Quartile 4 | 0.87 (0.78, 0.97) | 0.93 (0.83, 1.04) |
| 0.1-unit of NDVI | 0.94 (0.92, 0.97) | 0.97 (0.94, 0.99) |
ORs (95% CIs) of being frail are shown.
In the fully adjusted regression models, ORs were adjusted for age, sex, ethnicity, marital status, geographic region, urban or rural residence, education, occupation, financial support, social and leisure activity, smoking and drinking status, and physical activity.
Supplementary Table 2.
Baseline Characteristics by Urban or Rural Residence Among the Participants With Follow-up Surveys (n = 16,238)
| Characteristics | Urban Area | Rural Area |
|---|---|---|
| 3266 | 12,972 | |
| Age, y, mean ± SD | 83 ± 11.7 | 83 ± 11.5 |
| Baseline NDVI, mean ± SD | 0.23 ± 0.12 | 0.44 ± 0.12 |
| Baseline FI, mean ± SD | 0.13 ± 0.13 | 0.12 ± 0.12 |
| Sex | ||
| Male | 1465 (44.9) | 5750 (44.3) |
| Female | 1801 (55.1) | 7222 (55.7) |
| Ethnicity | ||
| Han Chinese | 3168 (97.0) | 12,058 (92.9) |
| Ethnic minority | 98 (3.0) | 914 (7.1) |
| Marital status | ||
| Married | 1358 (41.6) | 4911 (37.9) |
| Not married | 1908 (58.4) | 8061 (62.1) |
| Occupation | ||
| Professional work | 692 (21.2) | 624 (4.8) |
| Nonprofessional work | 2574 (78.8) | 12,348 (95.2) |
| Education | ||
| Formal education | 1845 (56.5) | 4724 (36.4) |
| No formal education | 1421 (43.5) | 8248 (63.6) |
| Financial support | ||
| Financial independence | 1905 (58.3) | 3139 (24.2) |
| Financial dependence | 1361 (41.7) | 9833 (75.8) |
| Social and leisure activity index (mean ± SD) | 2.97 ± 1.60 | 2.37 ± 1.49 |
| Smoking status | ||
| Never smoker | 2093 (64.1) | 8585 (66.2) |
| Former smoker | 602 (18.4) | 1588 (12.2) |
| Current smoker | 571 (17.5) | 2799 (21.6) |
| Drinking status | ||
| Never drinker | 2314 (70.9) | 8817 (68.0) |
| Former drinker | 351 (10.7) | 1220 (9.4) |
| Current drinker | 601 (18.4) | 2935 (22.6) |
| Physical activity | ||
| Yes | 1815 (55.6) | 3498 (27.0) |
| No | 1451 (44.4) | 9474 (73.0) |
| Geographic region | ||
| Central China | 297 (9.1) | 2177 (16.8) |
| Eastern China | 1150 (35.2) | 5177 (39.9) |
| Northeastern China | 689 (21.1) | 589 (4.5) |
| Northern China | 425 (13.0) | 317 (2.4) |
| Northwestern China | 52 (1.6) | 164 (1.3) |
| Southern China | 241 (7.4) | 2903 (22.4) |
| Southwestern China | 412 (12.6) | 1645 (12.7) |
Supplementary Table 1.
The List of Items Included in Calculating the FI
| No. | Items |
|---|---|
| 1 | IADL: Unable to visit neighbors by oneself |
| 2 | IADL: Unable to shop by oneself if necessary |
| 3 | IADL: Unable to cook meals by oneself if necessary |
| 4 | IADL: Unable to wash clothing by oneself |
| 5 | IADL: Unable to walk continuously for 1 km |
| 6 | IADL: Unable to lift a weight of 5 kg (such as a heavy bag of groceries) |
| 7 | IADL: Unable to continuously crouch and stand up 3 times |
| 8 | IADL: Unable to use public transportation |
| 9 | Functional limitations: Unable to put hand behind neck |
| 10 | Functional limitations: Unable to put hand behind lower back |
| 11 | Functional limitations: Unable to raise arm upright |
| 12 | Functional limitations: Unable to stand up from sitting in a chair |
| 13 | Functional limitations: Unable to pick up a book from the floor |
| 14 | ADL: Needs assistance bathing |
| 15 | ADL: Needs assistance dressing |
| 16 | ADL: Needs assistance toileting |
| 17 | ADL: Needs assistance in indoor transferring |
| 18 | ADL: Needs assistance eating |
| 19 | ADL: Incontinence |
| 20 | Cognitively impaired (based on the MMSE) |
| 21 | Poor self-rated health |
| 22 | Health worsened in the past year |
| 23 | Poor interviewer-rated health |
| 24 | Hearing loss |
| 25 | Vision loss |
| 26 | Abnormal heart rhythm |
| 27 | Symptom of psychological distress (based on loneliness, usefulness, fearfulness) |
| 28 | Number of serious illnesses in the past 2 years |
| 29 | Suffering from hypertension |
| 30 | Suffering from diabetes |
| 31 | Suffering from tuberculosis |
| 32 | Suffering from heart disease |
| 33 | Suffering from stroke/cerebrovascular disease |
| 34 | Suffering from bronchitis, emphysema, asthma, or pneumonia |
| 35 | Suffering from cancer |
| 36 | Suffering from arthritis |
| 37 | Suffering from bedsores |
| 38 | Suffering from gastric or duodenal ulcers |
| 39 | Suffering from Parkinson's disease |
IADLs, instrumental activities of daily living; ADL, activities of daily living.
Item no. 28 was assigned a value of 2.
References
- 1.Collard R.M., Boter H., Schoevers R.A., Voshaar R.C.O. Prevalence of frailty in community dwelling older persons: A systematic review. J Am Geriatr Soc. 2012;60:1487–1492. doi: 10.1111/j.1532-5415.2012.04054.x. [DOI] [PubMed] [Google Scholar]
- 2.Fried L.P., Ferrucci L., Darer J. Untangling the concepts of disability, frailty, and comorbidity: Implications for improved targeting and care. J Gerontol A Biol Sci Med Sci. 2004;59:M255–M263. doi: 10.1093/gerona/59.3.m255. [DOI] [PubMed] [Google Scholar]
- 3.Rockwood K., Song X., MacKnight C. A global clinical measure of fitness and frailty in elderly people. Can Med Assoc J. 2005;173:489–495. doi: 10.1503/cmaj.050051. [DOI] [PMC free article] [PubMed] [Google Scholar]
- 4.Makary M.A., Segev D.L., Pronovost P.J. Frailty as a predictor of surgical outcomes in older patients. J Am Coll Surg. 2010;210:901–908. doi: 10.1016/j.jamcollsurg.2010.01.028. [DOI] [PubMed] [Google Scholar]
- 5.Ensrud K.E., Ewing S.K., Taylor B.C. Frailty and risk of falls, fracture, and mortality in older women: The study of osteoporotic fractures. J Gerontol A Biol Sci Med Sci. 2007;62:744–751. doi: 10.1093/gerona/62.7.744. [DOI] [PubMed] [Google Scholar]
- 6.Cawthon P.M., Marshall L.M., Michael Y. Frailty in older men: Prevalence, progression, and relationship with mortality. J Am Geriatr Soc. 2007;55:1216–1223. doi: 10.1111/j.1532-5415.2007.01259.x. [DOI] [PubMed] [Google Scholar]
- 7.Clegg A., Young J., Iliffe S. Frailty in elderly people. Lancet. 2013;381:752–762. doi: 10.1016/S0140-6736(12)62167-9. [DOI] [PMC free article] [PubMed] [Google Scholar]
- 8.Fried L.P., Tangen C.M., Walston J. Frailty in older adults: Evidence for a phenotype. J Gerontol A Biol Sci Med Sci. 2001;56:M146–M157. doi: 10.1093/gerona/56.3.m146. [DOI] [PubMed] [Google Scholar]
- 9.Bergman H., Ferrucci L., Guralnik J. Frailty: An emerging research and clinical paradigm—Issues and controversies. J Gerontol A Biol Sci Med Sci. 2007;62:731–737. doi: 10.1093/gerona/62.7.731. [DOI] [PMC free article] [PubMed] [Google Scholar]
- 10.Cameron I.D., Fairhall N., Langron C. A multifactorial interdisciplinary intervention reduces frailty in older people: Randomized trial. BMC Med. 2013;11:65. doi: 10.1186/1741-7015-11-65. [DOI] [PMC free article] [PubMed] [Google Scholar]
- 11.Morley J.E., Vellas B., Van Kan G.A. Frailty consensus: A call to action. J Am Med Dir Assoc. 2013;14:392–397. doi: 10.1016/j.jamda.2013.03.022. [DOI] [PMC free article] [PubMed] [Google Scholar]
- 12.Ji J.S., Zhu A., Bai C. Residential greenness and mortality in oldest-old women and men in China: A longitudinal cohort study. Lancet Planet Health. 2019;3:e17–e25. doi: 10.1016/S2542-5196(18)30264-X. [DOI] [PMC free article] [PubMed] [Google Scholar]
- 13.Zhu A., Yan L.L., Wu C.D. Residential greenness, activities of daily living, and instrumental activities of daily living: A longitudinal cohort study of older adults in China. Environ Epidemiol. 2019;3:e065. doi: 10.1097/EE9.0000000000000065. [DOI] [PMC free article] [PubMed] [Google Scholar]
- 14.Yu R., Wang D., Leung J. Is neighborhood green space associated with less frailty? Evidence from the Mr. and Ms. Os (Hong Kong) study. J Am Med Dir Assoc. 2018;19:528–534. doi: 10.1016/j.jamda.2017.12.015. [DOI] [PubMed] [Google Scholar]
- 15.Cadore E.L., Rodríguez-Mañas L., Sinclair A., Izquierdo M. Effects of different exercise interventions on risk of falls, gait ability, and balance in physically frail older adults: A systematic review. Rejuvenation Res. 2013;16:105–114. doi: 10.1089/rej.2012.1397. [DOI] [PMC free article] [PubMed] [Google Scholar]
- 16.Theou O., Stathokostas L., Roland K.P. The effectiveness of exercise interventions for the management of frailty: A systematic review. J Aging Res. 2011;2011:569194. doi: 10.4061/2011/569194. [DOI] [PMC free article] [PubMed] [Google Scholar]
- 17.Freeman C., Waters D.L., Buttery Y., van Heezik Y. The impacts of ageing on connection to nature: The varied responses of older adults. Health Place. 2019;56:24–33. doi: 10.1016/j.healthplace.2019.01.010. [DOI] [PubMed] [Google Scholar]
- 18.World Bank Total population ages 65 and above. 2017. https://data.worldbank.org/indicator/sp.pop.65up.to Available at:
- 19.Wu C., Smit E., Xue Q.-L., Odden M.C. Prevalence and correlates of frailty among community-dwelling Chinese older adults: The China Health and Retirement Longitudinal Study. J Gerontol A Biol Sci Med Sci. 2017;73:102–108. doi: 10.1093/gerona/glx098. [DOI] [PMC free article] [PubMed] [Google Scholar]
- 20.Zeng Y., Poston D.L., Vlosky D.A., Gu D. Vol 20. Springer Science & Business Media; Dordrecht: 2008. (Healthy longevity in China: Demographic, socioeconomic, and psychological dimensions). The Springer Series on Demographic Methods and Population Analysis. [Google Scholar]
- 21.James P., Hart J.E., Banay R.F., Laden F. Exposure to greenness and mortality in a nationwide prospective cohort study of women. Environ Health Perspect. 2016;124:1344. doi: 10.1289/ehp.1510363. [DOI] [PMC free article] [PubMed] [Google Scholar]
- 22.Thiering E., Markevych I., Brüske I. Associations of residential long-term air pollution exposures and satellite-derived greenness with insulin resistance in German adolescents. Environ Health Perspect. 2016;124:1291. doi: 10.1289/ehp.1509967. [DOI] [PMC free article] [PubMed] [Google Scholar]
- 23.Siordia C., Coulton C. Using hand-draw maps of residential neighbourhood to compute level of circularity and investigate its predictors. Human Geogr. 2015;9:131–149. [Google Scholar]
- 24.Crouse D.L., Pinault L., Balram A. Urban greenness and mortality in Canada's largest cities: A national cohort study. Lancet Planet Health. 2017;1:e289–e297. doi: 10.1016/S2542-5196(17)30118-3. [DOI] [PubMed] [Google Scholar]
- 25.Vienneau D., de Hoogh K., Faeh D. More than clean air and tranquillity: Residential green is independently associated with decreasing mortality. Environ Int. 2017;108:176–184. doi: 10.1016/j.envint.2017.08.012. [DOI] [PubMed] [Google Scholar]
- 26.Gu D., Dupre M.E., Sautter J. Frailty and mortality among Chinese at advanced ages. J Gerontol B Psychol Sci Soc Sci. 2009;64:279–289. doi: 10.1093/geronb/gbn009. [DOI] [PMC free article] [PubMed] [Google Scholar]
- 27.Kulminski A., Yashin A., Ukraintseva S. Accumulation of health disorders as a systemic measure of aging: Findings from the NLTCS data. Mech Ageing Dev. 2006;127:840–848. doi: 10.1016/j.mad.2006.08.005. [DOI] [PMC free article] [PubMed] [Google Scholar]
- 28.Mitnitski A., Song X., Skoog I. Relative fitness and frailty of elderly men and women in developed countries and their relationship with mortality. J Am Geriatr Soc. 2005;53:2184–2189. doi: 10.1111/j.1532-5415.2005.00506.x. [DOI] [PubMed] [Google Scholar]
- 29.Liu Z.Y., Wei Y.Z., Wei L.Q. Frailty transitions and types of death in Chinese older adults: A population-based cohort study. Clin Interv Aging. 2018;13:947–956. doi: 10.2147/CIA.S157089. [DOI] [PMC free article] [PubMed] [Google Scholar]
- 30.Zeng Y., Gu D., Purser J. Associations of environmental factors with elderly health and mortality in China. Am J Public Health. 2010;100:298–305. doi: 10.2105/AJPH.2008.154971. [DOI] [PMC free article] [PubMed] [Google Scholar]
- 31.Maas J., Verheij R.A., Groenewegen P.P. Green space, urbanity, and health: How strong is the relation? J Epidemiol Community Health. 2006;60:587–592. doi: 10.1136/jech.2005.043125. [DOI] [PMC free article] [PubMed] [Google Scholar]
- 32.Mitchell R., Popham F. Greenspace, urbanity and health: Relationships in England. J Epidemiol Community Health. 2007;61:681–683. doi: 10.1136/jech.2006.053553. [DOI] [PMC free article] [PubMed] [Google Scholar]
- 33.McKinney M.L. Effects of urbanization on species richness: A review of plants and animals. Urban Ecosyst. 2008;11:161–176. [Google Scholar]
- 34.Shen Y.S., Lung S.C.C. Can green structure reduce the mortality of cardiovascular diseases. Sci Total Environ. 2016;566:1159–1167. doi: 10.1016/j.scitotenv.2016.05.159. [DOI] [PubMed] [Google Scholar]
- 35.Tsai W.L., McHale M., Jennings V. Relationships between characteristics of urban green land cover and mental health in US metropolitan areas. Int J Environ Res Public Health. 2018;15:340. doi: 10.3390/ijerph15020340. [DOI] [PMC free article] [PubMed] [Google Scholar]
- 36.Richardson E.A., Mitchell R. Gender differences in relationships between urban green space and health in the United Kingdom. Soc Sci Med. 2010;71:568–575. doi: 10.1016/j.socscimed.2010.04.015. [DOI] [PubMed] [Google Scholar]
- 37.Cesari M., Gambassi G., Abellan van Kan G., Vellas B. The frailty phenotype and the frailty index: Different instruments for different purposes. Age Ageing. 2013;43:10–12. doi: 10.1093/ageing/aft160. [DOI] [PubMed] [Google Scholar]