

Abstract

Instant coffee manufacture involves the aqueous extraction of soluble coffee components followed by drying to form a soluble powder. Loss of volatile aroma compounds during concentration through evaporation can lower product quality. One method of retaining aroma is to steam-strip volatiles from the coffee and add them back to a concentrated coffee solution before the final drying stage. A better understanding of the impact of process conditions on the aroma content of the stripped solution will improve product design stages. In this context, we present a multiscale model for aroma extraction describing (i) the release from the matrix, (ii) intraparticle diffusion, (iii) transfer into water and steam, and (iv) advection through the column mechanisms. Results revealed (i) the existence of three different types of compound behavior, (ii) how aroma physiochemistry determines the limiting kinetics of extraction, and (iii) that extraction for some aromas can be inhibited by the interaction with other coffee components.
1. Introduction
Coffee is the most popularly prepared beverage, with a global production exceeding 9.5 million tonnes of green coffee beans.1,2 In the United Kingdom, instant coffee dominates the coffee market with a share of approximately 80%, equivalent to around 50 000 tonnes.3
The instant coffee process begins with the roasting of green beans to develop flavor compounds4 (see Table S1 for a list of typical aroma and associated data). Additionally, roasting develops porosity5 and vaporizes water, reducing moisture content. Roasted coffee beans are ground to reduce the particle size—increasing the surface area and reducing closed porosity5—and undergo multiple stages of high-temperature aqueous extraction of the soluble components. This extract is dried by evaporation and spray- or freeze-drying to form a soluble powder.
To reduce aroma degradation and loss caused by thermal processing, an aroma stream is extracted immediately after grinding, which is then added to the concentrated coffee extract before the final drying stage. Various techniques contacting ground coffee with water and/or steam are described in the patent literatures.6−8 These steps largely determine the final product aroma content, so the engineer must understand the mechanisms by which aroma transfers from coffee grounds into aqueous and gaseous media, allowing processes to be optimized to target the desired aromatic content. Steam stripping, analogous to processes9,10 in oils, is widely used.
It has been asserted that aroma exists principally within the coffee oil,4 but no published mass balance exists to prove this. Schenker11 showed that oil coats the outer walls of the grain cells as discrete micron-scale droplets, which migrate to the bean surface during roasting. The easily accessible aroma on the surface of the grain will dissolve in the water and partition into the headspace, from which the aroma will be carried by the advection of steam. As the surface is depleted and as water fills the pores, aroma will continue to dissolve and diffuse into the surface. Any aroma dissolved within the coffee oil may directly partition into the headspace from the surface oil, but oil extraction from within the grain is poor12,13 and such aroma must be extracted by aqueous dissolution first. As the grain is wetted, it swells impacting porosity and diffusion. Particle size analysis showed that swelling of wetted grounds stopped within 10–15 min.14,15 A study of the kinetics of aqueous extraction, for domestic coffee brewers, showed how hydrophilic aroma compounds extract significantly faster than lipophilic ones.16 Sánchez López et al.17 studied the headspace above espresso coffee and characterized coffee aroma into two clusters: (i) a faster extracting group of typically low-molecular-weight compounds (acids, esters, and carbonyls), increasing quickly between 6 and 10 s of extraction; and (ii) a slower group of higher-weight heterocycles and phenols increasing between 6 and 20 s. In another study, when stripping aroma with nitrogen gas from a bed of dry coffee, data could be fitted well to the analytical solution of a Fickian diffusion model and a Weibull model.18 However, upon wetting the coffee, the behavior of some compounds (including acetic acid, pyridine, and methyl furfural) could not be described using the diffusion model. The addition of the aqueous phase seems to introduce new complexities, such as the interaction with other components in the coffee matrix, potentially involving various functional groups.19
Several published models of essential oil distillation from plant matter describe extraction purely by fitting mass transfer coefficients.10,20 Moroney et al.21 modeled coffee extraction in brewing, describing the transfer between inert coffee solid matter, coffee particle (intragranular) pores, and coffee bed (intergranular) pores. They define lengths of diffusion from the solid to intragranular pore and from the intragranular to intergranular pore, and use experiment-derived fitted parameters to describe these processes.
The approach used here is to solve the particle-scale diffusion equation and bed-scale advection simultaneously. It builds upon the particle/bed model used for brew yield by Melrose et al.22 and references therein, adapting for aroma compounds, adding intraparticle interactions and external transfer to a steam flow. The model was prefaced in Beverly et al.,23 but the aim here is to identify the different rate-limiting extraction mechanisms for different compounds (and, hence, aromatic properties) and predict how features of the process within (or outside) the control of the engineer can impact the chemical and sensory profile of the resulting distillate. The practical result should be a tool to guide process development when optimizing aroma yield, concentration, and desired sensory attributes.
2. Extraction System
The focus of this paper is on a process similar to that described by Vitzthum and Koch.24 A packed bed of ground coffee (up to 1.8 mm diameter) is uniformly wetted and steamed for up to 40 min. During this process, heat and mass transfer processes occur simultaneously. On the addition of hot water, there is water absorption into the porous coffee grains, whereupon soluble compounds dissolve and diffuse into the surface. During steaming, the bed is heated by condensation, which provides additional moisture. Volatile compounds will partition into the gas phase and be carried by the steam out of the column.
The system to be modeled is a packed bed of roasted and ground coffee beans, in a cylindrical column (Figure 1a). A defined quantity of water is first added, which is assumed to be perfectly distributed through the column and is sufficient to entirely fill the porous coffee particles. Saturated steam enters via the column base, and a vacuum is applied at the top.
Figure 1.
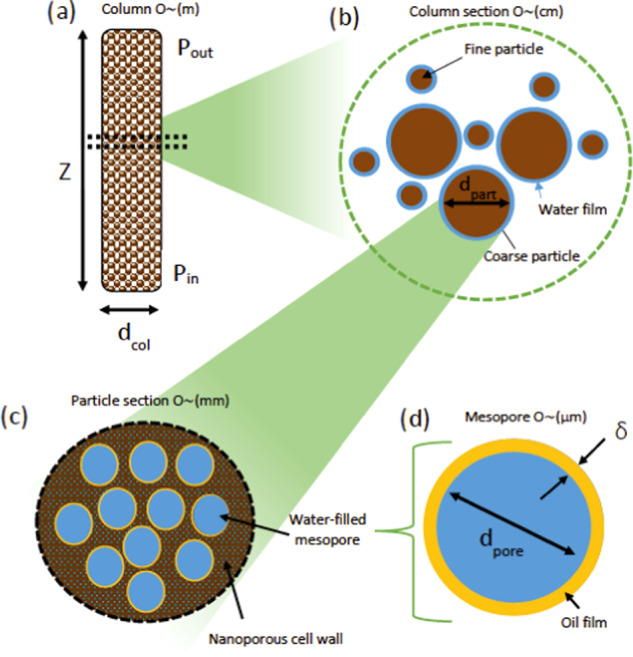
Schematic diagrams of different scales in the system with key geometries: (a) whole column, with the labeled height (Z) inlet and outlet pressures (Pin and Pout) and column diameter (dbed); (b) column section, with the labeled bed pore size (db,pore) and particle diameter (dpart); (c) particle section with mesopores distributed in a nanoporous matrix all filled with water; and (d) mesopore with a labeled diameter (dpore) and oil thickness (δ).
In each column element, the bed consists of loose-packed particles, with free water existing as a surrounding uniform film (Figure 1b). One particle is taken as being representative of the whole population in the element. Each particle is porous, with the porosity consisting of large spherical pores connected by a nanoporous network through the cell walls (Figure 1c), a simplification of the microstructure seen in Figure 2.
Figure 2.

Scanning electron microscope image of a roasted and ground coffee particle (magnification 1000×) showing the mesopores and cell walls, taken on a tabletop TM-1000 microscope (Hitachi, Tokyo, Japan).
The cell wall is built of a matrix of structural plant macromolecules, mainly polysaccharides, containing nanopores.11 When considering diffusion and thermal conduction, the porous particle is considered homogeneous, with the transport coefficients adjusted for the averaged porosity and tortuosity. The aroma is assumed dissolved in the oil phase, treated here as a uniform thin layer of thickness δ, which coats each large spherical mesopore (Figure 1d), and partitions and diffuses into the free phase according to the octanol–water partition coefficient.
3. Model Formulation
Aroma is extracted from the oil film (ca. 1 μm thickness) into the water-filled mesopore (ca. 20 μm radius) (Figures 1d and 2). There is stagnant diffusive transport from the oil–water boundary concentration (determined by the octanol–water partition) to the mesopore center (deemed the free aroma concentration in the particle). An effective diffusion coefficient describes the transport within the particle (ca. 1 mm radius), which combines free diffusion in the mesopores and hindered diffusion in the cell walls (ca. 10 μm thickness) (Figure 1c). A flux boundary condition determines the transfer from the particle surface to free water in the bed, which forms a stagnant film around the particles. Henry’s law volatility constants describe the partition into the headspace, and there is convective transport into the steam across the surface area of the particles (O ∼ 10 m2 kg–1) (Figure 1b). Advection by pressure-driven flow through a porous bed describes steam progress through the column [O ∼ (m)] (Figure 1a). All references to “concentration” hereon relate to molar concentration.
3.1. Assumptions of the Model
At the bed scale:
The column is perfectly insulated.
No radial variation in the flow, temperature, or water content.
The dominant mechanisms of aroma mass transfer are aqueous diffusion within the particle to free water (on the particle external surfaces) to the gas phase and then via advection in the gas phase.
All material flowing out of the top of the column is condensed.
The mobile phase is an ideal gas.
The liquid water surrounding the particles is not mobile (does not flow).
For the particle scale:
Particles are spherical with evenly distributed porosity,5 and only radial gradients will be considered.
Particle size is bimodal, with the diffusion equation solved for each class of coarse and fine particles using mean particle sizes dc and df.
Porosity consists of spherical mesopores connected by a nanoporous network, which is entirely saturated with water.
No particle swelling effects: dissolution of the soluble fraction of the particles is instant upon wetting, i.e., no change in particle size or porosity with time.
Aroma initially exists dissolved in an oil layer uniformly spread over the inner surface of the mesopores, and dissolved aroma partitions according to the octanol–water partition coefficient, as this is a representative parameter for liquid-phase extraction systems.25
The octanol–water partition coefficient is independent of temperature (and, thus, time and geometry). The relationship is not studied for many aromas, and, where data exists, it is limited to temperature increases of the order of 20 °C;26,27 for some compounds, the difference is insignificant (<10%), but there may be some aromas that change partition behavior strongly over larger ranges.
Aroma extraction is not limited by solubility.
Physical properties (density, conductivity, heat capacity, etc.) are weighted averages of solid coffee and water properties.
Free water in the bed exists as a homogeneous stagnant film coating the particles.28
3.2. Bed Scale
3.2.1. Water Mass Transfer
The free water in the bed (ρb,w), i.e., the water in excess of that required to fill the porous coffee particles, is expressed as a mass of water per unit volume of bed. The initial value is determined by the added water-to-coffee ratio (ϕwc = gwater gdry coffee–1), where a homogeneous distribution is assumed
| 1 |
where ρp and ρw are the real densities of the coffee particle and water, respectively; and εp is the particle porosity. The amount of free water in the bed is a function of condensation as no flow or loss occurs within the bed
| 2 |
The rate of condensation m ˙con is defined using the simplified Hertz–Knudsen formula29
| 3 |
where Mvap is the molar mass of water vapor; R is the gas constant; pst and Tst are the saturated steam pressure and temperature, respectively; pvap and Tb are the free water vapor pressure and bed temperature, respectively; ab is the area per unit volume of bed; and Vbed is the bed volume. The surface area per unit volume of the bed ab is calculated as a function summing the contribution from the coarse and fine particle size classes
| 4 |
While the column remains below the saturation temperature of the steam, there will be condensation, reducing the flow of steam out of a column element Qout
| 5 |
where ρst is the density of the saturated steam. Darcy’s Law is used to calculate the volumetric flow of steam (Q) and superficial velocity (v) through the bed
| 6 |
where Abed is the area of the bed and μin is the gas viscosity at the inlet. The inlet and outlet pressures (Pin and Pout), bed height (Z), and diameter (dbed) are specified by the process. The bed permeability (K) is calculated using the Kozeny–Carman equation5
| 7 |
where d3,2 is the Sauter mean diameter and εb is the bed porosity, which is estimated using the method of Farr and Groot30
| 8 |
where ϕRCP is the maximum packing fraction for a random close-packed monodisperse sphere, and ω is defined as
| 9 |
In eq 9, φc and φf are the coarse and fine particle sizes, respectively. The value of d3,2 is calculated by modeling the particle size distribution as the sum of two log–normal distributions, with mean coarse and fine particle sizes (dc and df) similar to the methods used by Melrose et al.22 Water vapor pressure and steam saturation temperature have been estimated by using steam table data31 and fitting logarithmic curves for 1.2 < P < 6 bar and P < 1.2 bar (R2 > 0.99).
3.2.2. Aroma Mass Transfer
The concentration (in mol m–3) of each individual aroma is modeled independently. Initially, there is no aroma in the water or gas phase
| 10 |
and transfer to the gas phase does not begin until the steam contacts that column element. The concentration in the gas phase cg (mol m–3) is determined by the sum of advection and source terms—dispersion is negligible
| 11 |
where the term abp is defined as abp = ab/εb (area that the mobile phase occupies). Henry’s law volatility constant KHpc(Tb) is calculated according to the van’t Hoff equation
| 12 |
Values of KH,298pc and ΔH for several aromas can be found in the literatures.32,33 For weak acids, the modified value of Henry’s law volatility constant can be calculated as a function of the literature values (see Table S1), pH and pKa, as follows34
| 13 |
by combining van’t Hoff and Henderson–Hasselbalch equations. This assumes that there are no bases present to react with the acid. If any such components are present in the aqueous solution, then Henry’s constant will be reduced. Required pKa data have been taken from Harned and Ehlers35 and extrapolated to T = 100 °C.
At the column inlet, there is no aroma in the gas phase. As the upwind scheme is used to define the concentration gradient in eq 11, each node’s properties are calculated as a function of the preceding nodes. This means the outlet is an open boundary
| 14 |
The concentration in the stationary free water in the bed (cw in mol m–3) is described by source and loss terms from/to the particle surface (cp,R) and gas (cg), respectively (see Figure 3).
Figure 3.

Schematic diagrams of (a) the particle–water–gas transfer stage and (b) aroma release and diffusion into the coffee particles.
There is also a dilution effect caused by condensing steam that increases the volume of water in which the aroma is dissolved
 |
15 |
where kw and kg are the water- and gas-phase mass transfer coefficients, respectively; and aw is the water surface area per unit volume of water, which is equivalent to the particle surface area, since the water film is thin
| 16 |
The mass transfer coefficient kg has been obtained as36
| 17 |
for Re < 1000. For the stagnant water layer, with Re ≅ 0 and Sh ≅ 2. The mass transfer coefficient kw was calculated as37
| 18 |
where D0 is the free diffusivity in water.
3.2.3. Heat Transfer
The rate of heat transfer from condensing steam to the coffee particles is significantly faster (ca. 100 times faster) than mass transfer, so the wetted coffee bed can be considered a homogeneous material with material-averaged thermal properties. We may regard axial conduction effects through the bed to be insignificant compared to latent heat contributions, so the corresponding energy balance on the bed leads to
| 19 |
where ρ ®b and C ®p are, respectively, the mass-averaged density (kgmaterial mbed–3) and specific heat capacity; Tb and Tsat are the bed and saturation temperatures, respectively; and λ is the latent heat of steam. The mass-averaged temperature of the column contents (Tb) is calculated as
| 20 |
where Cp,w and Cp,c are the specific heat capacities of the water and dry coffee, respectively. The ground coffee is initially at an ambient temperature (Tc = 298 K), and the added water temperature (Tw) can be varied.
3.3. Particle Scale
3.3.1. Aroma Mass Transfer
Two concentrations in the particle are modeled: (i) dissolved aroma in the oil layer of the mesopores (cdo in mol m–3) and (ii) free aroma that diffuses through the particle in the water-filled mesopores (cp in mol m–3), as depicted in Figure 3b. The release of dissolved aroma is described by
| 21 |
where apor,do is the oil–mesopore interfacial area per unit volume of oil, assuming spherical mesopores; and Ko/w is the octanol–water partition coefficient, considered constant throughout the column for the duration of extraction. The mass transfer coefficient kpor is defined as
| 22 |
where rpor is the pore radius. Equilibration between oil and water in the mesopore is rapid (of the order of 1 s). Diffusion of free aroma is described using Fick’s second law with a source term from the dissolved aroma being released
| 23 |
where apor,p = 3/rpor is the oil–mesopore interfacial area per unit volume of the mesopore and Deff is the effective diffusivity. As there are two phases through which the mobile aroma diffuses—an unhindered mesopore region and a tortuous nanoporous cell wall—Deff is calculated by using the Maxwell homogenization model38
| 24 |
where the spherical mesopores are the inclusions with free diffusivity in water D0 and the continuum is the cell wall material with hindered diffusivity Dh. Free diffusion coefficient values were obtained from the literature for several compounds (see Table 1), and a correlation with molecular weight was made to estimate others. The diffusion coefficient for loosely packed beds (Dh) depends on the coffee grain microstructure and the fluid properties (i.e., viscosity). Various correlations exist, relating diffusivity to both porosity and tortuosity, and tortuosity has itself been related to the porosity through various power law and logarithmic functions.39 Corrochano et al.5 combined these and used the following relation for loosely packed beds
| 25 |
Table 1. Diffusivity in Water and Molecular Weights of Some Aromas40.
| compound | diffusivity at 298 K (m2 s–1) | molecular weight (g mol–1) |
|---|---|---|
| phenol | 9.7 × 10⁻¹⁰ | 94.1 |
| 4-methylphenol | 8.5 × 10⁻¹⁰ | 108 |
| 4-ethylphenol | 7.7 × 10⁻¹⁰ | 122 |
| guaiacol | 8.2 × 10⁻¹⁰ | 124 |
| vanillin | 7.2 × 10⁻¹⁰ | 152 |
| indole | 8.4 × 10⁻¹⁰ | 117 |
| acetic acid | 11.9 × 10⁻¹⁰ | 60.1 |
| 3-methylbutanoic acid | 8.3 × 10⁻¹⁰ | 102 |
| 2,3-pentanedione | 8.8 × 10⁻¹⁰ | 100 |
The Stokes–Einstein equation also gives rise to the relation of diffusivity with temperature and fluid viscosity
| 26 |
where T* = 298 K.
The viscosity of coffee solution filling the mesopores is estimated using41
| 27 |
where the mass fraction of coffee solids [xs,p (kgdry coffee kgsolution–1)] is obtained as
| 28 |
assuming that the maximum extractable solid content (0.3 w/w28) is entirely dissolved into the water in the coffee pores.
Initially, there is uniform aroma distribution in the oil layer (thickness = δ) within the mesopores (radius = rpor) and no free aroma
 |
29 |
where m0 is the aroma content per unit mass of coffee, ρp is the particle density, and εp is the particle porosity. Symmetry is assumed in the center of the particles, and a flux boundary condition is imposed on the boundary between the particle mesopores (cp in mol m–3) and surface water (cw in mol m–3)
| 30 |
3.3.2. Matrix Interactions
An irreversible reaction mechanism that is first order in each species, and with a 1:1 molar ratio of the reactants, is used to model interactions between aroma and the phenolic component of the unextractable coffee matrix42
| 31 |
where cdo is the concentration of the aroma (mol m–3), cdo,PP is the phenolic (binding species) concentration (mol m–3), and cdo,comp is the bound complex concentration (mol m–3), all within the oil phase. For compounds undergoing this binding, an additional reaction term is added to eq 21, leading to
| 32 |
Equation 32 can also be adapted for the phenolic and complexed species
| 33 |
| 34 |
The initial phenolic content has been taken or estimated from the literatures.43,44
4. Results and Discussion
The extraction problem formed by eqs 1–34 was solved using a self-developed one-dimensional forward time centered space (FTCS) finite difference (FD) scheme, which was implemented in MATLAB. Two sets of numerical simulations were performed:
-
(i)
Small-scale extraction simulations, which were used to calibrate the model for the range of operating conditions and coffee beds studied here. Values for the cell wall porosity (εcw), the ratio
 , and the binding rate constant (kon)
were estimated by fitting the proposed model
to the published data18 for similar extraction
systems (i.e., water-saturated-nitrogen stripping of a 5 g bed of
coffee wetted in a 1:1 ratio of water to coffee18).
, and the binding rate constant (kon)
were estimated by fitting the proposed model
to the published data18 for similar extraction
systems (i.e., water-saturated-nitrogen stripping of a 5 g bed of
coffee wetted in a 1:1 ratio of water to coffee18). -
(ii)
Industrial-scale simulations (i.e., large scale), which were used to evaluate how different process conditions (i.e., a variation on the process parameters) might affect the aroma profile characteristic of the resulting distillate.
4.1. Small-Scale Simulations
To calibrate
the model, published experimental data18 corresponding to the extraction kinetics of three key aroma compounds,
i.e., acetaldehyde, acetic acid, and pyridine, was used. These three
aromas display different extraction kinetics, so they were used to
estimate (i) cell wall porosity, (ii) ratio  , and (iii) binding rate constant, respectively.
Estimated values were then used for all other aromas.
, and (iii) binding rate constant, respectively.
Estimated values were then used for all other aromas.
Numerical simulations used 50 mesh nodes for the coarse particles, 5 mesh nodes for the fine ones, and 25 nodes for the bed domain. Mesh convergence was ensured by a sensitivity analysis on mesh sizes, as well as by comparing simulated results with analytical solutions38 for Fickian diffusion systems. Table 2 lists the model parameter values used to simulate the small-scale extraction system.
Table 2. Parameters Used for Model Calibration5,18,28.
| parameter | validation settings | parameter | validation settings |
|---|---|---|---|
| dc | 750 μm | Z | 0.024 m |
| dpart | 40 μm | dbed | 0.024 m |
| φf | 0.15 | ΔP | 8.3 kPa |
| d3,2 | 198 μm | K | 1.8 × 10⁻¹² m2 |
| Q | 1.24 × 10⁻⁵ m3 s–1 | ReN2 | 1.2 |
| εp | 0.42 | ScN2 | 1.2 |
| εb | 0.24 | ϕwc | 1 |
| ϱc | 1 337 kg m–3 | Tw | 353 K |
| σc | 0.28 | max extractable solids | 0.3 w/w |
| σf | 0.22 | ϕRCP | 0.6435 |
| rpor | 20 μm | polyphenolic content | 0.63 g kgcoffee–1 |
| δ | 1 μm | DPP | 1 × 10⁻¹⁰ m2 s–1 |
| KPP | 10 |
Estimates
for the unknown parameters (i.e., εcw,  and kon) that
minimized the error (in a least-squares sense) between published extraction
data18 and model outcomes for each aroma
extraction curve were obtained using regression analysis. Corresponding
values for root-mean-square error (RMSE), χ2, and
the coefficient of determination (R2)
are presented in Table 3.
and kon) that
minimized the error (in a least-squares sense) between published extraction
data18 and model outcomes for each aroma
extraction curve were obtained using regression analysis. Corresponding
values for root-mean-square error (RMSE), χ2, and
the coefficient of determination (R2)
are presented in Table 3.
Table 3. Error Analysis Using Root-Mean-Square Error (RMSE), χ2, and Coefficient of Determination (R2) Corresponding to the Model Calibration.
| simulation | RMSE | χ2 | R2 |
|---|---|---|---|
| acetaldehyde, monomodal distribution | 0.0681 | 0.00474 | 0.990 |
| acetaldehyde, bimodal distribution | 0.0561 | 0.00321 | 0.994 |
| acetic acid, monomodal distribution | 0.165 | 0.0278 | 0.976 |
| pyridine, monomodal distribution | 0.0545 | 0.00300 | 0.983 |
4.1.1. Acetaldehyde
A cell wall porosity (εcw) value was estimated by fitting the proposed extraction model to experimental data for acetaldehyde.18 No reaction with the soluble coffee solids (kon = 0) was assumed in this case. To assess the effect of multiple particle sizes on the extraction process, both monodisperse (coarse particles) and bidisperse (fine and coarse particles) beds were simulated, resulting in values of εcw = 3.30 and 2.76%, respectively. Figure 4 presents a comparison between reference data18 and the fitted extraction curves for each particle size, showing the goodness of the fit; i.e., experimental trends observed in Mateus et al.18 can be accurately reproduced.
Figure 4.

Comparison graphs between experimental data from Mateus et al.18 (solid line) and fitted model outputs (dashed line); acetaldehyde yield curves using (a) monodisperse coarse particles with εcw = 3.30% and (b) bidisperse coarse and fine particles using εcw = 2.76%.
There is limited literature on the porosity of plant cell walls. Schenker et al.45 published mercury porosimetry measurements, from which the contribution to total porosity made by the cell wall (typically <10 nm) can be estimated
| 35 |
The coffee particle density (ρp) was 622 kg m–3, Vpor = 850 mm3 g–1, and the cell wall porosity contribution was estimated45 to be 130 mm3 g–1, generating a total porosity (εp) of 0.53, a mesopore contribution (εmp) of 0.45, and a cell wall porosity (εcw) of 0.17.
A cell wall porosity of 17% is clearly larger than that estimated by the model; however, there are several reasons for why the “effective porosity” would be much lower. First, porosity below a certain size may not be appropriate for aroma transport or the restricted pore channel may not permit free diffusion. The hydrodynamic radius of arabinose was calculated to be around 0.4 nm46—aroma molecules of this size are approaching the size of the smallest nanopores. Larger molecules, including soluble coffee solids, would thus be trapped in these nanopores, blocking diffusion of other substances. Second, organic molecules interact with the polysaccharide matrix, further inhibiting diffusion. Any association of larger coffee solutes to the cell wall material will further inhibit diffusion through those nanopores via additional steric hindrance. Finally, the addition of water will cause absorption, which could compress the nanopores as the polysaccharide matrix swells.
Using the estimated cell wall porosity values, the effective diffusivity values were then obtained through eq 25, leading to values of Deff = 6.0 × 10⁻¹² and 4.7 × 10⁻¹² m2 s–1 for the monodisperse and bidisperse particle sizes, respectively. This results in hindrance factors (Hf) of 204 and 262, respectively, as given by
| 36 |
Hindrance values (Hf) obtained here were larger than those previously reported for caffeine and mineral ions,47,48 which range between Hf = 9 and 48. In addition to geometric factors considered in those other works,47,48 there are several possible explanations for these differences. First, the cited studies performed an extraction in very dilute conditions, whereas here, the wetted grain retains its soluble solid content (up to ca. 30% of the total mass), which will provide an additional steric hindrance. Second, interactions between solids and aroma molecules will further hinder diffusion, as well as influence the effective Henry’s constant. Third, the viscosity of the fluid within the grain is higher here (a viscosity ratio of 2.7), and diffusion coefficients in concentrated carbohydrate solutions can present very high hindrance factors due to viscosity effects.49 Finally, the bed may not experience uniform gas flow and total particle surface area contact with steam, further limiting mass transfer, in contrast to well-mixed systems with lower hindrance factors.
4.1.2. Acetic Acid
Using the estimated porosity values in Section 4.1.1, and assuming no reaction with the soluble coffee solids (kon = 0), the acetic acid extraction curve was simulated and compared to that of Mateus et al.18 data, giving a significant underprediction of extraction (see Figure 5a).
Figure 5.

Comparison of experimental data from Mateus et al.18 (solid line) and model outputs (dashed line) for acetic
acid yield curves using Henry’s volatility constant values
of H298 = 0.025 Pa mol–1 m3 with (a)  and (b)
  (estimated).
The almost linear extraction behavior at the beginning of the process (Figure 5a, solid line) may suggest that the extraction of acetic acid is limited principally by its ability to partition into the headspace. The sensitivity of the model to Henry’s law constant was thus studied
The
ratio  (see eq 12), was fitted to the
experimental data18 available, resulting
in an estimate that improved the model
performance (i.e., simulated kinetics for acetic acid followed experimental
trends, as shown in Figure 5b). This estimated value
(see eq 12), was fitted to the
experimental data18 available, resulting
in an estimate that improved the model
performance (i.e., simulated kinetics for acetic acid followed experimental
trends, as shown in Figure 5b). This estimated value  was
13% larger than the largest value given
by Sander.32
was
13% larger than the largest value given
by Sander.32
While partitioning acetic acid in water is well studied, its relationship with temperature is less consistently reported.32 There may also be interaction with minerals and other ions. Navarini and Rivetti50 showed that many equilibria between carbonates and minerals exist in a coffee solution. It is feasible that species may neutralize acids but could act as a sink for H+ that is accessed at later times. Alternatively, the “salting-out” effect of other soluble coffee species could have an effect.
When the model incorporates the fine particle fraction, little change in extraction behavior or yield was observed. Total extraction will, therefore, be limited by the flow rate of gas (replenishing the concentration gradient).
4.1.3. Pyridine
The extraction profile of pyridine displays a sharp plateau after about 10 min, after which no significant extraction occurs (see Figure 6).
Figure 6.

Comparison between experimental data from Mateus et al.18 (solid line) and fitted (dashed line) pyridine extraction curve with the estimated binding rate constant of kon = 1.9 × 10⁻⁵ m3 s–1 mol–1.
Mateus et al.18 attributed this behavior to the protonation of pyridine, rendering it involatile, but at the pH of coffee solutions (ca. 5.3), 40% of pyridine should still be unprotonated and free to diffuse and vaporize. It is, instead, hypothesized that pyridine binds irreversibly to some phenolic components.
The binding rate constant kon (see eq 31) was estimated by fitting the model for pyridine extraction.18 Simulations used the monodisperse particle distribution, the estimate for the cell wall porosity, and Henry’s law volatility constant taken from the literature. The resulting estimate for the irreversible first-order binding constant was kon = 1.9 × 10⁻⁵ m3 s–1 mol–1 (Figure 6).
Literature values of rate constants for aroma-binding reactions are rare, but Harrison and Hill42 gave model rates for aroma release of the order of 100–10–3 m s–1. However, these are different systems, and irreversible binding to phenolics will differ from reversible binding on proteins.
4.2. Large-Scale Column Simulations
The patent of Vitzthum and Koch24 describes ranges of process parameters that may be employed to produce an aromatized distillate. The model can be used to explore how variation in the process parameters might affect the aroma profile of the distillate. A range of aromas with different physical and sensory properties were taken to study the effect of the stripping process (data in Table S1):
Acetaldehyde—polar and volatile; high Henry’s constant.
Furaneol—polar and nonvolatile; very low Henry’s constant.
2-Furfurylthiol—apolar; high Henry’s constant.
Guaiacol—moderately apolar; moderate value of Henry’s constant (a compound with no extreme properties, useful for comparison with other aromas).
β-Damascenone—a strongly apolar compound with very high Henry’s constant.
Pyridine—representative of an aroma undergoing fast, irreversible binding.
Table 4 lists the process parameters of the reference system used for numerical simulation of the large-scale column.
Table 4. Parameters Used in the Simulation of Plant-Scale Operation5,24.
| parameter | validation settings | parameter | validation settings |
|---|---|---|---|
| dc | 1800 μm | Z | 2 m |
| dpart | 100 μm | dbed | 0.625 m |
| φf | 0.02 | ΔP | 50 kPa |
| d3,2 | 1306 μm | K | 3.4 × 10⁻¹⁰ m2 |
| Q | 0.263 m3 s–1 | ReN2 | 192 |
| εp | 0.42 | ScN2 | 0.807 |
| εb | 0.34 | ϕwc | 0.7 |
| ϱc | 1337 kg m–3 | Tw | 353 K |
| kc | 0.13 W m–1 K–1 | ϕRCP | 0.6435 |
| Cp,c | 1430 J kg–1 K–1 | max solids extractable | 0.3 w/w |
| σc | 0.28 | rpor | 20 μm |
| σf | 0.22 | δ | 1 μm |
| DPP | 1 × 10⁻¹⁰ m2 s–1 | polyphenolic content | 0.63 g kgcoffee–1 |
| KPP | 10 |
The yield (y) is defined as the product of distillate concentration (cdist) and volume (Vdist)
| 37 |
where
| 38 |
| 39 |
The steam density (ϱst) is calculated assuming it is an ideal gas. If yield decreases with time, it shows that the extraction rate is slowing, perhaps as the aromas become stripped from the particle surface and the process becomes internally diffusion-limited.
4.2.1. Steaming Time
A simple variable to control is the time taken to complete the steam strip. The time available is limited by effects on downstream processes and plant capacity—if longer is spent steaming every batch of coffee, then plant productivity falls. However, yield (both aroma and soluble solids) must be balanced with throughput, and aroma yield is linked to product quality (by potentially being perceived as more aromatic). The concentration and yield results of simulating a 20 and 40 min steam strip are shown in Figure 7.
Figure 7.

(a) Normalized concentration and (b) normalized yields (both normalized to values after 20 min of steam stripping) of some key aromas in the distillate when simulating 20 and 40 min steam stripping.
When the steaming time is doubled, the model predicts a dilution in many aromas to between 50 and 70% of the concentration obtained after 20 min. Figure 7a also shows that, for pyridine that is consumed by binding reactions with the coffee matrix, the concentration is <40% of the value after 20 min. In contrast, the very apolar compound (β-damascenone) is only slightly more dilute after 40 min, and a compound with a very low Henry’s volatility partition coefficient (furaneol) is over 20% more concentrated at the longer time.
Yields shown in Figure 7b for 2-furfurylthiol, guaiacol, and acetaldehyde increase by between 20 and 40% after doubling the steaming time. β-Damascenone and furaneol yields increase to beyond 200% and nearly 300%, respectively, showing that their rate of extraction is increasing over the 20–40 min time frame. Pyridine yield is almost unchanged, showing that by this point most have been either extracted or bound irreversibly to soluble coffee solids.
4.2.2. Types of Extraction Behavior
After simulating the behavior of aromas from all of the major aroma groups (see Table S1), we propose that the nonbinding compounds can be classified into three groups. Each group‘s extraction is limited by either (i) partition into the aqueous phase, (ii) internal diffusion, or (iii) partition into the steam phase. An example of each characteristic extraction kinetic is shown in Figure 8:
Type 1—low solubility in water. For very apolar compounds, such as β-damascenone, the aromas remain partitioned strongly in the mesopore oil layer; extraction is limited by the low solubility/partitioning in the aqueous phase. To enhance mass transfer, large internal concentration gradients between pore water and oil are needed. Over time scales of minutes, where the characteristic time for diffusion (R2/Dh) is of the order of hours, only mesopore water within the surface of the particles is depleted and sets up these large concentration gradients. As a result, extraction is strictly limited by surface area, and distillate concentration slowly falls with time.
Type 2—internal diffusion-controlled. Most compounds fall into the second category, as seen for acetaldehyde in the small-scale study (Figure 4a,b). After an initial peak in concentration in both water and steam phases as extraction from near the particle surface takes place, the aroma is quickly stripped out and concentration in the gas falls. Extraction is subsequently determined by internal diffusion.
Type 3—low volatility. Some very polar compounds, such as furaneol, have very low Henry’s law constants and remain strongly partitioned in the water phase. They quickly reach saturation concentration in the steam and their extraction is limited by how much steam can be contacted with the water in the time available. As a result, their concentration increases slowly as material accumulates in the water (increasing the saturation concentration in the steam). Over the time scale of practical steam stripping, this is the only effect to be seen; however, eventually, diffusion limitations would lower the concentration.
Figure 8.

Normalized concentration of aromas in the exiting steam, demonstrating the limiting factors in extraction (time shown is after the column reaches saturation temperature).
Figure 7a shows that there is some difference between the type 2 aromas when comparing 20 and 40 min stripping times, based on diffusion coefficients. The most polar and fastest diffusing compound (acetaldehyde—see Section 4.2 and Table S1) has the smallest (25%) reduction in concentration at the longer time compared to the greater diffusional limitations of 2-furfurylthiol (48%) and guaiacol (44%), which have diffusivities in water 60–70% that of acetaldehyde. There is a smaller differentiation between these two slower-diffusing type 2 compounds. This is probably due to the difference in octanol–water partition coefficients, which contribute to the total internal resistance to extraction, even though the release from the oil does not dominate.
4.2.3. Water Addition
To achieve saturation of particles in the bed, increasing amounts of water can be added to the column. In real systems, water may not be evenly distributed in the column, so “excess” water can be added to ensure saturation in the wetted regions of the bed. This both adds thermal mass, which must be heated by the steam (extending the column heating time) but will also dilute the material that diffuses into the free water. Figure 9 shows the effect of doubling the water–coffee ratio from −0.7 to 1.4 before steam stripping. The effects of larger amounts of water addition can be seen in these simulation results. The addition of water increases the column heating time from 339 to 428 s, although the heating phase is still short in comparison to the process time.
Figure 9.

(a) Normalized concentrations and (b) yields (normalized to values obtained at a water-to-coffee ratio of 0.7) of some key aromas in the distillate when simulating water-to-coffee ratios of 0.7 and 1.4 prior to steam stripping.
Figure 9 shows that concentrations were largely unaffected except for the type 3 compound, furaneol (see Figure 9). The diluting effect of adding extra water into the column reduces the equilibrium gas-phase concentration and slows the mass transfer from water to steam by reducing the concentration gradient. Pyridine concentration changes only slightly at higher water additions, suggesting that the binding reaction rate is not strongly dependent on dilution.
Yields of all compounds, however, fall with increasing water addition because of the dilution effect. Furaneol is the case, where the yield decreases significantly, reflecting the fall in concentration. This is probably due to the longer heating times associated with larger water additions. The longer the column takes to heat, the more time there is for binding reactions to occur prior to stripping from the column. Column heating time is therefore an important parameter for binding susceptible compounds.
4.2.4. Column Aspect Ratio
It has been assumed that there are no radial gradients in the bed. Changing the height of the coffee bed (either through different column fill settings or when developing new process equipment) will, however, affect the steam-stripping process.
By changing the height over which the pressure gradient is exerted, fluid flow will change. In addition, the ratio of aromas enriched through longer advection lengths to those that quickly reach saturation in the headspace due to poor headspace partitioning will change. The extremes of the height-to-diameter ratios (0.9:1 and 3.2:1), as described in the patent of Vitzthum and Koch,24 are simulated, and the results are shown in Figure 10.
Figure 10.

(a) Normalized concentration and (b) yields (normalized to the values at a height-to-diameter ratio of 3.2) of some key aromas in the distillate when simulating bed height-to-diameter ratios of 3.2 and 0.9.
Figure 10a shows that furaneol and pyridine are the compounds most affected by the faster-flowing steam. Although all compound yields increase with the faster flow (due to larger water-to-steam concentration gradients), the effect is particularly strong for type 3 compounds. For these, the water-to-gas limitation means that its yield (at these time scales) is largely determined by the amount of steam that can be contacted with the water in the given time period. For pyridine, reducing the column heating time and faster extraction relative to the binding reaction speed increases the overall yield.
The yield of furaneol increases significantly. Figure 11 shows a plot of the concentration of furaneol within the two columns. Steam quickly becomes saturated with furaneol toward the base of the column, but as the steam rises into the lower pressure (and cooler) part of the column, the material transfers back into the free water phase, lowering the concentration. By altering the aspect ratio, the shorter column, with its faster flow, does not allow as much time for this back-transfer to occur, and, as such, more material remains in the flowing steam and the distillate concentration increases. Figure 11b thus shows how the plume of high concentration reaches the top of the short column, while in the taller column, the stripping time is not long enough to extract much furaneol.
Figure 11.

Contour plots of furaneol concentration in steam for columns of two height-to-diameter ratios (a) 3.2 and (b) 0.9. Data is normalized to the maximum concentration.
5. Conclusions
A model for the steam stripping of aromas has been built and validated against the published data. A study of a selection of key aroma compounds has been presented. The saturated coffee bed model can describe the gas-stripping extraction of some aromas at the small-scale well, having been validated against the published data. The extraction of acetic acid is least well described, and this is probably related to the as-yet-undescribed weak and reversible interactions with other coffee components.
The model has been used to study a range of representative aroma compounds. A classification of compounds can be made in terms of their partitioning and binding behavior. Type 1 aromas (strongly apolar compounds) fall in concentration slowly with increased steaming. At practical steam-stripping time scales, compounds with high Henry’s law constants quickly become diffusion-limited (type 2), while those that partition poorly into the headspace are water-to-steam transfer-limited (type 3). Irreversibly binding compounds are best extracted quickly before being consumed by the reaction.
The model has been used to assess the significance of steaming time, and column geometry varies across the spectrum of aroma compounds. Further work will incorporate new process variables and explore the capacity for process optimization. It should be noted that many compounds share physical and chemical properties to those simulated but have different sensory properties. Sensory perception is also not directly proportional to aroma concentration, so it should not be assumed that an increase in the concentration of a “sweet” compound will make for a sweeter instant coffee. There is some cross-over between the sensory attributes of the categories, so relating sensory attributes to process variables will be complex.
Further model development should include the steam stripping of dry and partially wet coffee. This must incorporate a wetting model, where condensing steam is absorbed and then enhances the extraction of certain compounds. Experimental results should validate the suitability of the aforementioned wetting model, the Carman–Kozeny and Darcy equations for steam flow, and the trends predicted in aroma extraction. This will lead to a more versatile and reliable predictive model for use in tailoring process conditions to the desired chemical and sensory outcomes.
Acknowledgments
D.B. acknowledges sponsorship and support from Jacobs Douwe Egberts through the Centre for Doctoral Training in Formulation Engineering (EPSRC grant no. EP/L015153/1). The authors also acknowledge funding received from the Centre for Sustainable Energy Use in Food Chains, CSEF (EPSRC grant no. EP/K011820/1).
Supporting Information Available
The Supporting Information is available free of charge at https://pubs.acs.org/doi/10.1021/acs.iecr.0c01153.
Table S1 contains a comprehensive list of aroma compounds and corresponding chemical structures, octanol–water partition coefficients, boiling points, sensory notes, and Henry’s law constant values at 298 K (PDF)
Author Contributions
D.B., methodology, software, formal analysis, writing (original and editing), and visualization; E.L.-Q., methodology, writing (review and editing), and supervision; R.F., methodology, writing (review and editing), and supervision; J.M., conceptualization, methodology, writing (review and editing), and supervision; S.H., conceptualization, supervision, writing (review and editing), and project administration; S.B., conceptualization, supervision, writing (review and editing), project administration, and funding acquisition; and P.J.F., supervision, writing (review and editing), project administration, and funding acquisition.
The authors declare no competing financial interest.
Supplementary Material
References
- Farah A.Coffee as a Speciality and Functional Beverage. In Functional and Speciality Beverage Technology;Paquin P., Ed.; Woodhead Publishing Series in Food Science, Technology and Nutrition; Woodhead Publishing: Cambridge, 2009; pp 370–395. [Google Scholar]
- International Coffee Organization, ICO. Coffee Market Continues Downward Trend, Coffee Market Report; ICO, 2018, http://www.ico.org/documents/cy2017-18/cmr-0318-e.pdf (accessed April 12, 2018).
- International Coffee Organization, ICO. Trends in Coffee Consumption in Selected Importing Countries, International Coffee Council, 109th Session, 24–28 Sept 2012, London, United Kingdom, 2012. http://www.ico.org/documents/icc-109-8e-trends-consumption.pdf (accessed June 21, 2018).
- Buffo R. A.; Cardelli-Freire C. Coffee Flavour: An Overview. Flavour Fragrance J. 2004, 19, 99–104. 10.1002/ffj.1325. [DOI] [Google Scholar]
- Corrochano B. R.; Melrose J.; Bentley A. C.; Fryer P. J.; Bakalis S. A New Methodology to Estimate the Steady-state Permeability of Roast and Ground Coffee in Packed Beds. J. Food Eng. 2015, 150, 106–116. 10.1016/j.jfoodeng.2014.11.006. [DOI] [Google Scholar]
- Mahlmann J. P.Method of Producing Aromatized Coffee Extract. US3,132,947, May 12, 1964.
- Grubbs D. R.Process for Steaming Coffee. European Patent EP0086526A3, Oct 3, 1984.
- Furrer M.; Gretsch C.. Coffee Aroma Recovery Process. European Patent EP1211948B1, Sept 26, 2012.
- Usseglio M.; Salvadori V.; Siri G. Advanced Modeling of Vegetable Oils Steam Stripping with Structured Packing Columns. Comput. Chem. Eng. 2019, 121, 654–669. 10.1016/j.compchemeng.2018.12.007. [DOI] [Google Scholar]
- Cerpa M. G.; Mato R. B.; Cocero M. J. Modeling Steam Distillation of Essential Oils: Application to Lavandin Super Oil. AIChE J. 2008, 54, 909–917. 10.1002/aic.11438. [DOI] [Google Scholar]
- Schenker S.Investigations on the Hot Air Roasting of Coffee Beans. Ph.D. Thesis, ETH Zurich, 2000. [Google Scholar]
- Zhang C.; Linforth R.; Fisk I. D. Cafestol Extraction Yield from Different Coffee Brew Mechanisms. Food Res. Int. 2012, 49, 27–31. 10.1016/j.foodres.2012.06.032. [DOI] [Google Scholar]
- Couto R. M.; Fernandes J.; Gomes da Silva M. D. R.; Simões P. C. Supercritical Fluid Extraction of Lipids from Spent Coffee Grounds. J. Supercrit. Fluids 2009, 51, 159–166. 10.1016/j.supflu.2009.09.009. [DOI] [Google Scholar]
- Mateus M. L.; Rouvet M.; Gumy J. C.; Liardon R. Interactions of Water with Roasted and Ground Coffee in the Wetting Process Investigated by a Combination of Physical Determinations. J. Agric. Food Chem. 2007, 55, 2979–2984. 10.1021/jf062841g. [DOI] [PubMed] [Google Scholar]
- Mateus M. L.; Champion D.; Liardon R.; Voilley A. Characterization of Water Mobility in Dry and Wetted Roasted Coffee Using Low-field Proton Nuclear Magnetic Resonance. J. Food Eng. 2007, 81, 572–579. 10.1016/j.jfoodeng.2006.12.015. [DOI] [Google Scholar]
- Mestdagh F.; Davidek T.; Chaumonteuil M.; Folmer B.; Blank I. The Kinetics of Coffee Aroma Extraction. Food Res. Int. 2014, 63, 271–274. 10.1016/j.foodres.2014.03.011. [DOI] [Google Scholar]
- Sánchez López J. A.; Wellinger M.; Gloess A. N.; Zimmermann R.; Yeretzian C. Extraction Kinetics of Coffee Aroma Compounds Using a Semi-automatic Machine: On-line Analysis by PTR-ToF-MS. Int. J. Mass Spectrom. 2016, 401, 22–30. 10.1016/j.ijms.2016.02.015. [DOI] [Google Scholar]
- Mateus M. L.; Lindinger C.; Gumy J. C.; Liardon R. Release Kinetics of Volatile Organic Compounds from Roasted and Ground Coffee: Online Measurements by PTR-MS and Mathematical Modelling. J. Agric. Food Chem. 2007, 55, 10117–10128. 10.1021/jf071901v. [DOI] [PubMed] [Google Scholar]
- Guichard E.Interaction of Aroma Compounds with Food Matrices. In Flavour Development, Analysis and Perception in Food and Beverages; Parker J. K.; Elmore S.; Methven L.; José M., Eds.; Woodhead Publishing Series in Food Science, Technology and Nutrition; Woodhead Publishing: Cambridge, 2015; pp 273–295. [Google Scholar]
- Xavier V. B.; Vargas R. M. F.; Cassel E.; Lucas A. M.; Santos M. A.; Mondin C. A.; Santarem E. R.; Astarita L. V.; Sartor T. Mathematical Modelling for Extraction of Essential Oil from Baccharis spp. by Steam Distillation. Ind. Crop. Prod. 2011, 33, 599–604. 10.1016/j.indcrop.2010.12.019. [DOI] [Google Scholar]
- Moroney K. M.; Lee W. T.; O’Brien S. B. G.; Suijver F.; Marra J. Modelling of Coffee Extraction During Brewing Using Multiscale Methods: An Experimentally Validated Model. Chem. Eng. Sci. 2015, 137, 216–234. 10.1016/j.ces.2015.06.003. [DOI] [Google Scholar]
- Melrose J. R.; Corrochano B.; Montoya-Guerra M.; Bakalis S. Towards a New Brewing Control Chart for the 21st Century. J. Agric. Food Chem. 2018, 66, 5301–5309. 10.1021/acs.jafc.7b04848. [DOI] [PubMed] [Google Scholar]
- Beverly D.; Fryer P. J.; Bakalis S.; Lopez-Quiroga E.; Farr R. Mathematical Modelling of the Steam Stripping of Aroma from Roast and Ground Coffee. Energy Procedia 2019, 161, 157–164. 10.1016/j.egypro.2019.02.075. [DOI] [Google Scholar]
- Vitzthum O.; Koch K. D.. Process for the Preparation of Soluble Coffee. European Patent EP0489401B1, June 10, 1992.
- Amézqueta S.; Subirats X.; Fuguet E.; Rosés M.; Ràfols C.. Octanol–Water Partition Constant. In Liquid-Phase Extraction; Poole C. F., Ed.; Handbooks in Separation Science; Elsevier, 2020; pp 183–208. [Google Scholar]
- Sangster J. Octanol-Water Partition Coefficients of Simple Organic Compounds. J. Phys. Chem. Ref. Data 1989, 18, 1111–1227. 10.1063/1.555833. [DOI] [Google Scholar]
- Noubigh A.; Mgaidi A.; Abderrabba M. Temperature Effect on the Distribution of Some Phenolic Compounds: An Experimental Measurement of 1 Octanol/Water Partition Coefficients. J. Chem. Eng. Data 2010, 55, 488–491. 10.1021/je900271h. [DOI] [Google Scholar]
- Corrochano B. R.Advancing the Engineering Understanding of Coffee Extraction. Eng.D. Thesis, University of Birmingham, 2017. [Google Scholar]
- Barrett J.; Clement C. Kinetic Evaporation and Condensation Rates and Their Coefficients. J. Colloid Interface Sci. 1992, 150, 352–364. 10.1016/0021-9797(92)90205-Z. [DOI] [Google Scholar]
- Farr R.; Groot R. Close Packing Density of Polydisperse Hard Spheres. J. Chem. Phys. 2009, 131, 244104 10.1063/1.3276799. [DOI] [PubMed] [Google Scholar]
- International Association for the Properties of Water and Steam, IAPWS . Knovel Steam Tables; Knovel Corporation, 2018. https://app.knovel.com/web/toc.v/cid:kpKST00001/viewerType:toc/ (accessed June 28, 2018). [Google Scholar]
- Sander R. Compilation of Henry’s Law Constants (Version 4.0) for Water as a Solvent. Atmos. Chem. Phys. 2015, 15, 4399–4981. 10.5194/acp-15-4399-2015. [DOI] [Google Scholar]
- Wieland F.; Neff A.; Gloess A. N.; Poisson L.; Atlan S.; Larrain D.; Prêtre D.; Blank I.; Yeretzian C. Temperature Dependence of Henry’s Law Constants: An Automated, High-throughput Gas Stripping Cell Design Coupled to PTR-Tof-MS. Int. J. Mass Spectrom. 2015, 387, 69–77. 10.1016/j.ijms.2015.07.015. [DOI] [Google Scholar]
- Rigaki A.; Webb C.; Theodoropoulos C. Double substrate limitation model for the bio-based production of succinic acid from glycerol. Biochem. Eng. J. 2020, 153, 107391 10.1016/j.bej.2019.107391. [DOI] [Google Scholar]
- Harned H. S.; Ehlers R. W. The Dissociation Constant of Acetic Acid from 0 to 60° Centigrade. J. Am. Chem. Soc. 1933, 55, 652–656. 10.1021/ja01329a027. [DOI] [Google Scholar]
- Carberry J. A Boundary-Layer Model of Fluid-Particle Mass Transfer in Fixed Beds. AIChE J. 1960, 6, 460–462. 10.1002/aic.690060323. [DOI] [Google Scholar]
- Wakao N.; Funazkri T. Effect of Fluid Dispersion Coefficients on Particle-to-fluid Mass Transfer Coefficients in Packed Beds. Chem. Eng. Sci. 1978, 33, 1375–1384. 10.1016/0009-2509(78)85120-3. [DOI] [Google Scholar]
- Crank J.The Mathematics of Diffusion, 2nd ed.; Clarendon Press: Oxford, 1975. [Google Scholar]
- Shen L.; Chen Z. Critical Review of the Impact of Tortuosity on Diffusion. Chem. Eng. Sci. 2007, 62, 3748–3755. 10.1016/j.ces.2007.03.041. [DOI] [Google Scholar]
- Yaws C. L.Yaws’ Handbook of Thermodynamic and Physical Properties of Chemical Compounds: Physical, Thermodynamic and Transport Properties for 5,000 Organic Chemical Compounds; Knovel Corporation, 2003. https://app.knovel.com/hotlink/toc/id:kpYHTPPCC4/yaws-handbook-thermodynamic/yaws-handbook-thermodynamic. [Google Scholar]
- Sobolík V.; Žitný R.; Tovcigrecko V.; Delgado M.; Allaf K. Viscosity and Electrical Conductivity of Concentrated Solutions of Soluble Coffee. J. Food Eng. 2002, 51, 93–98. 10.1016/S0260-8774(01)00042-5. [DOI] [Google Scholar]
- Harrison M.; Hills B. Mathematical Model of Flavor Release from Liquids Containing Aroma-Binding Macromolecules. J. Agric. Food Chem. 1997, 45, 1883–1890. 10.1021/jf9607876. [DOI] [Google Scholar]
- Wang X.; Lim L.-T.. Physiochemical Characteristics of Roasted Coffee. In Coffee in Health and Disease Prevention; Preedy V. R., Ed.; Academic Press, 2015; pp 247–254. [Google Scholar]
- Pedras B. M.; Nascimento M.; Sá-Nogueira I.; Simões P.; Paiva A.; Barreiros S. Semi-continuous Extraction/Hydrolysis of Spent Coffee Grounds with Subcritical Water. J. Ind. Eng. Chem. 2019, 72, 453–456. 10.1016/j.jiec.2019.01.001. [DOI] [Google Scholar]
- Schenker S.; Handschin S.; Frey B.; Perren R.; Escher F. Pore Structure of Coffee Beans Affected by Roasting Conditions. J. Food Sci. 2000, 65, 452–457. 10.1111/j.1365-2621.2000.tb16026.x. [DOI] [Google Scholar]
- Schultz S. G.; Solomon A. K. Determination of the Effective Hydrodynamic Radii of Small Molecules by Viscometry. J. Gen. Physiol. 1961, 44, 1189–1199. 10.1085/jgp.44.6.1189. [DOI] [PMC free article] [PubMed] [Google Scholar]
- Spiro M.; Chong Y. Y. The Kinetics and Mechanism of Caffeine Infusion from Coffee: the Temperature Variation of the Hindrance Factor. J. Sci. Food Agric. 1997, 74, 416–420. 10.1002/(SICI)1097-0010(199707)74:3<416::AID-JSFA868>3.0.CO;2-0. [DOI] [Google Scholar]
- Jaganyi D.; Madlala S. P. Kinetic of Coffee Infusion: a Comparative Study on the Extraction Kinetics of Mineral Ions and Caffeine from Several Types of Medium Roasted Coffees. J. Sci. Food Agric. 2000, 80, 85–90. 10.1002/(SICI)1097-0010(20000101)80:1<85::AID-JSFA489>3.0.CO;2-#. [DOI] [Google Scholar]
- Oosting E. M.; Gray J. I.; Grulke E. A. Correlating Diffusions Coefficients in Concentrated Carbohydrate Solutions. AIChE J. 1985, 31, 773–780. 10.1002/aic.690310511. [DOI] [Google Scholar]
- Navarini L.; Rivetti D. Water quality for Expresso coffee. Food Chem. 2010, 122, 424–428. 10.1016/j.foodchem.2009.04.019. [DOI] [Google Scholar]
Associated Data
This section collects any data citations, data availability statements, or supplementary materials included in this article.