

Abstract
Background
This study is part of the Stroke Investigative Research and Educational Network (SIREN), the largest study in Africa of stroke patients to date, with computed tomography (CT) or magnetic resonance (MR) imaging data for each patient to confirm stroke. Prior imaging studies performed using high-field MR (≥1.5T) have shown that white matter hyperintensities (WMH), signs of microangiopathy in the subcortical brain, are correlated with many stroke risk factors as well as poor stroke outcomes. The aim of this study was the evaluation of MR images (0.3T to 1.5T) from the SIREN study to determine associations between WMH volumes in West African patients and both stroke outcomes and stroke risk factors determined in the SIREN study.
Materials and Methods
Brain MR images of 130 Western African stroke patients (age = 57.87 ± 14.22) were processed through Lesion Segmentation Toolbox of the Statistical Parametric Mapping software to extract all areas of hyperintensity in the brain. WMH was separated from stroke lesion hyperintensity and WMH volume was computed and summed. A stepwise linear regression and multivariate analysis was performed between patients’ WMH volume and sociodemographic and clinical indices.
Results
Multivariate analysis showed that high WMH volume was statistically significantly positively correlated with age (β=0.44, p=0.001), waist/hip ratio (β=0.22, p=0.03), and platelet count (β=0.19, p=0.04) after controlling for head size in a Western African stroke population.
Conclusion
Associations between WMH and age and waist/hip ratio previously identified in Western countries were demonstrated for the first time in a resource-limited, homogeneous black African community using low-field MR scanners.
Keywords: stroke, West Africa, magnetic resonance imaging (MRI), lesion segmentation, white matter hyperintensity, SIREN
1. Introduction
Stroke was recognized as the second leading cause of death around the world in 2016 by the World Health Organization (WHO).1 The WHO estimates that the burden of stroke in low and middle-income countries is seven times higher than in high-income countries. 2,3 Cardiovascular disease, of which stroke is a major component, is growing fast and already overtaking infectious diseases in some of these countries as the leading cause of death and disability.4,5 Sub-Saharan African (SSA) countries are expected to see some of the largest increases in mortality due to non-communicable disease in the world, secondary to increasing urbanization and the associated increase in exposure to several risk factors for non-communicable disease.5 Stroke incidence rates in SSA are equal to or higher than rates anywhere else in the world.6 Resource constraints in Africa cause financial difficulties in stroke treatment and management, so prevention of stroke is crucial to reducing its burden. Prior studies have found that strokes in Africa may be of different etiologies than strokes that occur in the Western world, with significantly more hemorrhagic strokes occurring in Africa.7 Until recently, few studies have attempted to determine the cause of the underlying differences in African stroke etiology.
The Stroke Investigative Research and Education Network (SIREN) study was started in 2015 to address the burden of stroke, determine the reasons for the escalating epidemic, and evaluate the factors behind the differences of stroke in western countries and African countries.8 It is the largest stroke study worldwide that focuses on African patients, with over 2000 case-controlled stroke patients.9 The SIREN study has identified unique contributions from demographic, environmental and genetic factors to the risk and outcomes of stroke and its subtypes in SSA, as well as modifiable lifestyle risk factors that predispose patients to stroke.10 The SIREN dataset provides a wealth of clinical, genomic and lifestyle-based variables that can be used for identification of the unique features of stroke in Sub-Saharan Africa.
One area of the SIREN data that has yet to be thoroughly explored is the medical imaging data. Stroke studies performed in western populations have identified several imaging parameters that can estimate likelihood of stroke, stroke severity and other clinical outcomes.11–20 Infarct volume has been shown to be significantly correlated with stroke outcomes.20 However, infarct parameters alone are not the only correlates of stroke outcomes. Another major area of focus in stroke imaging is the study of white matter hyperintensities (WMHs).21 WMHs are areas of rarefication of white matter in the brain that naturally increase with age.22 Since WMHs are soft tissue changes, the modality of choice for viewing WMHs is magnetic resonance imaging (MRI).21 The decreased density of WMHs appears as increased signal intensity on T2-weighted Fluid Attenuated Inversion Recovery (FLAIR) images.21 The causes of WMHs are varied and not well understood; however, studies have noted that WMHs are correlated positively with markers of endothelial damage, suggesting their presence may indicate microangiopathies in the brain.13,23,24 WMHs have also been associated with post-stroke motor impairment.25 The locations of WMHs have been noted as a possible modifier of stroke outcome – WMH in the corpus callosum, corona radiata, posterior thalamic radiation and other deep structures have all been associated with increased post-stroke cognitive impairment.26,27 WMH has been associated with high risks of death and neurological outcomes in stroke patients in the past.28–30 Studies have shown that overall stroke risk increased as the number and volume of WMHs in the brain increased, both in major and minor strokes. 11,17,31–33 This was found to be true in a Nigerian patient population as well.34 However, because MRI is an expensive resource and not the primary imaging modality for stroke diagnosis, only two studies have ever been performed regarding WMH and strokes in Sub-Saharan Africa, both examining fewer than 60 patients from a single Nigeria city.34,35 Furthermore, low-field MR scanners are used in west Africa compared to the high-field MR scanners used in research in other countries, resulting in poorer image quality, a limitation for robust review comparative studies.36 Given the limitations in performing WMH studies using low-field scanners in developing countries, most of the current knowledge about the associations between WMH and stroke was established in Western patient populations. As a result, there is a knowledge gap about the relationship between stroke and WMH in this unique group of Africans. It has been suggested previously that there are associations between race and WMH severity; African Americans were identified to be particularly at greater risk.37 Stroke was similarly more common in the black population of Manhattan compared to other racial groups.38 There may be other unexplored differences in WMH and stroke characteristics between black and white populations, and possibly between Africans and African-American populations as well. The multicenter SIREN imaging dataset is the largest MRI dataset of West African stroke patients and offers a unique opportunity to elucidate whether the associations found between WMH and stroke in Western patients are true in African patients, and to determine the comparative contributions of low-field MR for analysis of WMH in stroke in a developing African country. This study will help fill a knowledge gap about WMH in West African patients. The multiple center origin of the patient population and the large sample size make this study more generalizable than aforementioned studies of WMH in West Africa. In using a volumetric analysis of WMH burden, this study attempts to remove the subjectivity that the visual rating scale of WMH severity introduces. Visual rating scales were the only method used in previous studies to evaluate WMH burden in West African patients.
2. Materials and Methods
Our Institutional Review Board (IRB) approved study (University of Chicago IRB#18–0818) aimed to correlate findings from the imaging data of SIREN patients with stroke severity and clinical outcomes, as measured by several parameters listed in the SIREN protocol, including the modified Rankin Score (mRS)39, National Institute of Health Stroke Score (NIHSS)40 and Barthel Index41. It also attempted to determine the relationships between MR imaging parameters and lifestyle data, including risk factors cited in the latest SIREN study, as well as markers of endothelial damage and chronic systemic inflammation. Methods were adapted from stroke studies in Western countries to determine if the parameters from those studies would be able to model stroke outcomes in African patients as well.11,19,21,31,42,43 The focus of our research was on two imaging parameters commonly associated with stroke outcomes: stroke lesion volume – infarct size in ischemic stroke and hemorrhage volume in hemorrhagic stroke – and total WMH volume as measured on T2-weighted FLAIR MR images.
2.1. Patient Recruitment & Data Acquisition
The SIREN study is a multicenter case-controlled study of stroke performed across 15 different hospitals in Ghana and Nigeria, and it is at present the largest study of stroke in African patients.10 In the SIREN study, 2118 adult patients (aged ≥18 years) with acute stroke were matched by gender, age and ethnicity with stroke-free controls. All strokes were confirmed by computed tomography (CT) or magnetic resonance imaging (MRI) within 10 days of the first onset of stroke symptoms, and the stroke subtype (hemorrhagic vs. ischemic) was documented.8 For this specific sub-study of SIREN, all patients who received MRI were included for analysis. Data on socioeconomic, lifestyle and psychosocial factors were obtained from all patients, and echocardiograms and laboratory tests were performed to determine baseline measurements.10 Patients were then followed up to 12 months after admission to determine clinical outcomes, with an assessment of their cognitive and motor abilities performed at baseline, 1, 3, 6, 9 and 12 months following their first admission to the hospital. A detailed protocol for the study has been previously published.8 Informed consent was obtained from all patients or their next of kin prior to enrollment. Ethical approval was obtained from all study sites and informed consent was obtained from all participants before enrollment.
2.2. Magnetic Resonance Image Acquisition and Image Processing
MR images were acquired between 2014 and 2017 at 15 sites in Nigeria and Ghana. All MRI exams were performed within 196 hours of stroke symptom onset on available field systems, either 0.3T or 0.36T (108 cases) [0.3T (AIRIS Vento O5 0.3T, Hitachi Healthcare, Tokyo, Japan), 0.36T (MagSense 360 MRI System, Shenzhen Mindray Bio-Medical Electronics Company, Guangdong Sheng, Shenzhen, China)] or 1.5T field systems (22cases) [1.5T (Genesis Signa, GE Healthcare, Waukesha, WI, USA; Magnetom Essenza 1.5T, Siemens Healthineers, Erlangen, Germany; Vantage Titan 1.5T Zen Edition, Canon Medical Systems, Otawara, Japan)]. A standard stroke MRI protocol including scout, T2*weighted, T2-weighted FLAIR and T1-weighted sequences were obtained in all cases, with diffusion weighted imaging (DWI) in cases obtained on 1.5T MRI systems.
Of 2118 stroke patients enrolled in the SIREN study, 152 patients completed the stroke MRI protocol, notably including T1-weighted images and T2-weighted FLAIR images, both of which were required for analysis.44 Five patients who presented with gross congenital cerebral malformations or brain tumors discovered in the images were excluded from the analysis to avoid confounding factors in the statistical analysis. Of the remaining 147 patients, 17 patients with incomplete clinical data were also excluded. A full workflow of the patient selection in this study is shown in Figure 1.
Figure 1.
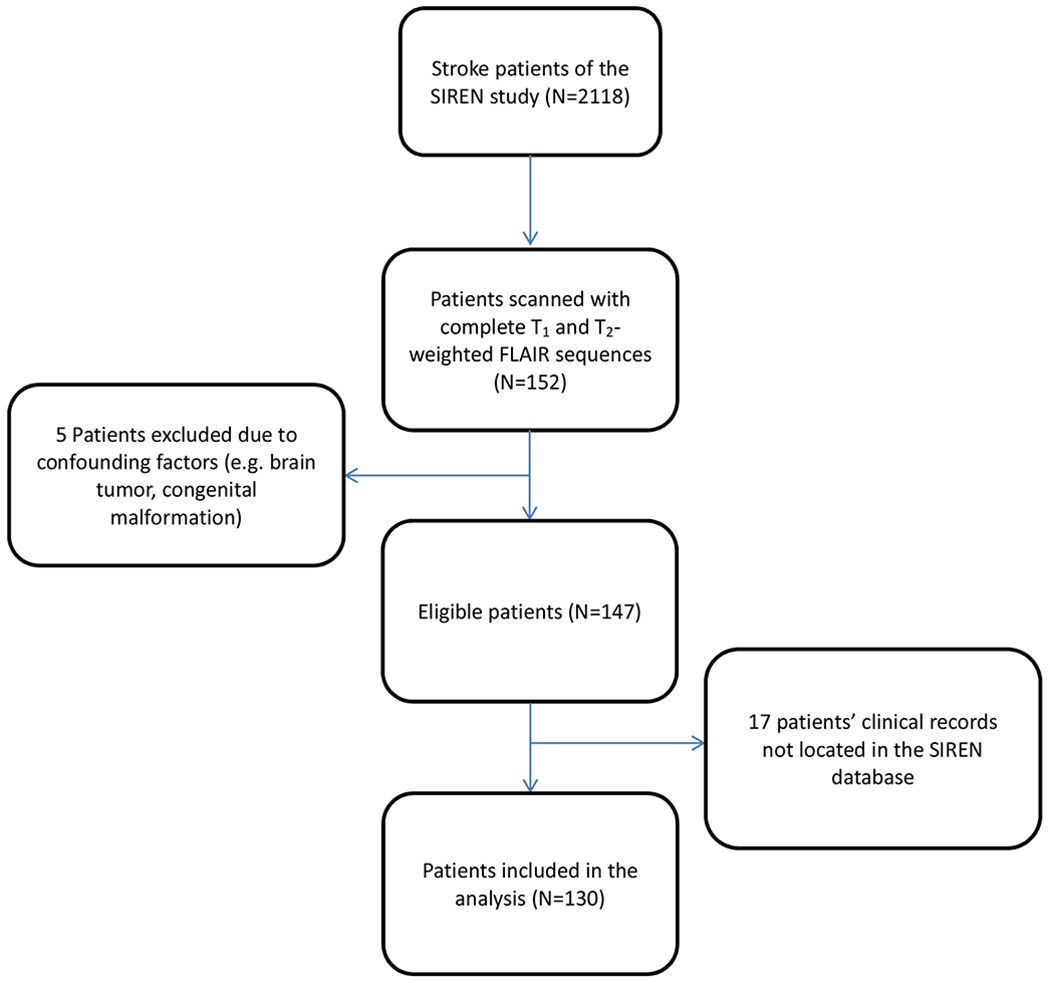
Flowchart of the stroke patient selection in this study. From the 152 patients with both T1 and T2-weighted Fluid Attenuated Inversion Recovery (FLAIR) MRI sequences. Of 2118 patients enrolled in the SIREN study, 130 were included in the analysis of this study.
MR images were converted from Digital Imaging and Communications in Medicine (DICOM) to Analyze format (Analyze 7.5, Biomedical Imaging Resource, Mayo Clinic, Rochester, MN, USA) using MRI convert45. Axial T1-weighted images were segmented into grey matter, white matter and cerebrospinal fluid (CSF) using Statistical Parametric Mapping (SPM12) software46. Axial T2-weighted FLAIR images were processed in a semiautomatic manner. Images were segmented by the lesion prediction algorithm44 as implemented in the Lesion Segmentation Tool (LST) toolbox version 2.0.15 for SPM47, which delineates all hyperintense regions in an image (Figure 2, Figure 3).
Figure 2.
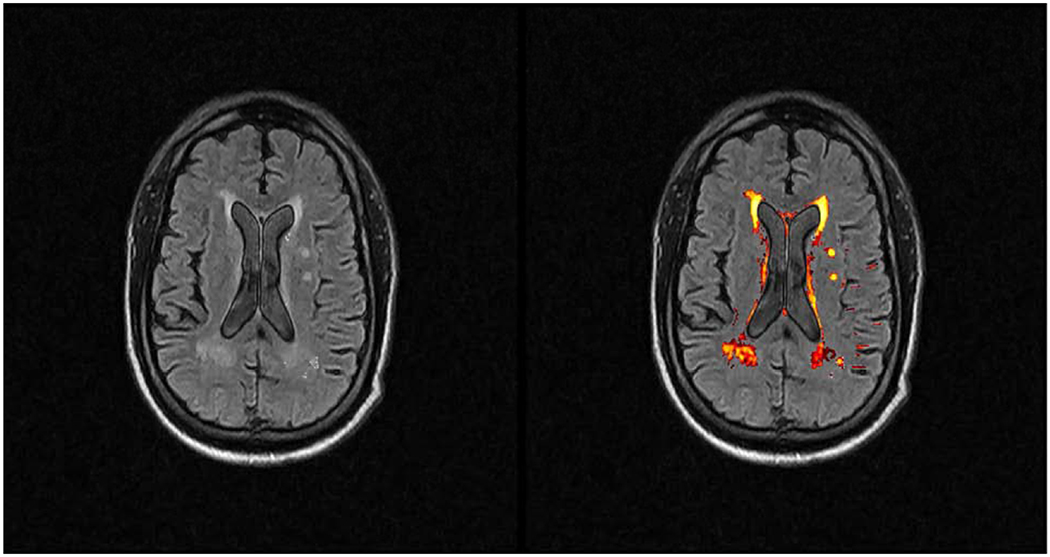
Axial T2-weighted Fluid Attenuated Inversion Recovery (FLAIR) image of an adult patient with bilateral periventricular white matter hyperintensities (WMHs) on the left image. The LST software output identifies the WMHs and highlights them on the right image. The software was originally designed for MS lesion segmentation, and appropriately segments white matter lesions in the subcortical brain.
Figure 3.
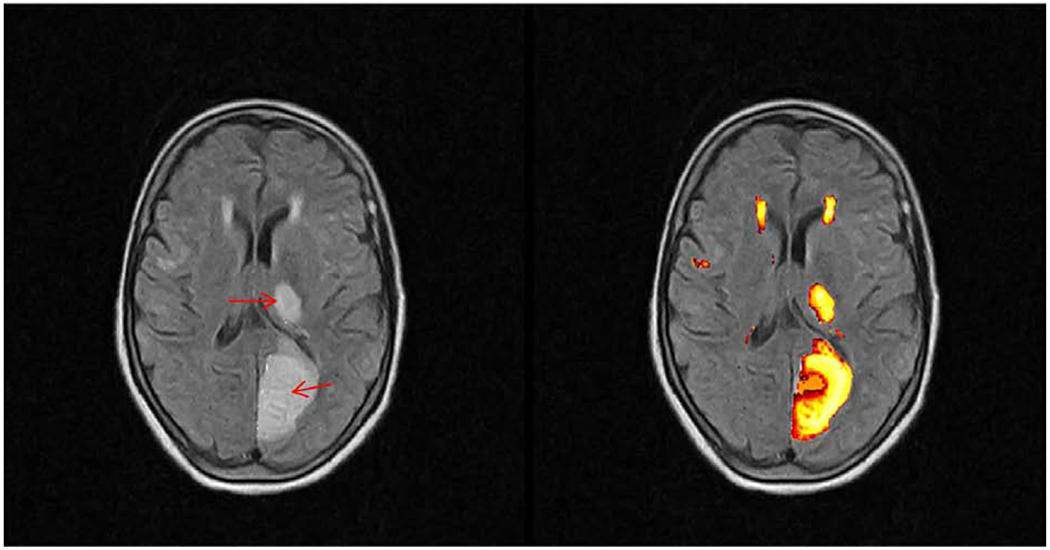
Axial T2-weighted FLAIR images of a left Posterior Cerebral Artery (PCA) infarction involving the left occipital lobe and thalamus. LST output provides a well-demarcated segmentation of subcortical ischemic lesions in the patient’s left hemisphere on the right image. The core areas of infarct are indicated by red arrows. Also highlighted around the anterior horns of the lateral ventricles are white matter hyperintensities. These WMHs were separated from the stroke lesions through ROI selection.
2.3. Lesion Evaluation and Analysis
T2-weighted FLAIR images were visualized using MRIcro version 1.4048. All acute stroke lesions were identified through clinical evaluation by a neurologist and verified on imaging studies by a radiologist and verified as either ischemic or hemorrhagic stroke. In cases of conflicting opinions, the images were re-evaluated jointly with a senior radiologist. A region of interest (ROI) demarcating the lesion was meticulously drawn on all imaging slices that contained the stroke lesion. This ROI was masked and separated from the remaining hyperintensities. The remaining volume of hyperintense signal was quantified to determine the total volume of WMH. All non-zero voxels, as calculated by the LST software in these separated images, were included as part of the stroke and lesion volumes after a slice by slice visual verification of correct segmentation. Inappropriately segmented areas were manually removed through ROI masking. In cases where the software was unable to identify all lesions, like in cortical, pontine or hemorrhagic strokes, volumes were calculated manually by drawing an ROI around the lesions and determining the volume of the ROI. In cases where stroke volume appeared to overlay areas where WMH may have been previously present, the area in question was only included in the stroke lesion volume, which may have underestimated total WMH volumes. In some rare cases where WMHs were not detected by the software but present according to the radiologist’s impression, manual ROIs were drawn around the undetected WMH. These manual ROIs were included in the total stroke volume and WMH volume, respectively. Intracranial hemorrhages that were acute/early sub-acute were manually selected from the images, since they show up in general as hypointensities on T2-weighted FLAIR images and were not picked up by the LST software. Similarly, pontine strokes were also not recognized by the software, as MS lesions do not appear that low in the brain. In hemorrhagic strokes and pontine strokes, we manually delineated both the volume of the bleed itself as well as the surrounding edema (Figure 4).
Figure 4.
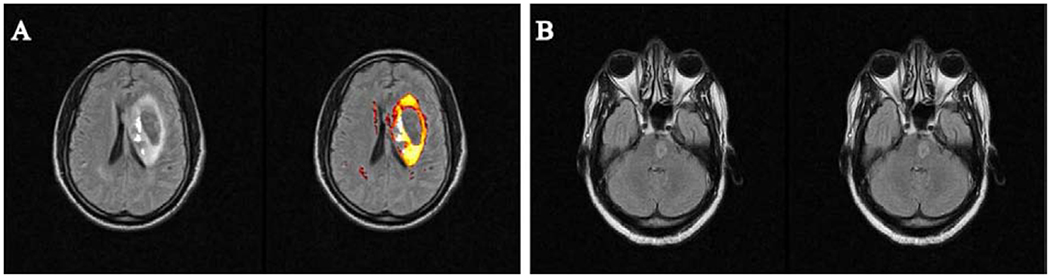
Examples of T2-weighted FLAIR images of stroke patients where the software was unable to pick up stroke lesions. (A) demonstrates a hemorrhagic stroke in the left periventricular region of the brain, where the edema surrounding the hemorrhage core is well demarcated, but the blood itself, being hypointense on the T2-weighted FLAIR image, is not picked up by the software. (B) shows a pontine stroke lesion. Since the LST software does not focus on the cerebellum or pons, it failed to identify the lesion. In both of these patients, the stroke volumes were manually determined.
In 41 patients, the MRI exam was performed either too early for the stroke lesion to emerge on T2-weighted FLAIR images or too late for the stroke lesion to appear as acute on the image. In these patients, only the WMH volume was calculated.
2.4. Conversion of MR Imaging Data into Volumes
The total quantities of white matter, grey matter and CSF obtained from T1-weighted images were extracted in voxels. These voxels were then converted to volumes (mL) by multiplying the voxel count with the dimensions of each voxel, which varied between images depending on slice thickness and in-plane resolutions. The volumes of grey matter, white matter and CSF were summed to determine the total intracranial volume, and white matter and grey matter were summed to determine total brain volume. White matter hyperintensity volume, infarct volume (for ischemic strokes), hemorrhagic volume and edema volume (for hemorrhagic strokes) were all converted from voxels to volumes (mL) and recorded. For final analysis, the stroke lesion volume for hemorrhagic strokes was defined as the sum of hemorrhagic volume and edema volume, in order to best represent the total amount of volume occupied by the stroke lesion.
2.5. Statistical Analyses
The goal of the statistical analysis was to determine which risk factors and outcome measure of stroke were associated with WMH volume. All statistical analyses were performed using SPSS version 25 (SPSS IBM Corporation, Amon, NY, USA), with all statistical tests being two-tailed, and p-values < 0.05 being considered statistically significant. The normality of WMH volume was tested using Shapiro-Wilk test of normality. WMH volume was right skewed and not normally distributed, so it was log transformed before inclusion in the analyses. Associations between the log transformed WMH volume and the collected SIREN variables were examined using multivariate linear regression models. Variables included were sociodemographic (age and sex), clinical indices (weight, height, BMI and waist-to-hip ratio), laboratory indices (WBC, platelet and total cholesterol) and stroke outcome variables (mRS, NIH and Barthel Index). Four models were developed using the stepwise method. The first model included only the sociodemographic variable and the clinical variables were included at the second step. This was followed by the inclusion of the laboratory indices and lastly, the inclusion of the stroke outcome variables. The stepwise approach allowed us to see the contribution of each category of variables.
3. Results
We evaluated in this retrospective study brain MR images from 130 stroke patients who were selected from 2118 patients enrolled in the Stroke Investigative Research and Education Network (SIREN) study to determine associations between WMH volumes and both stroke outcomes and risk factors.
Descriptive data, including age, sex and education status of the 130 patients in the study cohort are shown in Table 1. Income was categorized into high and low based on thresholds set in previous SIREN publications.10
Table 1.
Sociodemographic characteristics of 130 stroke patients with brain MR images from the SIREN study.
| Variable | Frequency N = 130 |
Proportion (%) |
|---|---|---|
| Sex | ||
| Male | 83 | 63.8 |
| Female | 47 | 36.2 |
| Education | ||
| No education | 5 | 3.8 |
| Some Education | 124 | 95.4 |
| Domicile | ||
| Rural | 10 | 7.7 |
| Semi-urban | 30 | 23.1 |
| Urban | 89 | 68.5 |
| Marital Status | ||
| Never married | 7 | 5.4 |
| Currently married | 111 | 85.4 |
| Formerly married | 12 | 9.2 |
| Income | ||
| High (≤ 100USD/month) | 29 | 22.3 |
| Low (>100 USD/month) | 100 | 76.9 |
| Stroke Type | ||
| Ischemic | 98 | 75.4 |
| Hemorrhagic | 32 | 24.6 |
| Hypertensive | ||
| No | 9 | 6.9 |
| Yes | 120 | 92.3 |
| Diabetic | ||
| No | 84 | 64.6 |
| Yes | 45 | 36.6 |
| Dyslipidemia | ||
| No | 20 | 15.4 |
| Yes | 109 | 83.8 |
| Alcohol Consumption | ||
| Never | 76 | 58.4 |
| Former/current | 54 | 41.6 |
| Age; Mean ± SD (years) | 57.87 ± 14.22 | |
| Weight Mean ± SD (kg) | 74.04 ± 13.79 | |
| Height Mean ± SD (cm) | 166.28 ± 8.67 | |
| BMI Mean ± SD | 26.91 ± 5.05 | |
| W/H ratio Mean ± SD | 0.95 ± 0.09 | |
| Systolic BP Mean ± SD (mmHg) | 161.33 ± 31.91 | |
| Diastolic BP Mean ± SD (mmHg) | 95.92 ± 17.11 | |
| WBC count; Median (interquartile range) (x 103/mL) | 5740 (7425) | |
| Platelet count; Mean ± SD (x 103/mL) | 219.28 ± 76.02 | |
| HbA1c; Mean ± SD | 5.83 ± 2.48 | |
| Total Cholesterol; Mean ± SD (mg/dl) | 191.89 ± 54.26 | |
| Triglyceride; Mean ± SD (mg/dl) | 117.45 ± 49.26 | |
| Fasting glucose; Mean ± SD (mg/dl) | 120.58 ± 54.12 | |
| mRS; Mean ± SD | 3.73 ± 1.42 | |
| NIHSS; Mean ± SD | 9.99 ± 6.98 | |
| Barthel Index; Median (interquartile range) | 0.00 (46.25) | |
Table 2 shows a Spearman rank correlation test between white matter hyperintensity volume and and several clinical parameters. Weak statistically significant associations were found between WMH and age (rho=0.21, p=0.02), waist/hip ratio (rho=0.22, p=0.01), platelet count (rho=0.19, p=0.04), mRS (rho=0.24, p=0.01), and NIHSS (rho=0.29, p<0.001) while inverse associations were found with Barthel Index (rho=−0.2, p=0.03).
Table 2.
Relationship between white matter hyperintensity (WMH) volume, clinical indices and stroke outcome measures using Spearman rank correlation test
| Clinical Indices | WMH volume |
|
|---|---|---|
| Rho | p-value | |
| Age | 0.21 | 0.02* |
| Weight | −0.10 | 0.32 |
| Height | 0.01 | 0.94 |
| BMI | −0.07 | 0.51 |
| W/H ratio | 0.22 | 0.01* |
| Systolic BP | 0.16 | 0.12 |
| Diastolic BP | 0.19 | 0.07 |
| WBC count | −0.17 | 0.11 |
| Platelet count | 0.19 | 0.04* |
| HbA1c | −0.04 | 0.73 |
| Total Cholesterol | 0.09 | 0.41 |
| Triglyceride | 0.03 | 0.71 |
| Fasting glucose | 0.13 | 0.32 |
| mRS | 0.24 | 0.01* |
| NIHSS | 0.29 | <0.001** |
| Barthel Index | −0.20 | 0.03* |
BMI: Body Mass index, W/H ratio: Waist-hip ratio, WBC: White Blood Cell, HbA1c: Hemoglobin Alc concentration, mRS: Modified Rankin Score, NIHSS: National Institute of Health Stroke Scale
In the stepwise modelling, increase in age was significantly associated with larger volume of WMH (Table 3). These relationships were sustained when clinical variables were included in the model but the association between sex and WMH volume was attenuated when laboratory indices were included in the model. In the final model that included all the variables, only three variables were found to be associated with WMH volumes, these are age (β=0.44, p=0.001), W/H ratio (β=0.22, p=0.03) and platelet count (β=0.19, p=0.04), and all them were positively linearly related to WMH volume.
Table 3.
Multivariate linear regression models for the association between WMH volume and clinical parameters
| STEPS | Variables | β (p-value) |
|---|---|---|
| 1 | Age | 0.46 (<0.001)* |
| Sex | 0.09(0.32) | |
| 2 | Age | 0.44(<0.001)* |
| Sex | 0.20(0.06) | |
| Weight | −0.34(0.73) | |
| Height | 0.24(0.66) | |
| BMI | 0.27(0.76) | |
| W/H Ratio | 0.30(0.01)* | |
| 3 | Age | 0.47(0.001)* |
| Sex | 0.14(0.19) | |
| Weight | −0.14(0.88) | |
| Height | 0.17(0.76) | |
| BMI | 0.06(0.95) | |
| W/H Ratio | 0.21(0.04) | |
| WBC | −0.17(0.07) | |
| Platelet | 0.20(0.04) | |
| Cholesterol | −0.02(0.87) | |
| 4 | Age | 0.44(0.001)* |
| Sex | 0.14(0.20) | |
| Weight | −0.17(0.86) | |
| Height | 0.19(0.72) | |
| BMI | 0.13(0.89) | |
| W/H Ratio | 0.22(0.03)* | |
| WBC | −0.15(0.15) | |
| Platelet | 0.19(0.04)* | |
| Cholesterol | −0.01(0.95) | |
| mRS | 0.11(0.58) | |
| NIHSS | 0.12(0.38) | |
| SLS | 0.09(0.61) |
Note. Values are the standardized β (and p value) for the listed parameters.
Model: WMH = β1*Age + β2*Sex + β3*Weight + .... + β12*SLS + constant
BMI: Body Mass Index, W/H ratio: Waist-hip ratio, WBC: White Blood Cell, HbA1c: Hemoglobin A1c concentration, mRS: Modified Rankin Score, NIHSS: National Institute of Health Stroke Scale;
p<0.001;
p<0.05.
4. Discussion
This study analyzed MR images gathered from a cohort of 130 West African stroke patients from the Stroke Investigative Research and Education Network (SIREN) study using the Lesion Segmentation Tool of the Statistical Parametric Mapping software, with the goal of determining whether or not conclusions drawn in Western studies on the relationship between WMH and stroke are similar in West African patients. Given the previously identified differences in the presentation of stroke in West Africa compared to Western countries, where currently most stroke research is conducted, it may be beneficial to identify factors that lead to and result from these differences. The SIREN study provides a unique set of information that will help elucidate stroke in West Africa. The sheer breadth of images collected and the extensive follow-up data recorded for each patient provide a chance to examine many associations of stroke outcome. With the choice to use a volumetric analysis of WMH burden in this study, the subjectivity involved in visually rating WMH severity is eliminated. This study is the first of its size to be performed in this patient population, and in spite of some limitations it produced promising preliminary results.
4.1. White matter hyperintensity and stroke risk factors
The significant associations that were found through linear regression between WMH and age and waist/hip ratio were similar to results of stroke studies in Western countries (Table 3).13,49,50 Age and visceral obesity are both well-known factors contributing to WMH in Caucasian populations, but this was the first study that demonstrated that they are also related in West African patients. Interestingly, this study found that waist/hip ratio was correlated to WMH volume, but BMI was not. Prior studies have found that central vs. peripheral fat distribution in Caucasian women differed from that in African-American women.51 The findings in our study may suggest that in West African populations, waist/hip ratio may be a better measure of visceral obesity compared to BMI. There are no prior studies that have found platelet count to be associated with WMH, but it is known that platelets play a key role in the inflammatory pathway in the endothelium, and they may be implicated in small vessel disease.52 It may be the case that chronically elevated platelet levels may play a role in the development in WMH, but causality cannot be established in this retrospective study. Of note, many other known stroke risk factors that were correlated with WMH in Western studies were not identified in this study. While it may be the case that these factors are not associated with WMH in West African patients, it is more likely that given the small sample size and high variability in this study, our power was not high enough to detect these associations. Previous studies performed in Western countries generally have much higher sample sizes, and they do not used 0.3T or 0.36T scanners to study WMH like this study has, given their poor resolution. However, in many places in Africa, these low-field scanners are the only option available in terms of MRI scanners, and as such, this study is promising in demonstrating an ability to overcome low field strengths to perform data analysis on brain MR images in Africa.
Previous studies found that hemorrhagic stroke was significantly more common in Africa than in Western countries, but that was not seen in this study (Table 1).53 One of the known issues that may have affected the proportion here is the fact that hemorrhages usually have worse outcomes, death being very common. Hemorrhage patients that have a chance to receive an MRI exam are already biased towards better outcomes, and they do not adequately represent the total number of hemorrhagic strokes in the population. Thus, the proportion of hemorrhagic stroke patients that make it to an MRI scanner is probably not representative of the true proportion of hemorrhagic strokes that are occurring.
4.2. White matter hyperintensity and stroke outcomes
In our Spearman rank correlation test (Table 2), a statistically significant positive correlation between WMH volume and stroke outcome was found when using mRS and NIHSS score to measure outcomes, and a negative correlation was found between Barthel Index and WMH volume. However, when using the multivariate analysis, no significant correlations were found. Each of these scales approximates stroke severity, but they do not provide perfectly aligned severity ratings. Barthel index and mRS scores are both measures of functional impairment, which may not have as strong of a correlation to WMH volume as the NIHSS, which is a more detailed evaluation of specific neurologic deficits. Prior studies have ascertained that the NIHSS is more sensitive than mRS and Barthel Index in determining favorable outcomes and recovery after stroke, a conclusion that is supported by the results of our analysis.54 Of note, while the modified NIHSS score has been proven to have higher reliability than NIHSS, the modified score were not assessed in the SIREN data set.40
An important limitation of the stroke outcome analysis was the incomplete follow up data. Due to financial limitations and transportation problems, not all patients could be followed up to the one-year endpoint for stroke outcomes. There was a high dropout rate in this study, and as a result, only the one-month endpoint was used for analysis, instead of all of the available data from 1, 3, 6, 9 and 12 months after stroke onset. The one-month endpoint may not have allowed for enough time to distinguish recovery outcomes from stroke. Previous studies have shown markedly worse stroke outcomes in patients with increased white matter hyperintensity measured one year after stroke.42 It is known that a dichotomized analysis of Barthel Index and mRS, like the one performed in this study, is insensitive at detecting partial recovery from stroke, since small improvements will not register as a change from poor outcome to good outcome.55 At one month, many patients have not yet fully recovered from their stroke. The incomplete follow-up data made it impossible to measure one year outcomes, when more full recoveries could have been discovered. This may have explained why the NIHSS showed a strong association between high WMH volume and poor outcomes while the other two indices did not.
4.3. Study Limitations
Given the exploratory nature of this study in resource limited countries, there were a few limitations. First and foremost is the high variability of MR image quality in the included samples. SIREN was performed across several institutions in Ghana and Nigeria, each with different MR scanners with varying field strengths. We attempted to correct for this variation by converting all voxel sizes to mL. Complicating this matter was the variability in timing of patient presentation to the hospital. For many reasons, chiefly the lack of stroke awareness, money for care and access to hospitals, many stroke patients in West Africa do not receive care promptly after the onset of stroke symptoms; they often present much later than they would if they were in a Western country. As a result, there is more variability in the timing of image acquisition in the SIREN study than in other stroke imaging studies. This presented a challenge since the same stroke imaged at two different time points will a have different appearance on MR images. For patients who show up at the hospital very late after their stroke onset, especially for those who have had prior strokes, it becomes difficult to determine which lesion is the “acute” stroke that they came to the hospital for, since the appearance after a week will look more similar to a chronic stroke. The timing of MR image acquisition strongly influences the appearance and characteristics of stroke lesions on the image, and as such the variance in image acquisition timing may have resulted in weaker associations between stroke characteristics and outcomes. Since this study focused on acute and subacute stroke and not chronic stroke, patients that came into the hospital late after their symptom onset may have missed the window in which their stroke could have been visualized acutely, and the lesion would have been classified as chronic stroke. Patients and their family were asked about the earliest onset of symptoms to date the stroke, and cases without acute stroke on imaging were removed from analysis.
Another issue is the sheer cost of performing MRI scans in Africa. Because of cost, very few stroke patients received an MRI scan. Also, only a small subset of the patients enrolled in the SIREN study were scanned with all MRI sequences necessary for this analysis, and thus reducing the statistical power of the study. Secondary to the small sample size issue, the variability in MRI systems and protocols across the various sites of the SIREN study increased overall statistical error. Because the SIREN study was performed across 15 different sites in two different countries (Nigeria and Ghana), there was variance in the quality and dimensions of the acquired images. Some images were acquired on low field (0.3T or 0.36T) MRI scanners, while others were acquired on 1.5T scanners. Many of the sequences were incomplete, while others displayed motion artefacts. Similarly, FLAIR was used as the chosen MRI sequence to determine stroke lesion size even though DWI is the preferred sequence to estimate stroke lesion volumes. Most patients imaged in the SIREN study did not have DWI sequences completed in their MR imaging. In order to maximize sample size, the cohort was not grouped by field strength in this study; all patients were lumped into a single cohort. Because CT is the primary modality in clinical assessment of stroke, an overwhelming majority of patients in the study only had CT used as the method to evaluate their stroke. Ghana has universal health care system but in Nigeria patients have to pay for their MRI scans out of pocket. Therefore, only those patients who had not a necessity for, but also the funds available for an MRI scan, were able to obtain MR images in Nigeria. As a result, this study cohort is inherently skewed towards higher-income patients, as demonstrated by the large majority of patients who received some education and had incomes greater than $100 per month (Table 1).
Other issues included an imbalance in the data for certain factors, such as age group. Because this study was performed on a small subset of the larger population, we were unable to obtain a balanced number of patients in each of the factors we analyzed. As a result, some of the significant associations found in this study, such as the relationship between stress and WMH volume, may have resulted from the age discrepancies between the two groups. There was also a lack of control for a few important variables that were not tracked in the SIREN database, namely adherence to post-stroke therapy, even though timing and intensity of rehabilitation therapy has been shown to markedly influence outcomes.56 Due to sample size constraints, we were unable to subdivide the data into categories that accounted for stroke location, though previous studies have shown that smaller strokes in clinically significant brain areas cause more severe outcomes than larger strokes in less important brain areas.18
5. Conclusion
Stroke MR imaging studies can be successfully performed on low field MR systems in resource limited countries. The use of low field MRI systems does not substantially limit the ability to elucidate white matter changes in stroke patients in West Africa. White matter hyperintensities identified on MR images in this stroke patient population from Nigeria and Ghana were associated with known stroke risk factors such as age and waist/hip ratios, and resulted in poorer stroke outcomes. The results from this study confirm findings from stroke studies in Western countries. Our data demonstrates that higher platelet counts were associated with higher WMH volumes. The findings from this MRI study on West African stroke patients will provide the basis for future imaging studies in resource limited countries.
Acknowledgement
This study was made possible by the generous support of the University of Chicago Pritzker School of Medicine, the University of Chicago Center for Global Health, NIH/NINDS R25NS080949, and the Stroke Investigative Research and Education Network (SIREN) U54HG007479. We would also like to thank Adam Zubair at Lagos State University for his assistance with the protocol and data analysis, and the entire SIREN team for their support throughout the duration of this study.
Footnotes
Publisher's Disclaimer: This is a PDF file of an unedited manuscript that has been accepted for publication. As a service to our customers we are providing this early version of the manuscript. The manuscript will undergo copyediting, typesetting, and review of the resulting proof before it is published in its final form. Please note that during the production process errors may be discovered which could affect the content, and all legal disclaimers that apply to the journal pertain.
Declarations of interest: none
References
- 1.World Health Organization. The top ten causes of death. https://www.who.int/en/news-room/fact-sheets/detail/the-top-10-causes-of-death Published 2018. Accessed May 31, 2019.
- 2.Truelsen T, Heuschmann PU, Bonita R, et al. Standard method for developing stroke registers in low-income and middle-income countries: experiences from a feasibility study of a stepwise approach to stroke surveillance (STEPS Stroke). Lancet Neurology. 2007;6(2):134–139. [DOI] [PubMed] [Google Scholar]
- 3.Feigin VL, Lawes CMM, Bennett DA, Barker-Collo SI, Parag V. Worldwide stroke incidence and early case fatality reported in 56 population-based studies: a systematic review. Lancet Neurology. 2009;8(4):355–369. [DOI] [PubMed] [Google Scholar]
- 4.Bonow RO, Smaha LA, Smith SC, Mensah GA, Lenfant C. World Heart Day 2002 - The international burden of cardiovascular disease: Responding to the emerging global epidemic. Circulation. 2002;106(13):1602–1605. [DOI] [PubMed] [Google Scholar]
- 5.Gouda HN, Charlson F, Sorsdahl K, et al. Burden of non-communicable diseases in sub-Saharan Africa, 1990-2017: results from the Global Burden of Disease Study 2017. Lancet Global Health. 2019;7(10):E1375–E1387. [DOI] [PubMed] [Google Scholar]
- 6.Walker R, Whiting D, Unwin N, et al. Stroke incidence in rural and urban Tanzania: a prospective, community-based study. Lancet Neurology. 2010;9(8):786–792. [DOI] [PubMed] [Google Scholar]
- 7.Owolabi M, Sarfo F, Howard VJ, et al. Stroke in Indigenous Africans, African Americans, and European Americans Interplay of Racial and Geographic Factors. Stroke. 2017;48(5):1169-+. [DOI] [PMC free article] [PubMed] [Google Scholar]
- 8.Akpalu A, Sarfo FS, Ovbiagele B, et al. Phenotyping Stroke in Sub-Saharan Africa: Stroke Investigative Research and Education Network (SIREN) Phenomics Protocol. Neuroepidemiology. 2015;45(2):73–82. [DOI] [PMC free article] [PubMed] [Google Scholar]
- 9.Kengne AP, Mayosi BM. Modifiable stroke risk factors in Africa: lessons from SIREN. Lancet Global Health. 2018;6(4):E363–E364. [DOI] [PubMed] [Google Scholar]
- 10.Owolabi MO, Sarfo F, Akinyemi R, et al. Dominant modifiable risk factors for stroke in Ghana and Nigeria (SIREN): a case-control study. Lancet Global Health. 2018;6(4):E436–E446. [DOI] [PMC free article] [PubMed] [Google Scholar]
- 11.Arsava EM, Rahman R, Rosand J, et al. Severity of leukoaraiosis correlates with clinical outcome after ischemic stroke. Neurology. 2009;72(16):1403–1410. [DOI] [PMC free article] [PubMed] [Google Scholar]
- 12.Arsava EM. The role of MRI as a prognostic tool in ischemic stroke. Journal of Neurochemistry. 2012;123:22–28. [DOI] [PubMed] [Google Scholar]
- 13.Cloonan L, Fitzpatrick KM, Kanakis AS, Furie KL, Rosand J, Rost NS. Metabolic determinants of white matter hyperintensity burden in patients with ischemic stroke. Atherosclerosis. 2015;240(1):149–153. [DOI] [PMC free article] [PubMed] [Google Scholar]
- 14.Hernandez MDV, Armitage PA, Thrippleton MJ, et al. Rationale, design and methodology of the image analysis protocol for studies of patients with cerebral small vessel disease and mild stroke. Brain and Behavior. 2015;5(12). [DOI] [PMC free article] [PubMed] [Google Scholar]
- 15.Hohenhaus M, Schmidt WU, Brunecker P, et al. FLAIR Vascular Hyperintensities in Acute ICA and MCA Infarction: A Marker for Mismatch and Stroke Severity? Cerebrovascular Diseases. 2012;34(1):63–69. [DOI] [PubMed] [Google Scholar]
- 16.Karadeli HH, Giurgiutiu DV, Cloonan L, et al. FLAIR Vascular Hyperintensity is a Surrogate of Collateral Flow and Leukoaraiosis in Patients With Acute Stroke Due to Proximal Artery Occlusion. Journal of Neuroimaging. 2016;26(2):219–223. [DOI] [PMC free article] [PubMed] [Google Scholar]
- 17.Kuller LH, Longstreth WT, Arnold AM, et al. White matter hyperintensity on cranial magnetic resonance imaging - A predictor of stroke. Stroke. 2004;35(8):1821–1825. [DOI] [PubMed] [Google Scholar]
- 18.Menezes NM, Ay H, Zhu MW, et al. The real estate factor - Quantifying the impact of infarct location on stroke severity. Stroke. 2007;38(1):194–197. [DOI] [PubMed] [Google Scholar]
- 19.Thijs VN, Lansberg MG, Beaulieu C, Marks MP, Moseley ME, Albers GW. Is early ischemic lesion volume on diffusion-weighted imaging an independent predictor of stroke outcome? A multivariable analysis. Stroke. 2000;31(11):2597–2602. [DOI] [PubMed] [Google Scholar]
- 20.Yaghi S, Herber C, Boehme AK, et al. The Association between Diffusion MRI-Defined Infarct Volume and NIHSS Score in Patients with Minor Acute Stroke. Journal of Neuroimaging. 2017;27(4):388–391. [DOI] [PMC free article] [PubMed] [Google Scholar]
- 21.Debette S, Markus HS. The clinical importance of white matter hyperintensities on brain magnetic resonance imaging: systematic review and meta-analysis. British Medical Journal. 2010;341. [DOI] [PMC free article] [PubMed] [Google Scholar]
- 22.Habes M, Erus G, Toledo JB, et al. White matter hyperintensities and imaging patterns of brain ageing in the general population. Brain. 2016;139:1164–1179. [DOI] [PMC free article] [PubMed] [Google Scholar]
- 23.Corbin ZA, Rost NS, Lorenzano S, et al. White Matter Hyperintensity Volume Correlates with Matrix Metalloproteinase-2 in Acute Ischemic Stroke. Journal of Stroke & Cerebrovascular Diseases. 2014;23(6):1300–1306. [DOI] [PMC free article] [PubMed] [Google Scholar]
- 24.Gurol ME, Bottiglieri T, Diaz-Arrastia R, et al. Homocysteine, brain atrophy, and white matter disease in Alzheimer’s disease and cerebral amyloid angiopathy. Annals of Neurology. 2004;56:S18–S18. [Google Scholar]
- 25.Hicks JM, Taub E, Womble B, et al. Relation of white matter hyperintensities and motor deficits in chronic stroke. Restorative Neurology and Neuroscience. 2018;36(3):349–357. [DOI] [PubMed] [Google Scholar]
- 26.Zhao L, Wong A, Luo YS, et al. The Additional Contribution of White Matter Hyperintensity Location to Post-stroke Cognitive Impairment: Insights From a Multiple-Lesion Symptom Mapping Study. Frontiers in Neuroscience. 2018;12. [DOI] [PMC free article] [PubMed] [Google Scholar]
- 27.Auriat AM, Ferris JK, Peters S, et al. The Impact of Covert Lacunar Infarcts and White Matter Hyperintensities on Cognitive and Motor Outcomes After Stroke. Journal of Stroke & Cerebrovascular Diseases. 2019;28(2):381–388. [DOI] [PubMed] [Google Scholar]
- 28.Mijajlovic MD, Pavlovic A, Brainin M, et al. Post-stroke dementia - a comprehensive review. Bmc Medicine. 2017;15. [DOI] [PMC free article] [PubMed] [Google Scholar]
- 29.Leys D, Englund E, Del Ser T, et al. White matter changes in stroke patients - Relationship with stroke subtype and outcome. European Neurology. 1999;42(2):67–75. [DOI] [PubMed] [Google Scholar]
- 30.Fierini F, Poggesi A, Pantoni L. Leukoaraiosis as an outcome predictor in the acute and subacute phases of stroke. Expert Review of Neurotherapeutics. 2017;17(10):963–975. [DOI] [PubMed] [Google Scholar]
- 31.Lovblad KO, Baird AE, Schlaug G, et al. Ischemic lesion volumes in acute stroke by diffusion-weighted magnetic resonance imaging correlate with clinical outcome. Annals of Neurology. 1997;42(2):164–170. [DOI] [PubMed] [Google Scholar]
- 32.Georgakis MK, Duering M, Wardlaw JM, Dichgans M. WMH and long-term outcomes in ischemic stroke A systematic review and meta-analysis. Neurology. 2019;92(12):E1298–E1308. [DOI] [PubMed] [Google Scholar]
- 33.Zerna C, Yu AYX, Modi J, et al. Association of White Matter Hyperintensities With Short-Term Outcomes in Patients With Minor Cerebrovascular Events. Stroke. 2018;49(4):919-+. [DOI] [PubMed] [Google Scholar]
- 34.Ogbole GI, Owolabi MO, Yusuf BP. White Matter Changes on Magnetic Resonance Imaging: A Risk Factor for Stroke in an African Population? Journal of Stroke & Cerebrovascular Diseases. 2013. ;22(7):E227–E233. [DOI] [PubMed] [Google Scholar]
- 35.Akinyemi RO, Firbank M, Ogbole GI, et al. Medial temporal lobe atrophy, white matter hyperintensities and cognitive impairment among Nigerian African stroke survivors. BMC research notes. 2015;8:625. [DOI] [PMC free article] [PubMed] [Google Scholar]
- 36.Ogbole GI, Soneye MA, Okorie CN, Sammet S. Intraventricular cerebrospinal fluid pulsation artifacts on low-field magnetic resonance imaging: Potential pitfall in diagnosis? Nigerian medical journal: journal of the Nigeria Medical Association. 2016;57(1):59–63. [DOI] [PMC free article] [PubMed] [Google Scholar]
- 37.Nyquist PA, Bilgel MS, Gottesman R, et al. Extreme Deep White Matter Hyperintensity Volumes Are Associated with African American Race. Cerebrovascular Diseases. 2014;37(4):244–250. [DOI] [PMC free article] [PubMed] [Google Scholar]
- 38.White H, Albala BB, Wang CL, et al. Ischemic stroke subtype incidence among whites, blacks, and Hispanics - The northern Manhattan study. Circulation. 2005;111(10):1327–1331. [DOI] [PubMed] [Google Scholar]
- 39.New PW, Buchbinder R. Critical appraisal and review of the Rankin Scale and its derivatives. Neuroepidemiology. 2006;26(1):4–15. [DOI] [PubMed] [Google Scholar]
- 40.Meyer BC, Hemmen TM, Jackson CM, Lyden PD. Modified national institutes of health stroke scale for use in stroke clinical trials - Prospective reliability and validity. Stroke. 2002;33(5):1261–1266. [DOI] [PubMed] [Google Scholar]
- 41.Collin C, Davis S, Horne V, Wade DT. Reliability of the Barthel ADL Index. International Journal of Rehabilitation Research. 1987;10(3):356–357. [Google Scholar]
- 42.Leonards CO, Ipsen N, Malzahn U, Fiebach JB, Endres M, Ebinger M. White Matter Lesion Severity in Mild Acute Ischemic Stroke Patients and Functional Outcome After 1 Year. Stroke. 2012;43(11):3046–U3444. [DOI] [PubMed] [Google Scholar]
- 43.Rangaraju S, Haussen D, Nogueira RG, Nahab F, Frankel M. Comparison of 3-Month Stroke Disability and Quality of Life across Modified Rankin Scale Categories. Interventional Neurology. 2017;6(1-2):36–41. [DOI] [PMC free article] [PubMed] [Google Scholar]
- 44.Schmidt P, Gaser C, Arsic M, et al. An automated tool for detection of FLAIR-hyperintense white-matter lesions in Multiple Sclerosis. Neuroimage. 2012;59(4):3774–3783. [DOI] [PubMed] [Google Scholar]
- 45.Sabb F MRIConvert. In. 2.1.0 ed: Lewis Center for Neuroimaging, University of Oregon, Eugene, Oregon, USA; 2017. [Google Scholar]
- 46.SPM12 [computer program]. 12 Queen Square, London WC1N 3BG, UK: Institute of Neurology, UCL; 2014. [Google Scholar]
- 47.Schmidt P LST: Lesion Segmentation Tool. In. 2.0.15 ed2017:https://www.applied-statistics.de/lst.html.
- 48.Rorden C MRIcro. In. Vol 1.40 1.40 ed. Neuropsychology Labs, University of South Carolina, Columbia, SC, USA: 2012. [Google Scholar]
- 49.Lampe L, Zhang R, Beyer F, et al. Visceral obesity relates to deep white matter hyperintensities via inflammation. Annals of Neurology. 2019;85(2):194–203. [DOI] [PMC free article] [PubMed] [Google Scholar]
- 50.Kim KW, Seo H, Kwak MS, Kim D. Visceral obesity is associated with white matter hyperintensity and lacunar infarct. International Journal of Obesity. 2017;41(5):683–688. [DOI] [PubMed] [Google Scholar]
- 51.Lovejoy JC, delaBretonne JA, Klemperer M, Tulley R. Abdominal fat distribution and metabolic risk factors: Effects of race. Metabolism-Clinical and Experimental. 1996;45(9):1119–1124. [DOI] [PubMed] [Google Scholar]
- 52.Stokes KY, Granger DN. Platelets: a critical link between inflammation and microvascular dysfunction. Journal of Physiology-London. 2012;590(5):1023–1034. [DOI] [PMC free article] [PubMed] [Google Scholar]
- 53.O’Donnell MJ, Chin SL, Rangarajan S, et al. Global and regional effects of potentially modifiable risk factors associated with acute stroke in 32 countries (INTERSTROKE): a case-control study. Lancet. 2016;388(10046):761–775. [DOI] [PubMed] [Google Scholar]
- 54.Young FB, Weir CJ, Lees KR, Inves GITSC. Comparison of the National Institutes of Health Stroke Scale with disability outcome measures in acute stroke trials. Stroke. 2005;36(10):2187–2192. [DOI] [PubMed] [Google Scholar]
- 55.Kasner SE. Clinical interpretation and use of stroke scales. Lancet Neurology. 2006;5(7):603–612. [DOI] [PubMed] [Google Scholar]
- 56.Dobkin BH, Dorsch A. New Evidence for Therapies in Stroke Rehabilitation. Current Atherosclerosis Reports. 2013. ;15(6). [DOI] [PMC free article] [PubMed] [Google Scholar]