Abstract
Enzyme-linked immunoassay (ELISA) is highly specific and selective towards target molecules and is convenient for on-site detection. However, in many cases, lack of high sensitivity makes it hard to reveal a significant colorimetric signal for detecting a trace number of target molecules. Thus, analytical instruments are required for detection, which limits the application of ELISA for on-site detection. In the present study, a highly sensitive and naked-eyed detectable colorimetric biosensor for chloramphenicol (CAP) was prepared by incorporating ELISA onto surfaces of microporous and nanofibrous membranes. The high specific surface areas of the nanofibers significantly increased the number of antibodies covalently linked onto the fiber surfaces and binding capacity of the sensor with antigens present in a sample. With such an integration, the sensitivity of the ELISA sensor was dramatically increased, and a trace number of targets could reveal a naked-eye detectable color. The immunoassay sensor exhibited a significant naked-eye distinguishable color to chloramphenicol (CAP) at 0.3ng/mL. The successful design and fabrication of the nanofibrous membrane immunoassay sensor provide new paths towards the development of on-site inspection sensors without the assistance from any instrument.
Keywords: Enzyme-linked immunoassay, Nanofibrous membrane, Chloramphenicol, colorimetric sensor
Keywords: nanofibrous membrane, enzyme-linked immunosorbent assay, chloramphenicol, naked-eye distinction
Graphical Abstract
1. Introduction
Antibiotics are widely applied in the medical treatments of human infections and prevention of diseases in stock and aquaculture farming.1–3 Due to their broad applications in agriculture and aquaculture production, residual antibiotics could exist in food products.3, 4 Frequent exposure to residual antibiotics could lead to the development of antibiotic-resistant bacteria. Approximately 2 million people acquire infections caused by antibiotic-resistant pathogens each year in the United States.5 The cost associated with antibiotic-resistant bacterial treatments has doubled over the past few decades and reached $2 billion in 2014.5 As a result, the United States Department of Agriculture (USDA) and the US Food and Drug Administration (FDA) have established strict regulations on tolerant concentrations for specific antibiotics in aquaculture and farmed products. Although precise and selective measurements of antibiotics are available by mass-spectrometry, the routine analysis is currently cost-prohibitive due to the complexity of the analytical methods involved. Thus, rapid, accurate, and on-site detection is needed to track residual antibiotics in the food supply.
The conventional detection methods for antibiotics in foods include Liquid Chromatography or Gas Chromatography-Mass Spectrometry (LC/GC-MS) and Enzyme-Linked Immunosorbent Assay (ELISA).6, 7 The LC/GC-MS is a reliable, sensitive, and selective technique but has limitations such as the use of expensive apparatus, complicated procedures, the need of trained operators, and long preparation time, which limit their uses in on-site inspections and instant examinations.8, 9 Contrarily, ELISA is a relatively convenient analytical technique with good selectivity. However, the conventional ELISA could not generate naked-eye distinguishable color at detection of low concentration of the targets. Thus, the conventional ELISA process is dependent on the use of plate readers or instruments to detect targets in low concentrations, which limits its application for on-site detection of a trace number of targets.10–15 For achieving naked-eye detection, the color intensity needs to be significantly improved, and some successful approached were made by using gold nanoparticles or quantum dots or new antibodies or nanobodies with high affinity to solid surfaces.12–15 However, these processes are relatively costly and time-consuming with limited improvement of sensitivities. To meet the demand for on-site and instrument-independent detection, we report the development of a highly sensitive and naked-eye distinguishable paper-based ELISA biosensor by employing microporous and nanofibrous membranes as solid support media of antibodies. The ultrahigh surface areas of the nanofibers in the paper-like membranes could dramatically increase the number of immobilized antibodies incorporated onto the surfaces, which can quickly capture analytes, antibiotics, in the environment, leading to dramatically intensified colorimetric signals enough for human eye detection. In this study, we focus on (CAP) because it is banned in the USA but may be still present in some imported US aquaculture products.5 The developed immunoassay biosensor demonstrated high sensitivity for detecting CAP at 0.3ng/mL level with the naked eyes, compared to the 10ng/mL of CAP distinguishable by the naked eye with a conventional ELISA.
2. Materials and Methods
2.1. Materials
Glutaraldehyde solution 25% (GA), cyanuric chloride (CC), N, N’-disuccinimidyl carbonate (DSC), triethylamine (TEA), 1,4-dioxane, acetone, hydrogen peroxide (30 wt%), pH 6.4 citric acid buffer, phosphate-buffered saline (PBS), Pierce™ BCA Protein Assay Kit, Millipore column and high-binding 96-well plates were purchased from Thermo Fisher Scientific (USA). Poly(vinyl-co-ethylene) (PVA-co-PE, PE content of 27%, MWn =90,000), chloramphenicol (CAP), florfenicol (FF), thiamphenicol (TAP), penicillin (PCN), 3,3’,5,5’-tetramethylbenzidine (TMB), fluorescein isothiocyanate labeled immunoglobulin G (FITC-IgG), and bovine serum albumin (BSA) were obtained from Sigma-Aldrich (USA). Anti-CAP antibody (Ab) and CAP labelled horseradish peroxidase (CAP-HRP) were purchased from Abcam (Cambridge, MA, USA). Nitrocellulose membrane (0.45μm) was purchased from Bio-Rad (USA).
2.2. Fabrication of PVA-co-PE nanofibrous membranes
PVA-co-PE nanofibrous membrane was fabricated according to the literature16, 17. PVA-co-PE (Mn = 90,000) was added into a mixture of isopropanol and water (weight ratio 7:3) with stirring at 80°C for 2 hours to prepare electrospinning solutions. The concentration of PVA-co-PE in the electrospinning solution was 8 wt%. Then, the solution was transferred into 20mL syringes, capped by a 6-gauge needle and loaded onto a programmable syringe pump (Kats Scientific Co.). The solution was fed at a constant rate of 2mL per hour. A high voltage of 25 kV (EQ30, Matsusada Inc.) was employed on needle tips generating a continuous polymer jet stream. The PVA-co-PE nanofiber membranes were deposited on a copper grid covered the rotating receiver with a fixed distance of 20 cm. Residual isopropanol/water solvent was removed by drying the produced nanofibrous membranes in a vacuum oven at 50 °C for 1 hour.
2.3. Modification of nanofibrous membranes.
For CC modified nanofibrous membranes, 0.1g of PVA-co-PE nanofibrous membranes were immersed into 3M NaOH aqueous solution at 5°C for 30 mins and then were immersed into 0.1 g/mL CC solution (prepared by dissolving 5g CC in 50 mL of 1,4-Dioxane) at room temperature for 2 hours. The resulting membranes were removed out, washed with water and acetone, and vacuum dried. For GA modified membranes, 50mL of 25 wt% GA aqueous solution was prepared, and then 0.1g of PVA-co-PE nanofibrous membranes were immersed into the GA solution at room temperature for 2 hours. The resulting membranes were washed with water and acetone, and vacuum dried. For DSC modified membranes, 5 g of DSC and 0.2 g TEA were dissolved in 50 mL of 1,4-dioxane solvent, then 0.1 g PVA-co-PE membranes were added into this as-prepared solution. The mixture was stirred at 80°C for 2 hours. The resulting membranes were washed with 1,4-dioxane and acetone, and vacuum dried.
2.4. Immobilization of antibody
The antibody stock solution was diluted to concentrations of 0.1g/L, 1g/L, and 2g/L in a PBS buffer. Then 10μL of each antibody solution was dropwise added to the center of a pre-punched 1cm2 modified PVA-co-PE membrane. Then, the membranes were incubated into a bio-oven at 25°C for 20 mins. After that, unreacted antibodies on the membranes were washed-off using a PBS buffer. The number of the immobilized proteins was determined by bicinchoninic acid (BCA) protein assay via UV-vis spectroscopy in three replicates for each experiment. The absorption intensity at wavelength 562 nm was recorded for representing the number of antibodies. The protein immobilization reaction efficiency was calculated by dividing the number of immobilized proteins by the number of injected proteins. The resulting membranes were immersed into a 1 wt% BSA solution to block any unreacted sites and rinsed by a washing buffer (PBS solution containing 0.05% Tween 20) to remove excess unbound proteins.
2.5. Analysis of colorimetric signals from ELISA
A competitive ELISA assay was used to detect antibiotics. A test solution was prepared by mixing 50μL of CAP solutions in varying concentrations (ranging between 0ng/mL to 100ng/mL) with 50μL of 500ng/mL CAP-HRP. Then, the antibody immobilized membranes were exposed to the mixture solution under gentle agitation for 20 mins. Then, the membranes were washed with the PBS buffer and dried in air. A TMB substrate was prepared by mixing 100μL of 0.6 wt% TMB solution, 25μL of 1 wt% H2O2 aqueous solution, and 6.25 mL of citric acid buffer together. 20 μL of the as-prepared TMB substrate was added onto the membranes, and the membranes were placed in an LED lightbox (E mart) for 15 mins. A colorimetric signal was observed under the LED light (Lux 10,000). The colorimetric signal was captured by a smartphone (iPhone 6s) and quantitatively analyzed by Image J software. The smartphone camera was kept at the top of nanofibrous membranes with the fixed distance at 50cm to record the digital images of membranes. Then, the red, green, and blue values (RGB values) in the red channel (R value) could be scanned by an installed imaging app (ColorAssist) after transferring digital images to a computer. Moreover, the R values were utilized to analyze the concentration of CAP. The sample size is three for all experiments.
2.6. Analysis of colorimetric signals from conventional ELISA
The CAP solutions in varied concentrations were analyzed by both 96-wells plate-based and nitrocellulose membrane-based ELISAs, respectively. The antibody solution was diluted to concentrations of 2g/L and was added to each well or each membrane, respectively. The samples were incubated in a bio-oven at 37°C for 1 hour. Then, the procedures of blocking, rinsing, and addition of a test solution and TMB substrate were conducted as described in experimental section 2.5. The absorbance intensity of 96-wells plate-based ELISA was recorded by a microplate reader (ThermoFisher Inc.). A smartphone (iPhone 6s) was used to analyze the colorimetric signal from the nitrocellulose membrane-based ELISA.
2.7. Test of salmon sample
Salmon samples were purchased from local supermarkets in Davis, CA. 1 g of salmon samples were mixed with 3 mL of PBS solution. The mixture was homogenized at a vortex oscillator and filtered by a Millipore column to remove solids and lipids.18 Various concentrations of CAP were added into the filtered solution to make spiked samples. Subsequently, 50μL of the filtrate was mixed with 50μL of 500ng/mL CAP-HRP to prepare a test solution, which was directly added to the functional nanofibrous membranes following the procedure described in section 2.5.
3. Results and Discussion
3.1. Fabrication of nanofibrous membrane-based ELISA
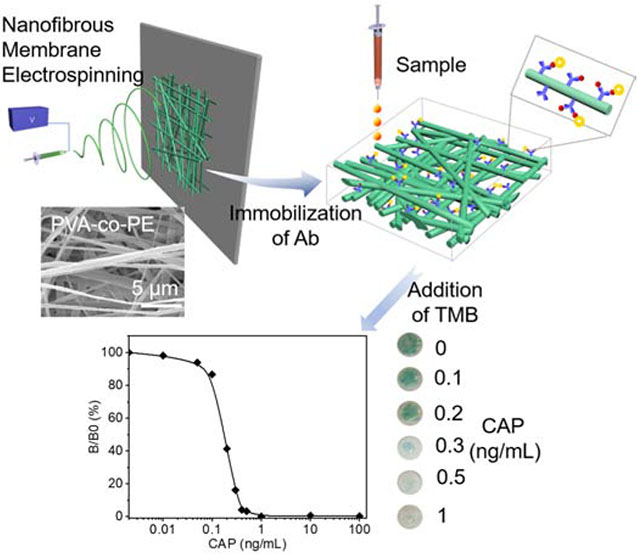
In the present study, the incorporation of the antibody onto the surfaces of nanofiber membranes could increase sensitivity and produce color signals readable by naked eyes. Schematic design and workflow of the nanofiber membrane-based ELISA immunosensor are shown in Scheme 1. PVA-co-PE was selected as a polymer to produce nanofibrous membranes by electrospinning. The electrospinning process fabricates nano-size fiber and provides an ultra-high specific area for membranes. An SEM image of a PVA-co-PE nanofibrous membrane is shown in Figure 1a, with an average fiber diameter of approximately 400nm and micro-size pores (Figures 1a and 1b). PVA-co-PE nanofibrous membranes were previously shown to provide desired reactions with proteins19. Here, hydroxy groups on the material could be activated by GA, CC or DSC for immobilization of antibodies. (Figure 1c).
Scheme1.

Design, fabrication, and work mechanism of nanofibrous membrane-based ELISA.
Figure 1.
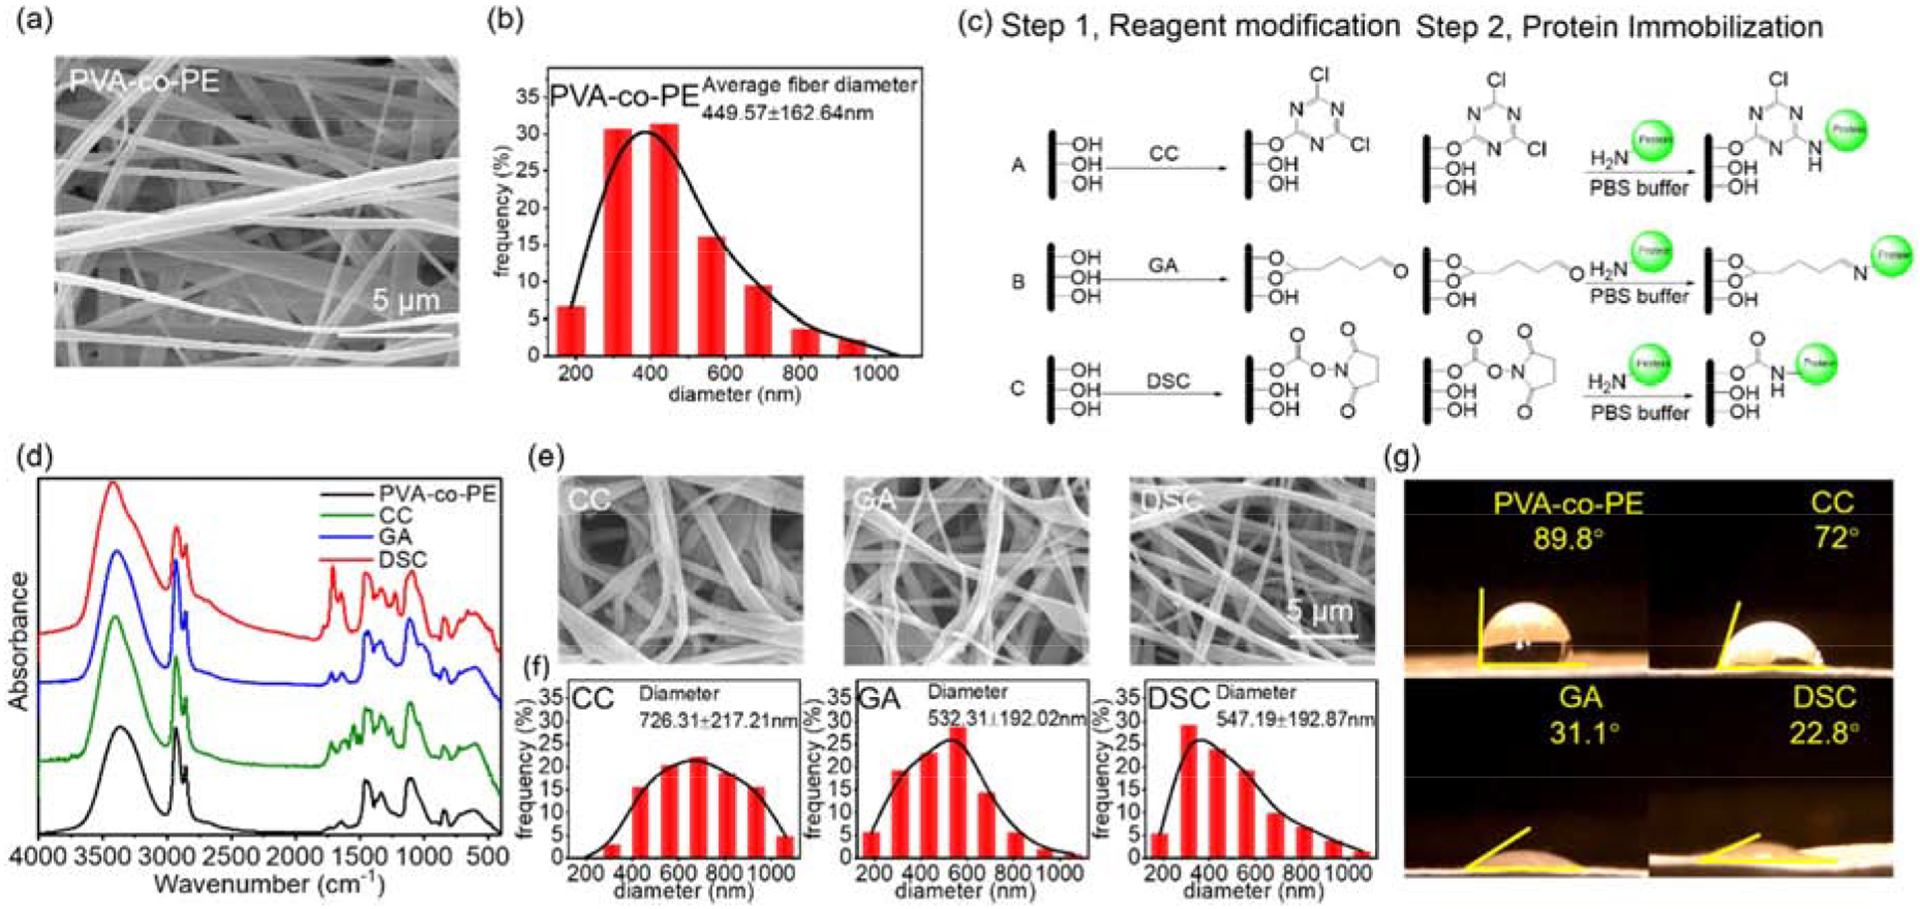
Microstructure and chemical modifications of nanofibrous membranes. a) SEM and b) Fiber diameter distribution of PVA-co-PE membrane; c) Reaction schemes of PVA-co-PE membrane with three reagents (CC, GA, and DSC) and proteins; d) FTIR spectra of PVA-co-PE membranes before and after modifications of CC, GA, and DSC; e) SEM images and f) Fiber distributions of these nanofibrous membranes after reactions with CC, GA, and DSC; g) Water contact angles of these membranes.
The GA, CC, and DSC modified membranes possess different reactivities and hydrophilicity to interact with protein molecules. Among three reactive groups, CC is the least reactive and most hydrophobic one, while GA has medium reactivity and hydrophilicity, and DSC is the most reactive and most hydrophilic. Fourier-transform infrared spectroscopy (FTIR) proved successful incorporations of the reactive groups, including aldehyde peak of GA at 1722cm−1, triazine peak of CC at 1547 cm−1, and carbonate peak of DSC at 1730cm−1. (Figure 1d) The chemically modified nanofibrous membranes retained the micro-porosity and nanofibrous structures (Figure 1e), reflecting the structural stability of the nanofibrous membranes and ensuring proper applications in further steps of reactions with biomolecules. Here, the CC modified nanofibers became swollen and adhesive because of alkali treatment of the PVA-co-PE membranes. The original nanofiber diameter of 449.57nm increased to 726.31nm after the CC modification as shown in Figure 1f. In contrast, the morphologies of the GA and DSC modified membranes were almost unchanged with the nanofiber diameter slightly increased to 532.51nm and 547.19nm, respectively. Additionally, the GA, CC, and DSC reagents on the surfaces of the fibers also improved hydrophilicity and wettability of PVA-co-PE fibers. The water contact angles of the membranes were measured after 1 second (1s) water contact as shown in Figure 1g. The original membranes were relatively hydrophobic with a water contact angle of 89.8°. Since CC is a non-polar reagent, the slight improvement of the membrane hydrophilicity (a water contact angle at 72°) may be attributed to polymer swelling during alkali treatment. In contrast, the more polar reagents (GA and DSC) modified membranes exhibited improved hydrophilic property with water contact angles at 31.1° and 22.8°, respectively. However, water could be fully adsorbed on the three modified membranes after 10s wetting time (0° water contact angle) (Figure S1)
3.2. Immobilization of protein onto nanofibrous membranes
The three modified membranes were then employed to immobilize antibodies as shown in Figure 1c. Here, FITC-IgG was used to qualitatively reveal the number of immobilized molecules by showing the intensities of fluorescence (brighter fluorescence indicates more immobilized proteins). The fluorescence images of each immobilized membranes are shown in Figure 2a. FITC-IgG diffused more homogenously into the more hydrophilic DSC and GA membranes than into the CC modified ones. An increase of the FITC-IgG solution concentration also improved the number of immobilized proteins on the CC membranes but not on the GA and DSC membranes because the accessible reactive sites of the GA and DSC modified membranes may be saturated.
Figure 2.
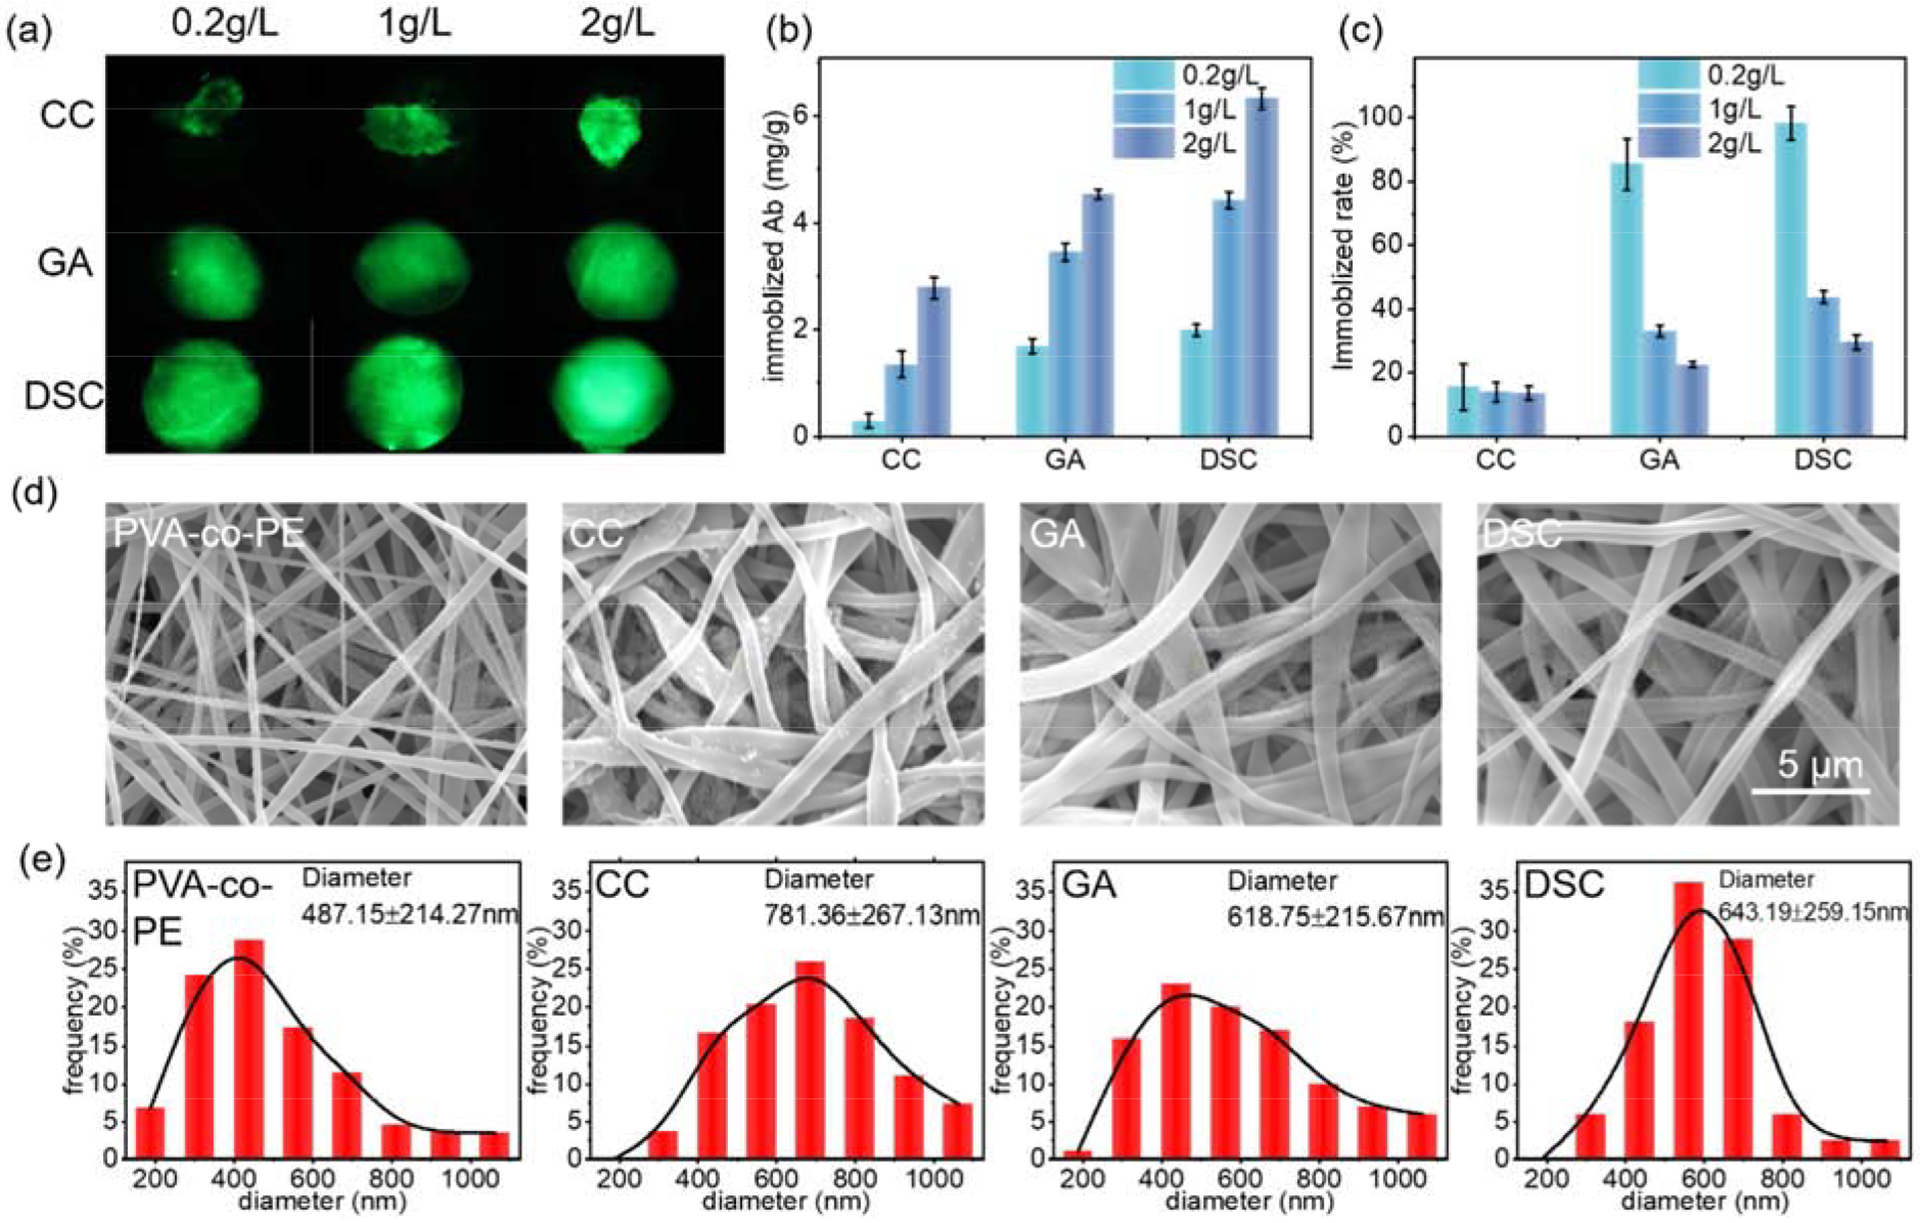
Immobilizing antibody onto nanofibrous membranes. a) Fluorescence images of three modified membranes immobilized with FITC-IgG; b) Immobilized antibody amounts on modified membranes; c) Immobilization reaction efficiency; d) SEM images of nanofibrous membranes after immobilization with the antibody; e) Fiber distributions of these membranes
The number of immobilized antibodies and reaction efficiencies were quantitively measured by the bicinchoninic acid assay (BCA) test (Figure 2b and 2c). The CC modified membranes exhibited the lowest number of immobilized proteins, which was caused by the hydrophobic property and lower reactivity of the CC groups. Conversely, the hydrophilic and highly reactive reagents, GA and DSC, showed increased numbers of immobilized proteins on the membranes. Besides, the CC modified membranes exhibited relatively low efficiency (20%). Contrarily, the immobilization efficiency on the GA and DSC treated membranes reached around 100% at low FITC-IgG concentration but dramatically decreased with the protein concentration increased, which confirmed the speculation that the reactive sites on these modified membranes were saturated. To compare the performance of the reagents, the number of immobilized antibodies should be the same on each membrane. Thus, a concentration of 1g/L proteins was used in the immobilization reaction on the CC membranes, and a concentration of 0.5g/L proteins was applied to the GA or DSC membranes.
Lastly, the impact of the immobilization reactions on the morphology of the nanofibrous membranes was studied by using an FE-SEM, as shown in Figure 2d. Compared with SEM images in Figure 1e, all fibers of three membranes became a little more swollen after being immobilized with the bio-macromolecule, but still stayed nanofiber sizes, which can be described by the slight changes of fiber diameter distributions as shown in Figure 2e.
3.3. Competitive ELISA on the nanofibrous membrane
Antibodies of CAP were immobilized on the chemically modified nanofibrous membranes, and the membranes were employed to detect CAP. The detection procedure is schematically described in Scheme 1. To find a proper concentration of CAP-HRP solution to be added onto the membranes, a checkerboard test was applied as shown in Figure S2. A concentration of CAP-HRP at 250 ng/mL was identified as the optimal concentration.
Color signals could be observed under different concentrations of CAP solutions containing 250 ng/mL of CAP-HRP with various exposure times (Figure 3). TMB was used as an indicator of hydrogen peroxide generation via the catalytic effect of the peroxidase (CAP-HRP) enzyme. The oxidized TMB compound reveals a blue color (absorbance wavelength locates at 605nm), with intensity of the blue color indicating the number of CAP-HRPs conjugated with the antibodies on the membranes. The red channel value (R value) from red, green, and blue (RGB) results shows the most significant change from the readings obtained with the smartphone. Thus, an R value was employed to represent the color intensity, with a lower R value indicating higher CAP concentration. As shown in Figure 3a, colorimetric signals were not homogenous on the CC modified membranes, causing relatively high error bars on R values in the plots. The blue color almost disappeared on the CC membranes at a low concentration of CAP at 0.3 ng/mL. The R value of the color signal reached a maximum value at 0.3 ng/mL with 45 units higher than the R value at 0 ng/mL and 30 units higher than that at 0.2 ng/mL. These differences were easily visible by the naked eyes. On the contrary, although the GA and DSC treated membranes presented homogenous color signals (lower error bars), they could only distinguish higher CAP concentrations (0.5ng/mL by the GA modified membranes and 1ng/mL by the DSC modified membranes, respectively). Furthermore, the R values measured on the GA or DSC modified membranes could not achieve the maximum (155 units) at 1ng/mL of CAP because a considerable number of CAP-HRPs was likely bound to the immobilized antibodies on the membranes. The CAP molecules seem to have better competitive ability than CAPHRP molecules with the antibody on the CC modified membranes, which is likely due to the conformation change after immobilization. For example, the conformation of the loaded antibody may be affected by the membranes, and loaded antibody on CC membranes has a higher affinity with CAP than CAP-HRP. Therefore, more CAP could be captured on the CC modified membranes, and the sensitivity of the membrane was the highest. In general, all three membranes demonstrated varied abilities to detect trace amounts of CAP in solutions, with the CC modified membranes showing the highest sensitivity in the applications and being considered as the best substrate for the preparation of naked eye readable colorimetric sensors for CAP detection.
Figure 3.
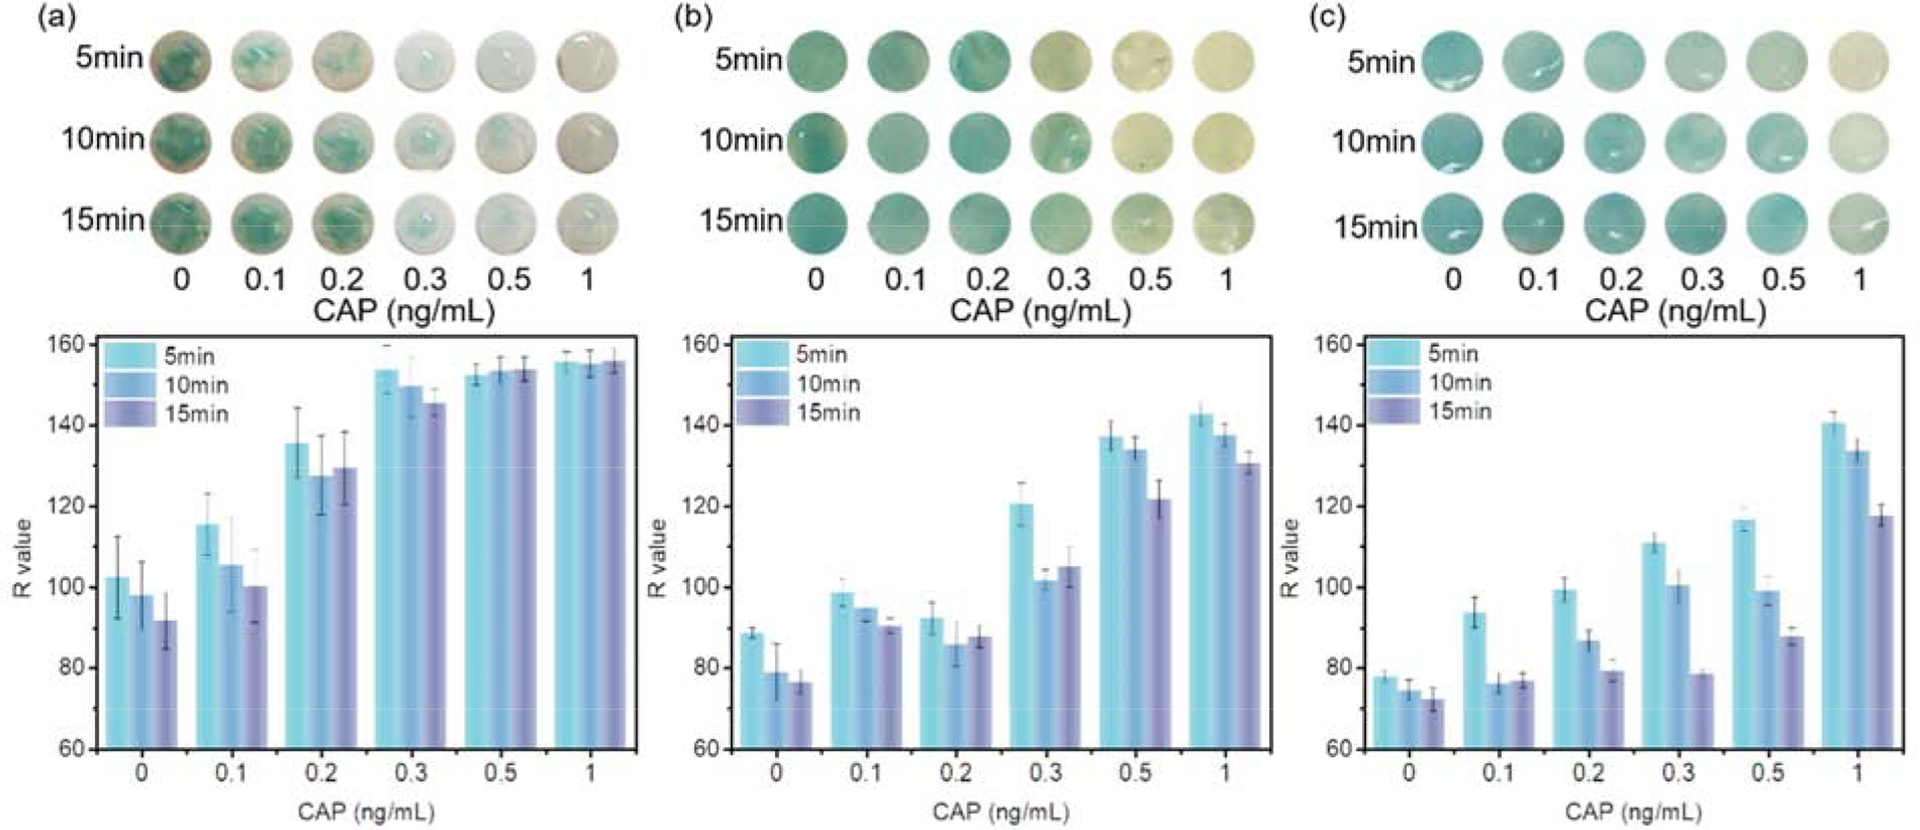
Optical images and color intensities (R values) of membranes modified by a) CC; b) GA; and c) DSC in the detection of CAP
Besides, the exposure time also has the influence on the sensitivity. The oxidation of TMB by hydrogen peroxide and CAP-HRP is slow at the beginning of the reaction, due to a lower concentration of generated hydroxyl radicals, and becomes faster with the increase in reaction time, and gradually slows down again when the reagents are consumed. Thus, a membrane captured more CAP-HRPs (less CAP) should reveal a brighter color more rapidly than a membrane containing fewer CAP-HRPs (more CAP) in a short reaction duration. Finally, all membranes should exhibit the same color intensity at the end of the reaction theoretically because the same number of TMB molecules added. The CC modified membranes revealed distinct color change, as well as with significant R value difference, for solutions containing 0.2ng/mL and 0.3ng/mL CAP at a reaction time of 5mins, and the difference became more significant at 15mins. In contrast, the GA modified membranes exhibited a fast reaction with TMB, producing a more significant color difference within a short time (5mins) than at long reaction time (15mins). The corresponding R value difference between 0.2ng/mL and 0.3ng/mL was around 30 units at 5mins but decreased to 20 at 15mins. More CAP-HRPs on the GA-modified membranes prompt faster and possibly more sustained oxidation reaction of TMB, which can also explain why the color signal difference between 0.3ng/mL and 0.5ng/mL became significant with reaction time increase on the GA treated membranes. For the best use of the sensors in on-site detection for naked-eye observation, the color difference for a detectable range of a target should be significant and consistent for a reasonable duration. Hence, the GA treated membranes can be used for sensors to detect 0.5ng/mL CAP but may not be suitable to distinguish 0.3ng/mL CAP. Similarly, the sensors made from the DSC treated membranes would be useful in the detection of higher concentration CAP because the color difference between 0.5ng/mL and 1ng/mL of CAP became less significant within the duration.
3.4. Understanding naked-eye distinguishable sensor
By using microporous and nanofibrous membranes as solid media for ELISA assay, we achieved the goal of developing highly sensitive colorimetric sensors for the antibiotic, CAP. A calibration curve of color intensity difference between the control and sample groups was established based on the following equation, and the results are presented in Figure 4.
Here, B/B0 represents the ratio of colorimetric intensity. Rmax is the maximum R value, Rx is R value at specific CAP concentration, and R0 represents the R value at 0 ng/mL of CAP. A higher ratio represents the concentration of CAP close to 0 ng/mL of CAP, and a lower ratio means more CAP in solutions. The concentrations of CAP varied from 0.01ng/mL to 100 ng/mL in the calibration curve (Figure 4). Thus, the concentration of CAP in a solution was quantitively measured by determining the color intensity and deriving it from the calibration curve. The limitation of detection (LOD) was 0.1 ng/mL, and the linear range was located between 0.1 ng/mL to 0.4 ng/mL. The linear relation equation could be described as B/B0=(−140.2)*log(Concentration of CAP)-54.5 (R2=0.989). The narrow linear range may be due to the color intensity recorded by RGB value rather than optical density with the conventional ELISA. Furthermore, if the linear range is properly extended, and the LOD could decrease.
Figure 4.
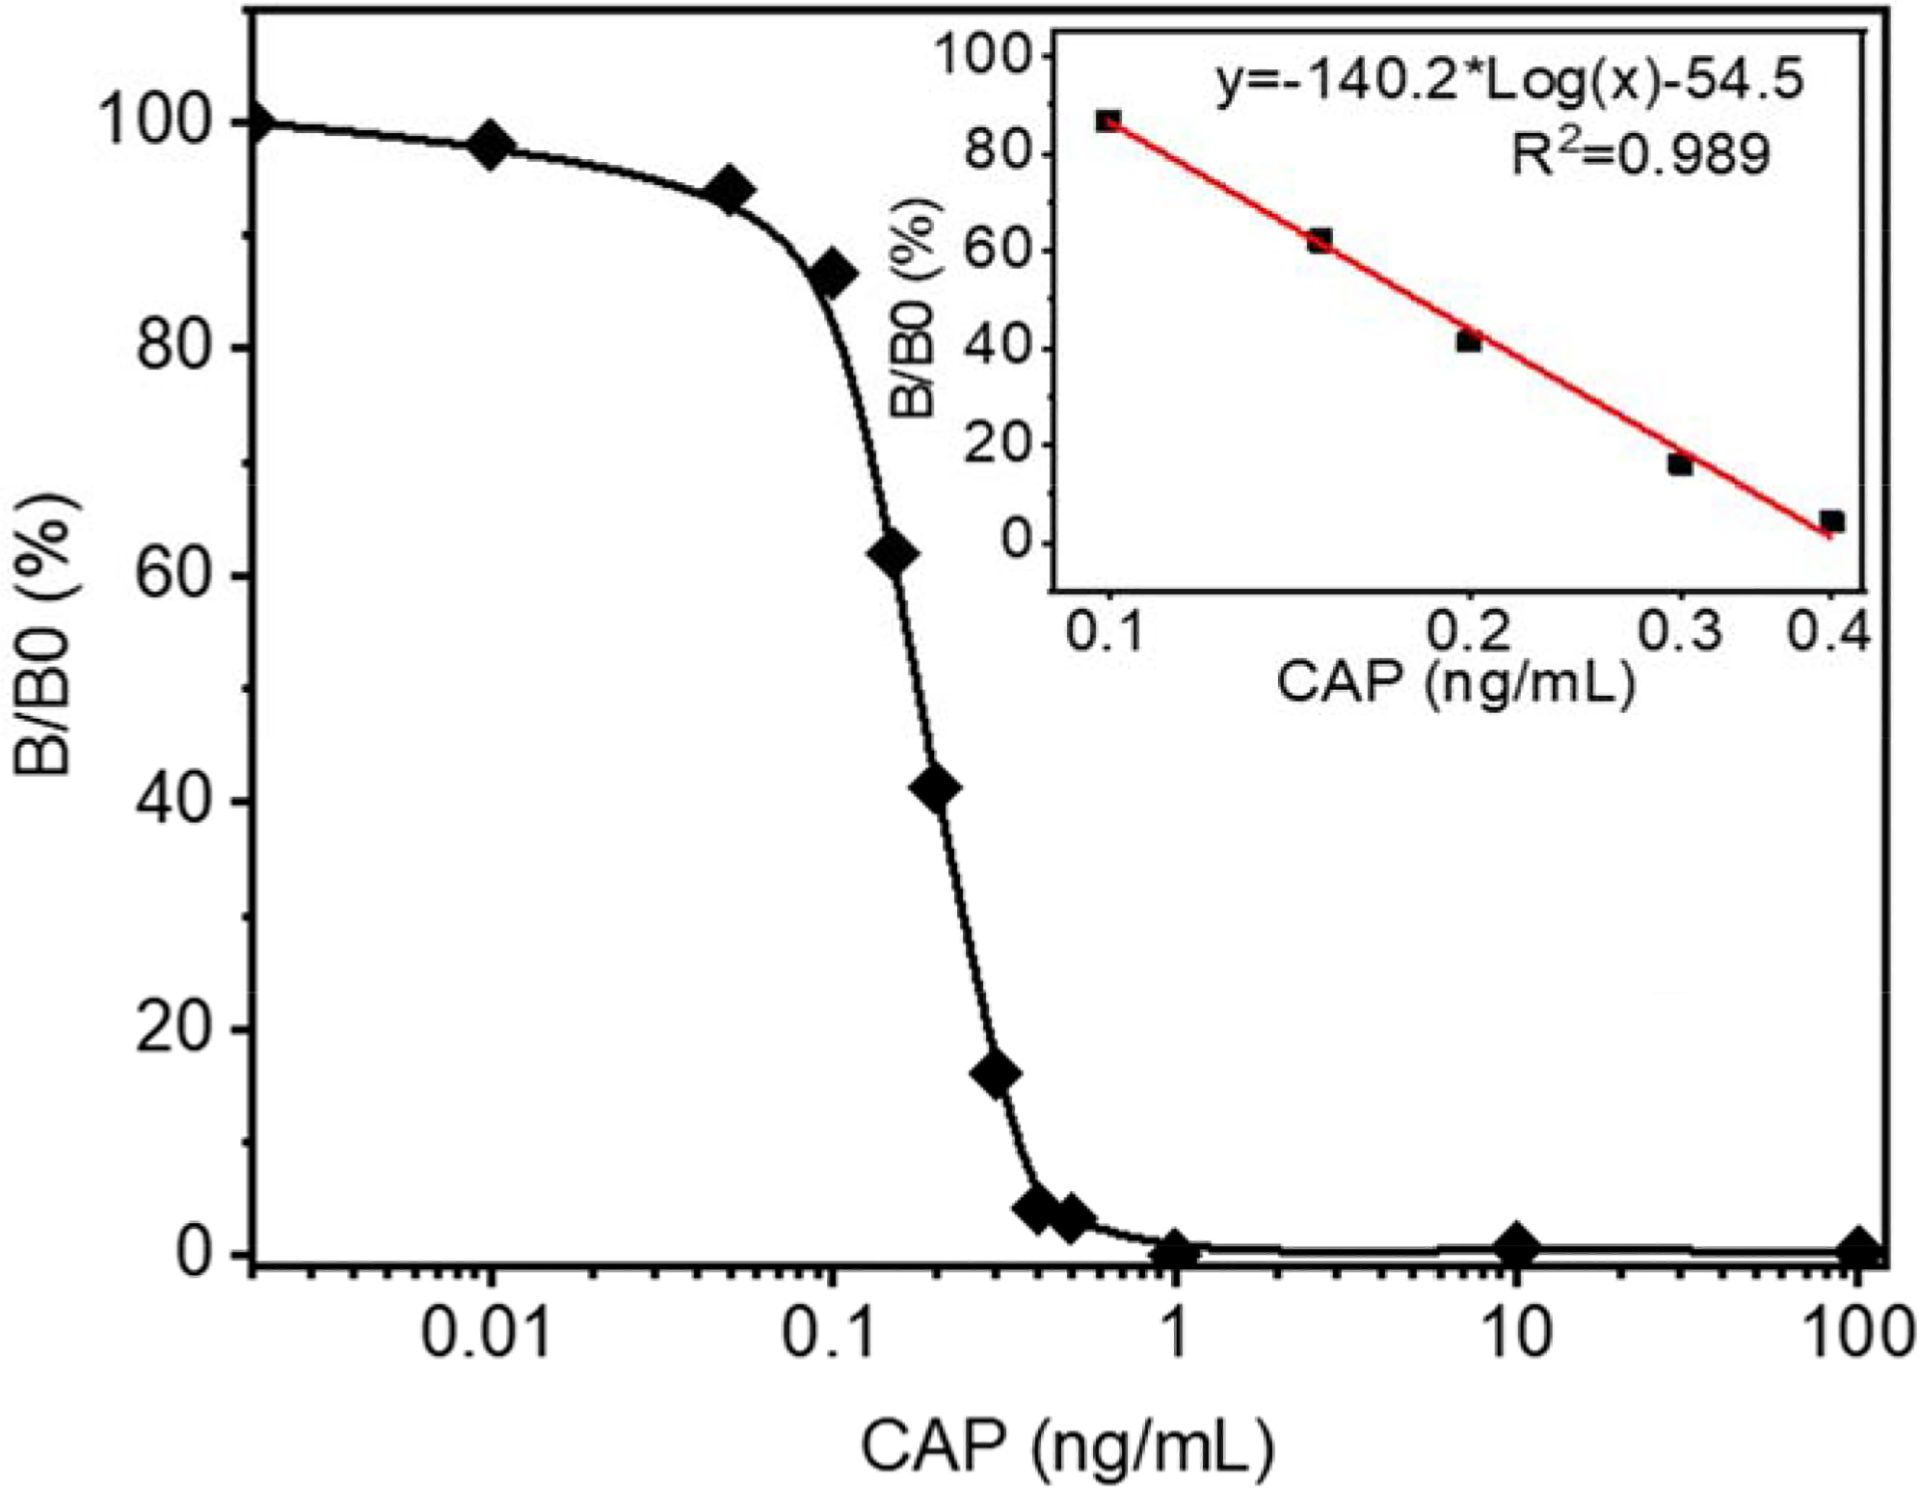
Competitive ELISA intensity ratio. Color intensity ratios are plotted against CAP concentration.
Besides the LOD and linear range, the lowest naked-eye distinguishable concentration is also a critical factor for portable devices, especially at where it is not convenient to use smartphones or cameras. For example, although 0.1ng/mL of CAP could be detected and concentrations below 0.3 ng/mL could be measured quantitatively, the membranes treated with low concentrated CAP could only reveal a slight color change which is hardly distinguished by naked eyes. The color changes of sensors at a benchmark concentration, such as a government regulation limit, should be the most significant and confirmative to the naked eyes. Based on the optical images shown in Figure 3a and the plot in Figure 4, we estimated that at the benchmark concentration of 0.3ng/ml CAP, the CC treated membrane could result in a blue color change significant enough for the naked eyes.
Then we compared the performance of nanofibrous membrane-based ELISA with other ELISA devices. Here, a 96 well plate was applied as a support media for commercial ELSA, and a nitrocellulose membrane was applied as a support media for conventional paper-based ELISA. (Figure 5) The concentrations of antibody and CAPHRP were optimized based on checkerboard test results (shown in supplement information Figures S3 and S4). Although UV-vis absorbance intensity from 96-wells plate-based ELISA represented the LOD at 0.1ng/mL, the naked-eye distinguishable color change could only be observed between 1 ng/mL and 10 ng/mL of CAP. (Figure 5a) Meanwhile, the conventional paper-based ELISA revealed a high LOD (10 ng/mL) and a slight color difference between 10ng/mL and 100ng/mL, probably because the extra enzymes were trapped in the pores and hardly washed off. (Figure 5b) Compared to published results of other developed ELISA sensors for CAP, the nanofibrous membrane-based ELISA has the advantages at the sensitivity of naked eye distinction. (Table 1) Thus, the use of the nanofibrous membranes with ultrahigh surface area indeed intensified colorimetric signal of the ELISA and produced sensors for rapid and sensitive detection without employing any instruments.
Figure 5.
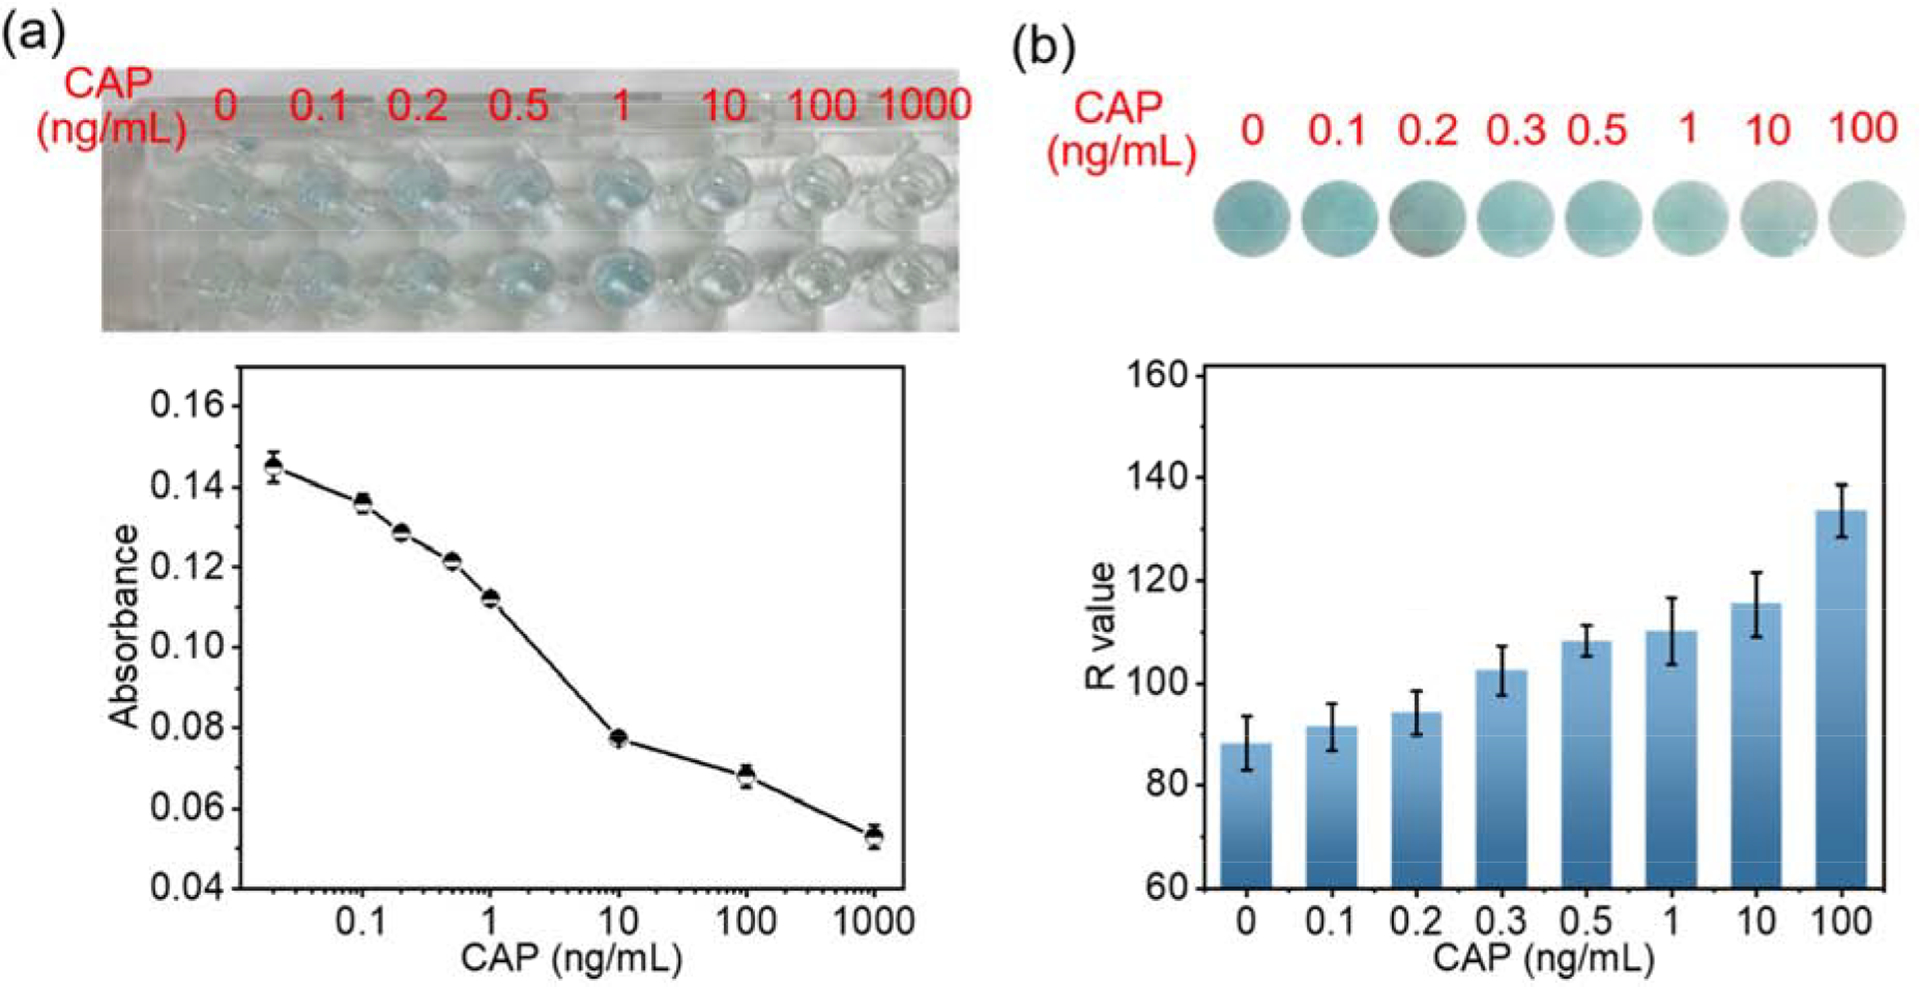
Optical images and color intensities (Absorbance or R values) of conventional ELISA. a) 96 well plate-based ELISA; b) nitrocellulose-based ELISA
Table 1.
Comparison of lowest distinguishable CAP concentration among competitive ELISA sensors from literature.
| Solid Substrate | Signal Amplifying | Lowest instrument distinguishable concentration (ng/mL) | Lowest naked-eye distinguishable concentration (ng/mL) | reference |
|---|---|---|---|---|
| 96 well plates | NA | 0.1 | NA | Wesongah et al. (2007)20 |
| 96 well plates | Fluoro-immunoassays | 0.05 | NA | Shen et al. (2006)21 |
| 96 well plates | Biotin-Streptavidin Amplified | 0.042 | NA | Wang et al. (2010)22 |
| 96 well plates | Biotin-Streptavidin Amplified | 0.10 | NA | Muhammad et al. (2017)23 |
| lateral flow assay | Colloidal Gold Particles | 0.3 | 10 | Byzova et al. (2010)24 |
| 96 well plates | Gold Nanoparticles | 0.3 | 5 | Wang (2016)25 |
| Paper-based | NA | 100 | 800 | Duyen (2017)26 |
| Lateral flow assay | Quantum Dots | 0.016 | 0.625 | Xie et al. (2019)27 |
| Solution | Ion amplified GNP | 1.9 | 9.4–31.3 | Wu et al. (2019)10 |
| Solution | DNAzyme-functionalized gold nanoprobe | 0.00013 | NA | Huang (2019)11 |
| Solution | DNA amplified GNP | 2.2 | 150 | Wu et al. (2020)12 |
| 96 well plates | NA | 0.1 | 10 | This work |
| Nitrocellulose membranes | NA | 1 | 10 | This work |
| Nanofibrous membrane | NA | 0.1 | 0.3 | This work |
3.5. Selectivity and the impact of interference
Antibiotics with similar structures to CAP, such as florfenicol (FF), thiamphenicol (TAP) and penicillin (PCN), may interfere with the high-sensitivity of the nanofibrous membrane-based ELISA, resulting in false positives. To test whether FF, TAP and PCN bind to the CC-activated nanofibrous membrane sensor with CAP antibodies, each antibiotic was tested at a concentration of 100 ng/mL alongside a control group that did not contain any antibiotics. CAP showed a dramatical color change, but the other three antibiotics presented unchanged colors to the control group (Figure 6). The selectivity of the competitive ELISA usually is described by a cross-reactivity ratio (CR%) which is calculated by the ratio of 50% inhibition concentration (IC50) between other antibiotics and CAP. Here, 100 ng/mL FF, TAP and PCN exhibited 92.85%, 97.31% and 100% color intensity of the control group respectively, but the IC50 of CAP is around 0.2 ng/mL, indicating that the CR% values of the sensor to other antibiotics were lower than 0.5 %. Thus, the results suggest that the antibody is specific to the target antibiotic, CAP, with high selectivity.
Figure 6.

Sensitivity and practicality of the sensor. a) interferences of varied antibiotics; b) optical images and c) R values of the reference, wild-caught salmon, and spiked salmon samples
As a test for practical applications, the CC nanofibrous membrane-based immunosensor were employed in testing CAP in spiked salmons (Figure 6b and 6c). CAP solutions of 0 ng/mL and 100 ng/mL were used as references in the tests. A bright blue color was achieved on the 0 ng/mL treated membrane, while the 100 ng/mL treated membrane exhibited a white color. Three pieces of salmons were processed and extracted with the solvents described in the experimental section. The samples revealed bright color, indicating no CAP or a concentration lower than the detection limit of 0.1 ng/mL in the samples. The R value of the wild samples was 91.6±4.1, which was close to the membrane treated by 0 ng/mL of CAP (92.0±4.6). Then, a known quantity of CAP was spiked into a wild salmon filtrate. The samples spiked with 0.1ng/mL CAP revealed a bright blue color (no significant color change from the reference), but the samples spiked with 0.3ng/mL and 0.5ng/mL exhibited white color close to the membrane treated by 100 ng/mL CAP, and the color difference is distinguishable by naked eyes. The R values of the spiked salmon samples were 100.1±3.5, 145.0±1.8 and 155.9±2.4, respectively, which were close to R values of these concentrated CAP in PBS buffer (Figure 3a). The salmon spiked with 0.1ng/mL CAP showed the existence of 0.097 ng/mL with a recovery of 96.7% and standard deviation at 6.09% (n=3); and the sample spiked with 0.3ng/mL of CAP revealed 0.29ng/mL with a recovery at 96.3% and standard deviation at 4.5% (n=3). Since 0.5 ng/mL of CAP is beyond the calibration range (Figure 4) and the sensor revealed a white color without much difference from the 100ng/mL reference, the recovery of CAP at 0.5ng/mL could not be calculated.
4. Conclusions
We have developed a highly sensitive and naked-eye distinguishable immunoassay biosensor using microporous nanofibrous membranes as supported ELISA media. Electrospun PVA-co-PE nanofibrous membranes were chemically modified by cyanuric chloride (CC), glutaldehyde (GA), and N, N’-disuccinimidyl carbonate (DSC). The CC treated membranes showed high sensitivity and stable colorimetric signal as a sensor media. Compared the conventional ELISA and present studies, the ultrahigh surface area of the nanofibrous membranes and abundant reactive sites on surfaces of the nanofibers significantly increased antibody immobilization, enhanced colorimetric signal, and improved sensitivity of the membrane-based sensors. The sensor also demonstrated a desired selectivity to the target antibiotic. The sensor could accurately quantitively measure CAP in spiked salmon samples and detected a trace amount CAP in the samples.
Highlights of this work:
Highly sensitive and naked eye detectable colorimetric sensor of chloramphenicol was prepared
Nanofibrous and porous membrane was able to significantly increase detection sensitivity of ELISA on solid supports
The sensor can be employed in rapid detection of existence of the antibiotic in seafood samples without assistance of instrument
Acknowledgements:
This work was supported by USDA-NIFA grant # 2018-67017-28116 and NIEHS UC Davis superfund project 5P42ES004699-30.
Footnotes
Publisher's Disclaimer: This is a PDF file of an unedited manuscript that has been accepted for publication. As a service to our customers we are providing this early version of the manuscript. The manuscript will undergo copyediting, typesetting, and review of the resulting proof before it is published in its final form. Please note that during the production process errors may be discovered which could affect the content, and all legal disclaimers that apply to the journal pertain.
Declaration of interests
The authors declare that they have no known competing financial interests or personal relationships that could have appeared to influence the work reported in this paper.
References
- 1.Witte W, Medical consequences of antibiotic use in agriculture. American Association for the Advancement of Science: 1998. [DOI] [PubMed] [Google Scholar]
- 2.Lipsitch M; Singer RS; Levin BR, Antibiotics in agriculture: When is it time to close the barn door? Proceedings of the National Academy of Sciences 2002, 99 (9), 5752–5754. [DOI] [PMC free article] [PubMed] [Google Scholar]
- 3.Chang Q; Wang W; Regev-Yochay G; Lipsitch M; Hanage WP, Antibiotics in agriculture and the risk to human health: how worried should we be? Evolutionary applications 2015, 8 (3), 240–247. [DOI] [PMC free article] [PubMed] [Google Scholar]
- 4.Khachatourians GG, Agricultural use of antibiotics and the evolution and transfer of antibiotic-resistant bacteria. Canadian Medical Association Journal 1998, 159 (9), 1129–1136. [PMC free article] [PubMed] [Google Scholar]
- 5.CDC. https://www.cdc.gov/drugresistance/index.html.
- 6.Mungroo N; Neethirajan S, Biosensors for the detection of antibiotics in poultry industry—a review. Biosensors 2014, 4 (4), 472–493. [DOI] [PMC free article] [PubMed] [Google Scholar]
- 7.Kümmerer K, Antibiotics in the aquatic environment–a review–part II. Chemosphere 2009, 75 (4), 435–441. [DOI] [PubMed] [Google Scholar]
- 8.Hirsch R; Ternes TA; Haberer K; Mehlich A; Ballwanz F; Kratz K-L, Determination of antibiotics in different water compartments via liquid chromatography–electrospray tandem mass spectrometry. Journal of chromatography A 1998, 815 (2), 213–223. [DOI] [PubMed] [Google Scholar]
- 9.Haller MY; Müller SR; McArdell CS; Alder AC; Suter MJ, Quantification of veterinary antibiotics (sulfonamides and trimethoprim) in animal manure by liquid chromatography–mass spectrometry. Journal of Chromatography A 2002, 952 (1–2), 111–120. [DOI] [PubMed] [Google Scholar]
- 10.Wu Y.-y.; Liu B.-w.; Huang P; Wu F-YJ A novel colorimetric aptasensor for detection of chloramphenicol based on lanthanum ion–assisted gold nanoparticle aggregation and smartphone imaging. Analytical and bioanalytical chemistry 2019, 411 (28), 7511–7518. [DOI] [PubMed] [Google Scholar]
- 11.Huang W; Zhang H; Lai G; Liu S; Li B; Yu A Sensitive and rapid aptasensing of chloramphenicol by colorimetric signal transduction with a DNAzyme-functionalized gold nanoprobe. Food chemistry, 2019, 270, 287–292. [DOI] [PubMed] [Google Scholar]
- 12.Wu Y-Y; Huang P; Wu F-Y A label-free colorimetric aptasensor based on controllable aggregation of AuNPs for the detection of multiplex antibiotics. Food chemistry, 2020, 304, 125377. [DOI] [PubMed] [Google Scholar]
- 13.Liu S; Dou L; Yao X; Zhang W; Zhao B; Wang Z; Ji Y; Sun J; Xu B; Zhang D Polydopamine nanospheres as high-affinity signal tag towards lateral flow immunoassay for sensitive furazolidone detection. Food chemistry, 2020, 126310. [DOI] [PubMed] [Google Scholar]
- 14.Niu Y; Zhang P; Wang L; Li N; Lin Q; Liu L; Liang H; Huang Z; Fu XJ Development of double-antibody sandwich ELISA for rapidly quantitative detection of antigen concentration in inactivated SCRV vaccine. Aquaculture, 2019, 734671. [DOI] [PMC free article] [PubMed] [Google Scholar]
- 15.Ji L; Dong C; Fan R; Qi SJ A high affinity nanobody against endothelin receptor type B: a new approach to the treatment of melanoma. Molecular Biology Reports, 2020, 47, 2137–2147. [DOI] [PubMed] [Google Scholar]
- 16.Si Y; Zhang Z; Wu W; Fu Q; Huang K; Nitin N; Ding B; Sun G, Daylight-driven rechargeable antibacterial and antiviral nanofibrous membranes for bioprotective applications. Science advances 2018, 4 (3), eaar5931. [DOI] [PMC free article] [PubMed] [Google Scholar]
- 17.El-Moghazy AY; Zhao C; Istamboulie G; Amaly N; Si Y; Noguer T; Sun G, Ultrasensitive label-free electrochemical immunosensor based on PVA-co-PE nanofibrous membrane for the detection of chloramphenicol residues in milk. Biosensors and Bioelectronics 2018, 117, 838–844. [DOI] [PubMed] [Google Scholar]
- 18.Zhang Z; Richardson CE; Hennebelle M; Taha AY, Validation of a One-Step Method for Extracting Fatty Acids from Salmon, Chicken and Beef Samples. Journal of food science 2017, 82 (10), 2291–2297. [DOI] [PubMed] [Google Scholar]
- 19.Zhu J; Sun G, Bio-functionalized nanofibrous membranes as a hybrid platform for selective antibody recognition and capturing. RSC Advances 2015, 5 (36), 28115–28123. [Google Scholar]
- 20.Wesongah J; Murilla G; Guantai A; Elliot C; Fodey T; Cannavan A, A competitive enzyme-linked immunosorbent assay for determination of chloramphenicol. Journal of veterinary pharmacology and therapeutics 2007, 30 (1), 68–73. [DOI] [PubMed] [Google Scholar]
- 21.Shen J; Zhang Z; Yao Y; Shi W; Liu Y; Zhang S, A monoclonal antibody-based time-resolved fluoroimmunoassay for chloramphenicol in shrimp and chicken muscle. Analytica chimica acta 2006, 575 (2), 262–266. [DOI] [PubMed] [Google Scholar]
- 22.Wang L; Zhang Y; Gao X; Duan Z; Wang S, Determination of chloramphenicol residues in milk by enzyme-linked immunosorbent assay: improvement by biotin− streptavidin-amplified system. Journal of agricultural and food chemistry 2010, 58 (6), 3265–3270. [DOI] [PubMed] [Google Scholar]
- 23.Chughtai MI; Maqbool U; Iqbal M; Shah MS; Fodey T, Development of in-house ELISA for detection of chloramphenicol in bovine milk with subsequent confirmatory analysis by LC-MS/MS. Journal of Environmental Science and Health, Part B 2017, 52 (12), 871–879. [DOI] [PubMed] [Google Scholar]
- 24.Byzova N; Zvereva E; Zherdev A; Eremin S; Dzantiev B, Rapid pretreatment-free immunochromatographic assay of chloramphenicol in milk. Talanta 2010, 81 (3), 843–848. [DOI] [PubMed] [Google Scholar]
- 25.Wang S; Chen Z; Choo J; Chen L, Naked-eye sensitive ELISA-like assay based on gold-enhanced peroxidase-like immunogold activity. Analytical and bioanalytical chemistry 2016, 408 (4), 1015–1022. [DOI] [PubMed] [Google Scholar]
- 26.Duyen TTM; Matsuura H; Ujiie K; Muraoka M; Harada K; Hirata K, Paper-based colorimetric biosensor for antibiotics inhibiting bacterial protein synthesis. Journal of bioscience and bioengineering 2017, 123 (1), 96–100. [DOI] [PubMed] [Google Scholar]
- 27.Xie S; Wen K; Wang S; Wang J; Peng T; Mari GM; Li J; Wang Z; Yu X; Jiang H Quantitative and rapid detection of amantadine and chloramphenicol based on various quantum dots with the same excitations. Analytical and bioanalytical chemistry 2019, 411 (10), 2131–2140. [DOI] [PubMed] [Google Scholar]


