

Abstract
Bispecific T cell engagers have demonstrated clinical efficacy, however, their use can be accompanied by severe toxicity. Mechanistic understanding of these toxicities is limited by a lack of suitable immunocompetent pre-clinical models. Here, we describe an immunocompetent mouse tumor model which exhibits bispecific T cell engager-induced toxicity and recapitulates key features similar to those in human cytokine release syndrome. In this study, toxicity occurred between the 2nd and 4th injections of an NKG2D bispecific T cell engager protein. Symptoms were transient peaking 3-4 hours after treatment and resolving by 8 hours. Mice developed weight loss, elevated plasma cytokines, a significant reduction in spleen white pulp and lymphocyte infiltration in the liver. Systemic cellular immune changes also occurred, notably an increase in CD8+ T cell activation, an increase in myeloid cells in the blood, and a population of Ly6Cint monocytes (CD11b+Ly6G−F4/80−) emerged in the liver and spleens of bispecific protein treated mice. IFNγ was primarily produced by CD8+ T cells in the spleen and was required for the observed changes in both T cell and myeloid populations. Rag deficiency, IFNγ deficiency, or depletion of either CD4+ or CD8+ T cells prevented toxicity. Whereas perforin deficiency, GM-CSF deficiency, or modulation of the myeloid population through clodronate-mediated depletion showed a partial abrogation of toxicity. Together these findings reveal that T cell activation by a bispecific T cell engager leads to changes in the host myeloid cell population, both of which contribute to treatment induced toxicity in immunocompetent mice.
Keywords: Bispecific T cell Engager, toxicity, Cytokine Release Syndrome, cancer immunotherapy, immunocompetent mouse tumor model
Introduction
T cells are key players in anti-tumor immunity(1, 2). One approach to enhance the function of T cells is to redirect them to recognize a tumor antigen using a bispecific antibody. These are called bispecific T cell engagers (bsTCEs). A successful strategy has been to connect two single chain variable fragments (scFv) with a flexible serine glycine linker(3). The bsTCE is then able to engage T cells through binding to CD3 with one arm and redirect them to a tumor antigen with the other arm. The bridging of CD3 with the target expressing cell results in cytolytic synapse formation, perforin and granzyme mediated, MHC-independent killing of target antigen-expressing cells, polyclonal T cell activation, proliferation and cytokine production(4). There are now more than 40 bsTCEs in clinical development with the majority of these being evaluated for hematologic indications, although several for solid tumor indications are now entering clinical trials(5). The most advanced is the FDA approved CD19xCD3 targeting bsTCE, blinatumomab, which is approved for the treatment of adults and children with relapsed/refractory (R/R) or minimal residual disease (MRD) positive B-cell precursor acute lymphoblastic leukemia (ALL)(6).
However, the clinical success of blinatumomab is accompanied by frequent and sometimes severe cytokine release syndrome (CRS) and neurotoxicity(7, 8). This toxicity profile has similarities to patients treated with chimeric antigen receptor (CAR) T cells, which redirect T cells to tumors through genetic engineering(7). Clinical manifestations of CRS can range from mild flu like symptoms to more severe sepsis like symptoms(9). In blinatumomab treated patients, CRS occurred in approximately 15% of R/R ALL and 7% in MRD-positive ALL patients in clinical trials(10). CRS typically occurs within the first few days of treatment and is characterized by high levels of circulating serum cytokines for both bsTCE and CAR T cell treated patients(11–16). The high levels of cytokines are thought to drive a macrophage dysfunction seen in some patients(7). Neurological symptoms may include headache, delirium, seizure, cerebral edema and intercranial hemorrhage and occur in approximately 65% of patients receiving blinatumomab(9, 10, 17), although only about 13% develop severe neurotoxicity(10).
For blinatumomab, these toxicities are primarily managed by suspending treatment and through administration of dexamethasone(7). An IL-6R blocking antibody, tocilizumab, has been FDA approved for treatment of CAR T cell-induced CRS. This approval was based on a retrospective analysis demonstrating that 50-70% of CAR T cell treated patients developing CRS responded to tocilizumab treatment(18). There have also been 30 cases identified in a retrospective analysis in which tocilizumab was used for the management of blinatumomab-induced CRS(19). Of the 22 cases with reported outcomes 21 reported resolution of symptoms(19). However, it is difficult to interpret the importance of tocilizumab in resolution of symptoms in these cases as patients also discontinued blinatumomab treatment and were treated with corticosteroids(19). Together these data suggest that IL-6 can be an important mediator of CRS, however, the fact that it is not effective in all cases suggests that other mechanisms are at play and that additional methods to treat these symptoms are still needed. A major hindrance is that the underlying mechanisms remain poorly understood, in part because these toxicities are not recapitulated in the immunodeficient xenograft models that are used to study most human T cell redirecting therapies. An increased understanding of mechanisms driving toxicities may lead to improved strategies to manage such events and improve patient outcomes.
We have developed both human and murine versions of a bsTCE in order to investigate immune interactions in syngeneic immunocompetent mouse tumor models. These bsTCEs are constructed from the extracellular portion of either mouse or human NKG2D receptor linked to an anti-CD3 scFv and do not contain a Fc(20, 21). NKG2D is an activation receptor found on NK cells and some T cell subsets and normally functions in the recognition of stressed, damaged or transformed cells(22). NKG2D ligands (NKG2D-L) are often expressed on tumor cells but are absent on most normal tissues, making them excellent immunotherapeutic targets(22). NKG2D-Ls are species-specific. The human bsTCE, hNKG2D-LxCD3 (hNKG2D-OKT3), recognizes two families of ligands: MHC class I chain-related proteins A (MICA) and B (MICB) as well as UL16 binding proteins (ULBP1 - 6)(20). This bispecific protein has demonstrated the ability to specifically activate T cells against ligand positive human tumor cell lines and primary tumor samples(20). The murine bispecific, mNKG2D-LxCD3 (mNKG2D-2C11), recognizes the ligands Rae1, Mult-1 and H60(21). In vitro, mNKG2D-2C11, engages both T cells and tumor cells, resulting in T cells producing IFNγ and cytotoxicity against ligand-positive tumor cells(21). mNKG2D-2C11 has also demonstrated in vivo anti-tumor efficacy(21). In this study, we describe the development of an immunocompetent mouse tumor model which exhibits mNKG2D-2C11 associated toxicity, with features similar to those observed in human CRS and explore mechanisms underlying the observed symptoms.
Methods
Cell lines
Murine colon cancer MC38 cells were obtained from Dr. Richard J. Barth (Geisel School of Medicine). Cell lines are tested routinely for mycoplasma by PCR at the time of experiments and retested periodically. After thawing, cells were passaged 2-3 times before use. MC38 cells were cultured in complete DMEM with a high glucose concentration (GE Hyclone Laboratories, SH30022.01) supplemented with 10% heat-inactivated FBS (GE Hyclone Laboratories, SH30910.03), 100U/ml penicillin, 100μg/ml streptomycin (GE Hyclone Laboratories, SV30010), 1mM sodium pyruvate (Corning Cellgro, 25-000-Cl), 10mM HEPES (Corning Cellgro, 25-060-Cl), 0.1mM MEM non-essential amino acids (Corning Cellgro, 25-025-Cl) and 50μM 2-mercaptoethanol (Sigma, M6250-100ML).
Production and Purification of Proteins
mNKG2D-2C11 and TZ47-2C11 bsTCEs were constructed as described(23, 24). The bsTCEs were produced using the Expi293™ expression system (ThermoFisher Scientific, A14635). Manufacturer’s instructions were followed for transfection of Expi293™ cells. Cultures were maintained at 37°C, 8% CO2 with shaking at 100 rpm for five days after transfection. Anti-CD4 and anti-CD8 depletion antibodies were purified from low serum adapted hybridoma supernatants of GK1.4 and 2.43 obtained from Dr. Mary Jo Turk (Geisel School of Medicine). Hybridomas were grown in Hybridoma-SFM media supplemented with 0.05% ultra-low IgG FBS (Life Technologies, 12045076, A3381901). Cell-free supernatant was then harvested and filtered using 0.45μm filter units and glass 1.0micron fiber prefilters (EMD Millipore Corporation, SCHVU05RE, AP1507500).
The bsTCEs were purified by nickel chromatography using an AKTA Start purification system (GE Healthcare, 29-0220-94). Briefly, supernatants were loaded on to a HisTrap HP column (GE Healthcare, 17524801) diluted in nickel column binding buffer (300mM NaCl, 50mM NaH2PO4, 20mM imidazole, pH=7.4) and eluted using a stepwise gradient of imidazole with the elution buffer (300mM NaCl, 50mM NaH2PO4, 480mM imidazole pH= 7.4). The anti-CD4 and anti-CD8 antibodies were purified using HiTrap Protein A HP columns (GE Healthcare, 29048576). The antibodies were eluted with 0.1M Glycine pH 2.2 (Fisher Scientific, BP381-500). 100μl of neutralization buffer (Tris-HCl, pH 9) was added to fraction collection tubes prior to elution. Eluted fractions containing desired protein as determined by SDS-PAGE gel (ThermoFisher Scientific, S6650) were combined and buffer exchanged into PBS (Corning Cellgro, 21-040-CV) using HiTrap desalting columns (GE Healthcare, 29-0486-84). Protein concentration was quantified by Nanodrop.
Mice
All experiments were conducted according to protocols approved by Dartmouth College’s Institutional Animal Care and Use Committee. C57BL/6 (B6, WT) were purchased from Charles River NCI (Frederick, MD). Rag1−/− mice (B6 background) were obtained from Dr. Yina Huang (Geisel School of Medicine). Interferon-gamma reporter with endogenous polyA transcript (GREAT) mice (B6.129S4-Ifngtm3.1Lky/J) were obtained from Dr. Mary Jo Turk (Geisel School of Medicine) (JAX, Stock 017581). Perforin-deficient mice (C57BL/6Prf1tm1Sdz/J) and IFNγ deficient mice (B6.129S7-Ifngtm1Ts/J) were obtained from the Jackson Laboratory (Stock 002407, 002287). GM-CSF-deficient mice (C57BL/6 background) were bred in our facility.
Tumor Model
MC38 tumor cells (106) in 0.4 mL HBSS (GE Hyclone Laboratories, SH30031.02) were injected subcutaneously (s.c.) into mice on day 0. When tumors reached approximately 40mm2 (days 10-14) treatment with the indicated bispecific protein was initiated (unless otherwise noted). Dose and interval of treatment are indicated in each experimental setup. BsTCEs were diluted in 0.4 mL HBSS and injected intravenously (i.v.)
Health status
The health status of mice was graded on a scale from 1 to 4 by an experimenter blinded to the group treatment status, as follows: 1 - normal and healthy; 1.5 - walking somewhat slowly; 2 - moving slowly; 2.5 - moving slowly, hunched posture; 3 - little movement, hunched posture, respiratory distress; 3.5 - little movement upon touch, hunched posture, respiratory distress; 4 – death. Mice were also weighed at the start of each experiment, daily during the course of treatment with bsTCEs and 2-3 times/week after treatment.
Mouse Treatment
Anti-CD4 (Clone GK1.5), anti-CD8 (clone 2.43), anti-mIL-6R (clone 15A7, BioXcell, BE0047) and control rat gamma globulin (Jackson ImmunoResearch, 012-000-002) were given i.p. at a dose of 200μg diluted in 0.4mL HBSS. In T cell depletion experiments, antibodies were given 1 day prior to the first injection of bsTCE. Anti-IL6R was given 3h prior to the 3rd injection of bsTCE. 1400W (Cayman Chemical, 214358-33-5) was administered i.p daily for 7 days at a dose of 100μg diluted in 0.2mL HBSS starting 5h before the first injection of bsTCE or before the 2nd and 3rd injections of bsTCE. Clodronate or control liposomes (Liposoma Research, CP-005-005) were given at a dose of 0.2mL i.v. one day prior to the initiation of bsTCE treatment.
Cytokine Analysis
Mouse blood was collected via tail bleed or cardiac puncture into 300μl Microvette® 100 EDTA tubes (VWR, 101093-992) centrifuged at 1,300rcf for 10 min. Plasma was then collected and frozen at −20 °C. Samples were then analyzed by multiplex cytokine analysis by DartLab.
Immunophenotyping
Blood, spleen, liver, tumor, and tumor draining inguinal lymph nodes were removed from mice and processed as follows for flow cytometry. Blood was collected as described above. Plasma was removed and frozen. The remaining cell layer was subjected to two rounds of red blood cell lysis by incubating for 5 min with 0.5mL of RBC lysis buffer (0.16M NH4Cl, 0.01M KHCO3, 0.1mM EDTA). Cells were washed twice with PBS after each round of RBC lysis. The spleen, lymph node, liver and tumor were manually dissociated. Spleens were washed with HBSS and then incubated for 3 min in 3mL RBC buffer. After 3 minutes, 10ml of HBSS was added to neutralize the RBC lysis buffer and the suspension was filtered through a 70μm cell strainer (VWR, 21008-952). Cells were pelleted as before, resuspended in PBS. Lymph nodes were pelleted at 4.6x1000g for 1 min and resuspended in PBS. Livers and tumors were dissociated in 1.5mg/ml collagenase and 0.4mg/ml DNAse (Sigma, 10103586001, DN25-100MG) in HBSS and then incubated for 1 hour at 37°C with shaking. The disaggregated tissue was strained through 70μm cell strainer and washed with 10mL HBSS. Red blood cells were then lysed in these tissues, as described for the spleen. Cells were washed with HBSS and resuspended in PBS. Cells from spleens, lymph nodes, livers and tumors were counted by hemocytometer, and 5x10⁵ cells were stained for each sample. Samples were stained with 1:100 dilution of Zombie UV (Biolegend, 423108), followed by blocking with anti-CD16/32 (Biolegend, 101302) and 2% mouse serum (Jackson Immunoresearch, 015-000-120). Samples were then incubated with staining cocktail: CD45.2 PE at a 1:50 dilution (BD Biosciences, 560695, clone 104), CD3 PE-Cy7 at a 1:200 dilution (BD Biosciences, 560591, clone 17A2, CD4 APC-Cy7 at a 1:200 dilution (BD Biosciences, 552051, clone GK1.5), CD8 BV711 at a 1:200 dilution (BD Biosciences, 563046, clone 53-6.7), CD44 BV605 at a 1:200 dilution (BD Biosciences, 563058, clone IM7), CD62L BV510 at a 1:50 dilution (BD Biosciences, 563117, clone MEL-14), NK1.1 BV421 at a 1:50 dilution (Biolegend, 108741, clone PK136), CD49b FITC at a 1:50 dilution (BD Biosciences, 553857, clone DX5), CD11b PE-Cy5 at a 1:50 dilution (Biolegend, 101210, clone M1/70), F4/80 BV650 at a 1:200 dilution (Biolegend, 123149, clone BM8), Ly6C APC at a 1:200 dilution (Biolegend, 128016, clone HK1.4), Ly6G BUV395 at a 1:200 dilution (BD Biosciences, 563978, clone 1A8), CD19 BUV737 at a 1:200 dilution (BD Biosciences, 564296, clone 1D3). Samples were fixed with methanol free 0.5% formaldehyde (Polysciences, Inc, 04018-1) and run on a Yeti/ZE5 (Propel Labs, Fort Collins, CO). Flow cytometry data was analyzed using FlowJo V10. (FlowJo, LLC).
Pathology
Dissected tissues were fixed in 10% formalin (VWR, 10662-328). Paraffin sections were generated and stained with hematoxylin and eosin by the Pathology Research Resource at Dartmouth–Hitchcock Medical Center. Histological analysis was performed in an independent and blinded manner by pathologist Dr. Zakaria Grada (Geisel School of Medicine). Tissues were taken for analysis from each mouse: brain, heart, kidney, liver, lungs, and spleen. Tissues were rated as normal or pathology was noted.
Immunohistochemistry
Paraffin embedded 2.5% buffered formalin-fixed tissue specimens (brain, lung, heart, pancreas, spleen, liver, kidney, inguinal lymph node, tumor) from adult C57Bl/6 mice underwent deparaffinization and heat-induced epitope retrieval using sodium citrate buffer (pH 6.0) prior to antibody staining with polyclonal goat IgG anti-mouse pan-specific Rae1 primary antibodies (R&D systems, AF1136) in a 1:20 dilution overnight at 4°C in a humidity chamber. Contiguous sections from each sample were incubated with primary antibodies pre-incubated for 4 hours with recombinant mouse Rae1 Fc chimeric protein (R&D Systems, 1998-RA) at a 1:10 molar ratio as specificity controls. Blocking reagents, secondary antibodies, and diaminobenzidine chromogen were added using a high sensitivity streptavidin conjugated anti-goat antibody kit (R&D Systems, CTS008). Slides were counterstained with methylene blue. B16F10-Rae1 melanoma cells were stained as positive controls. Specimens were also incubated with no primary antibodies as negative controls.
Results
mNKG2D-2C11 induces toxicity in B6 mice bearing MC38 S.C. tumors
In order to study toxicity of the T cell redirecting bispecific proteins, MC38 mouse colon carcinoma cells, which endogenously express Rae-1, were injected s.c. into B6 mice. Once tumors reached approximately 40mm2 (day 10-14 post-tumor injection), treatment with either mNKG2D-2C11 or a control bsTCE (TZ47-2C11) was initiated. Both bsTCEs are similar in size and have the same anti-CD3 scFv domain through which they can bind murine T cells and lack Fc domains. However, the control bsTCE is specific for human B7H6, which has no expression in mouse tissues, while mNKG2D-2C11 is specific for murine NKG2D-Ls (Figure 1A). Mice were injected i.v. with 10μg of bsTCE every other day for a total of four doses. Mice were monitored for symptoms of toxicity in a blinded manner and given a health score between 1 to 4, where a score of one was a normal healthy mouse and higher scores indicate progressively worse symptoms (see Methods for scoring system). Mice experienced decreased activity, hunched posture, piloerection, respiratory distress and weight loss. Mouse distress was observed between the 2nd and 4th treatments but never occurred after a single injection or when more than 4 injections were given (Figure 1B, Supplemental Figure 1A). The symptoms were transient, peaking 3-4 hours after treatment with complete resolution by 8 hours. Symptoms were also dose-dependent. When mice were treated with 2μg, 5μg or 10μg doses of mNKG2D-2C11, only mice treated at the 10μg dose experienced toxicity (Figure 1C).
Figure 1: Kinetics and dose response of mNKG2D-2C11 induced toxicity.
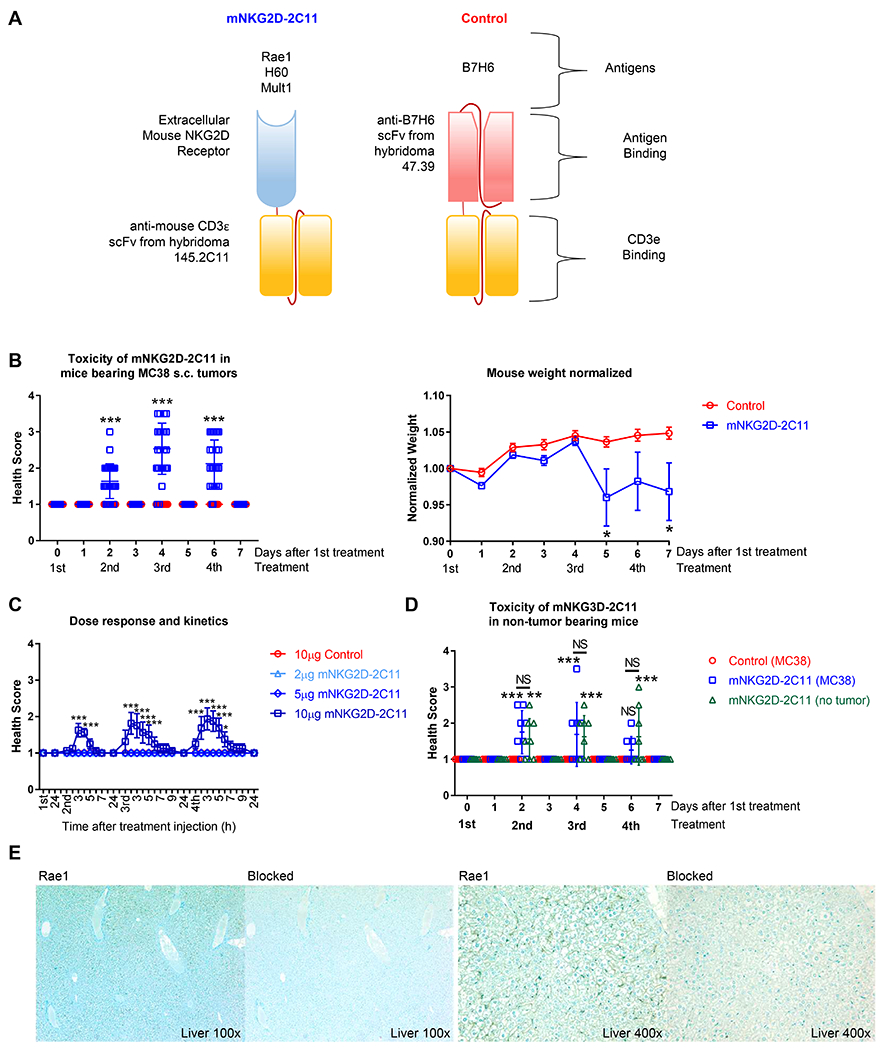
(A) Diagram showing construction of treatment (mNKG2D-2C11) and control (TZ47-2C11) bsTCEs. (B-D) MC38 (1x10⁶) cells were injected s.c. into WT B6 mice. Treatment was initiated when tumors reached approximately 40mm2. (B) Mice received a total of four 10μg i.v injections of bsTCE every other day. (Left) Health scoring was blinded and evaluated 3h and 24h after each treatment. (Right) Weight, normalized to day 0, at the indicated time points. Data pooled from 7 experiments (n=30) (C) Mice received a total of four i.v. injections of either 2, 5 or 10μg bsTCE every other day. Health scoring was blinded and evaluated every hour for the first 8h and then 24h after each treatment. Data pooled from 2 experiments (n=8). (D) Tumor or non-tumor bearing WT B6 mice received a total of four 10μg i.v injections of bsTCE every other day. Health scoring was blinded and evaluated 3h and 24h after each treatment. Data are pooled from two experiment (n=8). (E) Representative images of Rae1 positive staining in the liver of B6 mice or contiguous tissue sections blocked with recombinant Rae1. Slides counterstained with methylene blue. Health scores in B and D are shown +/− SD, weight and C are shown +/− SEM. Statistical significance determined by repeated measures two-way ANOVA with Bonferroni’s multiple comparisons test (B, C) or with Tukey multiple comparisons test (D). * p<0.05, *** p<0.001, NS = not statistically significant.
Toxicity was also evaluated using two additional tumor models, a B16F10-Rae1 metastatic lung tumor model and an RMA-Rae1 lymphoma model. Similar toxicity was also observed in these tumor models (supplemental Figure 1B,C). These observations prompted us to evaluate the dependence of toxicity development on presence of a tumor. Evaluation of toxicity in non-tumor bearing mice revealed that toxicity occurred regardless of the presence of the tumor (Figure 1D). As NKG2D ligand expression has been reported on some normal healthy mouse tissues(25, 26), this likely represents an on-target, off-tumor response, recapitulating a common clinical issue. Indeed, immunohistochemical analysis in mice revealed positive Rae1 expression in the liver. The Rae1 specific antibody was blocked by pre-incubation with a recombinant Rae-1-fusion protein in contiguous sections from the same tissue sample, thus demonstrating antigen-binding specificity (Figure 1E). Other tissues examined (heart, lymph node, kidney and spleen) showed no positive staining compared to Rae1 protein blocked slides (Supplemental Figure 1D, E). Together these findings establish an immunocompetent mouse tumor model that demonstrates dose dependent, transient, on-target off-tumor symptoms of toxicity when treated with mNKG2D-2C11.
mNKG2D-2C11 mediated toxicity is associated with elevated plasma cytokines and changes in T cell and myeloid populations
At the point of maximal symptoms of toxicity, 3h after the 3rd bsTCE injection, plasma cytokines, pathology and immune populations were evaluated. The cytokine profile in these mice was elevated for IL-6, IL-10, IFNγ, TNFα and IL-2 (Figure 2A, B), which was highly similar to those reported in patients receiving blinatumomab treatment(11, 12). In addition to the cytokines that have been reported from patients, we examined a wider panel of cytokines, many of which were elevated (Figure 2A, Supplemental Figure 2). When fold change between control versus mNKG2D-2C11 treated mice was examined, IFNγ (145-fold) was identified as the cytokine with the greatest increase (Figure 2A).
Figure 2: mNKG2D-2C11 mediated toxicity is associated with elevated plasma cytokines and changes in T cell and myeloid populations.
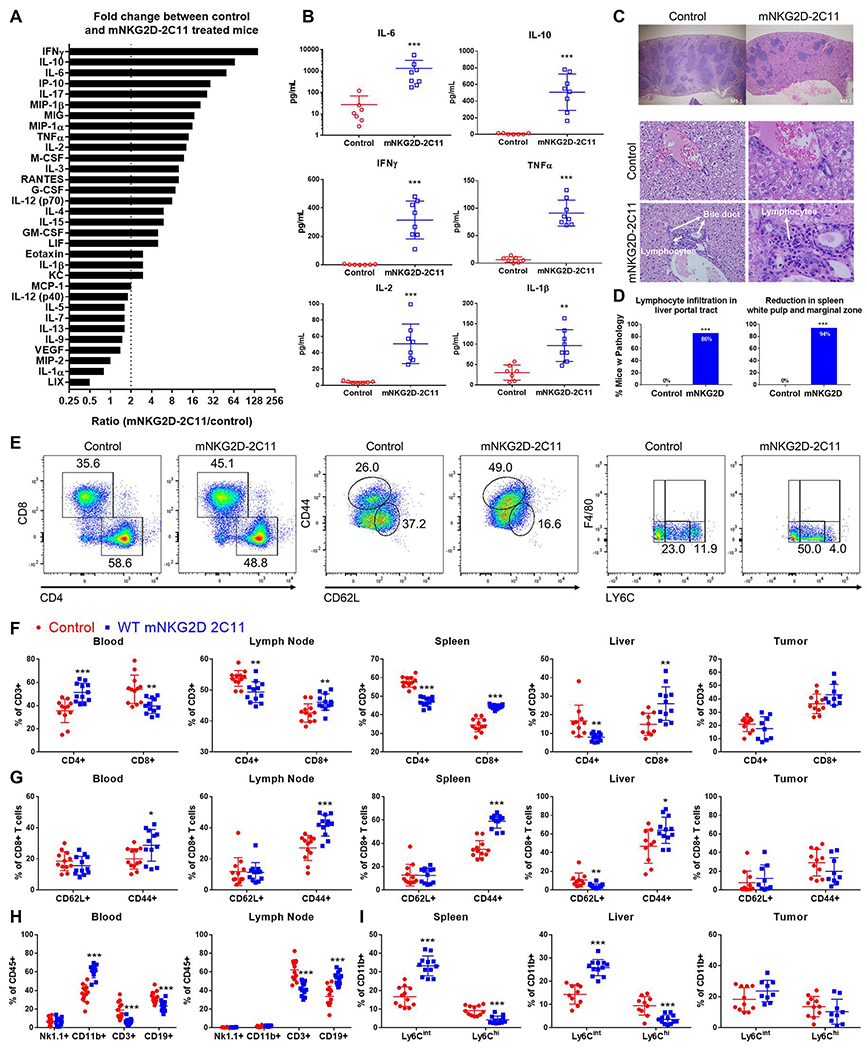
MC38 (1x10⁶) cells were injected s.c. into WT B6 mice. Subsequently, mice received a total of three 10μg i.v injections of bsTCE every other day. 3h after the 3rd bsTCE injection: (A,B) Plasma was collected and analyzed by multiplex cytokine array. (A) All cytokines evaluated are shown ranked by greatest fold change between mNKG2D-2C11 and control treated mice. Dashed line indicates a fold change greater than 2. All cytokines above this threshold were significantly different from the control group by unpaired two tailed Mann-Whitney test. (B) Plasma concentration of select cytokines shown as mean +/− SD. Data pooled from two experiments (n=8). (C,D) Tissues were paraffin embedded, sectioned and stained with hematoxylin and eosin. (C) Representative images of spleens (above) or livers (below) are shown. (D) Percent of mice displaying each phenotype are shown. Statistical significance determined by two-tailed Fisher’s exact test performed on the number of mice with each phenotype. Data pooled from six experiments with n=17-21. (E-H) Flow cytometry was performed to analyze cell populations in the indicated tissues. (E) Representative flow plots showing changes in T cell and myeloid populations in the spleen. The indicated cell populations are shown as a %CD3+ cells in (F), %CD8+ T cells in (G), %CD45+ cells in (H) and (I) shows Ly6C+ populations (CD11b+Ly6G−F4/80−) as %CD11b+ cells. Data pooled from 4 experiments (n=9-12). Statistical significance determined by unpaired t test without assuming a consistent SD. Error bars show mean +/− SD. * p<0.05, ** p<0.01, *** p<0.001, NS=not statistically significant.
Tissue sections of the brain, heart, lung, liver, spleen and kidneys were stained with hematoxylin and eosin and evaluated by a pathologist blinded to treatment conditions. This analysis showed a significant reduction in white pulp and marginal zone in mouse spleens (17/18 mice, 94%) and increased lymphocyte infiltration in the liver of animals treated with mNKG2D-2C11 (18/21 mice, 86%) (Figure 2C, D). However, the other organs evaluated (brain, heart, lung, kidneys) were within normal limits, including no evidence of liver hepatocyte death (data not shown).
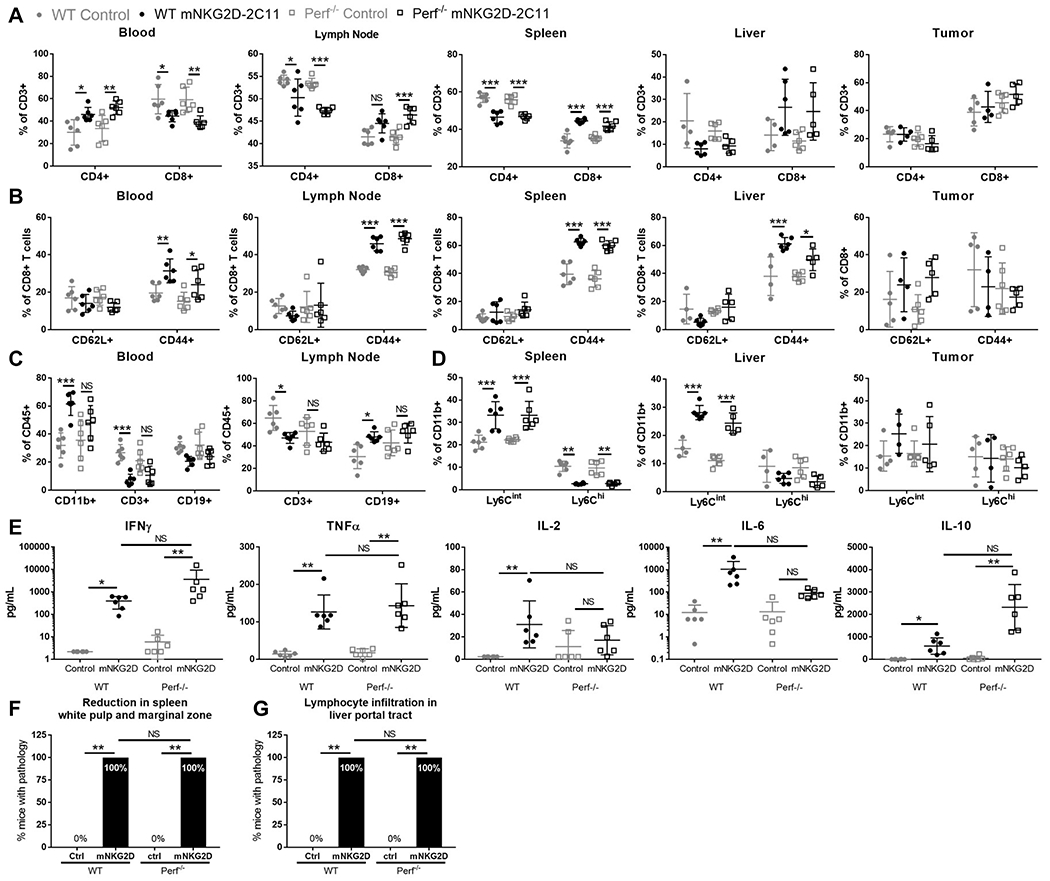
Additionally, systemic changes in immune populations were found in the evaluated organs (blood, liver, spleen, tumor draining lymph node and tumor). The primary changes found were in the T cell and myeloid compartments (Figure 2F–I, Supplemental Figure 3). Within the T cell compartment, the percent CD4+ T cells was decreased and percent CD8+ T cells was increased significantly in the lymph node, spleen and liver (p<0.01) and showed a similar trend in the tumor (p=0.06). However, in the blood, the opposite occurred with CD4+ T cells increased (p<0.001) and CD8+ T cells decreased (p<0.01) (Figure 2F). In the blood, lymph node, spleen and liver, the percent CD8+CD44+ T cells increased (p<0.05) (Figure 2G), likely indicative of CD8+ T cell activation. Indeed, the overall percent of T cells (CD3+) was decreased in the blood (p<0.001) which may reflect a transient lymphopenia (margination) effect which has been observed with other CD3 targeting antibodies(27) (Figure 2H). In the myeloid compartment, the total percent CD11b+ cells was increased in the blood, and the percentage of Ly6Cint monocytes (CD11b+Ly6G−F4/80−) increased in the spleen and liver with concomitant decrease in the percent Ly6Chi monocyte population (all p<0.001) (Figure 2H,I). Overall this model was similar to the cytokine profile observed in patients receiving blinatumomab and was associated with systemic immune cell changes, including histological changes in the spleen and liver, and increased percentages and activation of CD8+ T cells as well as changes in the myeloid population.
T cell activity and function are required for mNKG2D-2C11 induced toxicity
To confirm the requirement for T cells in the development of this toxicity, the same experimental setup was examined in WT and Rag−/− mice. WT mice experienced toxicity, but no toxicity was observed at any point in the Rag−/− mice (Figure 3A). To investigate the contribution of T cell subsets, depletion of CD4+ or CD8+ T cells was achieved by treatment with depleting antibodies one day prior to the first treatment with bsTCEs. Although CD8+ T cells showed the most prominent activation after mNKG2D-2C11 treatment (Supplemental Figure 3D–F), depletion of either CD4+ T cells or CD8+ T cells was sufficient to inhibit the development of symptoms in mice (Figure 3B). IFNγ was the cytokine that showed the greatest fold increase and is important for immune activation, so we investigated whether IFNγ was required for the development of toxicity. Indeed, symptoms did not occur in IFNγ−/− mice compared with WT mice (Figure 3C). In addition to IFNγ production, activation of T cells results in cytotoxic killing of target cells through perforin and granzyme. To determine whether perforin-mediated killing might be involved in this acute toxicity, we compared the response of perforin-deficient mice with WT mice and found that toxicity was reduced but not completely prevented in perforin−/− mice (Figure 3D). Thus, the data have shown that both CD4+ and CD8+ T cells as well as IFNγ are required for mNKG2D-2C11-mediated toxicity, while perforin deficiency reduced, but did not completely prevent toxicity development.
Figure 3: T cell activity and function are required for mNKG2D-2C11 induced toxicity.
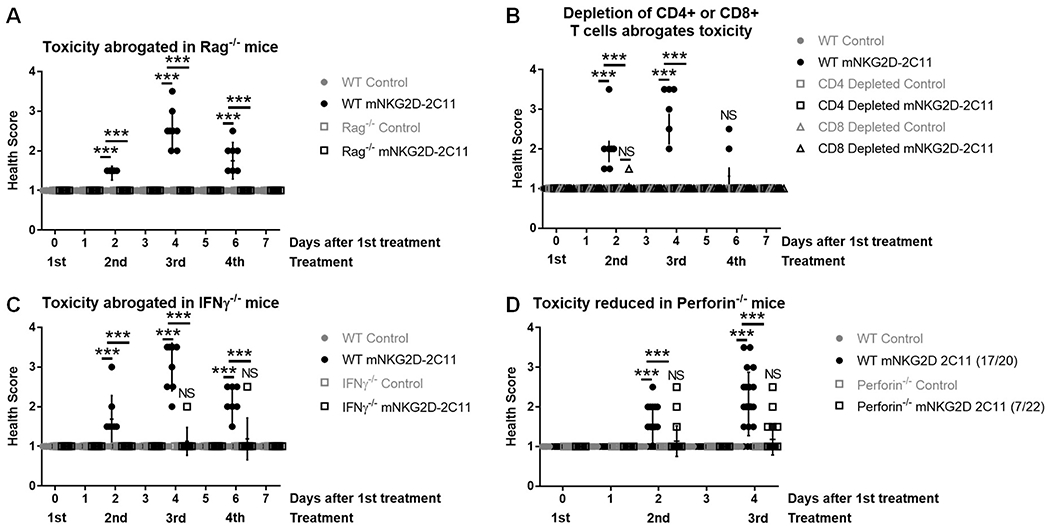
MC38 (1x10⁶) cells were injected s.c. into WT B6 mice. Subsequently, mice received a total of four 10μg i.v injections of bsTCE every other day. Health scoring was blinded and evaluated 3h after each treatment and additionally after 24h where indicated. (A) Experiment was conducted in WT or Rag−/− mice. (B) Mice received 200μg i.p. of CD4 or CD8 depleting mAb or immunoglobulin control one day prior to the first injection of bsTCE. (C) Experiment was conducted in WT or IFNγ−/− mice. (D) Experiment was conducted in WT or perforin−/− mice. Figure legend notation indicates (#mice developing toxicity/total treated). In A-C data pooled from 2 experiments (n=7-8). In D, data pooled from 5 experiments (n = 20-22). All data are shown +/− SD. Statistical significance determined by repeated measures two-way ANOVA with Tukey multiple comparisons correction. * p<0.05, ** p<0.01, *** p<0.001, NS=not statistically significant.
IFNγ is produced mainly by splenic CD8+ T cells and is required for changes in immune cell populations and plasma cytokines
We next examined how IFNγ affected the systemic changes in immune cell populations observed. We found that changes in both T cell and myeloid populations were inhibited in IFNγ−/− mice (Figure 4A–D). Neither the changes in percent CD4+ T cells and CD8+ T cells (Figure 4A), nor the changes in CD11b+ (Figure 4C) or Ly6Cint monocyte populations (Figure 4D) were seen in nearly all tissues examined in IFNγ−/− mice. In these experiments, the increased percent CD8+CD44+ T cells only reached statistical significance in WT mice in the lymph node and spleen, and IFNγ deficiency inhibited the increase in this population in the lymph node but not in the spleens of treated mice (Figure 4B).
Figure 4: IFNγ is produced mainly by splenic CD8+ T cells and is required for changes in immune cell populations and plasma cytokines.
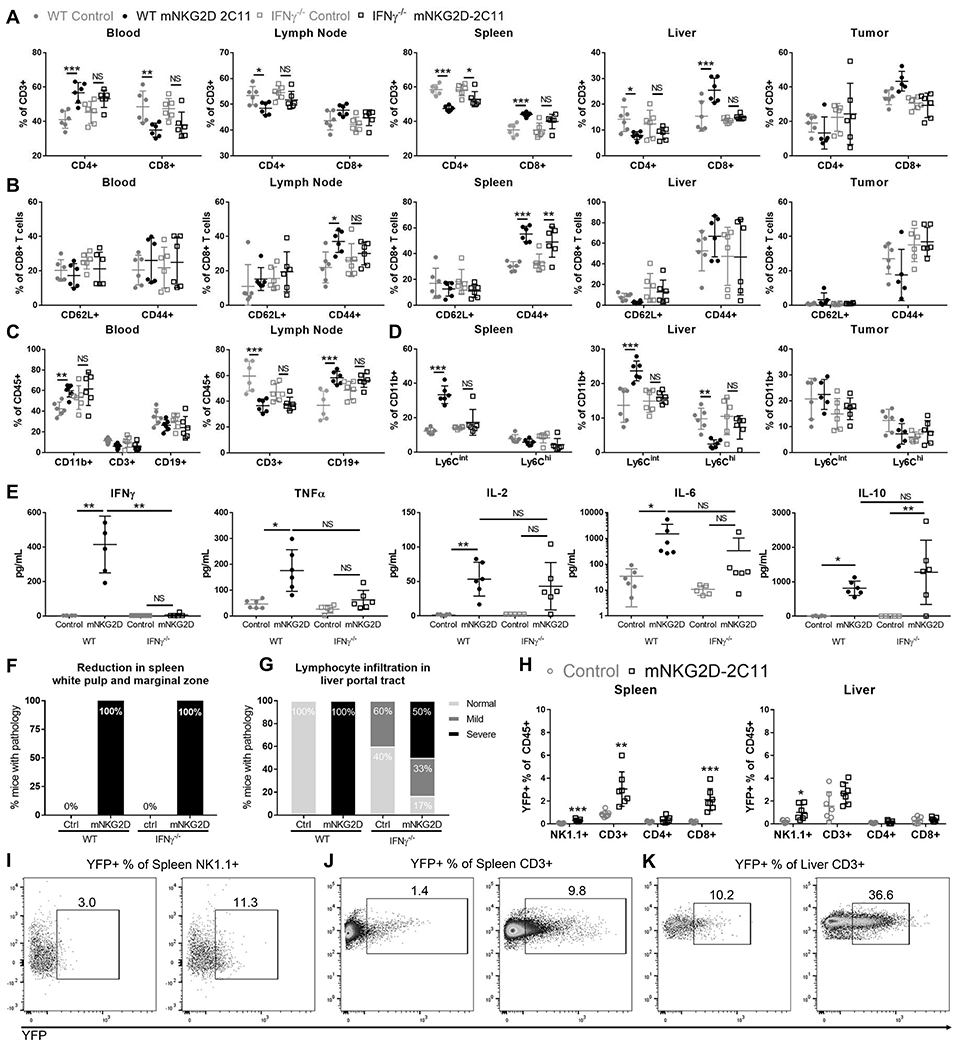
MC38 (1x10⁶) cells were injected s.c. into WT or IFNγ−/− mice. Subsequently, mice received a total of three 10μg i.v injections of bsTCE every other day. 3h after the 3rd bsTCE injection, flow cytometry was performed to analyze cell populations in the indicated tissues. The specified cell populations are shown as a % of CD3+ cells (A), %CD8+ cells (B), %CD45+ cells (C) and %CD11b+ T cells in (D). Blood was also collected and analyzed for plasma cytokines by multiplex bead array (E). Data pooled from 2 experiments (n=6). Error bars show mean +/− SD. (F,G) Tissues were paraffin embedded, sectioned and stained with hematoxylin and eosin. (F) Percent of mice with spleen pathology. Data from one experiment, n=3. (G) Percent of mice with liver pathology. Data from two experiments, n=5-6. (H-K) Tissues from IFNγ reporter mice treated as in A-D were analyzed by flow cytometry for YFP expression (indicating IFNγ production). (H) Quantification of the YFP+ cells as a percent of CD45+ cells for each population. (I-K) Representative flow plots are shown with splenic YFP+ NK cells shown in (I), Splenic T cells shown in (J) and liver T cells shown in (K). Data pooled from 2 experiments (n=7). For A-D statistical significance determined by two-way ANOVA with Tukey multiple comparison correction. For E, significance determined by Kruskal-Wallis test with Dunn’s post test. In I, significance determined by unpaired t test without assuming a consistent SD. * p<0.05, ** p<0.01, *** p<0.001
Plasma cytokines were also evaluated in WT or IFNγ−/− mice. While IFNγ−/− did not completely inhibit the elevation of any cytokines evaluated, the mean concentration of IL-2, IL-6 and TNFα were all decreased in mNKG2D-2C11 treated IFNγ−/− mice compared with WT treated mice (Figure 4E).
Additionally, the development of pathology in mouse tissues was evaluated. Reduction in white pulp and marginal zone in mouse spleens occurred in 100% of mNKG2D-2C11 treated mice regardless of whether they were WT or IFNγ−/− (Figure 4F). However, IFNγ−/− mice had increased baseline lymphocyte infiltration in the liver compared with WT mice. In the control treated WT group 0/6 mice were scored positive for lymphocyte infiltration in the liver and 6/6 were scored as having severe infiltration in the WT mNKG2D-2C11 treated group. In contrast, control treated IFNγ−/− mice had 2/5 (40%) scored as having mild lymphocyte infiltration. Despite this increased baseline infiltration, differences were observed when compared to the mNKG2D-2C11 treated IFNγ−/− group. In this group 1/6 (17%) of mice had no infiltration, 2/6 (33%) had mild infiltration and 3/6 (50%) had severe infiltration (Figure 4G). These results indicated that there was an increase in liver lymphocyte infiltration in mNKG2D-2C11 treated IFNγ−/− mice. However, this increase in lymphocyte infiltration was blunted compared to mNKG2D-2C11 treated WT mice despite higher baseline infiltration. Suggesting that this phenotype is associated with toxicity development, in contrast to the loss in splenic white pulp, which occurred regardless of toxicity.
To determine the cellular source of IFNγ, we employed reporter mice which express YFP under the control of the IFNγ promoter. YFP expression was evaluated in NK and T cells at the peak of toxicity in the spleen, liver, blood, lymph node and tumor. This analysis indicated that CD8+ T cells in the spleen were the main source of IFNγ production, although NK cells also contributed. In the liver, there was also a trend for increased YFP expression in T cells (p=0.08) (Figure 4H–K). These data are consistent with the observation that pathology occurred in the spleen and liver, and likely reflects T cell activation in these organs, possibly in response to endogenous expression of NKG2D ligands.
Perforin minimally impacts changes in cellular immune populations
In contrast to IFNγ-deficient mice, perforin-deficient mice had very similar changes in T cell and myeloid populations compared with mice in the WT groups (Figure 5A–D). The only differences between perforin−/− mice in comparison with WT mice were in the blood and lymph node. Within these tissues, the trends in the T cell and myeloid populations were similar but failed to reach statistical significance in perforin−/− mice while changes were significant in WT mice when comparing mNKG2D-2C11 treated mice to the control groups (Figure 5C). However, all other cellular changes in both the T cell and myeloid compartment were similarly affected in WT and perforin−/− mice when treated with mNKG2D-2C11 (Figure 5A, B,D). Analysis of plasma cytokines in the control versus treatment group of both WT and perforin−/− mice showed elevation of IFNγ, TNFα and IL-10. However, the increase in mean plasma concentration of IL-2 and IL-6 in control versus the mNKG2D-2C11 treated group was reduced in perforin−/− mice compared with WT mice (Figure 5E). Additionally, pathology analysis in perforin−/− mice was similar to WT mice, with reduced white pulp and marginal zone in the spleen (6/6 mice, 100%) and severe lymphocyte infiltration in the liver portal tract (6/6 mice, 100%) (Figure 5F, G). These data have shown that IFNγ but not perforin is primarily responsible for driving the cellular and cytokine changes in immune populations. However, the effect of perforin deficiency on cytokine levels may explain the decreased toxicity observed in these mice.
Figure 5: Perforin minimally impacts changes in cellular immune populations.
MC38 (1x10⁶) cells were injected s.c. into WT or Perforin−/− mice. Subsequently, mice received a total of three 10μg i.v injections of bsTCE every other day. 3h after the 3rd bsTCE injection, flow cytometry was performed to analyze cell populations in the indicated tissues. The indicated cell populations are shown as a % of CD3+ cells (A), %CD8+ T cells (B), %CD45+ cells (C) and %CD11b+ cells (D). Blood was also collected and analyzed for plasma cytokines by multiplex bead array (E). Data pooled from 2 experiments (n=6). Error bars show mean +/− SD. (F,G) Tissues were paraffin embedded, sectioned, stained with hematoxylin and eosin and evaluated by a pathologist blinded to treatment. (F) Percent of mice with spleen pathology. (G) Percent of mice with liver pathology. Statistical significance determined by two-tailed Fisher’s exact test performed on the number of mice with each phenotype. Data from two experiments, n=6. For A-D statistical significance determined by one-way ANOVA with Tukey multiple comparison correction. For E, significance determined by Kruskal-Wallis test with Dunn’s post test * p<0.05, ** p<0.01, *** p<0.001
Phagocytic cell inhibition or depletion reduced development of mNKG2D-2C11 mediated toxicity
In addition to changes in the T cell compartment, flow cytometry analysis revealed changes in the myeloid cell compartment. We sought to determine the impact of this population through clodronate depletion experiments. When compared to sham or control liposome treatment, mice injected with clodronate liposomes had reduced development of mNKG2D-2C11 induced toxicity. In the sham-treated group 11/12 (92%) of mice developed toxicity (at any point during evaluation), 9/11 mice (82%) treated with control liposomes, and only 3/11 mice (27%) in the clodronate-treatment group (Figure 6A). Therefore, several functional properties of macrophages were investigated. GM-CSF, IL-6 and iNOS all have important functional roles for myeloid cells and have also been implicated in development of toxicity in clinical and preclinical studies in subjects treated with T cell redirecting therapeutics(8, 16, 18, 28–30). Indeed, toxicity development was reduced in this model when GM-CSF deficient mice were tested (Figure 6B), but was unaltered in the presence of IL-6R blocking antibody (Figure 6C) or by pharmacological inhibition of iNOS with 1400W (Figure 6D). These data demonstrate a role for myeloid cells in the development of mNKG2D-2C11 mediated toxicity with partial contribution from GM-CSF, but not from IL-6 or iNOS.
Figure 6: Phagocytic cell depletion or GM-CSF deficiency reduce development of mNKG2D-2C11 mediated toxicity.
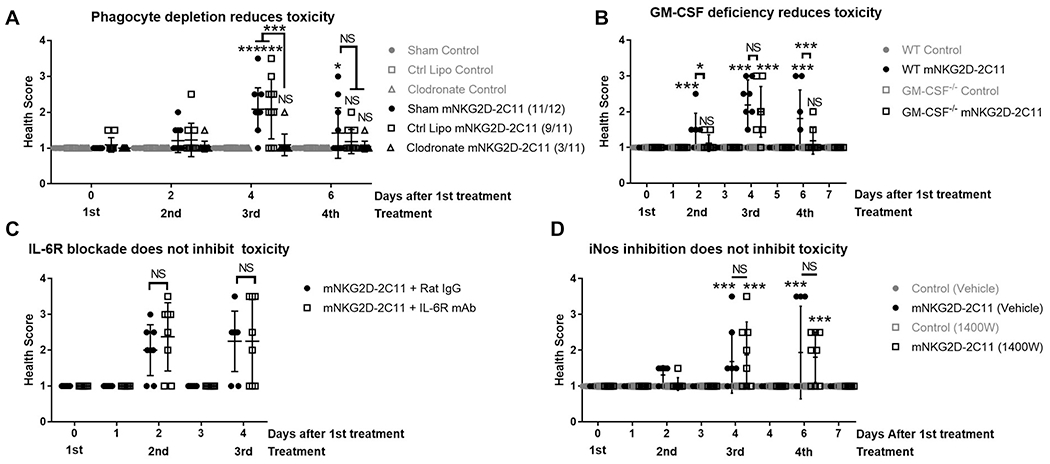
MC38 (1x10⁶) cells were injected s.c. into WT B6 mice. Subsequently, mice received 10μg i.v injections of bsTCE every other day. Health scoring was blinded and evaluated 3h after each treatment and additionally after 24h where indicated. (A) Mice received 200μl i.v. of clodronate, control liposomes or HBSS one day prior to the first injection of bsTCE. Data pooled from 3 experiments (n = 8-12). (B) Experiment was conducted in WT or GM-CSF−/− mice. Data pooled from 2 experiments (n = 8-9). (C) Mice received 200μg i.p. of IL-6R blocking mAb or isotype 3h prior to the third injection of bsTCE. Data pooled from 2 experiments (n = 8). (D) Mice received 100μg i.p. of the iNOS inhibitor 1400W or HBSS either daily or 5h prior to 2nd and 3rd injections of bsTCE. Data pooled from 2 experiments (n=8). All data are shown +/− SD. Statistical significance determined by repeated measures two-way ANOVA with Tukey multiple comparisons test (A, B, D) or with Bonferroni’s multiple comparisons test (C). * p<0.05, ** p<0.01, *** p<0.001, NS=not statistically significant.
Discussion
In this study, we have utilized an immunocompetent, syngeneic mouse tumor model to study the mechanisms contributing to toxicity induced by the T cell engaging bispecific mNKG2D-2C11. We established that mNKG2D-2C11 induces a transient, dose-dependent toxicity that coincides with high levels of plasma cytokines. Additionally, we demonstrated that IFNγ, produced primarily by CD8+ T cells in the spleen, is required for development of these CRS-like symptoms and changes in immune cells. We also establish that both CD4+ and CD8+ T cells as well as phagocytes contribute to the observed toxicity. Furthermore, data suggest that T cell cytotoxicity via perforin contributes to severity but is not required for development of this toxicity.
The toxicity observed was independent of a tumor and is likely the result of on-target off-tumor toxicity, although it is difficult to pinpoint the source of the target. We did observe Rae1 expression in the liver as well as some indications of T cell activation in this tissue. Mouse NKG2D recognizes several ligands, including Rae1, H60 and Mult1 and there are several isoforms(31). The mRNA expression of NKG2D ligands is insufficient to predict surface expression, as NKG2D ligands are regulated at both the transcriptional and post translational levels(31). A possible explanation for the systemic responses observed in this mouse model is that NKG2D-Ls may be present at very low levels in additional mouse tissues, such as the spleen. Alternatively, a T cell response against hepatocytes may act as a triggering event that induces myeloid cells to upregulate NKG2D-L, which may occur under stress conditions(26, 32–39).
One of the main strategies to manage toxicity of bsTCEs is to use a stepwise dosing schedule to reduce the frequency and severity of toxicities in patients treated with blinatumomab(40). Although the mechanism is not understood, this phenomenon is observed clinically after blinatumomab treatment(41) and has been observed in multiple other preclinical models(27, 42, 43). One of the main hypotheses is that many target expressing cells are depleted early in treatment, leading to reduced T cell activation and therefore cytokine release in subsequent cycles. However, it was recently shown ex vivo that a reduced cytokine response could still occur when fresh target cells were supplemented during repeated treatment cycles(27). Another possible explanation is that the initial T cell activation and cytokine release activate negative feedback mechanisms, such as PD-1 expression(44), that restrain T cell cytokine release during subsequent dosing. Considering the dose responsiveness of mNKG2D-2C11 induced toxicity and that toxicity tapered off after the 3rd dose, it is possible that a stepwise dosing schedule would minimize toxicity. Other feedback mechanisms may limit unchecked T cell activation, such as IFNγ and IL-10, both of which were elevated and have been reported to downregulate the expression of NKG2D-Ls on mouse and human tumor cells(26, 45, 46).
While the pathophysiology of CRS is incompletely understood(9), some recent studies have identified several components that may be involved in the development of CRS. T cell derived IFNγ(9, 47, 48), TNFα(27, 49) and GM-CSF(29, 30) have all been identified as cytokines that may be involved in initiating the cascade leading to cytokine storm. The initial T cell cytokine release is thought to result in the activation of bystander cells, especially monocyte(28) and macrophage(50) populations. These myeloid cells have been shown to be the main producers of IL-1(27, 28, 50), IL-6(27, 28, 50) and NO(50), which can contribute to the development of CRS. Several of the studies implicating these cytokines in CRS development have been CAR T cell studies, including preclinical studies regarding GM-CSF(29, 30), IL-1(28, 50), IL-6(28, 50) and NO(50). Although the clinical presentation of CRS in patients treated with bsTCEs is similar to CRS observed in CAR T cell–treated patients, caution should be used when extrapolating these results(27). These treatment modalities have some major differences, such as the kinetics of CRS onset and severity correlating with the magnitude of initial T cell activation (27). In this work, GM-CSF was not as critical a component in the development of CRS symptoms as has been observed for CAR T cells(29).
A recent study reported a mechanism of toxicity for a bsTCE where T cell derived TNFα mediated activation of myeloid cells, which drove the production of myeloid derived IL-1 and IL-6(27). However this study did not show that the modulation of cytokines had a phenotypic manifestation on symptoms in the mice, making it difficult to determine if this these cytokine changes were sufficient to prevent CRS symptoms(27). Additionally, while it has been suggested that IFNγ plays an important role in initiating CRS(9), neither CAR T cell studies nor bsTCE studies have directly shown a role of IFNγ in CRS. A murine model of cytokine release syndrome induced by treatment with an anti-CD3 monoclonal antibody (145-2C11) has shown that prophylactic treatment with an IFNγ blocking antibody protected mice against pathological changes. These symptoms correlated with inter-mouse strain differences in the ability of the strain to produce IFNγ(48). Here we show that IFNγ was required for the development of mNKG2D-2C11 bsTCE-induced toxicity. Given that IFNγ is a driving factor in the development of this CRS-like toxicity in mice and the correlation of IFNγ with the severity of clinical CRS(47), it is possible that IFNγ blockade would be effective in inhibiting CRS. Recently the IFNγ blocking antibody Gamifant (emapalumab-lzsg) was approved for the treatment of macrophage activation syndrome (MAS)(51) which shares many of the characteristics associated with severe CRS and CRS-induced MAS. Although inhibition of IFNγ may mitigate toxicity, IFNγ is also a critical factor in mediating the anti-tumor immune response. However, in severe cases that are refractory to other treatment interventions this might be a viable option.
One of the most consistent factors between preclinical models of CRS is the involvement of the myeloid population. This likely represents the ideal breakpoint to intervene in the development of toxicity, either upstream of monocyte/macrophage activation, or through its down-stream mediators. However, depletion of this population may be a suboptimal strategy, as one CAR T cell study using clodronate to mitigate CRS symptoms also showed that the anti-tumor response was reduced by this treatment(52). Clinical data indicate that IL-6 blockade is not universally effective in reversing symptoms and preventing cytokine release–related death(27, 53–55). Cases of CRS that are refractory to both tocilizumab and glucocorticoids support the need to identify additional therapeutic interventions to treat CRS(9, 56).
In summary, this work has investigated systemic immune changes occurring during toxicity induced by the mNKG2D bsTCE. We have found activation of both T cell and myeloid populations, and we show a critical role for T cell derived IFNγ in initiating this toxicity. The lack of impact of IL6R blockade may make this model ideal to identify addition points that could be therapeutically targeted. Together, these findings shed light on the molecular mediators of mNKG2D-2C11 induced toxicity and set the stage to elucidate additional druggable targets for the inhibition of bsTCE induced toxicity.
Supplementary Material
Key Points.
Toxicity induced by a bsTCE was mediated by CD4+, CD8+ T cells and myeloid cells
IFNγ was required for modulation of T cell and myeloid populations and toxicity
Toxicity was reduced by perforin or GM-CSF deficiency and phagocyte depletion
Acknowledgements
We would like to thank DartLab, the immune monitoring and flow cytometry shared resource at the Norris Cotton Cancer Center (NCCC) for assistance with flow cytometry and Luminex assays, and the staff at the Center for Comparative Medicine and Research for assistance with animal care. The authors also thank the National Cancer Institute Biological Resource Branch for recombinant human IL-2.
Financial Support: This work was supported in part by grants from the National Institutes of Health to C.L. Sentman CA164178, C.G. Palmer was supported by GM008704, and T. A. Coupet was supported by AI007363. DartLab at the Norris Cotton Cancer Center is supported in part by NCI Cancer Center Grant 5P30 CA023108-37.
Footnotes
Conflict of Interest: CLS has patents and patent filings on bispecific T cell engager proteins. No potential conflicts of interest were disclosed by the other authors. These conflicts are managed by the policies of Dartmouth College.
Abbreviations: bsTCE, bispecific T cell engager; scFv, single-chain variable fragment; FDA, U.S. Food and Drug Administration; CRS, cytokine release syndrome; R/R, relapsed/refractory; MRD, minimal residual disease; ALL, acute lymphoblastic leukemia; CAR, chimeric antigen receptor; NKG2D, Natural Killer Group 2D; NKG2D-L, NKG2D ligands; hNKG2D-OKT3, human NKG2D receptor fused to anti-human CD3; mNKG2D-2C11, mouse NKG2D receptor fused to anti-mouse CD3; Rae1, Retinoic acid early inducible 1; MULT1, mouse UL16-binding protein-like Transcript 1; H60, histocompatibility antigen 60; B7H6, B7 family homolog 6; MAS, macrophage activation syndrome also known as hemophagocytic lymphohistiocytosis (HLH)
References
- 1.Smyth MJ, Dunn GP, and Schreiber RD. 2006. Cancer Immunosurveillance and Immunoediting: The Roles of Immunity in Suppressing Tumor Development and Shaping Tumor Immunogenicity. Adv. Immunol 90: 1–50. [DOI] [PubMed] [Google Scholar]
- 2.Maher J, and Davies ET. 2004. Targeting cytotoxic T lymphocytes for cancer immunotherapy. Br. J. Cancer 91: 817–821. [DOI] [PMC free article] [PubMed] [Google Scholar]
- 3.Brinkmann U, and Kontermann RE. 2017. The making of bispecific antibodies. MAbs 9: 182–212. [DOI] [PMC free article] [PubMed] [Google Scholar]
- 4.Wolf E, Hofmeister R, Kufer P, Schlereth B, and Baeuerle PA. 2005. BiTEs: Bispecific antibody constructs with unique anti-tumor activity. Drug Discov. Today 10: 1237–1244. [DOI] [PubMed] [Google Scholar]
- 5.Labrijn AF, Janmaat ML, Reichert JM, and Parren PWHI. 2019. Bispecific antibodies: a mechanistic review of the pipeline. Nat. Rev. Drug Discov 18: 585–608. [DOI] [PubMed] [Google Scholar]
- 6.Stein A, Franklin JL, Chia VM, Arrindell D, Kormany W, Wright J, Parson M, Amouzadeh HR, Choudhry J, and Joseph G. 2019. Benefit–Risk Assessment of Blinatumomab in the Treatment of Relapsed/Refractory B-Cell Precursor Acute Lymphoblastic Leukemia. Drug Saf. 42: 587–601. [DOI] [PMC free article] [PubMed] [Google Scholar]
- 7.Jain T, and Litzow MR. 2018. No free rides: management of toxicities of novel immunotherapies in ALL, including financial. Blood Adv. 2: 3393–3403. [DOI] [PMC free article] [PubMed] [Google Scholar]
- 8.Teachey DT, Rheingold SR, Maude SL, Zugmaier G, Barrett DM, Seif AE, Nichols KE, Suppa EK, Kalos M, Berg RA, Fitzgerald JC, Aplenc R, Gore L, and Grupp SA. 2013. Cytokine release syndrome after blinatumomab treatment related to abnormal macrophage activation and ameliorated with cytokine-directed therapy. Blood 121: 5154–5157. [DOI] [PMC free article] [PubMed] [Google Scholar]
- 9.Shimabukuro-Vornhagen A, Gödel P, Subklewe M, Stemmler HJ, Schlößer HA, Schlaak M, Kochanek M, Böll B, and von Bergwelt-Baildon MS. 2018. Cytokine release syndrome. J. Immunother. Cancer 6. [DOI] [PMC free article] [PubMed] [Google Scholar]
- 10.BLINCYTO® (blinatumomab) prescribing information, Amgen.
- 11.Zhu M, Kratzer A, Johnson J, Holland C, Brandl C, Singh I, Wolf A, and Doshi S. 2018. Blinatumomab Pharmacodynamics and Exposure–Response Relationships in Relapsed/Refractory Acute Lymphoblastic Leukemia. J. Clin. Pharmacol 58: 168–179. [DOI] [PubMed] [Google Scholar]
- 12.Zhu M, Wu B, Brandl C, Johnson J, Wolf A, Chow A, and Doshi S. 2016. Blinatumomab, a Bispecific T-cell Engager (BiTE®) for CD-19 Targeted Cancer Immunotherapy: Clinical Pharmacology and Its Implications. Clin. Pharmacokinet 55: 1271–1288. [DOI] [PubMed] [Google Scholar]
- 13.Davila ML, Riviere I, Wang X, Bartido S, Park J, Curran K, Chung SS, Stefanski J, Borquez-Ojeda O, Olszewska M, Qu J, Wasielewska T, He Q, Fink M, Shinglot H, Youssif M, Satter M, Wang Y, Hosey J, Quintanilla H, Halton E, Bernal Y, Bouhassira DCG, Arcila ME, Gonen M, Roboz GJ, Maslak P, Douer D, Frattini MG, Giralt S, Sadelain M, and Brentjens R. 2014. Efficacy and toxicity management of 19–28z CAR T cell therapy in B cell acute lymphoblastic leukemia. Sci. Transl. Med 6: 224ra25. [DOI] [PMC free article] [PubMed] [Google Scholar]
- 14.Teachey DT, Lacey SF, Shaw PA, Melenhorst JJ, Maude SL, Frey N, Pequignot E, Gonzalez VE, Chen F, Finklestein J, Barrett DM, Weiss SL, Fitzgerald JC, Berg RA, Aplenc R, Callahan C, Rheingold SR, Zheng Z, Rose-John S, White JC, Nazimuddin F, Wertheim G, Levine BL, June CH, Porter DL, and Grupp SA. 2016. Identification of predictive biomarkers for cytokine release syndrome after chimeric antigen receptor T-cell therapy for acute lymphoblastic leukemia. Cancer Discov. 6: 664–679. [DOI] [PMC free article] [PubMed] [Google Scholar]
- 15.Hay KA, Hanafi LA, Li D, Gust J, Liles WC, Wurfel MM, López JA, Chen J, Chung D, Harju-Baker S, Cherian S, Chen X, Riddell SR, Maloney DG, and Turtle CJ. 2017. Kinetics and biomarkers of severe cytokine release syndrome after CD19 chimeric antigen receptor–modified T-cell therapy. Blood 130: 2295–2306. [DOI] [PMC free article] [PubMed] [Google Scholar]
- 16.Giavridis T, Van Der Stegen SJC, Eyquem J, Hamieh M, Piersigilli A, and Sadelain M. 2018. CAR T cell-induced cytokine release syndrome is mediated by macrophages and abated by IL-1 blockade letter. Nat. Med 24: 731–738. [DOI] [PMC free article] [PubMed] [Google Scholar]
- 17.Garcia Borrega J, Gödel P, Rüger MA, Onur Ö, Shimabukuro-Vornhagen A, Kochanek M, and Böll B. 2019. In the Eye of the Storm: Immune-mediated Toxicities Associated With CAR-T Cell Therapy. HemaSphere 3: e191. [DOI] [PMC free article] [PubMed] [Google Scholar]
- 18.Le RQ, Li L, Yuan W, Shord SS, Nie L, Habtemariam BA, Przepiorka D, Farrell AT, and Pazdur R. 2018. FDA Approval Summary: Tocilizumab for Treatment of Chimeric Antigen Receptor T Cell-Induced Severe or Life-Threatening Cytokine Release Syndrome. Oncologist 23: 943–947. [DOI] [PMC free article] [PubMed] [Google Scholar]
- 19.Choudhry J, Parson M, and Wright J. 2018. A Retrospective Review of Tocilizumab for the Management of Blinatumomab (a Bispecific T Cell Engager)-Induced Cytokine Release Syndrome (CRS). Blood 132: 5211–5211. [Google Scholar]
- 20.Godbersen C, Coupet TA, Huehls AM, Zhang T, Battles MB, Fisher JL, Ernstoff MS, and Sentman CL. 2017. NKG2D Ligand–Targeted Bispecific T-Cell Engagers Lead to Robust Antitumor Activity against Diverse Human Tumors. Mol. Cancer Ther 16: 1335–1346. [DOI] [PMC free article] [PubMed] [Google Scholar]
- 21.Zhang T, and Sentman CL. 2011. Cancer immunotherapy using a bispecific NK receptor fusion protein that engages both T cells and tumor cells. Cancer Res. 71: 2066–2076. [DOI] [PMC free article] [PubMed] [Google Scholar]
- 22.Spear P, Wu MR, Sentman ML, and Sentman CL. 2013. Nkg2d ligands as therapeutic targets. Cancer Immun. 13: 1–14. [PMC free article] [PubMed] [Google Scholar]
- 23.Zhang T, and Sentman CL. 2011. Cancer immunotherapy using a bispecific NK receptor fusion protein that engages both T cells and tumor cells. Cancer Res. 71: 2066–2076. [DOI] [PMC free article] [PubMed] [Google Scholar]
- 24.Wu M-R, Zhang T, Gacerez AT, Coupet TA, DeMars LR, and Sentman CL. 2015. B7H6-Specific Bispecific T Cell Engagers Lead to Tumor Elimination and Host Antitumor Immunity. J. Immunol 194: 5305–5311. [DOI] [PMC free article] [PubMed] [Google Scholar]
- 25.Vilarinho S, Ogasawara K, Nishimura S, Lanier LL, and Baron JL. 2007. Blockade of NKG2D on NKT cells prevents hepatitis and the acute immune response to hepatitis B virus. Proc. Natl. Acad. Sci. U. S. A 104: 18187–18192. [DOI] [PMC free article] [PubMed] [Google Scholar]
- 26.Nausch N, and Cerwenka A. 2008. NKG2D ligands in tumor immunity. Oncogene 27: 5944–5958. [DOI] [PubMed] [Google Scholar]
- 27.Li J, Piskol R, Ybarra R, Chen YJJ, Li J, Slaga D, Hristopoulos M, Clark R, Modrusan Z, Totpal K, Junttila MR, and Junttila TT. 2019. CD3 bispecific antibody-induced cytokine release is dispensable for cytotoxic T cell activity. Sci. Transl. Med 11: eaax8861. [DOI] [PubMed] [Google Scholar]
- 28.Norelli M, Camisa B, Barbiera G, Falcone L, Purevdorj A, Genua M, Sanvito F, Ponzoni M, Doglioni C, Cristofori P, Traversari C, Bordignon C, Ciceri F, Ostuni R, Bonini C, Casucci M, and Bondanza A. 2018. Monocyte-derived IL-1 and IL-6 are differentially required for cytokine-release syndrome and neurotoxicity due to CAR T cells. Nat. Med 24: 739–748. [DOI] [PubMed] [Google Scholar]
- 29.Sentman M-L, Murad JM, Cook WJ, Wu M-R, Reder J, Baumeister SH, Dranoff G, Fanger MW, and Sentman CL. 2016. Mechanisms of Acute Toxicity in NKG2D Chimeric Antigen Receptor T Cell–Treated Mice. J. Immunol 197: 4674–4685. [DOI] [PMC free article] [PubMed] [Google Scholar]
- 30.Sterner RM, Sakemura R, Cox MJ, Yang N, Khadka RH, Forsman CL, Hansen MJ, Jin F, Ayasoufi K, Hefazi M, Schick KJ, Walters DK, Ahmed O, Chappell D, Sahmoud T, Durrant C, Nevala WK, Patnaik MM, Pease LR, Hedin KE, Kay NE, Johnson AJ, and Kenderian SS. 2018. GM-CSF inhibition reduces cytokine release syndrome and neuroinflammation but enhances CAR-T cell function in xenografts. Blood 133: 697–709. [DOI] [PMC free article] [PubMed] [Google Scholar]
- 31.Spear P, Wu MR, Sentman ML, and Sentman CL. 2013. Nkg2d ligands as therapeutic targets. Cancer Immun. 13: 8. [PMC free article] [PubMed] [Google Scholar]
- 32.Hamerman JA, Ogasawara K, and Lanier LL. 2004. Cutting Edge: Toll-Like Receptor Signaling in Macrophages Induces Ligands for the NKG2D Receptor. J. Immunol 172: 2001–2005. [DOI] [PubMed] [Google Scholar]
- 33.Nedvetzki S, Sowinski S, Eagle RA, Harris J, Vély F, Pende D, Trowsdale J, Vivier E, Gordon S, and Davis DM. 2007. Reciprocal regulation of human natural killer cells and macrophages associated with distinct immune synapses. Blood 109: 3776–3785. [DOI] [PubMed] [Google Scholar]
- 34.Sirén J, Sareneva T, Pirhonen J, Strengell M, Veckman V, Julkunen I, and Matikainen S. 2004. Cytokine and contact-dependent activation of natural killer cells by influenza A or Sendai virus-infected macrophages. J. Gen. Virol 85: 2357–2364. [DOI] [PubMed] [Google Scholar]
- 35.Molinero LL, F. M R. G F. L Z. N 2002. Activation-induced expression of MICA on T lymphocytes involves engagement of CD3 and CD28. J Leukoc Biol 71: 791–797. [PubMed] [Google Scholar]
- 36.Diefenbach A, J. A L. S S. N R. D 2000. Ligands for the murine NKG2D receptor: expression by tumor cells and activation of NK cells and macrophages. Nat Immunol 1: 119–126. [DOI] [PubMed] [Google Scholar]
- 37.Rabinovich BA, Li J, Shannon J, Hurren R, Chalupny J, Cosman D, and Miller RG. 2003. Activated, But Not Resting, T Cells Can Be Recognized and Killed by Syngeneic NK Cells. J. Immunol 170: 3572–3576. [DOI] [PubMed] [Google Scholar]
- 38.Cerboni C, Z. A C. M P. M F. L S. A 2007. Antigen-activated human T lymphocytes express cell-surface NKG2D ligands via an ATM/ATR-dependent mechanism and become susceptible to autologous NK-cell lysis. Blood 110: 606–615. [DOI] [PubMed] [Google Scholar]
- 39.Ward J, Bonaparte M, Sacks J, Guterman J, Fogli M, Mavilio D, and Barker E. 2007. HIV modulates the expression of ligands important in triggering natural killer cell cytotoxic responses on infected primary T-cell blasts. Blood 110: 1207–1214. [DOI] [PMC free article] [PubMed] [Google Scholar]
- 40.Chen X, Kamperschroer C, Wong G, and Xuan D. 2019. A Modeling Framework to Characterize Cytokine Release upon T-Cell–Engaging Bispecific Antibody Treatment: Methodology and Opportunities. Clin. Transl. Sci 12: 600–608. [DOI] [PMC free article] [PubMed] [Google Scholar]
- 41.Lee KJ, Chow V, Weissman A, Tulpule S, Aldoss I, and Akhtari M. 2016. Clinical use of blinatumomab for B-cell acute lymphoblastic leukemia in adults. Ther. Clin. Risk Manag Volume 12: 1301–1310. [DOI] [PMC free article] [PubMed] [Google Scholar]
- 42.Amann M, Friedrich M, Lutterbuese P, Vieser E, Lorenczewski G, Petersen L, Brischwein K, Kufer P, Kischel R, Baeuerle PA, and Schlereth B. 2009. Therapeutic window of an EpCAM/CD3-specific BiTE antibody in mice is determined by a subpopulation of EpCAM-expressing lymphocytes that is absent in humans. Cancer Immunol. Immunother 58: 95–109. [DOI] [PMC free article] [PubMed] [Google Scholar]
- 43.Sentman M-L, Murad JM, Cook WJ, Wu M-R, Reder J, Baumeister SH, Dranoff G, Fanger MW, and Sentman CL. 2016. Mechanisms of Acute Toxicity in NKG2D Chimeric Antigen Receptor T Cell-Treated Mice. J. Immunol 197: 4674–4685. [DOI] [PMC free article] [PubMed] [Google Scholar]
- 44.Kinter AL, Godbout EJ, McNally JP, Sereti I, Roby GA, O’Shea MA, and Fauci AS. 2008. The Common γ-Chain Cytokines IL-2, IL-7, IL-15, and IL-21 Induce the Expression of Programmed Death-1 and Its Ligands. J. Immunol 181: 6738–6746. [DOI] [PubMed] [Google Scholar]
- 45.Bui JD, C. L L. L Y. W S. R 2006. IFN-dependent down-regulation of the NKG2D ligand H60 on tumors. J Immunol 176: 905–913. [DOI] [PubMed] [Google Scholar]
- 46.Serrano AE, Menares-Castillo E, Garrido-Tapia M, Ribeiro CH, Hernández CJ, Mendoza-Naranjo A, Gatica-Andrades M, Valenzuela-Diaz R, Z̃iga R, López MN, Salazar-Onfray F, Aguillón JC, and Molina MC. 2011. Interleukin 10 decreases MICA expression on melanoma cell surface. Immunol. Cell Biol 89: 447–457. [DOI] [PubMed] [Google Scholar]
- 47.Teachey DT, Lacey SF, Shaw PA, Melenhorst JJ, Maude SL, Frey N, Pequignot E, Gonzalez VE, Chen F, Finklestein J, Barrett DM, Weiss SL, Fitzgerald JC, Berg RA, Aplenc R, Callahan C, Rheingold SR, Zheng Z, Rose-John S, White JC, Nazimuddin F, Wertheim G, Levine BL, June CH, Porter DL, and Grupp SA. 2016. Identification of Predictive Biomarkers for Cytokine Release Syndrome after Chimeric Antigen Receptor T-cell Therapy for Acute Lymphoblastic Leukemia. Cancer Discov. 6: 664–679. [DOI] [PMC free article] [PubMed] [Google Scholar]
- 48.Matthys P, Dillen C, Proost P, Heremans H, And JVD, and Billiau A. 1993. Modification of the anti-CD3-induced cytokine release syndrome by anti interferon-γ or anti-interleukin-6 antibody treatment: Protective effects and biphasic changes in blood cytokine levels. Eur. J. Immunol 23: 2209–2216. [DOI] [PubMed] [Google Scholar]
- 49.Suntharalingam G, Perry MR, Ward S, Brett SJ, Castello-Cortes A, Brunner MD, and Panoskaltsis N. 2006. Cytokine storm in a phase 1 trial of the anti-CD28 monoclonal antibody TGN1412. N. Engl. J. Med 355: 1018–1028. [DOI] [PubMed] [Google Scholar]
- 50.Giavridis T, Van Der Stegen SJC, Eyquem J, Hamieh M, Piersigilli A, and Sadelain M. 2018. CAR T cell-induced cytokine release syndrome is mediated by macrophages and abated by IL-1 blockade letter. Nat. Med 24: 731–738. [DOI] [PMC free article] [PubMed] [Google Scholar]
- 51.2018. FDA approves first treatment specifically for patients with rare and life-threatening type of immune disease. Case Med. Res [Google Scholar]
- 52.Norelli M, Camisa B, Barbiera G, Falcone L, Purevdorj A, Genua M, Sanvito F, Ponzoni M, Doglioni C, Cristofori P, Traversari C, Bordignon C, Ciceri F, Ostuni R, Bonini C, Casucci M, and Bondanza A. 2018. Monocyte-derived IL-1 and IL-6 are differentially required for cytokine-release syndrome and neurotoxicity due to CAR T cells. Nat. Med 24: 739–748. [DOI] [PubMed] [Google Scholar]
- 53.Teachey DT, Lacey SF, Shaw PA, Melenhorst JJ, Maude SL, Frey N, Pequignot E, Gonzalez VE, Chen F, Finklestein J, Barrett DM, Weiss SL, Fitzgerald JC, Berg RA, Aplenc R, Callahan C, Rheingold SR, Zheng Z, Rose-John S, White JC, Nazimuddin F, Wertheim G, Levine BL, June CH, Porter DL, and Grupp SA. 2016. Identification of predictive biomarkers for cytokine release syndrome after chimeric antigen receptor T-cell therapy for acute lymphoblastic leukemia. Cancer Discov. 6: 664–679. [DOI] [PMC free article] [PubMed] [Google Scholar]
- 54.Hay KA, Hanafi LA, Li D, Gust J, Liles WC, Wurfel MM, López JA, Chen J, Chung D, Harju-Baker S, Cherian S, Chen X, Riddell SR, Maloney DG, and Turtle CJ. 2017. Kinetics and biomarkers of severe cytokine release syndrome after CD19 chimeric antigen receptor–modified T-cell therapy. Blood 130: 2295–2306. [DOI] [PMC free article] [PubMed] [Google Scholar]
- 55.Le RQ, Li L, Yuan W, Shord SS, Nie L, Habtemariam BA, Przepiorka D, Farrell AT, and Pazdur R. 2018. FDA Approval Summary: Tocilizumab for Treatment of Chimeric Antigen Receptor T Cell Induced Severe or Life-Threatening Cytokine Release Syndrome. Oncologist 23: 943–947. [DOI] [PMC free article] [PubMed] [Google Scholar]
- 56.Turtle C 2016. CD19 CAR-T cells of defined CD4+:CD8+ composition in adult B cell ALL patients. J. Clin. Invest 126: 2123–2138. [DOI] [PMC free article] [PubMed] [Google Scholar]
Associated Data
This section collects any data citations, data availability statements, or supplementary materials included in this article.