

Abstract
Behavioral synchronization has been found to facilitate social bonding and prosociality but the neural mechanisms underlying such effects are not well understood. In the current study, 60 dyads were hyperscanned using functional near-infrared spectroscopy while they performed either a synchronous key-pressing task or a control task. After the task, they were asked to perform the dictator game to assess their prosocial behavior. We also measured three potential mediating variables: self–other overlap, perceived similarity and interpersonal neural synchronization. Results showed that dyads in the synchronization group were higher in behavioral synchronization, interpersonal neural synchronization (INS) at the right dorsolateral prefrontal cortex, self–other overlap, perceived similarity and prosociality than those in the control group. INS was significantly associated with prosocial behaviors and self–other overlap. After testing four meditation models, we found that self–other overlap and INS played a serial mediation role in the effect of behavioral synchronization on prosociality. These results contribute to our understanding of the neural and cognitive mechanisms underlying the effect of behavioral synchronization on prosocial behavior.
Keywords: interpersonal neural synchronization, prosociality, self–other overlap, functional near-infrared spectroscopy
Introduction
Behavioral synchronization refers to instances when the movements of two or more people overlap in time (Bernieri et al., 1988). Across cultures, people engage in activities that lead individuals to act in synchrony with one another, ranging from soldiers marching in step to rave dancers moving to the same beat and to people performing collective rituals (Hagen and Bryant, 2003; Wiltermuth and Heath, 2009; Baimel et al., 2018). The idea that behavioral synchronization fosters social bonds among unrelated individuals has old roots (Ehrenreich, 2015). Empirical research evidence has also supported this hypothesis: behavioral synchronization could facilitate rapport (Lang et al., 2016), entitativity (Reddish et al., 2013), social connectedness (Lumsden et al., 2014), positive affect (Tschacher et al., 2014) and prosocial behavior (Valdesolo and DeSteno, 2011). Interestingly, a recent meta-analysis found that the strongest effect of synchronization was on prosocial behaviors (Mogan et al., 2017). Notwithstanding the rich empirical evidence linking behavioral synchronization with greater prosociality, few studies have systematically explored neural and cognitive mechanisms underlying this effect.
There are at least two potential cognitive mechanisms: self-other overlap and perceived similarity. The self–other overlap mechanism is based on the common neural encodings that integrate the perception and action systems (Gallese et al., 2011). When behaviors are synchronized across individuals, the perceptions of self-generated and other-generated behaviors are blended together by these common neural encoding (Paladino et al., 2010), leading to difficulty in making self–other distinctions (Rennung and Goeritz, 2016). Consequently, interpersonal synchronization can lead to the merging of the self and the other, such as blending the positive thoughts of the self into the thoughts of the other (Semin and Smith, 2008). Taken one step further, this overlap can explain synchronization’s effect on prosocial behavior because the tendency to favor the self in the distribution of resources now extends to the other (Aron et al., 1991; Rennung and Goeritz, 2016). On the other hand, the perceived similarity hypothesis proposes that behavioral synchronization increases perceived similarity among interacting individuals. Valdesolo and DeSteno (2011) argued that perceived similarity is a potential mediator of the effect of behavioral synchronization on prosociality. Indeed, people are more willing to help others who are similar to themselves (Fessler and Holbrook, 2014; Lumsden et al., 2014). Although there is evidence supporting both the self–other overlap hypothesis and the perceived similarity hypothesis, no study has tested them within the same study and examined their neural mechanisms.
Back in 2009, Hove and Risen (2009) already proposed that not only behavioral synchrony but also synchrony at the neural level would elicit prosocial behavior. Neural synchrony or interpersonal neural synchronization (INS) has been studied through ‘hyperscanning’ (i.e. measuring the INS of two interacting brains) by using fMRI, electroencephalography (EEG) or functional near-infrared spectroscopy (fNIRS) (Montague et al., 2002). Of the three techniques, fNIRS hyperscanning has the advantages of being more portable and tolerant of movement artifacts (Boas et al., 2014; Yücel et al., 2017). In previous fNIRS hyperscanning studies, increased INS was observed among interacting dyads when they were performing behavioral synchronization tasks, such as key pressing (Funane et al., 2011; Cui et al., 2012; Cheng et al., 2015; Reindl et al., 2018), singing/humming (Osaka et al., 2014, 2015) or time counting (Hu et al., 2017). Furthermore, INS was positively associated with behavioral performance and has been regarded as a neural marker of efficient interpersonal interaction processes (Cui et al., 2012; Cheng et al., 2015; Baker et al., 2016; Dikker et al., 2017; Hu et al., 2017; Lu et al., 2018; Reindl et al., 2018). Most relevant to the current study, Hu et al. (2017) recently found that INS during a simultaneous time counting task predicted subsequent prosocial inclination (measured with a hypothetical scenario) and mediated the effect of behavioral synchronization on prosociality. Thus, we expected that INS may serve as a neural mechanism, together with the cognitive mechanisms (self–other overlap and/or perceived similarity), underlying the effect of behavioral synchronization on prosociality.
As for the specific brain areas of interest to this study, previous studies have clearly implicated the prefrontal cortex (PFC) in synchronous interactions (Funane et al., 2011; Cui et al., 2012; Cheng et al., 2015; Hu et al., 2017; Reindl et al., 2018). In a recent review of fNIRS hyperscanning studies, Gvirts and Perlmutter (2019) proposed that the mutual social attention system (e.g. middle frontal cortex, right dorsolateral PFC and frontopolar cortex) plays a crucial role in neural and behavioral synchronization and its prosocial outcomes (Hu et al., 2017; Reindl et al., 2018; Gvirts and Perlmutter, 2019). Moreover, imaging studies have shown that both self–other overlap and perceived similarity are associated with PFC activation (Mitchell et al., 2006; Zaki and Ochsner, 2011; Majdandžić et al., 2016; Wittmann et al., 2016). Specifically, Wittmann et al. (2016) localized the confusion between one’s own performance with that of others (i.e. self–other processing) to Brodmann area (BA) 9 in the PFC. Mitchell et al. (2006) found that the medial PFC was involved in perceiving similarities between oneself and others (Mitchell et al., 2006). Thus, this study focused on the PFC to investigate whether INS mediated the effect of behavioral synchronization on prosociality.
Taken together the two cognitive mechanisms and INS, this study tested four rival models (see Figure 1). Specifically, we hypothesized that self–other overlap (Path model 1) or perceived similarity (Path model 2) might be the mechanism mediating the effect of synchronized behavior on INS and consequently on prosociality (i.e. social cognition driving INS). Alternatively, INS (Path models 3 and 4) may be the mechanism mediating the prosocial effect of synchronized behavior at the neural level (i.e. INS driving social cognition). These models are based on Gvirts and Perlmutter’s (2019) proposal that INS can be an epiphenomenon or a mechanism of social connectedness (indexed by either self–other overlap or perceived similarity in this study). In this study, behavioral synchronization was manipulated with a key-pressing task (Cui et al., 2012). Brain activities were recorded using fNIRS hyperscanning. Prosocial behavior was assessed using the dictator game (DG). Self–other overlap and perceived similarity were based on self-report measures. Given that behavioral synchronization was previously found to enhance positive emotions (Tschacher et al., 2014), we also measured participants’ feelings towards the partner (liking the partner and finding the interactions with the partner to be pleasant) as a potential confounding factor.
Fig. 1.

Path models of four hypothesized mechanisms.
Methods
Participants
We recruited 120 healthy young adults from Zhejiang Normal University (92 females, mean age = 20.60 years, s.d. = 1.51, range 18–26) to participate in the study. All participants were right-handed according to the Edinburgh Handedness Questionnaire (Oldfield, 1971), with normal or corrected-to-normal vision. Every participant provided written informed consent. The ethics committee of the Department of Psychology, Zhejiang Normal University approved this experiment.
Experimental tasks and procedures
In this study, we used the between-subjects design (synchronization vs control) because our measure of prosocial behavior came from the (single-shot) DG, whose repeated use has been found to yield different results (Cooper and Dutcher, 2011; Achtziger et al., 2015).
After determining that they were not familiar with each other, dyads of participants were randomly assigned to either the synchronization or control group, forming 30 same-gender dyads for each group. Each dyad was then brought into a quiet room and briefly introduced to each other. The two participants were then seated at a table across from each other, each with his/her own computer monitor and keyboard. A white board was put between the two monitors to further separate the two participants to prevent them from seeing each other. They were also specifically instructed not to have any direct communication verbally, visually or tactilely (Figure 2A).
Fig. 2.

Experimental design. (A) Experimental setup. (B) fNIRS data acquisition. Optode probe configuration. Red dots indicate emitters, blue dots indicate detectors. The numbers indicate measurement channels between emitters and detectors. (C) Experimental tasks and procedures. Stimulus sequence in a trial.
Our experiment was divided into three steps: (i) participants were asked to complete a demographic questionnaire and to rate the level of liking of their partner based on their first impressions. (ii) Participants were asked to perform either a synchronization or a control task. To achieve behavioral synchronization, we adopted a key-pressing task based on previous studies (Cui et al., 2012; Cheng et al., 2015; Baker et al., 2016; Pan et al., 2017; Reindl et al., 2018; Miller et al., 2019). And (iii) each member of the dyad was asked to perform the DG and to rate self–other overlap, perceived similarities, and pleasantness and liking (post-test) of their partner. Tasks and measures are described below.
Synchronization task
The synchronization task included three 30 s resting-state sessions and two task blocks in the following order: Rest 1 (30 s), Task Block 1 (150 s), Rest 2 (30 s), Task Block 2 (150 s) and Rest 3 (30 s). During the resting-state sessions, participants were asked to relax their mind and keep as motionless as possible. The resting-state session between the two task sessions served as the baseline. Each task block had 20 trials, each starting with a hollow gray circle that remained on the screen for a random interval of 0.6–1.5 s. Then, the gray circle was filled with green color, which serves as the ‘Go’ signal for the participants in each dyad to press a key using their right index or middle finger. Participants were told that their response time would be measured (the time difference between the presentation of the ‘Go’ signal and the key press) and that if the difference between their response times was small, the dyad would earn one point together; otherwise they would lose one point. Participants were not told the threshold for a ‘small’ difference, which was calculated as 1/4 of the averaged response time of the two participants for a given trial, following the procedure used in Cui et al. (2012). After participants pressed the keys, a feedback screen was displayed for 4 s, showing the result of the current trial (‘Won!’ or ‘Lost!’) as well as the cumulative points earned from the task. The feedback screen also indicated whether the participant responded faster (green ‘+’ in the lower right corner of the screen) or slower (white ‘−’ in the lower left corner of the screen) than the partner. Participants could adjust their speed of key pressing on the subsequent trials to reduce the difference in response times and hence to increase synchronization with each other and earn more points. The participants were told that their goal was to earn as many points as possible. After the feedback, a blank screen was shown for 2 s, followed by the next trial (Figure 2C). During the task, participants were supposed to look at the screen all the time.
Control task
The procedure of the control task was the same as that of the synchronization task except for the following: participants were instructed to perform the key-pressing task independent of each other and they did not receive feedback regarding whether they were faster or slower than their partner, and their performance did not impact whether their partner gained or lost points (Figure 2C).
Prosocial behavior
A modified version of the DG (Forsythe et al., 1994) was used to measure prosocial behavior. In the original paradigm, player 1 dictates how to divide a $5 pie and player 2 does not have the opportunity to reject this division (each player is either a sender or a receiver). For this study we followed the procedure used by Huang et al. (2017), who changed the paradigm to make each participant in a dyad be the dictator in order to assess the mutual prosocial behaviors in social interactions as examined in this study. Participants were told, ‘With the end of the experiment, you have been granted 10 RMB (in addition to your 15 RMB base pay for taking part in this study). Now you need to make a decision to allocate this 10 RMB between your partner and yourself. How much of the 10 RMB will you give to your partner, and how much will you keep for yourself? It is totally up to you; you can give some, all, or none of the 10 RMB to your partner. Your partner will then receive the amount you give to him/her. The payments will be made after the experiment is finished. Your partner will not know the amount of money you give until then. How much do you decide to give to your partner?’ Participants were asked to choose a number between 0 and 10. Prosocial behavior was calculated at the dyad level, namely, the average of the amounts of money earned by the two participants.
Questionnaire measures
The following data were collected before the synchronization or control task.
Demographic questionnaire
Participants were asked to complete a brief demographic questionnaire (gender, age, year in school and major).
Liking of the partner (pre-test)
Participants were asked how much they liked the partner based on their first impression (1 = ‘not very much’ to 7 = ‘very much’).
The following measures were administered after the synchronization or control task and the DG.
Self–other overlap
We used the Inclusion of the Other in the Self scale (Aron et al., 1992) to assess the level of Self–Other overlap. Participants were asked to read the following instructions: ‘Below are seven pictures that depict possible ways of viewing the relationship between two people. Please circle the one of these seven pictures that best indicates the extent to which you feel that you and the partner connected’. These instructions were followed by seven pictures, photocopied from Aron et al. (1992), in which two circles, one representing Self and one representing Other, were in different degrees of overlap, ranging from circles touching but not overlapping at all to circles almost completely overlapping.
Perceived similarity
To measure each participant’s perceived similarity with his/her partner, we used a three-item perception questionnaire by Baston (Batson et al., 2005), Cronbach’s α = 0.83 in this study. These items were rated on a 9-point Likert-type scale (1 = ‘not at all’ to 9 = ‘extremely’): (i) ‘How similar to you did you perceive the partner?’ (ii) ‘To what extent did you perceive yourself and the partner to be part of the same group?’ (iii) ‘To what extent would you use the term “we” to describe yourself and the partner?’
Liking of the partner and pleasantness of the interactions (post-test)
Participants were asked how much they liked their partner and how pleasant they felt during the tasks. Participants used a 7-point Likert scale, ranging from 1 = ‘not very much to 7 = “very much” ’.
For each subjective measurement, we averaged the two participants’ scores in a dyad to create a dyad-level variable for analysis.
fNIRS data collection
The fNIRS recordings were collected from each dyad simultaneously during the tasks by using ETG-4000 optical topography system (Hitachi Medical Corporation, Japan). The absorption of near-infrared light at two wavelengths (695 and 830 nm) was measured at a sampling rate of 10 Hz. The optical system measured changes in the concentration of oxygenated hemoglobin (oxy-Hb) and deoxygenated hemoglobin (deoxy-Hb) based on the modified Beer–Lambert law (Pellicer and Bravo, 2011). This experiment focused only on changes in the oxy-Hb concentration, which was demonstrated to be the most sensitive indicator of changes in regional cerebral blood flow in fNIRS measurements (Hoshi, 2007). According to a previous study, we chose a single 3 × 5 probe patch to cover each participant’s PFC, which is suggested to be involved in social interaction (see Introduction and Cui et al., 2012; Hu et al., 2017). Each patch had 8 emitters and 7 detectors, resulting in 22 measurement channels. The emitter and detector were separated at 30 mm for contiguous optodes. The placement of the patch followed the International 10–20 system. The lowest probe row of the patch was placed on the eyebrows to ensure adequate coverage of the forehead. The middle probe column of patch was aligned to the midline (Figure 2B).
To obtain anatomical brain information, we recorded the optode and channel positions on the scalp of participants using a 3D magnetic digitizer before the task. The spatial location was analyzed using NIRS_SPM, a probabilistic registration tool (Singh et al., 2005).
Data analysis
fNIRS data analysis
For each dyad, we performed data preprocessing using Hemodynamic Response Function low-pass filtering and discrete cosine transform (DCT) implemented in NIRS_SPM (Reindl et al., 2018; Xue et al., 2018). Specifically, the low-pass filter was used to correct temporal autocorrelation in NIRS data (Friston et al., 2002) and the high-pass filter based on a DCT was used to remove an unknown global trends due to breathing, cardiac, vasomotion or other experimental errors (Penny et al., 2011). In addition, we deleted the data of the first and last resting periods (30 s each) to ensure stability.
Wavelet transform coherence (WTC) package was used to analyze HbO time series together and to estimate the INS of a dyad in the time frequency space (Grinsted et al., 2004). For example, two series of HbO were obtained from a specific dyad, one from CH1 of one participant and the other from CH23 of the other participant. Next, we used WTC to find regions in the time frequency space where the two time series co-varied. In accordance with previous fNIRS hyperscanning studies that used this paradigm (Cui et al., 2012; Cheng et al., 2015), we were interested in INS values ranging from 3.2 to 12.8 s (corresponding to frequencies of 0.3 Hz and 0.08 Hz, respectively; Figure 4A). This frequency band corresponded to the duration of a trial in the tasks. We calculated the average coherence value in the frequency band during the baseline stage (the resting session between the two task blocks) and during the two task blocks and converted them into Fisher z-values (Chang and Glover, 2010). The ‘coherence increase’ was defined as the average coherence value in the two task blocks minus that at baseline (Cui et al., 2012; Pan et al., 2017). We then conducted one-sample t-test for the coherence increase value in a dyad for each channel. We used false discovery rate (FDR) to correct for multiple comparisons. Finally, the coherence increase values were visualized using the xjview toolbox (http://www.alivelearn.net/xjview/) and the BrainNet Viewer toolbox (https://www.nitrc.org/projects/bnv/) (Xia et al., 2013). Specifically, the nirs2img function in the xjview toolbox was used to convert the t values of 22 channels (along with the corresponding Montreal Neurological Institute coordinates) into an image file (t-test map), which was then visualized using BrainNet Viewer.
Fig. 4.

fNIRS results. (A) The INS as indicated by WTC. The red border represents the frequency band of interest (3.2 s—12.8 s). The color bar denotes the value of WTC (1 = highest coherence, 0 = lowest coherence). (B) Group differences in INS at CH13. Error bars indicate standard errors. **P < 0.01. (C) The one-sample t-test maps of INS for the synchronization group and the control group, respectively. Significant INS at CH13 (DLPFC = dorsolateral PFC) after FDR correction was found only in the synchronization group.
Behavioral synchronization analysis
As mentioned in Experimental Design, behavioral synchronization was coded for each trial (1 = yes, if the difference in response time between the two partners of each dyad was smaller than ¼ of their averaged response time; otherwise 0 = no synchronization). The behavioral synchronization score was the average score of the two blocks.
Serial mediation analysis
We used the software Amos 21.0 to evaluate the mediating paths and fit the proposed models. The assessment of path models was based on the fit indexes of the Chi-square (χ2) test, the root mean square error of approximation (RMSEA), the comparative fit index (CFI), normed fit index (NFI), the Tucker-Lewis (TLI) and incremental fit index (IFI). A Model is deemed to be acceptable when the fit indices met the following criteria: χ2/df < 3, RMSEA < 0.05, CFI > 0.90, NFI > 0.90, TLI and IFI > 0.90 (Mackinnon, 2012; Jiang et al., 2017). We used the Bayesian information criterion (BIC) to directly compare the two rival non-nested models (Vrieze, 2012; Merkle et al., 2016), with the model having the smaller BIC value being the preferred model (Raftery, 1995). Finally, a bootstrapping procedure (resampled 1000 times) was used to test the significance of the mediated effects and to produce bias-corrected percentile confidence intervals (CIs). The mediated effects were considered statistically significant at the 0.05 level if the 95% CI for these estimates did not include zero (Shrout and Bolger, 2002).
Results
Demographic variables and liking (pre-test)
The two groups were matched on gender (χ2 = 0.37, P = 0.542), age (χ2 = 10.24, P = 0.669), and the first impressions (liking) of their partner (t (58) = 1.19, P = 0.239).
Manipulation effect: behavioral synchronization
Behavioral synchronization was significantly higher in the synchronization group [M = 14.27, SD = 2.31] than in the control group [M = 11.70, SD = 4.27, t (58) = 2.77, P < 0.01, Cohen’s d = 0.75; Figure 3A], indicating successful manipulation.
Fig. 3.

Group differences in behavioral performance. (A) Behavioral synchronization. (B) Prosocial behavior. Error bars indicate standard errors. *P < 0.05, **P < 0.01.
Prosocial behavior
Participants were found to be more prosocial in the synchronization group [M = 4.93, SD = 0.86] than in the control group [M = 4.10, SD = 1.41, t (58) = 2.59, P < 0.05, Cohen’s d = 0.71; Figure 3B].
INS in the two groups
Based on a series one-sample t-tests, the synchronization group showed significant INS at CH13 and CH14 [CH13: t (29) = 2.28; CH14: t (29) = 3.13, P < 0.05, FDR corrected], which primarily covered the dorsolateral PFC (Figure 4C), whereas the control group did not show any significant INS at any channel (before FDR correction; Figure 4C). Additionally, independent-samples t-test revealed that the INS at CH13 was significantly higher in the synchronization group [M = 0.13, SD = 0.31] than in the control group [M = −0.01, SD = 0.10, t (58) = 3.01, P < 0.01; Figure 4B]. However, no significant difference was found at CH14.
Subjective measurements
Independent-samples t-test revealed significantly higher levels of self–other overlap and perceived similarity in the synchronization group [overlap: M = 4.15, SD = 1.10; similarity; M = 5.45, SD = 1.06] than in the control group [overlap: M = 3.40, SD = 1.23, t (58) = 2.47, P < 0.05, Cohen’s d = 0.64 (Figure 5A); similarity: M = 4.81, SD = 1.30, t (58) = 2.06, P < 0.05, Cohen’s d = 0.54 (Figure 5B)].
Fig. 5.
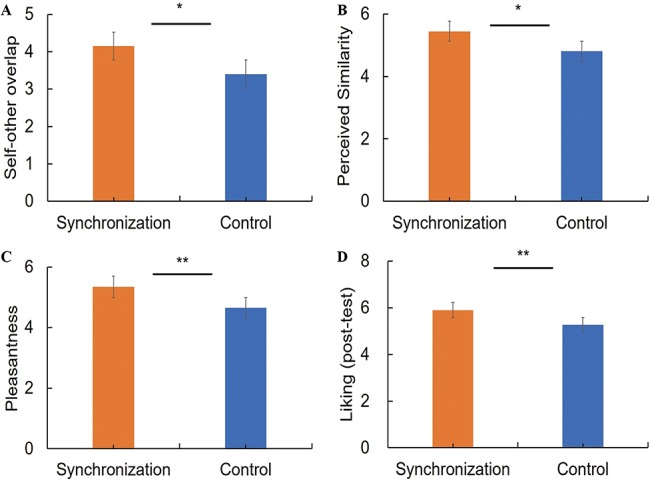
Group differences in subjective measurements. (A) Self–other overlap. (B) Perceived similarity. (C) Pleasantness. (D) Liking (post-test). Error bars indicate standard errors. *P < 0.05, **P < 0.01.
Independent-samples t-test also showed significantly greater pleasantness in the synchronization group [M = 5.35, SD = 0.71] than the control group [M = 4.65, SD = 1.04, t (58) = 2.92, P < 0.01, Cohen’s d = 0.79; Figure 5C]. Similarly, the ratings of liking of the partner (post-test) were also higher in the synchronization group [M = 5.90, SD = 0.70] than in the control group [M = 5.27, SD = 0.89], t (58) = 3.07, P < 0.01, Cohen’s d = 0.79 (Figure 5D). Group difference in post-test liking was significant even after controlling for the baseline ratings of liking (pre-test), F (1,57) = 6.404, P < 0.05.
Correlation analysis
We used Pearson correlation analysis to examine the pairwise correlations among behavioral synchronization, INS, prosocial behavior and subjective measurements. The results are summarized in Table 1.
Table 1.
A summary of pairwise Pearson’s correlations, means, and standard deviations for scores on the behavioral synchronization, INS at CH13, prosocial behavior, and subjective measurements
| Measure | 1 | 2 | 3 | 4 | 5 | 6 | 7 | M | SD |
|---|---|---|---|---|---|---|---|---|---|
| 1 Behavioral synchronization | —— | 0.44* | 0.47** | 0.41* | 0.27 | 0.07 | 0.38* | 14.27 | 2.31 |
| 2 INS at CH13 | 0.05 | —— | 0.59*** | 0.61*** | 0.38* | −0.06 | 0.24 | 0.13 | 0.31 |
| 3 Prosocial behavior | −0.17 | −0.03 | —— | 0.40* | 0.33 | −0.14 | 0.12 | 4.93 | 0.86 |
| 4 Self–other overlap | 0.14 | 0.02 | −0.05 | —— | 0.57** | 0.26 | 0.48** | 4.15 | 1.10 |
| 5 Perceived similarity | 0.07 | 0.12 | 0.02 | 0.47** | —— | 0.37* | 0.46** | 5.45 | 1.06 |
| 6 Pleasantness | 0.06 | −0.05 | −0.32 | 0.29 | 0.19 | —— | 0.35 | 5.35 | 0.71 |
| 7 Liking (post-test) | −0.03 | 0.00 | −0.01 | 0.42* | 0.28 | 0.39* | —— | 5.90 | 0.70 |
| M | 11.70 | −0.01 | 4.10 | 3.40 | 4.81 | 4.65 | 5.27 | —— | —— |
| SD | 4.27 | 0.10 | 1.41 | 1.23 | 1.30 | 1.04 | 0.89 | —— | —— |
Note. Correlations for the synchronization group (n = 30 dyads) are presented above the diagonal, and those for the control group (n = 30 dyads) are presented below the diagonal. Means and standard deviations for the synchronization group are presented in the vertical columns, and those for the control group are presented in the horizontal rows.
* P < 0.05.
** P < 0.01.
*** P < 0.001.
Notably, INS at CH13 was positively correlated with prosocial behavior in the synchronization group [r (30) = 0.59, P < 0.001] but not in the control group [r (30) = 0.02, P > 0.05], indicating that higher INS was associated with higher levels of prosocial behavior only in the synchronization group. INS at CH13 was significantly correlated with self–other overlap [r (30) = 0.61, P < 0.001] and perceived similarity [r (30) = 0.38, P < 0.05] in the synchronization group but not in the control group [overlap: r (30) = 0.02, P > 0.05; similarity: r (30) = 0.16, P > 0.05].
Based on descriptive statistics, several pairs had either quite high or quite low INS. They were within ±3 SD, but beyond ±2.5 SD of the mean. To determine whether our results were mainly driven by these potential outliers, we reran the analyses after excluding them. The correlation results remained significant between the INS at CH13 and prosocial behavior in the synchronization group [r (30) = 0.50, P < 0.05], as well as between the INS at CH13 and self–other overlap [r (30) = 0.46, P < 0.05]. The one difference was that the exclusion of these pairs led to no significant correlation between the INS at CH13 and perceived similarity [r (30) = 0.26, P > 0.05], which was consistent with the result of the mediation analysis, although this bivariate correlation was significant in the original analysis.
Prosocial behavior was positively correlated with self–other overlap in the synchronization group [r (30) = 0.40, P < 0.05] but not in the control group [r (30) = 0.02, P > 0.05]. However, we did not find any significant correlation between perceived similarity and prosocial behavior in the two groups, suggesting that perceived similarity was not likely to be a mediator. There were also no significant correlations between positive emotions and prosocial behavior.
INS was not significantly correlated with positive emotions [i.e. liking (post-test) and pleasantness] (P > 0.05) in either the synchronization group or the control group, suggesting that positive emotions were not likely to be a confounding factor.
Serial mediation analysis
The lack of significant correlations between perceived similarity and prosocial behavior excluded the possibilities of Path models 2 and 4, so we only tested the other two models with self–other overlap as the mediator. Table 2 shows the fit indexes of Path models 1 and 3. Path model 1 showed an excellent fit with the data, with low χ2/df (<3) and RMSEA (<0.05) and high CFI, NFI, and IFI (all > 0.90). In contrast, Path model 3 showed a poor fit with the data, with none of the indices meeting the cutoff point for a good fit. Importantly, the direct model comparison index, BIC, was lower for the Overlap-INS model than the INS-Overlap model, indicating that the former should be accepted. The bootstrap analysis revealed that the total standardized mediating effect of self–other overlap and INS (in that order) on the association between behavioral synchronization and prosocial behavior was 0.123 (95% CI: [0.010, 0.309]; Figure 6A), whereas self–other overlap and INS (in that order) did not serially mediate the effect of behavioral synchronization on prosocial behavior, whose total standardized mediating effect was 0.067 (95% CI: [−0.001, 0.167]; Figure 6B).
Table 2.
A summary of fit indices in the two models (Overlap-INS vs INS-Overlap)
| Path model | χ2 | df | RMSEA | CFI | NFI | TLI | IFI | BIC |
|---|---|---|---|---|---|---|---|---|
| Overlap-INS | 2.039 | 2 | 0.026 | 0.999 | 0.944 | 0.996 | 0.999 | 29.249 |
| INS-Overlap | 7.079 | 2 | 0.296 | 0.832 | 0.805 | 0.496 | 0.852 | 34.289 |
Fig. 6.

Two models of serial mediation (self–other overlap to INS vs INS to self–other overlap) of behavioral synchronization’s effects on prosociality. Standardized path coefficients are presented. Solid lines indicate significant path coefficients, and dotted lines indicate nonsignificant path coefficients. *P < 0.05, **P < 0.01, ***P < 0.001.
Discussion
Our study examined four mediation models about the effect of behavioral synchronization on prosocial behavior. We manipulated behavioral synchronization using a key-pressing task and measured three potential mediators (self–other overlap, perceived similarity and INS) and the dependent variable (prosociality). We found that behavioral synchronization increased prosocial behavior via a chain effect of increased self–other overlap and INS at the right dorsolateral PFC (r-DLPFC).
Synchronization promotes prosocial behavior
Our finding of higher prosocial behavior in the synchronization group than in the control group was consistent with previous studies showing that behavioral synchrony promotes prosocial behavior (Wiltermuth and Heath, 2009; Cirelli et al., 2014; Reddish et al., 2016; Tuncgenc and Cohen, 2018). Two meta-analyses have integrated the 102 scattered studies on prosocial consequences of interpersonal synchronization (Rennung and Goeritz, 2016; Mogan et al., 2017). The conclusion is that interpersonal synchronization in various forms (e.g. pressing keys, walking, tapping, dancing) leads to prosociality.
Cognitive mechanism of the effect of behavioral synchronization on prosociality
We tested that self–other overlap was a mediator of the effect of behavioral synchronization on prosociality, which was consistent with previous studies (Rennung and Goeritz, 2016; Mogan et al., 2017). In the present study, the two partners in each dyad in the synchronization group adjusted their response times to synchronize with each other according to the feedback. During this process, participants needed to simultaneously represent self-generated and other-generated actions and to coordinate them in real time (Keller et al., 2014). When synchronized, the partner’s key-pressing overlapped with the participant’s own, making it difficult to distinguish the two actions specifically and by extension the two individuals in general. Consequently, behavioral synchronization promotes the overlap of the concepts of the self and the other and elicits a subsequent prosocial behavior (Semin and Smith, 2008; Rennung and Goeritz, 2016).
Regarding perceived similarity as a potential cognitive mechanism, although it showed a group difference favoring the synchronization group, there was no significant association between perceived similarity and prosociality. Previous studies have also shown mixed results about the role of perceived similarity in behavioral synchronization and prosociality. Even though there were studies supporting its role (see Introduction), some studies have shown no increases in perceived similarity after behavioral synchronization. For example, Reddish et al. (2013) found that the matching of rhythmic behavior between individuals (synchronization) increased cooperation and shared intentionality, but not perceived similarity. In a recent fNIRS hyperscanning study, Hu et al. (2017) also found no significant correlation between perceived similarity and INS in the synchronization group. Taken together the findings from our study and previous studies, it seems that the perceived similarity hypothesis cannot explain the behavioral synchronization’s prosocial effect.
Neural mechanism of the effect of behavior synchronization on prosociality
At the neural level, the INS in the synchronization group was significantly higher than in the control group, which is consistent with previous research (Funane et al., 2011; Astolfi et al., 2014; Hu et al., 2017; Miller et al., 2019). Hyperscanning studies have suggested that the INS is regarded as an indicator of an efficient interpersonal interaction process (Funane et al., 2011; Lu et al., 2018; Reindl et al., 2018). It should be noted that the INS detected in the present study was primarily located in the r-DLPFC. Correlation analysis suggested that INS at CH13 only (corresponding to BA 9 and 46) was associated with behavioral performance. Consistent with our results, a recent fMRI study found that the self–other mergence was reflected in BA 9 (Wittmann et al., 2016). Seo et al. (2014) further suggested that self–other overlap might index the relational representations that are used in many social situations where outcomes are the consequence of joint actions. Taken together, we speculate that the INS occurring at DLPFC is associated with the process of self–other overlap as a neural representation and reflects the signals relating to the self and its social connectedness with the other when dyads perform the synchronization task (Wittmann et al., 2016).
Recently, Gvirts and Perlmutter (2019) proposed a ‘mutual social attention system’, which mainly includes the temporo-parietal junction (TPJ) and the PFC. These brain regions are crucial to mentalization and theory of mind. The neural coupling between the participants’ mutual social attention systems would lead to the most optimal attunement and achievement of mutual goals and intentions, and hence facilitate prosociality in social interactions (Gvirts and Perlmutter, 2019). For example, the INS in the left middle frontal cortex during a simultaneous time counting task has been found to predict subsequent prosocial inclination (Hu et al., 2017). Reindl et al. (2018) also found that parent-child dyads showed significant INS during a key-pressing synchronization task. Importantly, the parent-child dyads’ INS in the DLPFC and frontopolar cortex played a mediation role between the parent’s and the child’s emotion regulation abilities, suggesting that the neural coupling may be one mechanism through which the parent’s emotion regulation influenced the child’s emotional development (Reindl et al., 2018). These findings supported the notion that attentional neural coupling was associated with prosocial benefits.
Taken together the two cognitive mechanisms and the neural mechanism of INS, we proposed four serial mediation path models based on Gvirts and Perlmutter’s (2019) proposal that INS might be an epiphenomenon or a mechanism for social connectedness. We found that the results supported the serial mediation model of behavioral synchronization to self–other overlap to INS to prosociality. It seems that behavioral synchronization improves mutual understanding and shared representations (Majdandžić et al., 2016), which in turn leads to the promotion of neural coupling between the two brains (Fishburn et al., 2018), and consequently results in greater prosociality. Our study expands previous findings by showing that this mental connection of the self–other overlap might manifest itself in an increased brain-to-brain synchrony during the ongoing behavioral synchronization interaction.
Limitations of this study
First, our optode probe set of fNIRS only covered the PFC. We made that decision based on previous studies using the key-pressing computer game of Cui et al. (2012). Four additional studies (Cheng et al., 2015; Baker et al., 2016; Reindl et al., 2018; Miller et al., 2019) have used this game and found significant INS increases mainly in the PFC, with some variations in exact locations (e.g. right superior frontal cortex (r-SFC) in Cui et al. [2012], left DLPFC (l-DLPFC) in Cheng et al. [2015], right inferior frontal cortex (IFG) in Baker et al. [2016], r-DLPFC in Miller et al. [2019] and l-DLPFC in Reindl et al. [2018]). It is worth noting that the SFC, DLPFC and IFG are all involved in the understanding of others’ intentions and theory of mind in general. The minor variations in exact locations might have been due to differences in experimental design. Beyond the key-pressing task, however, previous studies also revealed that the TPJ and the inferior parietal cortex are essential brain areas for social cognitive neuroscience and involved in mentalization, theory of mind, shared self–other representations, and the mutual social attention system (Decety and Sommerville, 2003; Lu et al., 2018; Gvirts and Perlmutter, 2019). The roles of these brain regions could be further examined by measuring INS from the entire brain and by using different synchronization tasks.
Second, this study focused on two cognitive mechanisms. According to the ‘mutual social attention system’, the INS in the DLPFC may also reflect shared intentionality (Gvirts and Perlmutter, 2019). Indeed, a recent hyperscanning study (Fishburn et al., 2018) found that the INS within the PFC in participant pairs was significantly increased when performing a puzzle together compared to when performing identical but individual puzzles (same intention without shared intentionality). It suggests that two or more individuals are able to allocate attention to important stimuli together, synchronize their actions in space and time (depending on their abilities to share representations), predict each other’s actions, and integrate predicted actions of others (Sebanz et al., 2006; Fishburn et al., 2018). Lu and Hao (2019) also found that shared intentionality played an important role in INS during a three-person collaborative task. Shared intentionality might have contributed to our finding and future research should examine the role of shared intentionality in the effect of INS on prosociality.
Third, although we demonstrated a positive effect of synchronization on prosociality, our study did not consider potential disadvantages of having individuals synchronized. From the classic conformity research (Asch, 1956) to groupthink (Janis, 2008) to recent discussions of the ‘folly of crowds’ or herding behavior (Hasson and Frith, 2016; Wallot et al., 2016), behavioral alignment in a group can lead to negative outcomes. Future research in the field of interpersonal synchronization should consider both the advantages and disadvantages of behavioral and neural synchronization in various social contexts.
Fourth, our findings and serial mediation models were based on the analysis using averaged dyadic data. Behavioral synchronization within dyads may be influenced by personal traits and their interactions with experimental task (Hu et al., 2017). Future studies should consider factors at both dyadic and individual levels (i.e. using mixed models) when evaluating the effect of behavioral synchronization on prosociality.
Conclusions
In summary, using the fNIRS-based hyperscanning technique in an interpersonal-interaction context, the present study revealed how cognitive and neural mechanisms underlined the effect of synchronization on prosociality. Behavioral synchronization was able to increase self–other overlap, which in turn led to increased brain-to-brain synchronization, and consequently prosociality. These results contribute to a better understanding of the role of behavioral synchronization in prosocial behavior.
Acknowledgments
The authors thank the ``Sailing plan'' scholarship for graduate students of Zhejiang Normal University. And the authors thank the teachers and students who provided assistance and suggestions in this study.
Funding
This study was supported by the Major projects of Humanities and Social Sciences in universities of Zhejiang Province, China (2018GH018).
Conflict of interest
The authors declare that they do not have conflict of interest.
References
- Achtziger A., Alós-Ferrer C., Wagner A.K. (2015). Money, depletion, and prosociality in the dictator game. Journal of Neuroscience, Psychology, and Economics, 8(1), 1–14. [Google Scholar]
- Aron A., Aron E.N., Tudor M., Nelson G. (1991). Close relationships as including other in the self. Journal of Personality and Social Psychology, 60(2), 241–53. [Google Scholar]
- Aron A., Aron E.N., Smollan D. (1992). Inclusion of other in the self scale and the structure of interpersonal closeness. Journal of Personality & Social Psychology, 63(4), 596–612. [Google Scholar]
- Asch S.E. (1956). Studies of independence and conformity: I. A minority of one against a unanimous majority. Psychological Monographs: General and Applied, 70(9), 1. [Google Scholar]
- Astolfi L., Toppi J., Vogel P., et al. (2014). Investigating the neural basis of cooperative joint action. An EEG hyperscanning study. In 2014 36th Annual International Conference of the IEEE Engineering in Medicine and Biology Society (pp. 4896–9). IEEE. [DOI] [PubMed] [Google Scholar]
- Baimel A., Birch S.A.J., Norenzayan A. (2018). Coordinating bodies and minds: Behavioral synchrony fosters mentalizing. Journal of Experimental Social Psychology, 74, 281–90. [Google Scholar]
- Baker J.M., Liu N., Cui X., et al. (2016). Sex differences in neural and behavioral signatures of cooperation revealed by fNIRS hyperscanning. Scientific Reports, 6. doi: 10.1038/srep26492. [DOI] [PMC free article] [PubMed] [Google Scholar]
- Batson C.D., Lishner D.A., Cook J., Sawyer S. (2005). Similarity and nurturance: two possible sources of empathy for strangers. Basic & Applied Social Psychology, 27(1), 15–25. [Google Scholar]
- Bernieri F.J., Reznick J.S., Rosenthal R. (1988). Synchrony, pseudosynchrony, and dissynchrony: measuring the entrainment process in mother-infant interactions. Journal of Personality and Social Psychology, 54(2), 243–53. [Google Scholar]
- Boas D.A., Elwell C.E., Ferrari M., Taga G. (2014). Twenty years of functional near-infrared spectroscopy: introduction for the special issue. NeuroImage, 85, 1–5. [DOI] [PubMed] [Google Scholar]
- van den Bos W., van Dijk E., Westenberg M., Rombouts S.A.R.B., Crone E.A. (2011). Changing brains, changing perspectives: the neurocognitive development of reciprocity. Psychological Science, 22(1), 60–70. [DOI] [PubMed] [Google Scholar]
- Chang C., Glover G.H. (2010). Time–frequency dynamics of resting-state brain connectivity measured with fMRI. NeuroImage, 50(1), 81–98. [DOI] [PMC free article] [PubMed] [Google Scholar]
- Cheng X., Li X., Hu Y. (2015). Synchronous brain activity during cooperative exchange depends on gender of partner: a fNIRS-based hyperscanning study. Human Brain Mapping, 36(6), 2039–48. [DOI] [PMC free article] [PubMed] [Google Scholar]
- Cirelli L.K., Einarson K.M., Trainor L.J. (2014). Interpersonal synchrony increases prosocial behavior in infants. Developmental Science, 17(6), 1003–11. [DOI] [PubMed] [Google Scholar]
- Cooper D.J., Dutcher E.G. (2011). The dynamics of responder behavior in ultimatum games: a meta-study. Experimental Economics, 14(4), 519–46. [Google Scholar]
- Cui X., Bryant D.M., Reiss A.L. (2012). NIRS-based hyperscanning reveals increased interpersonal coherence in superior frontal cortex during cooperation. NeuroImage, 59(3), 2430. [DOI] [PMC free article] [PubMed] [Google Scholar]
- Decety J., Sommerville J.A. (2003). Shared representations between self and other: a social cognitive neuroscience view. Trends in Cognitive Sciences, 7(12), 527–33. [DOI] [PubMed] [Google Scholar]
- Dikker S., Wan L., Davidesco I., et al. (2017). Brain-to-brain synchrony tracks real-world dynamic group interactions in the classroom. Current Biology: CB, 27(9), 1375–80. [DOI] [PubMed] [Google Scholar]
- Ehrenreich B. (2015). Dancing in the streets: a history of collective joy. Material Religion the Journal of Objects Art & Belief, 4(2), 236–7. [Google Scholar]
- Fessler D.M.T., Holbrook C. (2014). Marching into battle: synchronized walking diminishes the conceptualized formidability of an antagonist in men. Biology Letters, 10(8), 20140592. [DOI] [PMC free article] [PubMed] [Google Scholar]
- Fishburn F.A., Murty V.P., Hlutkowsky C.O., et al. (2018). Putting our heads together: interpersonal neural synchronization as a biological mechanism for shared intentionality. Social Cognitive and Affective Neuroscience, 13(8), 841–9. [DOI] [PMC free article] [PubMed] [Google Scholar]
- Forsythe R., Horowitz J.L., Savin N.E., Sefton M. (1994). Fairness in simple bargaining experiments. Games and Economic Behavior, 6(3), 347–69. [Google Scholar]
- Friston K.J., Penny W., Phillips C., Kiebel S., Hinton G., Ashburner J. (2002). Classical and Bayesian inference in neuroimaging: theory. NeuroImage, 16(2), 465–83. [DOI] [PubMed] [Google Scholar]
- Funane T., Kiguchi M., Atsumori H., Sato H., Kubota K., Koizumi H. (2011). Synchronous activity of two people's prefrontal cortices during a cooperative task measured by simultaneous near-infrared spectroscopy. Journal of Biomedical Optics, 16(7), 077011. [DOI] [PubMed] [Google Scholar]
- Gallese V., Gernsbacher M.A., Heyes C., Hickok G., Iacoboni M. (2011). Mirror neuron forum. Perspectives on Psychological Science, 6(4), 369–407. [DOI] [PMC free article] [PubMed] [Google Scholar]
- Grinsted A., Moore J.C., Jevrejeva S. (2004). Application of the cross wavelet transform and wavelet coherence to geophysical time series. Nonlinear Processes in Geophysics, 11(5/6), 561–6. [Google Scholar]
- Gvirts H.Z., Perlmutter R. (2019). What guides us to neurally and behaviorally align with anyone specific? A neurobiological model based on fNIRS hyperscanning studies. The Neuroscientist, 1073858419861912. [DOI] [PubMed] [Google Scholar]
- Hagen E.H., Bryant G.A. (2003). Music and dance as a coalition signaling system. Human Nature, 14, 21–51. [DOI] [PubMed] [Google Scholar]
- Hasson U., Frith C.D. (2016). Mirroring and beyond: coupled dynamics as a generalized framework for modelling social interactions. Philosophical Transactions of the Royal Society B: Biological Sciences, 371(1693), 20150366. [DOI] [PMC free article] [PubMed] [Google Scholar]
- Hoshi Y. (2007). Functional near-infrared spectroscopy: current status and future prospects. Journal of Biomedical Optics, 12(6), 062106. [DOI] [PubMed] [Google Scholar]
- Hove M.J., Risen J.L. (2009). It's all in the timing: interpersonal synchrony increases affiliation. Social Cognition, 27(6), 949–60. [Google Scholar]
- Hu Y., Hu Y., Li X., Pan Y., Cheng X. (2017). Brain-to-brain synchronization across two persons predicts mutual prosociality. Social Cognitive and Affective Neuroscience, 12(12), 1835–44. [DOI] [PMC free article] [PubMed] [Google Scholar]
- Huang K., Yeomans M., Brooks A.W., Minson J., Gino F. (2017). It Doesn't hurt to ask: question-asking increases liking. Journal of Personality and Social Psychology, 113(3), 430–52. [DOI] [PubMed] [Google Scholar]
- Janis I.L. (2008). Groupthink. IEEE Engineering Management Review, 36(1), 36. [Google Scholar]
- Jiang H., Chen G., Wang T. (2017). Relationship between belief in a just world and internet altruistic behavior in a sample of Chinese undergraduates: multiple mediating roles of gratitude and self-esteem. Personality and Individual Differences, 104, 493–8. [Google Scholar]
- Keller P.E., Novembre G., Hove M.J. (2014). Rhythm in joint action: psychological and neurophysiological mechanisms for real-time interpersonal coordination. Philosophical Transactions of the Royal Society B: Biological Sciences, 369(1658), 20130394. [DOI] [PMC free article] [PubMed] [Google Scholar]
- Lang M., Shaw D.J., Reddish P., Wallot S., Mitkidis P., Xygalatas D. (2016). Lost in the rhythm: effects of rhythm on subsequent interpersonal coordination. Cognitive Science, 40(7), 1797–815. [DOI] [PubMed] [Google Scholar]
- Lu K., Hao N. (2019). When do we fall in neural synchrony with others? Social Cognitive and Affective Neuroscience, 14(3), 253–61. [DOI] [PMC free article] [PubMed] [Google Scholar]
- Lu K., Xue H., Nozawa T., Hao N. (2018). Cooperation makes a group be more creative. Cerebral Cortex, 29(8), 3457–70. [DOI] [PubMed] [Google Scholar]
- Lumsden J., Miles L., Macrae C. (2014). Sync or sink? Interpersonal synchrony impacts self-esteem. Frontiers in Psychology, 5, 1064–4. [DOI] [PMC free article] [PubMed] [Google Scholar]
- MacKinnon D. (2012). Introduction to Statistical Mediation Analysis, London: Routledge. [Google Scholar]
- Majdandžić J., Amashaufer S., Hummer A., Windischberger C., Lamm C. (2016). The selfless mind: how prefrontal involvement in mentalizing with similar and dissimilar others shapes empathy and prosocial behavior. Cognition, 157, 24–38. [DOI] [PubMed] [Google Scholar]
- Merkle E.C., You D., Preacher K.J. (2016). Testing nonnested structural equation models. Psychological Methods, 21(2), 151. [DOI] [PubMed] [Google Scholar]
- Miller J.G., Vrtička P., Cui X., et al. (2019). Inter-brain synchrony in mother-child dyads during cooperation: an fNIRS hyperscanning study. Neuropsychologia, 124, 117–24. [DOI] [PMC free article] [PubMed] [Google Scholar]
- Mitchell J.P., Macrae C.N., Banaji M.R. (2006). Dissociable medial prefrontal contributions to judgments of similar and dissimilar others. Neuron, 50, 655–63. [DOI] [PubMed] [Google Scholar]
- Mogan R., Fischer R., Bulbulia J.A. (2017). To be in synchrony or not? A meta-analysis of synchrony's effects on behavior, perception, cognition and affect. Journal of Experimental Social Psychology, 72, 13–20. [Google Scholar]
- Montague P.R., Berns G.S., Cohen J.D., et al. (2002). Hyperscanning: simultaneous fMRI during linked social interactions. NeuroImage, 16(4), 1159–64. [DOI] [PubMed] [Google Scholar]
- Oldfield R.C. (1971). The assessment and analysis of handedness: the edinburgh inventory. Neuropsychologia, 9(1), 97–113. [DOI] [PubMed] [Google Scholar]
- Osaka N., Minamoto T., Yaoi K., Azuma M., Osaka M. (2014). Neural synchronization during cooperated humming: a hyperscanning study using fNIRS. Procedia-Social and Behavioral Sciences, 126, 241–3. [Google Scholar]
- Osaka N., Minamoto T., Yaoi K., Azuma M., Shimada Y.M., Osaka M. (2015). How two brains make one synchronized mind in the inferior frontal cortex: fNIRS-based hyperscanning during cooperative singing. Frontiers in Psychology, 6, 1811. [DOI] [PMC free article] [PubMed] [Google Scholar]
- Paladino M.P., Mazzurega M., Pavani F., Schubert T.W. (2010). Synchronous multisensory stimulation blurs self-other boundaries. Psychological Science, 21(9), 1202–7. [DOI] [PubMed] [Google Scholar]
- Pan Y., Cheng X., Zhang Z., Li X., Hu Y. (2017). Cooperation in lovers: an fNIRS-based hyperscanning study. Human Brain Mapping, 38(2), 831–41. [DOI] [PMC free article] [PubMed] [Google Scholar]
- Pellicer A., Bravo M.C. (2011). Near-infrared spectroscopy: a methodology-focused review. Seminars in Fetal & Neonatal Medicine, 16(1), 42–9. [DOI] [PubMed] [Google Scholar]
- Penny W.D., Friston K.J., Ashburner J.T., Kiebel S.J., Nichols T.E., editors (2011). In: Statistical Parametric Mapping: the Analysis of Functional Brain Images, Amsterdam: Elsevier. [Google Scholar]
- Raftery A.E. (1995). Bayesian model selection in social research. Sociological Methodology, 25, 111–64. [Google Scholar]
- Reddish P., Fischer R., Bulbulia J. (2013). Let's dance together: synchrony, shared intentionality and cooperation. PLoS One, 8(8), e71182. [DOI] [PMC free article] [PubMed] [Google Scholar]
- Reddish P., Tong E.M.W., Jong J., Lanman J.A., Whitehouse H. (2016). Collective synchrony increases prosociality towards non-performers and outgroup members. British Journal of Social Psychology, 55(4), 722–38. [DOI] [PubMed] [Google Scholar]
- Reindl V., Gerloff C., Scharke W., Konrad K. (2018). Brain-to-brain synchrony in parent-child dyads and the relationship with emotion regulation revealed by fNIRS-based hyperscanning. NeuroImage, 178, 493–502. [DOI] [PubMed] [Google Scholar]
- Rennung M., Goeritz A.S. (2016). Prosocial consequences of interpersonal synchrony a meta-analysis. Zeitschrift Fur Psychologie-Journal of Psychology, 224(3), 168–89. [DOI] [PMC free article] [PubMed] [Google Scholar]
- Sebanz N., Bekkering H., Knoblich G. (2006). Joint action: bodies and minds moving together. Trends in Cognitive Sciences, 10(2), 70–6. [DOI] [PubMed] [Google Scholar]
- Semin G.R., Smith E.R. (2008). Embodied Grounding: Social, Cognitive, Affective, and Neuroscientific Approaches, Cambridge: Cambridge University Press. [Google Scholar]
- Seo H., Cai X., Donahue C.H., Lee D. (2014). Neural correlates of strategic reasoning during competitive games. Science, 346(6207), 340–3. [DOI] [PMC free article] [PubMed] [Google Scholar]
- Shrout P.E., Bolger N. (2002). Mediation in experimental and nonexperimental studies: new procedures and recommendations. Psychological Methods, 7(4), 422. [PubMed] [Google Scholar]
- Singh A.K., Okamoto M., Dan H., Jurcak V., Dan I. (2005). Spatial registration of multichannel multi-subject fNIRS data to MNI space without MRI. NeuroImage, 27(4), 842–51. [DOI] [PubMed] [Google Scholar]
- Tschacher W., Rees G.M., Ramseyer F. (2014). Nonverbal synchrony and affect in dyadic interactions. Frontiers in Psychology, 5, 1323. [DOI] [PMC free article] [PubMed] [Google Scholar]
- Tuncgenc B., Cohen E. (2018). Interpersonal movement synchrony facilitates pro-social behavior in children's peer-play. Developmental Science, 21(1), e12505. [DOI] [PubMed] [Google Scholar]
- Valdesolo P., DeSteno D. (2011). Synchrony and the social tuning of compassion. Emotion, 11(2), 262–6. [DOI] [PubMed] [Google Scholar]
- Vrieze S.I. (2012). Model selection and psychological theory: a discussion of the differences between the Akaike information criterion (AIC) and the Bayesian information criterion (BIC). Psychological Methods, 17(2), 228. [DOI] [PMC free article] [PubMed] [Google Scholar]
- Wallot S., Mitkidis P., McGraw J.J., Roepstorff A. (2016). Beyond synchrony: joint action in a complex production task reveals beneficial effects of decreased interpersonal synchrony. PLoS One, 11(12), e0168306. [DOI] [PMC free article] [PubMed] [Google Scholar]
- Wiltermuth S.S., Heath C. (2009). Synchrony and cooperation. Psychological Science, 20(1), 1–5. [DOI] [PubMed] [Google Scholar]
- Wittmann M.K., Kolling N., Faber N.S., et al. (2016). Self-other mergence in the frontal cortex during cooperation and competition. Neuron, 91(2), 482–93. [DOI] [PMC free article] [PubMed] [Google Scholar]
- Xia M., Wang J., He Y. (2013). BrainNet viewer: a network visualization tool for human brain connectomics. PLoS One, 8, e68910. [DOI] [PMC free article] [PubMed] [Google Scholar]
- Xue H., Lu K., Hao N. (2018). Cooperation makes two less-creative individuals turn into a highly-creative pair. NeuroImage, 172, 527–37. [DOI] [PubMed] [Google Scholar]
- Yücel M.A., Selb J.J., Huppert T.J., Franceschini M.A., Boas D.A. (2017). Functional near infrared spectroscopy: enabling routine functional brain imaging. Current Opinion in Biomedical Engineering, 4, 78–86. [DOI] [PMC free article] [PubMed] [Google Scholar]
- Zaki J., Ochsner K. (2011). You, me, and my brain: self and other representations in social cognitive neuroscience. Social Neuroscience: Toward Understanding the Underpinnings of the Social Mind, 26, 48. [Google Scholar]