

Abstract
Short-range electron transfer (ET) in proteins is an ultrafast process and occurs on the similar timescales as local protein-solvent fluctuations from femtoseconds to picoseconds and thus the two dynamics are expected to be coupled. Here, we use a model protein of flavodoxin in its semiquinone state and systematically characterized the photoinduced redox cycle of charge separation and charge recombination with mutations of different aromatic electron donors (tryptophan and tyrosine) and local residues to change the redox properties. We observed the ET dynamics in a few picoseconds, strongly following a stretched behavior resulting from a coupling between local environment fluctuations and these ET processes. We further observed the hot vibrational-state formation through charge recombination and the subsequent cooling dynamics and both processes are also in a few picoseconds. Combined with our previous studies of femtosecond ET in oxidized flavodoxin, these results coherently reveal the evolution of the ET dynamics from single to stretched exponential behaviors and elucidate the coupling mechanism. The observed hot vibration-state formation is robust and general and should be considered in all photoinduced back ET processes in flavoproteins.
Graphical Abstract

Fundamental to the mechanism of cyclic electron transfer (ET) in biological photomachines lies the fact that the energy of absorbed photon is channeled to a highly specific reaction pathway via a charge-separated intermediate to guarantee favorable efficiency over competing futile processes.1–6 This reaction mechanism is observed in photolyases,3,4,7–9 cryptochromes10–12 and BLUF proteins,6,12–14 where their flavin cofactors function as a redox center or a light sensor to perform subsequent reactions and/or downstream signaling.15,16 The ET dynamics are key to understanding the functions of these proteins as they control crucial steps such as chemical selectivity, time scales and reaction yields, and thus directly govern molecular mechanisms.8,17,18 Historically, ET reactions have been aptly described by the Marcus theory over past several decades19,20 and this equilibrium theory has undergone a few modifications to include effects such as local solvation or vibrational coupling21–25 as observed in recent photoinduced short-range ET reactions.26–29 Due to the ultrafast nature of these ET processes, the ET reactions can occur in a vibrationally unrelaxed excited state or couple with environment relaxation.27 Thus, more studies are needed to further elucidate the nonequilibrium short-range ET dynamics in proteins.
Here, we use a model system, flavodoxin, to study a ultrafast photoinduced redox cycle. Flavodoxin is a redox-active protein known for its role as an ET carrier.30,31 It has a noncovalently bound flavin molecule (FMN) as the cofactor that is partially exposed to surface water molecules (Figures 1A and 1B).32 The flavin moiety can readily switch between three oxidation states, namely oxidized quinine (FMN), one-electron reduced neutral semiquinone (FMNH˙), and completely reduced anionic hydroquinone (FMNH-), thereby allowing it to behave proficiently in several ET reactions. At the active site, two aromatic residues (W60 and Y98) are active electron donors. In our previous studies, upon excitation of the oxidized state, an electron readily jumps from the W60/Y98F to the excited oxidized flavin.27 These ET rates were observed to be ultrafast owing to the stacked nature of flavin with both W60 and Y98 within van der Waals contacts. Ultrafast dynamics of forward ET (FET) and backward ET (BET) was observed to occur on the timescales of 135–340 fs and 0.95–1.56 ps, respectively, with a subsequent cooling from vibrationaly hot BET products in 2.5–4.3 ps. These ultrafast ET dynamics are nearly independent of environment relaxations and follow single-exponential behaviors.27,33 We measured the environment response at oxidized state using an ET-inert mutant W60F/Y968F and observed the active-site solvation dynamics in 1.0 ps (53%), 25 ps (26%) and 670 ps (21%), corresponding to local water-network and protein-sidechains relaxations.34 Thus, the environment response is slower than the charge separation and FET essentially occurs in a frozen protein environment, following the single-exponential dynamics.
Figure 1.

(A) X-ray crystal structure of semiquinone D. vulgaris flavodoxin (PDB code 4XF2) with the active site highlighted. (B) Close-up view of the active site with hydration water molecules obtained from a 500-ps MD simulation snapshot. FMNH˙ (purple) is sandwiched between W60 (green) and Y98 (yellow) at 3.5 Å and 3.3 Å, respectively. Neighboring residues of D95 (teal) and G61 (orange) are also shown. (C) Generalized timelines of photoinduced ET dynamics and active-site solvation relaxations in flavodoxin. The active site relaxations start from ~1 ps. For oxidized flavodoxin, the photoinduced cyclic ET is ultrafast within ~1 ps and senses a frozen environment. For semiquinone flavodoxin, the cyclic ET is in a few picoseconds and couples with active-site motions.
In our present work, we reduce the cofactor flavin to a semiquinone state (Figure 1B). Due to its smaller reduction potential,35 we expect the ET reactions to slow down, entering the time region of the local environment relaxations (Figure 1C). Thus, the ET dynamics may directly couple with local protein-water motions. We will systematically characterize the ET rates of the complete ET cycle and its dynamical relation with environment relaxations with a series of mutations using femtosecond-resolved fluorescence and absorption spectroscopy. Specifically, the designed various mutants are classified into four categories: (I) W60 as the sole electron donor by a single mutation of Y98F, Y98A, Y98H and Y98R; (II) Y98 as the sole electron donor with a single mutation of W60F and W60A; (III) both W60 and Y98 as electron donors of WT and single mutation of D95N, G61A and G61V; and (IV) double donors of W60/W98 and Y60/Y98 by mutation of Y98W and W60Y, respectively. We dissected FET, BET and subsequent vibrational cooling dynamics of each mutant protein and measured all the reaction timescales. These results will provide deep insights into the molecular mechanism of ultrafast short-range ET in proteins.
Figure 2 shows the absorption and fluorescence spectra of wild-type semiquinone flavodoxin as well as the absorption spectrum of the mutant Y98W. The WT absorption spectrum shows its characteristic D1← D0 transition40 peaking at 580 nm with a shoulder near 620 nm. Except for Y98W (W60/W98), all mutants follow the WT absorption spectrum with Y mutants shifting to the red side by ~10 nm, W mutants shifting to the blue side by ~10 nm, and D95N and G61A mutants resulting in a blue shift, indicating different electronic stabilization by these mutations (Figure S1). The G61V mutant is very difficult to reduce to the semiquinone state probably due to the buulky hydrophobic residue V to exclude nearby water molecules. The absorption of G61V is usually a mixing of oxidized and semiquinone states (Figure S1). With closely spaced two Trp residues in a sandwich configuration, the Y98W mutant experiences electronic delocalization owing to its charge-transfer nature in the molecule with an absorption tail extending to the red side (Figure 2), as also observed in its oxidized state.27 The emission spectrum of semiquinone state, peaking around 700 nm, was first reported in our early studies41 and obtained from the redox-inert W60F/Y98F mutant in the absence of ET quenching. It shows a typical non-lognormal shape like other flavoproteins42,43 possessing a heterogenous electrostatic protein environment.
Figure 2.

Steady-states spectra of semiquinone flavodoxin. The absorption spectra of WT (blue) and Y98W (red) and the emission spectrum of the ET-inert mutant W60F/Y98F at longer wavelengths. Note the long-tail absorption of Y98W due to the electron delocalization with a charge-transfer character. The pump wavelength and the gated fluorescence wavelengths are marked in arrows. The top bars represent the absorption ranges of the excited state, various intermediates and final product. The transient-absorption probe wavelengths are also marked by top arrows.
Owing to the dynamic solvation behavior as we reported before,34,42 the excited semiquinone dynamics was probed at multiple wavelengths (652, 670 and 725 nm) from the blue to red side of the emission spectrum to detect solvent-interlaced ET behavior. For transient-absorption measurements, the probe is systematically tuned in the visible region over a wide range of wavelengths to capture the entire dynamics of all intermediates and products involved (Figure 2, upper panel). At the red side (800–740 nm), we exclusively detect the excited-state (FMNH˙*) decay, representing direct ET rates. The intermediate W+ is detected at wavelengths mainly shorter than 700 nm.44 Possible hot ground states of FMNH˙† is detected at as longer as 670 nm and portrayed a red shifted FMNH˙ absorption spectrum. The ground-state FMNH˙ is dominant at the wavelengths less than 640 nm.
To determine intraprotein electron transfer rates, we directly measured the fluorescence quenching dynamics of excited semiquinone flavin. We took the fluorescence transients of WT and 11 mutants and they all show ultrafast decays on the picosecond timescale (Figure 3 and Figure S2). Figure 3A shows several typical transients of the ET quenching dynamics gated at 725 nm for WT and 5 mutants and Figure 3B shows the transients of Y98 (W60F) and W60 (Y98F) gated at three different wavelengths of 652, 670 and 725 nm. As reported before,41 the effective lifetime of FMNH˙* is ~230 ps using the redox-inert mutant W60F/Y98F, indicating the observed ultrafast decays in Figure 3 being the ET dynamics with W60 and/or Y98. The fluorescence transients at 725 nm of the red-side emission best represent the ET dynamics with minor solvation contributions, consistent with the transient-absorption measurements (see below). All these transients at 725 nm can be best fit by (A, an amplitude; τ, a time constant; and β, a stretched parameter), although they can also be represented by a double-exponential decay (Table S1).
Figure 3.

(A) Normalized femtosecond-resolved fluorescence transients of WT flavodoxin and mutants gated at 725 nm. (B) Normalized femtosecond-resolved fluorescence transients of Y98F and W60F gated at 652, 670 and 725 nm. Note the faster dynamics at the blue side resulting from the mixing of solvation and ET reaction.
Specifically, for WT with the two electron donors, the ET dynamics occurs in 1.5 ps with β=0.78. For D95N, the ET dynamics with the same donors becomes faster in 1.4 ps with β=0.81, indicating a favorable driving force due to the mutation. For Y98F with only one donor of W60, the dynamics becomes slower in 2.9 ps with β=0.83. For the mutants of W60A and W60F with the same donor of Y98, the ET dynamics are in 4.2 ps (β=0.83) for the former and 7.0 ps (β=0.83) for the latter, reflecting the different electrostatic environment. The addition of rates of W60A and Y98F is equal to that of WT. For W60Y with two Y donors, surprisingly, the dynamics is very similar to W60F and in 7.0 ps (β=0.80), indicating that the Y60 donor may make a minor contribution. All resulting average times and β values are listed in Table 1. As also shown in Figure 3B, the transients gated at bluer wavelengths become gradually faster, a signature of ultrafast solvation dynamics mixing with the ET process. As reported before,34 the solvation dynamics at the binding site using W60F/Y98F mutant occur in 2.6 ps (75%) and 40 ps (25%). The even longer solvation process in hundreds of picoseconds was not resolved due to the short lifetime of ~230 ps. Clearly, the ET dynamics in a few picoseconds observed here does overlap with the local solvation process, leading to the observation of a stretched behavior.
Table 1:
Timescales of ET reactions and subsequent cooling dynamics in semiquinone flavodoxin.a
| Mutants | Donor(s) | FET | BET | τcooling | ||||
|---|---|---|---|---|---|---|---|---|
| <τ>b | <τ>c (<τW>,<τY>) |
βc | <τ>c | βc | ||||
| I | Y98F | W60 | 3.2 | 3.4 | 0.83 | 0.84 | 0.90 | 5 |
| Y98A | W60 | 2.2 | 0.79 | 0.93 | 0.93 | 3–5 | ||
| Y98H | W60 | 1.8 | 0.76 | 0.96 | 0.92 | 3–5 | ||
| Y98R | W60 | 1.4 | 0.83 | 0.90 | 0.93 | 3–5 | ||
| III | W60F | Y98 | 7.7 | 7.3 | 0.78 | 9.0 | 0.81 | 5 |
| W60A | Y98 | 4.6 | 4.2 | 0.78 | 6.8 | 0.79 | 5 | |
| IIId | WT | W60, Y98 | 1.7 | 1.9 | 0.86 | 1.2, NR | 0.89 | 4 |
| (2.8, 5.6) | ||||||||
| D95N | W60, Y98 | 1.6 | 1.6 | 0.81 | 1.2, NR | 0.91 | 3–5 | |
| (2.4, 4.9) | ||||||||
| G61A | W60, Y98 | 2.5 | 0.81 | 1.2, NR | 0.90 | 3–5 | ||
| (6.0, 4.2) | ||||||||
| G61V | W60, Y98 | 1.5 | 0.80 | 0.92, NR | 0.91 | 3–5 | ||
| (4.2, 2.3) | ||||||||
| IV | Y98W | W60, W98 | 0.36 | 1.0 | 1.0 | 1.0 | 3–4 | |
| W60Y | Y60, Y98 | 8.2 | 6.9 | 0.80 | 9.90 | 0.81 | 5 | |
Time constants are in units of ps. All average times are calculated using <τ> =
Obtained from the fluorescence dynamics gated at 725 nm.
Obtained from the transient absorption detection.
For two donors, each individual ET timescale can be resolved from the total ET time by knowing the driving forces, coupling constants for the W and Y donors and the ranges of two reorganization energies. NR: not resolved for the Y donor.
To switch to transient-absorption detection of the ET dynamics, we first characterized the W60F/Y98F mutant as a control and the transients probed from 800 to 525 nm are shown in Figure 4. All transients show a long lifetime component of ~300–400 ps except that at 630–690 nm the transients also exhibit two initial rise components in 1.8–2.6 ps and 8.5–26.6 ps (Table 2). These two components are the reflection of solvation processes as observed in the fluorescence measurements. These initial dynamics are incorporated in our transient-absorption ET data analyses whenever applicable. In Figures 5–7 (and Figures S3–S5), the transients probed at 800 nm directly reflect the forward ET dynamics and those probed at shorter wavelengths are mixture of the initial excited state, reaction intermediates and final products.
Figure 4.

Normalized femtosecond-resolved absorption transients of the single donor W60 (Y98R) probed from 800 to 525 nm. Inset A shows the gradual changes with the different probe wavelengths. Note the longer dynamics probed at 690–650 nm. Insets B and C show the deconvolution of the transients into constitutive species probed at 655 and 630 nm, respectively. The excited-state signal of FMNH˙* in inset C is relatively small and not shown.
Table 2:
Energetics of cyclic electron-transfer reactions in semiquinone flavodoxin.a
| Mutants | Donor(s) | E(SQ/HQ)b | HAB | ΔGFETo | λFET | ΔGBETo | λBET | |
|---|---|---|---|---|---|---|---|---|
| I | Y98F | W60 | −0.414 | 13.6 | −0.436 | 0.91 | −1.564 | 1.24 |
| Y98A | W60 | −0.304 | 13.6 | −0.546 | 0.99 | −1.454 | 1.11 | |
| Y98H | W60 | −0.262 | 13.6 | −0.588 | 1.01 | −1.412 | 1.07 | |
| Y98R | W60 | −0.265 | 13.6 | −0.585 | 0.97 | −1.415 | 1.08 | |
| II | W60Fc | Y98 | 14.8 | −0.34 | 0.90 | −1.660 | 1.05 | |
| W60A | Y98 | −0.357 | 14.8 | −0.393 | 0.90 | −1.827 | 1.02 | |
| IIId | WT | W60, Y98 | −0.443 | 13.6, 14.8 | −0.407, −0.307 | 0.85, 0.82 | −1.593,−1.693 | 1.20, NR |
| D95N | W60, Y98 | −0.395 | 13.6, 14.8 | −0.455, −0.355 | 0.89, 0.87 | −1.545,−1.645 | 1.16, NR | |
| G61A | W60, Y98 | −0.359 | 13.6, 14.8 | −0.491, −0.391 | 1.05, 0.90 | −1.509,−1.609 | 1.12, NR | |
| G61V | W60, Y98 | −0.299 | 13.6, 14.8 | −0.551, −0.451 | 1.08, 0.90 | −1.449,−1.549 | 1.11, NR |
Figure 5.

Normalized femtosecond-resolved absorption transients of the single Y98 donor (W60F) probed from 800 to 525 nm. Inset A shows the gradual changes of the dynamics with the different probe wavelengths. Note the longer dynamics probed at 690–640 nm. Insets B and C show the deconvolution of the transients into constitutive species probed at 650 and 630 nm, respectively.
Figure 7.

Complete photoinduced redox cycle coupled with active-site relaxations including hydration water molecules. Note the formation of vibrationally excited products FMNH˙† after charge recombination that subsequently decay in 3–5 ps to complete the ET cycle.
The resulting FET reaction times for WT and mutants probed at 800 nm are similar to those obtained from the fluorescence dynamics at 725 nm; these values are also listed in Table 1. Clearly, the FET dynamics with one W donor are faster than that with one Y due to favorable free energy for the former by ~0.3 eV.45 For WT (Figure 7A), the ET rate is faster than that of W60 (Figure 5) or Y98 (Figure 6) and is closely the sum of both channels of W60 and Y98. Within class I with one W donor, the ET rates increase from the Y mutant of F to A, H and R reflecting stabilization of charge-separated states. Similarly for class II, the FET rates increase from the W mutant of F to A. Within class III, the D95 mutation places the positive asparagine residue in the vicinity of flavin and stabilizes FMNH– intermediate, thereby accelerating ET (Figure 3 and Figure 7B). On mutating G61 to a nonpolar residue G61A, the H-bond to N(5) flavin is eliminated and the local structure could become loose.46 The FET process takes place over a longer distance with a slower rate. For G61V, the ET rate is fastest, reflecting a possible different donor-acceptor configuration around the active site due to a bulky valine residue. For class IV, the effect of Y60 as an additional electron donor in the mutant W60Y (Figure 7C) with two Y donors is not noticed, probably due to the flexible gate position of the binding pocket to the surface.47 For Y98W with two W donors (Figure 7D), surprisingly we can detect the ultrafast ET dynamics in 360 fs with β=1.0, the fastest ET rate from the two efficient W donors being stacked in a sandwich configuration with the isoalloxazine ring. The ET dynamics is much faster than the initial solvation relaxation (2.6 ps), the environment is relatively frozen, and thus the FET dynamics becomes a single-exponential decay. Interestingly, we could not detect such ultrafast ET dynamics from the fluorescence measurement, indicating a delocalized electronic state as shown in Figure 2 with a long tail absorption. But, we still can detect the complete charge-separation dynamics by the transient-absorption method. For the oxidized state of the same mutant, due to the significant delocalization, we did not detect the FET dynamics by both fluorescent and transient-absorption methods.27
Figure 6.
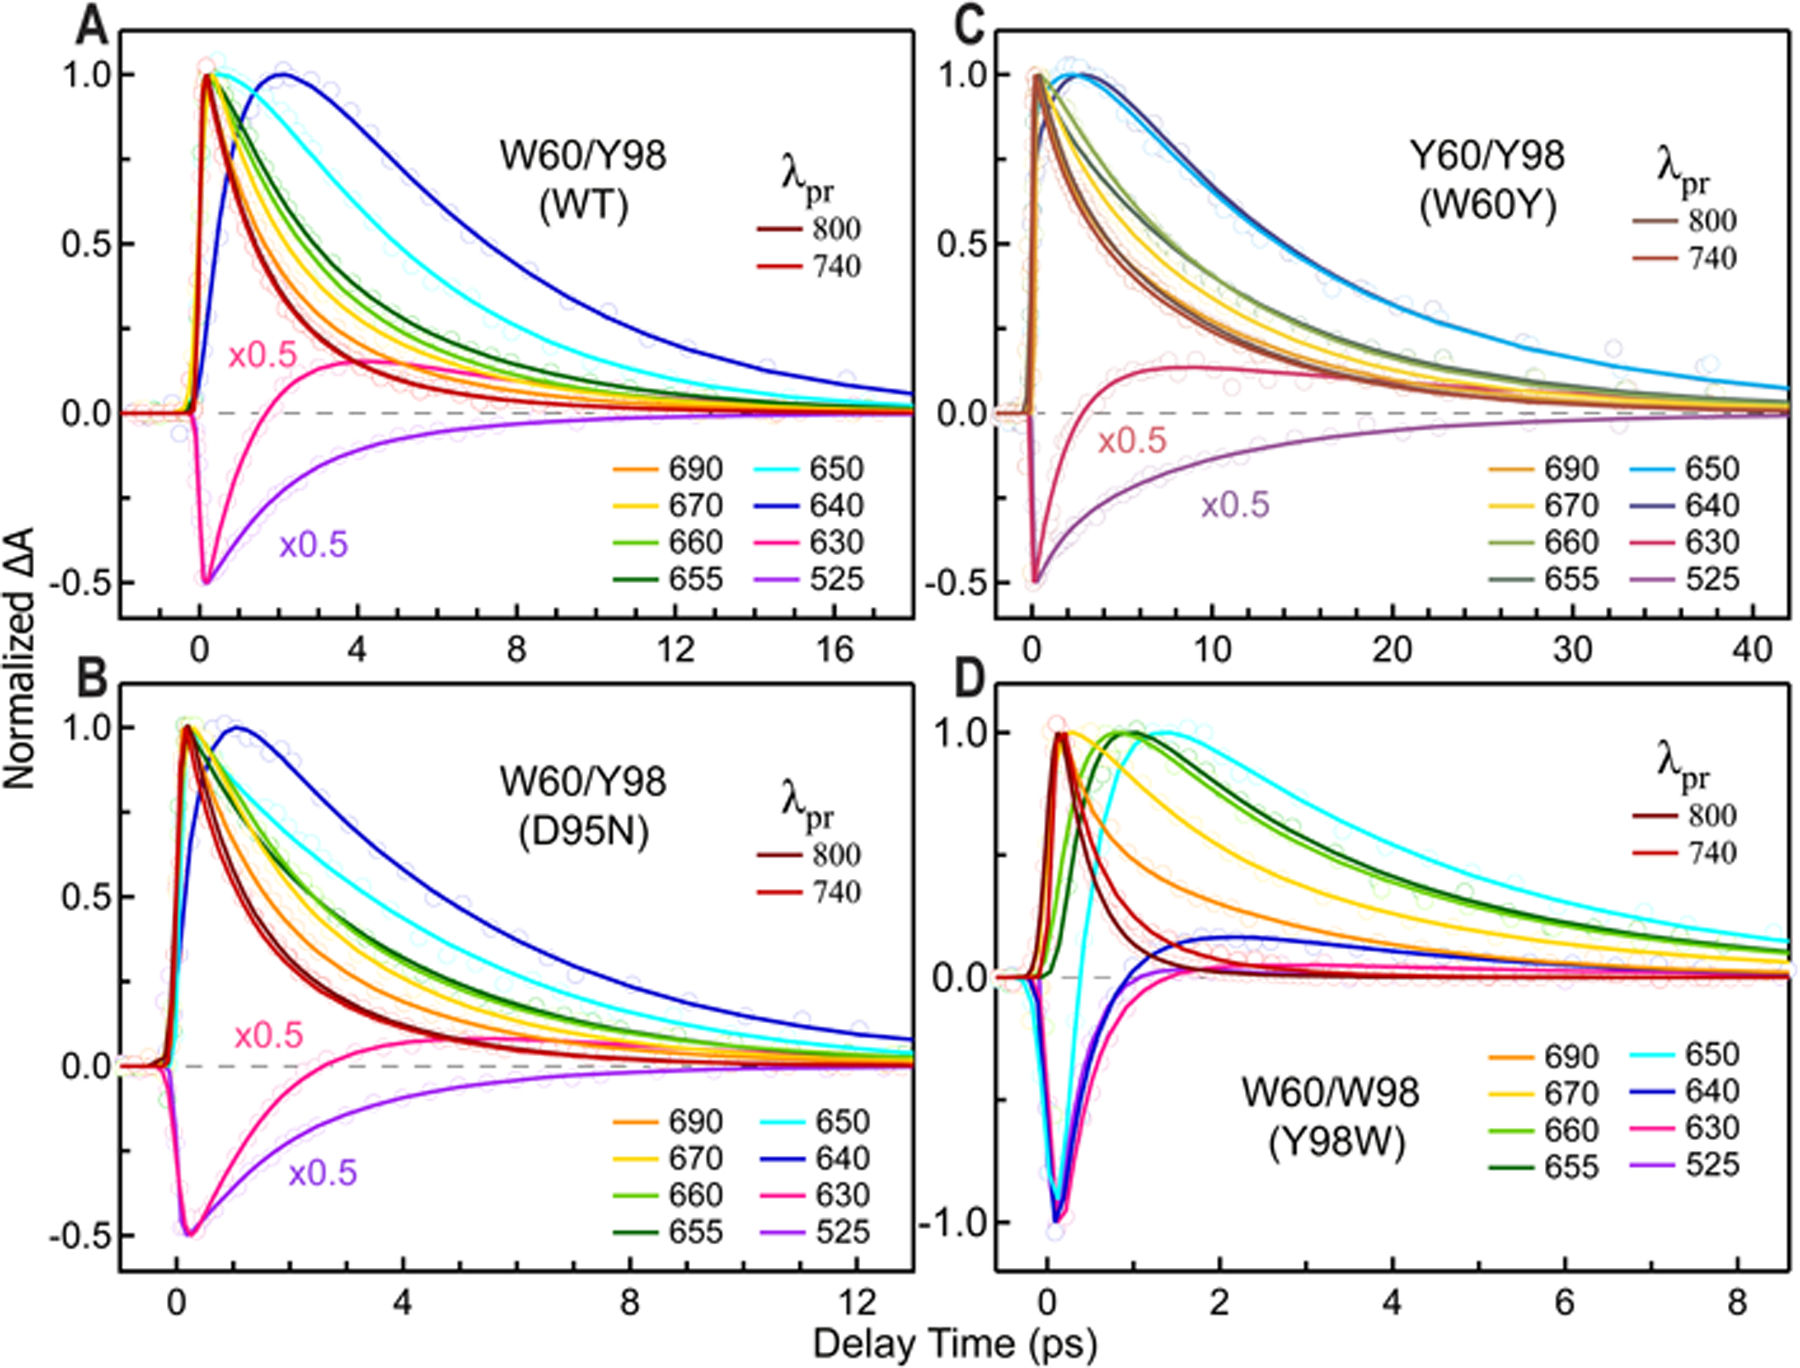
Normalized femtosecond-resolved absorption transients with dual donors, (A) W60/Y98 (WT), (B) W60/Y98 (D95N), (C) Y60/Y98 (W60Y) and (D) W60/W98 (Y98W). Note similar patterns with a longer dynamics in the probe region of 690–640 nm and the difference in timescales for these mutants.
To capture the ET intermediates such as W+, we probed the dynamics from 800 to 525 nm. As shown in Figures 5–7, the transients systematically show the charge-separation dynamics, intermediate evolution and product formation probed from the red to blue side. Mostly, the transients probed at 800 and 740 nm show the forward ET dynamics. From 690 to 650 nm, we observed that the transients progressively get slower. From 690 nm, we detected a rise-decay signal from W+ intermediate. Similar to the observation for oxidized flavodoxin,27 the charge recombination leads to the formation of a hot ground-state product FMNH˙†. This hot state has a red-shifted absorption of the initial ground state (Figure 2), resulting in our observation of FMNH˙† in the 650–690 nm region (Figure 5–7).
Specifically, in Figure 5, we observed the charge recombination for W60 in 0.87 ps with β=0.93. This BET is faster than the forward ET, similar to the semiquinone dynamics observed in photolyase,29 resulting in an apparent reverse kinetics with the rise representing the charge recombination and the delay being the charge separation. The β values is larger than the corresponding FET stretched one (β=0.83), reflecting less extent of solvent coupling due to the faster BET dynamics. Besides the FET and BET signals, we detected distinct cooling dynamics involving vibrationally-excited BET product FMNH˙† (B, C panels in Figure 5). The cooling relaxation takes about 3.2–5.0 ps. The more contributions of the cooling process toward 650 nm gives rise to the observed slower pattern from 690 to 650 nm. From 640 to 525 nm, we detected FMNH˙ recovery from the hot FMNH˙† (also in Figure S3 for deconvolution). Interestingly, the overall signal becomes faster due to partial signal cancellation of hot-state cooling with ground-state recovery. Similar patterns were observed in the ET cycle of all class I mutants, with faster recombination ranging in 0.80–0.92 ps, β=0.90–0.93 and the cooling dynamics in 3.0–5.0 ps.
For class II with sole Y donor, Figure 6 shows all the transients for Y98 (W60F), characteristic to the ET behavior involving only one Y donor. Similarly, the transients probed at 800 and 740 nm are exactly the same, representing pure FET dynamics in 6.3 ps and significantly slower than those in class I with one W donor. From 690–640 nm, we clearly observed an initial rise component in 1.1–2.1 ps, similar to what we observed in Figure 4 for W60F/Y98F mutant (also Table 2) and resulting from the detection of initial solvation process. Because the Y+ intermediate only absorbs at wavelengths less than 510 nm,48 we only detected the species of FMNH˙*, FMNH˙† and FMNH˙. By systematic fitting (also in Figure S4) and assuming the similar cooling dynamics in 3–5 ps, we observed the BET in 8.0 ps with β=0.81. Similarly, for W60A, we observed BET in 6.0 ps (β=0.79). These BET dynamics are slightly slower than their FET dynamics. The cooling dynamics were found to be in 3.5–5.0 ps, similar to the observation for the class I mutants and also for the oxidized state. Note that for such faster cooling with slow charge recombination, the resulting dynamics appears a reverse kinetics with less accumulation of the hot FMNH˙†, as shown in Figure 6 (B and C). Also, the gradually slowing pattern results from the more contributions of the hot ground state but the decay here, different from the class I, is the charge recombination dynamics which are the same for all the probed wavelengths.
Figure 7 shows transient-absorption signals for WT, D95N, W60Y and Y98W, each having two electron donors present. For the former two (Figures 7A and 7B), we detected the FET dynamics in 1.8 ps (β=0.83) and 1.4 ps (β=0.81), respectively, by probing 800 and 740 nm. According to the two-channels model,27 we obtained the BET dynamics of charge recombinations of W60 for WT and D95N in 1.1 ps with β=0.89 and 0.91, respectively. We could not resolve the BET dynamics for the Y98 donor in these two-donors systems due to minor contributions of Y+ signals at the probed wavelengths (690–525 nm). The cooling dynamics for the two proteins are similar in 3–5 ps. For W60Y in Figure 7C, the transient pattern is very similar to W60F, leading to a similar FET in 6.1 ps (β=0.80), BET in 8.8 ps (β=0.81) and the cooling dynamics in 3–5 ps. As discussed earlier, the mutation of W60Y may make a minor contribution to the ET dynamics due to possible structural changes. For Y98W in Figure 7D, as mentioned early, we detected the FET dynamics at 800 nm. Furthermore, we observed a W+ intermediate signal at 740 nm, the only one among WT and 11 mutants, indicating a red shift of W98+ absorption due to the unique sandwich structure. We observed the BET dynamics in 1.0 ps with a similar cooling dynamics in 3–4 ps.
Using ultrafast spectroscopy, we measured the timescales of charge separation, charge recombination and cooling dynamics. With the information, we apply the Marcus theory to further analyze the ET mechanism. The ET rate can be expressed:19,20
| [1] |
where k is ET rate in seconds−1, HAB is coupling constant in eV, λ is the reorganization energy in eV and ΔGo is the total free enesrgy in eV. Although the ET dynamics are in nonequilibrium, the estimated ET parameters using the Marcus theory provide valuable insights into the ET mechanism.
Using the average forward and backward ET rates,49 the energy of D1← D0 transition at 620 nm as 2.0 eV, the reported reduction potentials for the mutants,35,36,50,51 and the constraints of a larger reorganization energy for backward ET than that for forward ET, we determined the λFET, λBET and HAB for all donor-acceptor pairs (Table 3). For ET in class I mutants, λFET is from 0.91 to 1.01 eV with a larger λBET ranging from 1.07 to 1.22 eV and HAB = 13.6 meV. As a result, the forward ET occurs in the normal region while backward ET in the inverted region. The large HAB (109 cm−1) value signifies a significant coupling between the flavin and W60. Among these mutants, the flavin potential is significantly lower in Y98F (Table 3), possibly due to unfavourable interactions between anion FMNH− and the stacked F residue. This accounts for the observed slowest ET in 3.1 ps among class I mutants. For class II mutants, we obtained smaller reorganization energies for both forward and backward ET processes. Being in the hydrophobic pocket, Y98 experiences less exposure than W60, which lies on the flexible outer loop.47 Also the coupling between flavin and Y98 is greater with 14.8 meV (120 cm−1) resulting from a shorter separation between the two. The reduction potential of Y98/Y98+ in the hydrophobic environment was observed to be 1.25 eV, 0.22 eV smaller than the reported tyrosine potentials at 1.47 eV.45
For class III mutants with both W60 and Y98 as electron donors, we analyzed the data by assuming that the addition of individual rate contributions from the W60 and Y98 donors using the Marcus theory is equal to the experimentally observed rate (kET(expt) = kW60 + kY98). We used the derived coupling values from the single-donor mutants as the coupling constants for the two donors. In WT, the λFET values were 0.85 and 0.82 eV for W60 and Y98, respectively, smaller than those in single mutants, arising from the fast ET timescale with less solvation coupling. For D95N mutant, the mutation changes the redox environment around Y98 and the flavin, thus resulting in changes of λFET, 0.89 and 0.87 eV for W60 and Y98, respectively. For G61 mutants, the mutation is on the W60 side and thus λFET remains constant for Y98 donor at 0.90 eV, while λFET shifts to 1.05 and 1.08 eV for the W60 donor in G61A and G61V, respectively.
We could determine λBET for the donor W60, but not for the donor Y98 in this class III. λBET in WT is 1.20 eV, closer to that of Y98F. For D95N, λBET shifts to 1.16 eV due to the change of the driving force. G61A and G61V mutants experience a larger change in λBET of 1.2 and 1.1 eV, respectively, resulting from the different protein environment associated with the mutation as discussed earlier. For the λBET values of the Y98 donor, because we could not resolve the weak Y98+ signals in our probing range, we cannot deduce the BET rates of the Y98 donor and thus we did not extract the λBET values for Y98. All other values are reported in Table 3.
The final photoinduced redox cycle is summarized in ure 8. Although flavodoxin is not a protein with photoinduced function, it is an excellent system to investigate short-range ET in proteins. Together with our earlier studies of oxidized flavin,27 we clearly observed how the protein fluctuations modulate the ET process, a coupling process of the ET configurations with local protein-solvent coordinates. By our measurements of protein relaxations on the picosecond time scale, the ultrafast ET in a few hundreds of femtoseconds in the oxidized state sees a “frozen” protein environment with less extent of coupling, leading to our observation of a single-exponential decay of ET dynamics. But for semiquinone flavin, the ET dynamics in a few picoseconds enters the protein fluctuation region, as illustrated in Figure 1C, a strong coupling is expected and clearly, we observed a stretched exponential or multiple-exponential decay. Such coupling effects should be common in many ET dynamics occuring on the picosecond timescales in complex systems. Clearly, these ET dynamics are nonequilibrium processes and the Marcus theory should be cautiously used as discussed above. As a better approximation, we may apply the Sumi-Marcus model22 to treat such coupling processes to get deeper insights and the work is in progress.
The observation of vibrationally-excited ground-state flavin after charge recombination is significant. From both oxidized and semiquinone states, we observed the same pattern of vibrational cooling in ~3–5 ps at slightly long wavelengths of the ground-state absorption. Clearly, the ultrafast forward and backward ET dynamics provide an opportunity to observe the slower cooling dynamics. Such vibrational excitation in back ET is general to all flavin-involved BET processes and in many cases, the slow BET masks the fast cooling dynamics. The recent report52 of the ET dynamics in the TrmFO protein unfortunately missed to analyze such cooling dynamics around 500–550 nm but attributed the longer dynamics to the absorption of the tyrosyl cation. It needs more caution in analyses of these ultrafast ET dynamics, for example, the charge-separated anion flavin (FMNH–) intermediate could also be formed in vibrationally hot states and our careful simulations including a similar cooling process and BET dynamics for hot FMNH– give no difference of our current results, i.e., the intermediate anion flavin FMNH– could also be vibrationally hot and we could not presently resolve it. More theoretical work is needed for further understanding of such ultrafast ET processes.
We investigated the short-range ET dynamics in semiquinone flavodoxin to further examine the coupling of the local protein-solvent fluctuations with ET processes using femtosecond spectroscopy and extensive mutations. Compared with our previous studies of oxidized flavodoxin, the smaller driving force in semiquinone flavodoxin makes ET slow down, entering the time region of local protein fluctuations. We thus widely observed a stretched dynamic behavior. For the four different groups of mutants with the donor(s) of W, Y, W/Y and Y/Y, we observed the cyclic ET dynamics in a few picoseconds with a stretched parameter of β ranging from 0.76 to 0.93. Specifically, we observed the forward ET dynamics for the W donor in 1.4–3.4 ps with β=0.76–0.86 and the subsequent back ET in 0.84–0.96 ps with β=0.89–0.90. The BET processes were observed faster than their FET dynamics. For the Y donor, we observed the forward ET dynamics in 4.2–7.3 ps with β=0.78–0.80 and subsequent back ET in 6.8–9.9 ps with β=0.79–0.81. The BET dynamics here are slower than their FET process. For the special mutant (Y98W) with W60/W98 donors, we observed the fastest ET in 0.36 ps and the back ET in 1.0 ps without a stretched behavior, due to the stacked nature of two W residues sandwiching the flavin acceptor and also the relatively slow solvation dynamics. All the BET processes for WT and 11 mutants involve the hot vibrational-state formation and we also observed the subsequent cooling dynamics in 3–5 ps for all the proteins.
The observed stretched ET behaviors and hot vibrational-state formation during charge recombination are significant. As we sketched in Figure 1C, depending on the local protein-water fluctuations, the ET dynamics could be faster than the local solvation, as we observed in oxidized flavodoxin, leading to a single-exponential decay behavior with a “frozen” environment and thus a nearly zero of solvent reorganization energy (λ0). When the ET slows down, entering the time region of the local fluctuations, the ET dynamics gradually couple with the protein-water motions, resulting in a non-single-exponential dynamic behavior. The solvent reorganization energy (λ0) seems gradually increased while the ET slows down. When the ET is much slower than the local environment fluctuations, the ET process follows the traditional Marcus theory and the ET dynamics is always in equilibrium with the local protein-solvent configurations. Here, the short-range protein ET is always ultrafast in the crossing time region of the local environment fluctuations and in nonequilibrium. The vibrational ground-state formation during the BET is robust and should be general to any flavin-involved back ET process. More theoritical work is needed for the complete understanding of such ultrafast nonequilibrium dynamics in complex proteins.
EXPERIMENTAL METHODS
The procedures of the expression and purification for Desulfovibrio vulgaris flavodoxin wild type and mutants have been well established.36,37 The 12 mutants (Y98F, Y98A, Y98H, Y98R, Y98W, W60F, W60A, W60Y, D95N, G61A, G61V, W60F/Y98F) were designed and prepared by site-directed mutagenesis following the previous procedures.36 Upon purification, the samples were in oxidized form (FMN) and converted to the neutral radical semiquinone form (FMNH˙) by UV irradiation in anaerobic conditions.38 Due to the change of redox potentials by mutations, the duration of UV irradiation differs for different mutants. For fs-resolved experiments, the protein concentration of ~150 μM was used.
All fs–resolved measurements were carried out using fluorescence upconversion and transient absorption methods. The experimental layout has been described elsewhere.39 Briefly, the pump wavelength was set at 580 nm to avoid excitation of any contamination of oxidized states, if any. The pulse energy was attenuated to 100–150 nJ before being focused onto the sample cell. All samples were maintained under anaerobic conditions to prevent oxidation to quinone forms. For the fluorescence upconversion experiments, the emission was gated by another 800 nm laser beam in a 0.5 mm thick β-barium borate crystal (BBO, type I). The emission was probed at different wavelengths by tuning the mixing crystal angle. For transient-absorption experiments, the probe pulses at the desired wavelengths between 525 and 800 nm were obtained via an optical parametric amplifier (TOPAS, Spectra-Physics). The instrument responses are 300–350 fs and 150–200 fs for the fluorescence and transient absorption detection, respectively. All experiments were conducted at the magic angle (54.7°). To prevent heating and photobleaching, the sample was kept stirring in quartz cells with 1 or 5-mm thickness during laser irradiation. Nonlinear signals at time zero in transient-absorption experiments were subtracted throughout data analyses.
Supplementary Material
ACKNOWLEDGEMENTS
We thank Prof. Richard Swenson (Ohio State University) for the generous gift of the flavodoxin plasmid. We also thank Drs. Chih-Wei Chang, Xunmin Guo, Lijun Guo for their help and discussions. This work was supported in part by the National Science Foundation Grant CHE1412033.
Footnotes
Supporting Information
The Supporting Information is available free of charge on the ACS Publications website at DOI: ….
Data analyses, supporting figures and tables. (PDF)
REFERENCES
- (1).Brixner T; Stenger J; Vaswani HM; Cho M; Blankenship RE; Fleming GR Nature 2005, 434 (7033), 625–628. [DOI] [PubMed] [Google Scholar]
- (2).Sytina OA; Heyes DJ; Hunter CN; Alexandre MT; van Stokkum IHM; van Grondelle R; Groot ML Nature 2008, 456 (7224), 1001–1004. [DOI] [PubMed] [Google Scholar]
- (3).Zhong D Annu. Rev. Phys. Chem 2015, 66, 691–715. [DOI] [PubMed] [Google Scholar]
- (4).Zhang M; Wang L; Zhong D Photochem. Photobiol 2017, 93, 78–92. [DOI] [PMC free article] [PubMed] [Google Scholar]
- (5).Sorigué D; Légeret B; Cuiné S; Blangy S; Moulin S; Billon E; Richaud P; Brugière S; Couté Y; Nurizzo D; Müller P; Brettel K; Pignol D; Arnoux P; Li-Beisson Y; Peltier G; Beisson F Science 2017, 357 (6354), 903–907. [DOI] [PubMed] [Google Scholar]
- (6).Gauden M; van Stokkum IHM; Key JM; Luhrs DC; van Grondelle R; Hegemann P; Kennis JT M. Proc. Natl. Acad. Sci 2006, 103 (29), 10895–10900. [DOI] [PMC free article] [PubMed] [Google Scholar]
- (7).Liu Z; Tan C; Guo X; Kao Y-T; Li J; Wang L; Sancar A; Zhong D Proc. Natl. Acad. Sci. U. S. A 2011, 108 (36), 14831–14836. [DOI] [PMC free article] [PubMed] [Google Scholar]
- (8).Zhang M; Wang L; Shu S; Sancar A; Zhong D Science 2016, 354 (6309), 209–213. [DOI] [PMC free article] [PubMed] [Google Scholar]
- (9).Li J; Liu Z; Tan C; Guo X; Wang L; Sancar A; Zhong D Nature 2010, 466 (7308), 887–890. [DOI] [PMC free article] [PubMed] [Google Scholar]
- (10).Ozturk N; Selby CP; Annayev Y; Zhong D; Sancar A Proc. Natl. Acad. Sci 2011, 108 (2), 516–521. [DOI] [PMC free article] [PubMed] [Google Scholar]
- (11).Liu H; Liu B; Zhao C; Pepper M; Lin C Trends Plant Sci. 2011, 16 (12), 684–691. [DOI] [PMC free article] [PubMed] [Google Scholar]
- (12).Conrad KS; Manahan CC; Crane BR Nat. Chem. Biol 2014, 10 (10), 801–809. [DOI] [PMC free article] [PubMed] [Google Scholar]
- (13).Jung A; Domratcheva T; Tarutina M; Wu Q; Ko W-H; Shoeman RL; Gomelsky M; Gardner KH; Schlichting I Proc. Natl. Acad. Sci. U. S. A 2005, 102 (35), 12350–12355. [DOI] [PMC free article] [PubMed] [Google Scholar]
- (14).Gauden M; Yeremenko S; Laan W; Van Stokkum IHM; Ihalainen JA; Van Grondelle R; Hellingwerf KJ; Kennis JTM Biochemistry 2005, 44 (10), 3653–3662. [DOI] [PubMed] [Google Scholar]
- (15).Möglich A; Yang X; Ayers RA; Moffat K Annu. Rev. Plant Biol 2010, 61 (1), 21–47. [DOI] [PubMed] [Google Scholar]
- (16).Domratcheva T; Udvarhelyi A; Rehaman A; Shahi M Methods Mol. Biol 2014, 1146, 191–228. [DOI] [PubMed] [Google Scholar]
- (17).Tan C; Liu Z; Li J; Guo X; Wang L; Sancar A; Zhong D Nat. Commun 2015, 6, 7302. [DOI] [PubMed] [Google Scholar]
- (18).Migliore A; Polizzi NF; Therien MJ; Beratan DN Chem. Rev 2014, 114 (7), 3381–3465. [DOI] [PMC free article] [PubMed] [Google Scholar]
- (19).Marcus RA; Sutin N BBA Rev. Bioenerg 1985, 811 (3), 265–322. [Google Scholar]
- (20).Marcus RA Rev. Mod. Phys 1993, 65 (3), 599–610. [Google Scholar]
- (21).Page CC; Moser CC; Chen X; Dutton PL Nature 1999, 402 (6757), 47–52. [DOI] [PubMed] [Google Scholar]
- (22).Sumi H; Marcus RA J. Chem. Phys 1986, 84 (9), 4894–4914. [Google Scholar]
- (23).Yartsev A, Nagasawa Y, Douhal A, Yoshihara K Chem. Phys. Letters 1993, 207 (4–6), 546–550. [Google Scholar]
- (24).Weaver MJ Chem. Rev 1992, 92 (3), 463–480. [Google Scholar]
- (25).Barbara PF; Meyer TJ; Ratner MA J. Phys. Chem 1996, 100 (31), 13148–13168. [Google Scholar]
- (26).Wang H; Lin S; Allen JPJ; Williams JJC; Blankert S; Laser C; Woodbury NW Science 2007, 316 (5825), 747–750. [DOI] [PubMed] [Google Scholar]
- (27).He TF; Guo L; Guo X; Chang CW; Wang L; Zhong D Biochemistry 2013, 52 (51), 9120–9128. [DOI] [PMC free article] [PubMed] [Google Scholar]
- (28).Liu Z; Tan C; Guo X; Li J; Wang L; Sancar A; Zhong D Proc. Natl. Acad. Sci. U. S. A 2013, 110 (32), 12966–12971. [DOI] [PMC free article] [PubMed] [Google Scholar]
- (29).Liu Z; Tan C; Guo X; Li J; Wang L; Zhong D J. Phys. Chem. Lett 2014, 5 (5), 820–825. [DOI] [PMC free article] [PubMed] [Google Scholar]
- (30).Sétif P Biochim. Biophys. Acta - Bioenerg 2001, 1507 (1–3), 161–179. [DOI] [PubMed] [Google Scholar]
- (31).Goñi G; Herguedas B; Hervás M; Peregrina JR; De la Rosa MA; Gómez-Moreno C; Navarro JA; Hermoso JA; Martínez-Júlvez M; Medina M Biochim. Biophys. Acta - Bioenerg 2009, 1787 (3), 144–154. [DOI] [PubMed] [Google Scholar]
- (32).Watt W; Tulinsky A; Swenson RP; Watenpaugh KD J. Mol. Biol 1991, 218 (1), 195–208. [DOI] [PubMed] [Google Scholar]
- (33).Zhong D; Zewail AH Proc. Natl. Acad. Sci. U. S. A 2001, 98 (21), 11867–11872. [DOI] [PMC free article] [PubMed] [Google Scholar]
- (34).Chang C-W; He T-F; Guo L; Stevens JA; Li T; Wang L; Zhong D J. Am. Chem. Soc 2010, 132 (36), 12741–12747. [DOI] [PMC free article] [PubMed] [Google Scholar]
- (35).McCarthy AA; Mayhew SG; Walsh MA; Verma CS; O’Connell DP; Reinhold M; Yalloway GN; D’Arcy D; Higgins TM; Voordouw G Biochemistry 2002, 41 (36), 10950–10962. [DOI] [PubMed] [Google Scholar]
- (36).Swenson RP; Krey GD Biochemistry 1994, 33 (28), 8505–8514. [DOI] [PubMed] [Google Scholar]
- (37).Mayhew SG; Massey V J. Biol. Chem 1969, 244 (3), 794–802. [PubMed] [Google Scholar]
- (38).Massey V; Stankovich M; Hemmerich P Biochemistry 1978, 17 (1), 1–8. [DOI] [PubMed] [Google Scholar]
- (39).Saxena C; Sancar A; Zhong D J. Phys. Chem. B 2004, 108 (46), 18026–18033. [Google Scholar]
- (40).Kodali G; Siddiqui SU; Stanley RJ J. Am. Chem. Soc 2009, 131 (13), 4795–4807. [DOI] [PubMed] [Google Scholar]
- (41).Kao YT; Saxena C; He TF; Guo L; Wang L; Sancar A; Zhong D J. Am. Chem. Soc 2008, 130 (39), 13132–13139. [DOI] [PMC free article] [PubMed] [Google Scholar]
- (42).Chang C-W; Guo L; Kao Y-T; Li J; Tan C; Li T; Saxena C; Liu Z; Wang L; Sancar A; Zhong D Proc. Natl. Acad. Sci. U. S. A 2010, 107, 2914–2919. [DOI] [PMC free article] [PubMed] [Google Scholar]
- (43).Kao Y-T; Tan C; Song S-H; Öztürk N; Li J; Wang L; Sancar A; Zhong D. J. Am. Chem. Soc 2008, 130 (24), 7695–7701. [DOI] [PMC free article] [PubMed] [Google Scholar]
- (44).Brettel K; Aubert C; Vos MH; Mathis P; Eker APM Nature 2000, 405 (6786), 586–590. [DOI] [PubMed] [Google Scholar]
- (45).DeFelippis MR; Murthy CP; Broitman F; Weinraub D; Faraggi M; Klapper MH J. Phys. Chem 1991, 95 (8), 3416–3419. [Google Scholar]
- (46).O’Farrell PA; Walsh MA; McCarthy AA; Higgins TM; Voordouw G; Mayhew SG Biochemistry 1998, 37 (23), 8405–8416. [DOI] [PubMed] [Google Scholar]
- (47).Genzor CG; Perales-Alcón A; Sancho J; Romero A Nat. Struct. Mol. Biol 1996, 3 (4), 329–332. [DOI] [PubMed] [Google Scholar]
- (48).Karen A; Sawada MT; Tanaka F; Mataga N Photochem. Photobiol 1987, 45 (1), 49–53. [Google Scholar]
- (49).Kao YT; Saxena C; Wang L; Sancar A; Zhong D Cell Biochem. Biophys 2007, 48 (1), 32–44. [DOI] [PubMed] [Google Scholar]
- (50).Mayhew SG; O’Connell DP; O’Farrell PA; Yalloway GN; Geoghegan SM Biochem. Soc. Trans 1996, 24 (1), 122–127. [DOI] [PubMed] [Google Scholar]
- (51).O’Farrell PA; Walsh MA; McCarthy AA; Higgins TM; Voordouw G; Mayhew SG Biochemistry 1998, 37 (23), 8405–8416. [DOI] [PubMed] [Google Scholar]
- (52).Nag L; Sournia P; Myllykallio H; Liebl U; Vos MH J. Am. Chem. Soc 2017, 139 (33), 11500–11505. [DOI] [PubMed] [Google Scholar]
Associated Data
This section collects any data citations, data availability statements, or supplementary materials included in this article.